

Introduction
The environmental conditions of arid zones, especially the low availability of water, have stimulated plant speciation and the evolution of unusual life forms, and a high proportion of the species of such areas are endemic, particularly in warm deserts (Cowling et al., Reference Cowling, Esler and Rundel1999; Burke, Reference Burke2004; Riemann & Ezcurra, Reference Riemann and Ezcurra2005). Endemic species have a high conservation priority because they are exclusive to a region and are often geographically restricted and ecologically infrequent. Plant communities in some desert areas are thus irreplaceable (Pressey, Reference Pressey1999).
An example of such an area is the Chihuahuan Desert. With an estimated 3,500 plant species (Henrickson & Johnston, Reference Henrickson and Johnston2004) and a high degree of plant and animal endemism (Johnston, Reference Johnston, Wauer and Riskind1977; Minckley, Reference Minckley, Wauer and Riskind1977; Pinkava, Reference Pinkava1984), the region is one of the most diverse deserts. The Cactaceae is the most emblematic plant group of this region (Hernández & Gómez-Hinostrosa, Reference Hernández, Gómez-Hinostrosa, Cartron, Ceballos and Felger2005) and some areas within it have the highest number, globally, of cactus species per unit area (Hernández et al., Reference Hernández, Gómez-Hinostrosa and Bárcenas2001). The region has a total of 329 native cactus species in 39 genera, with 43 and 70% generic and species endemism, respectively (Hernández et al., Reference Hernández, Gómez-Hinostrosa and Goettsch2004).
The Cactaceae is a highly threatened plant family and the IUCN Global Cactus Assessment (2010), currently in progress, is confirming that c. 33% of the species are threatened. The principal factor affecting the conservation status of Mexican cacti is habitat deterioration as the result of a diversity of factors, including agricultural development, goat husbandry, mining and road construction. However, the collection of individual plants for ornamentals, which affects the rarest and most threatened species, is also a major threat (Hernández & Gómez-Hinostrosa, Reference Hernández, Gómez-Hinostrosa, Cartron, Ceballos and Felger2005). Although Mexican law prohibits collection of threatened species of flora and fauna, there is evidence that cactus plants and seeds are still being collected illegally (Robbins & Bárcenas, Reference Robbins and Bárcenas2003).
Protected areas are considered the most effective instrument for in situ biodiversity conservation, with > 100,000 such areas worldwide covering > 12% of the Earth’s land surface (Chape et al., Reference Chape, Spalding and Jenkins2008). However, protected areas do not always achieve their objective of protecting biodiversity. Many are not enforced and/or are not effectively managed, and are affected by poaching, habitat loss and fragmentation. Frequently they are inadequately designed and do not coincide with high priorities such as areas of high habitat diversity, species richness and/or endemism (Margules & Pressey, Reference Margules and Pressey2000; Ervin, Reference Ervin2003; Rodrigues et al., Reference Rodrigues, Andelman, Bakarr, Boitani, Brooks and Cowling2004).
Here we use the endemic Cactaceae of the Chihuahuan Desert as biodiversity surrogates. We analysed the species’ distributions to answer four questions regarding the effectiveness of the region’s protected areas: (1) What is the degree of coincidence between the richest areas of endemism and protected areas? (2) What percentage of the species and their populations are in protected areas? (3) What is the relative importance of each of the protected areas for conserving these species? (4) Where are the major gaps in the conservation of these species?
Study area
The c. 533,600 km2 (Hernández et al., Reference Hernández, Gómez-Hinostrosa and Hoffmann2010) Chihuahuan Desert is the largest area containing xeric ecosystems in North America. The region extends from the central Mexico states of Guanajuato, Querétaro and Hidalgo to southern Texas, New Mexico, and a small part of Arizona, and is bordered by the Sierra Madre Occidental and the Sierra Madre Oriental (Fig. 1a). The ecological and climatic characteristics of this region have been described elsewhere (Shreve, Reference Shreve1942; Johnston, Reference Johnston, Wauer and Riskind1977; Schmidt, Reference Schmidt1979; Medellín-Leal, Reference Medellín-Leal and Bender1982; Henrickson & Johnston, Reference Henrickson, Johnston, Barlow, Powell and Timmermann1986; Hernández & Gómez-Hinostrosa, Reference Hernández, Gómez-Hinostrosa, Cartron, Ceballos and Felger2005; Hernández, Reference Hernández2006). Thirty-two protected areas cover c. 37,547 km2 of this desert (7% of the total area; Fig. 1a, Table 1).
(a) The 32 protected areas in the Chihuahuan Desert (area shaded light grey); the numbering is approximately north–south (see Table 1 for the names of the areas). (b) Distribution of endemic cactus species in the Chihuahuan Desert; each dot represents the locality of one to several species.
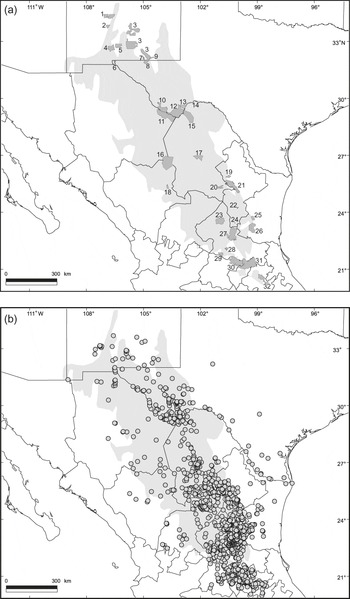
The 32 protected areas in the Chihuahuan Desert (CONANP, 2008; WDPA, 2008; see numbered locations in Fig. 1a).

* APFF, Area of Protection of Flora and Fauna; BR, Biosphere Reserve; EC, Experimental Camp; NF, National Forest; NM, National Monument; NP, National Park; NWR, National Wildlife Refuge; NSS, Natural Sacred Site; NSR, Natural Scenic River; SP, State Park; SZEC, Special Zone under Ecological Conservation; WMA, Wildlife Management Area; WSA, Wildlife Study Area; ZPF, Zone of Forest Protection
Methods
We regarded as endemic those cactus species essentially restricted to the Chihuahuan Desert as delineated by Hernández & Gómez-Hinostrosa (Reference Hernández, Gómez-Hinostrosa, Cartron, Ceballos and Felger2005). A total of 229 cactus species endemic to this region have been recorded (Hernández et al., Reference Hernández, Gómez-Hinostrosa and Goettsch2004). From these we selected a subset of 121 species (Appendix) that are well studied taxonomically and for which the geographical distributions are well documented. The ranges of most of these species are strictly restricted to the Chihuahuan Desert (Hernández & Gómez-Hinostrosa, Reference Hernández, Gómez-Hinostrosa, Cartron, Ceballos and Felger2005). However, we also included a few species whose geographical range is centred in the region but that also have a small part (≤ 5%) of their populations outside the region (Fig. 1b). We follow Hunt’s (Reference Hunt2006) taxonomic nomenclature.
We used 3,786 geo-referenced records from a database of cactus collections for North and Central America developed by HMH and collaborators. The database is a compilation of specimen data of Cactaceae from 35 herbaria in Mexico and several other countries. The number of specimen records per species is 1–219 (Appendix).
To identify areas of endemism we overlaid the records of the 121 species on a map with a 30′ latitude × 30′ longitude grid and ranked the grid squares according to their respective number of species. Areas with ≥ 22 species were further analysed at a scale of 6′× 6′. To compare the geographical configuration of the areas of endemism with that of the protected areas, the percentage of the areas of endemism overlapping with protected areas was calculated.
We assessed the efficacy of the protected areas in protecting individual cactus species by overlaying the geo-referenced records on the map of protected areas (Fig. 1). We estimated the degree of protection afforded individual species by calculating the percentage of known localities of each species situated within one or more protected areas. The number of known localities per species was taken from Hernández et al. (Reference Hernández, Gómez-Hinostrosa and Hoffmann2010). Following Hernández et al. (Reference Hernández, Gómez-Hinostrosa and Hoffmann2010) a locality is defined here as a point displayed on a map that is separated from its nearest neighbour by at least 797.9 m, the radius of a 2-km2 circle. Points located within this radius were considered part of the same locality.
Protected area shape files were obtained from CONANP (2008), Bezaury-Creel et al. (Reference Bezaury-Creel, Ochoa and Torres2007) and WDPA (2008). For spatial analyses we used ArcView v. 3.2 (ESRI, Redlands, USA).
The complementarity principle has been used to select minimal sets of areas that are complementary in terms of the features of a region, with the aim of maximizing the chances of achieving representative networks of reserves (Humphries et al., Reference Humphries, Vane-Wright and Williams1991; Vane-Wright et al., Reference Vane-Wright, Humphries and Williams1991). The first step is to select a priority choice, which corresponds to the area containing the highest number of species. From this, the remaining areas are ordered according to their contribution of additional species not found in the areas of higher priority. The Real de Guadalcázar State Park was the first priority, and the 31 other protected areas were prioritized according to their complementarity values. The complementarity value was calculated for each protected area as (AS × 100)/RC, where AS is number of unique, additional species not found in the first priority area or in higher priority areas, and RC is the residual complement, calculated as the difference of the complement (the total number of species considered that occur in protected areas; 77 spp.) and the number of species in the first priority area (37 spp.). In addition to the complementarity analysis of the 77 species occurring within protected areas we determined the near minimum area set for the 44 species that occur outside the 32 protected areas using the 30′ × 30′ grid squares as the units of analysis.
Results
Fig. 2a shows the pattern of species richness at a resolution of 30′ × 30′. The number of endemic cactus species per grid square was 1–36. We categorized the grid squares according to the number of endemic species present: rank I (29–36), rank II (22–28), rank III (15–21), rank IV (8–14), and rank V (1–7). There are two general areas of endemism of ranks I and II in the south-east (Fig. 2a). There are two grid squares of rank I, the cactus flora of which was recently described (Hernández et al., Reference Hernández, Gómez-Hinostrosa and Bárcenas2001; Gómez-Hinostrosa & Hernández, Reference Gómez-Hinostrosa and Hernández2000): the Huizache and Mier y Noriega grid squares, with 36 and 32 species respectively. Fig. 2b shows the spatial pattern of the rank I and II areas at a finer scale (6′ × 6′). The richest areas lie mainly towards the west of the rank I area.
(a) Pattern of species richness of endemic cacti in the Chihuahuan Desert at a scale of 30′ latitude × 30′ longitude. Grid squares are ranked according to their respective number of species: rank I = 29–36 spp., rank II = 22–28 spp., rank III = 15–21 spp., rank IV = 8–14 spp., rank V = 1–7 spp. (b) Detail of pattern of species richness in the rank I (left pair of 30′ × 30′ grid squares) and rank II (right pair of 30′ × 30′ grid squares) areas of endemism (delimited by thicker line) at a scale of 6′ × 6′. State abbreviations: NL, Nuevo León; SLP, San Luis Potosí; TAMPS, Tamaulipas; ZAC, Zacatecas.
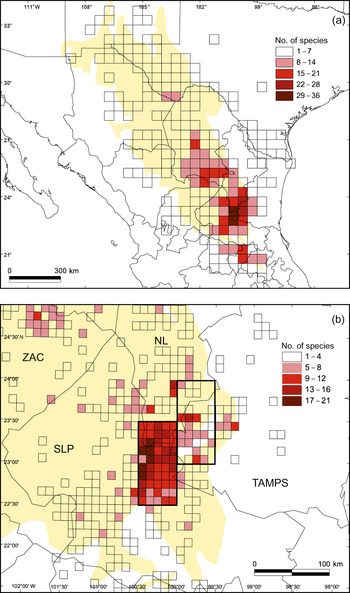
The two grid squares of rank II (Miquihuana and Tula with 27 and 22 species, respectively) lie to the north-east and east of the Mier y Noriega grid square (Fig. 2a). Around the rank I and II areas there is a group of rank III grid squares, some of which are contiguous with the rank I and II squares of endemism, although others are further away, in the Queretaroan arid zone, along the Sierra de Parras, in southern Coahuila and Cuatro Ciénegas.
The two rank I grid squares have a total surface area of 5,674 km2, 41.1% (2,334 km2) of which overlaps with the Real de Guadalcázar and San Elías protected areas (Table 2). The two rank II squares are totally unprotected. Table 2 summarizes the degree of protection of the different areas at a scale of 30′ × 30′.
Degree of protection of different areas of cactus endemism at a scale of 30′ latitude × 30′ longitude. Ranks were defined according to the number of species found per grid square: rank I (29–36 spp.), rank II (22–28 spp.), rank III (15–21 spp.), rank IV (8–14 spp.) and rank V (1–7 spp.).
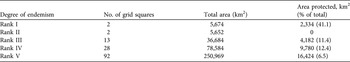
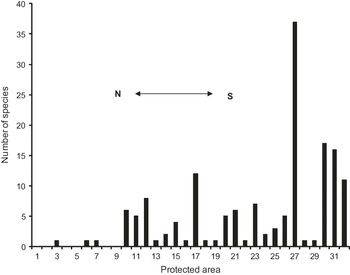
Fig. 3 shows the number of species in each of the numbered protected areas. Four areas (Real de Guadalcázar, 37 species; Sierra Gorda de Guanajuato, 17; Sierra Gorda, 16; Cuatro Ciénegas, 12) protect, at least in theory, 65 species; i.e. 84.4% of the species occurring in the protected areas and 53.7% of the species in our sample of 121 species. Sixteen of the areas protect 0–1 species in our sample; these areas are mostly located in the north of the region (Figs 1a & 3).
Overall 892 localities (24% of the 3,786 geo-referenced localities) lie within protected areas. For each species the Appendix provides the percentage of localities occurring in protected areas of the total number of localities known (Hernández et al., Reference Hernández, Gómez-Hinostrosa and Hoffmann2010). Only nine species (7.4%) are fully protected (i.e. 100% of localities in protected areas) and 50% or less of the number of localities of 59 species (48.8%) are protected.
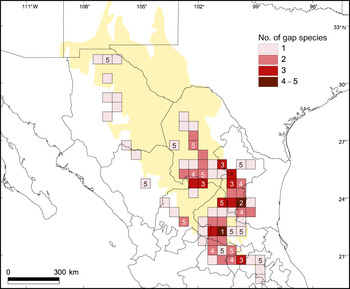
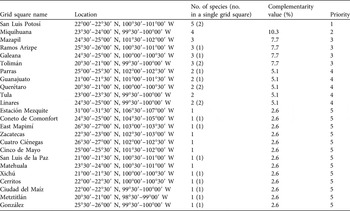
The complementarity analysis (Table 3) shows that 10 of the 32 reserves together shelter all 77 species, of our subset of 121 species, that occur in protected areas; this is the optimal solution for the conservation of these species. The four top priority areas protect 65 (84.4%) of the species. The complementarity analysis applied to the areas occupied by the 44 species occurring exclusively outside protected areas shows that of the 73 grid squares (a total area of 208,000 km2) in which these species occur, a minimum of 24 (32.9% of the squares) are necessary to contain all of the species. None of the grid squares contain high numbers of these 44 species, and the difference in number of unique species between the first priority area (5 species) and fifth priority area (1) is small (Table 4, Fig. 4).
Density map of unprotected species per half-degree cell. The numbers within some of the grid squares indicate the priority levels based on the results of the complementarity analysis (Table 4).
Results of the complementarity analysis of the 32 protected areas of the Chihuahuan Desert, considering the 77 cactus species that occur in these protected areas (Fig. 1a).

Results of the complementarity analysis of the 30′ latitude × 30′ longitude grid squares containing the 44 cactus species that do not occur in protected areas (Fig. 1a). Grid squares are named according to the largest city or town.
Discussion
Although the protected areas of the Chihuahuan Desert cover 7% of the region’s area there is a low degree of coincidence with the richest areas of cactus endemism (Table 2). With the exception of the rank I areas of endemism, 41.1% of which are protected by the Real de Guadalcázar State Park and another, smaller protected area, the protection of areas of cactus endemism is low or non-existent. With respect to the protection of individual species, almost two thirds (77 species) are protected but 44, including several of the rarest endemic species, are unprotected. It is not only species of cacti that are endemic to the Chihuahuan Desert. Approximately one-third of the region’s plant species are endemic (Johnston, Reference Johnston, Wauer and Riskind1977) and there are also high levels of endemism amongst reptiles and freshwater fish (Miller, Reference Miller, Wauer and Riskind1977; Minckley, Reference Minckley, Wauer and Riskind1977; Morafka, Reference Morafka1977).
The protected areas of Real de Guadalcázar, Sierra Gorda de Guanajuato, Cuatro Ciénegas and Sierra Gorda are particularly important because of the number of species they protect and for their high complementarity. The 2,570 km2 Real de Guadalcázar State Park was gazetted to protect the habitat of the 76 cactus species in the area. The Park is the richest centre of cactus diversity globally (Hernández et al., Reference Hernández, Gómez-Hinostrosa and Bárcenas2001), and has the richest number of threatened (Hernández & Bárcenas, Reference Hernández and Bárcenas1995) and endemic cactus species. However, although the Park was gazetted in 1997 several portions of the reserve are under severe pressure. In an assessment of the effectiveness of federal protected areas in Mexico Figueroa & Sánchez-Cordero (Reference Figueroa and Sánchez-Cordero2008) found that two protected areas important for the conservation of Chihuahuan Desert Cactaceae, Cuatro Ciénegas and Sierra Gorda, were ‘weakly effective’ and ‘non-effective’ respectively, because of high rates of land use and land cover change. The Real de Guadalcázar and Sierra Gorda de Guanajuato were not included in the study because the former is a state reserve under the jurisdiction of the government of San Luis Potosí and the latter was decreed only in 2008.
The 44 cactus species that do not lie within any protected area are some of the most taxonomically distinctive taxa of Mexican Cactaceae: the monotypic genus Geohintonia (G. mexicana), the two members each of the genera Aztekium (A. hintonii and A. ritteri) and Pelecyphora (P. aselliformis and P. strobiliformis), and one species of Acharagma (A. aguirreanum), all genera endemic to the Chihuahuan Desert. This group also includes several species belonging to other genera endemic to the Chihuahuan Desert (Ariocarpus, Thelocactus and Turbinicarpus).
The most critical of these species are the 20 that occur in only a single 30′ × 30′ square (Table 4). Sixteen of the 24 grid squares prioritized by the complementarity analysis contain 1–2 of these narrow endemics. Narrow endemism is a prominent phenomenon amongst Mexican Cactaceae, and many of these microendemics have extremely small distribution ranges. For example, Mammillaria humboldtii, Mammillaria schwarzii, Opuntia chaffeyi, Thelocactus hastifer, Turbinicarpus ysabelae and Turbinicarpus zaragozae occur in areas of < 6 km2 (Hernández et al., Reference Hernández, Gómez-Hinostrosa and Hoffmann2010). The microendemic nature of these species, along with their high taxonomic distinctiveness, is a clear reflection of the high conservation value and high degree of irreplaceability of the areas inhabited by them (May, Reference May1990; Vane-Wright et al., Reference Vane-Wright, Humphries and Williams1991; Pressey, Reference Pressey1999).
The simplest solution to protect the 44 unprotected species would be the creation of additional reserves. The optimal size for any such reserves is, however, difficult to resolve (Primack, Reference Primack2006; Hunter & Gibbs, Reference Hunter and Gibbs2007, and references therein). In practice, reserve size should be determined following a consideration of the complex combination of biological, political and economic factors that make every situation unique (Hunter & Gibbs, Reference Hunter and Gibbs2007). A large number of reserves would be required to protect the 44 species and extremely small reserves may have several disadvantages: they may not be adequate to support long-term populations and ecosystem processes, they usually cover a narrower range of environmental conditions, and reserves of < 100 ha may not be sufficiently large to encompass the diversity of a region, especially considering that parts of the Chihuahuan Desert have high beta diversity (Goettsch & Hernández, Reference Goettsch and Hernández2006; Hernández et al., Reference Hernández, Goettsch, Gómez-Hinostrosa and Arita2008).
Nevertheless, despite these and other considerations, several examples demonstrate the practical value, as well as the ecological and genetic viability, of small protected areas for plants (Lesica & Allendorf, Reference Lesica and Allendorf1992; Cowling et al., Reference Cowling, Pressey, Rouget and Lombard2003). In the Valencian region of Spain a network of micro-reserves of 2–20 ha, established since 1994, has proved highly effective for protecting elements of the region’s flora (Laguna et al., Reference Laguna, Deltoro, Pèrez-Botella, Pèrez-Rovira, Serra, Olivares and Fabregat2004; Laguna, Reference Laguna and Grisolía2008). The legal framework confers upon these micro-reserves ‘permanent status and provides strong protection to plants and substrates while allowing traditional activities compatible with plant conservation’ (Laguna et al., Reference Laguna, Deltoro, Pèrez-Botella, Pèrez-Rovira, Serra, Olivares and Fabregat2004). Similar networks have been successfully implemented in Eastern Europe and the Mediterranean region (Laguna et al., Reference Laguna, Deltoro, Serra and Pérez-Rovira2006; Laguna, Reference Laguna and Grisolía2008), and small-scale conservation approaches have also been used in the Cape Floristic Region of South Africa (Tansley, Reference Tansley1988; Cowling et al., Reference Cowling, Pressey, Rouget and Lombard2003).
Another approach relevant in the context of micro-reserve networks is the Alliance for Zero Extinction (AZE). This joint initiative of 52 biodiversity conservation organizations, which is targeted at geographically restricted and highly threatened species, identifies and safeguards sites in most urgent need of conservation (Ricketts et al., Reference Ricketts, Dinerstein, Boucher, Brooks, Butchart and Hoffmann2005). We estimate that c. 40 cactus species endemic to the Chihuahuan Desert meet the criteria to be regarded as AZE species.
To protect the endemic flora of the Chihuahuan Desert we believe that a small-scale approach to in situ conservation is necessary as a complement to the large, established protected areas. Such small reserves should not be conceived as an alternative to large protected areas but rather both should be perceived as complementary approaches to biodiversity conservation (Tansley, Reference Tansley1988; Cowling et al., Reference Cowling, Pressey, Rouget and Lombard2003; Laguna et al., Reference Laguna, Deltoro, Pèrez-Botella, Pèrez-Rovira, Serra, Olivares and Fabregat2004).
The 7% of the Chihuahuan Desert under legal protection is less than the minimum 10% recommended by international organizations (SCBD, 2002, 2004) and less than the 12% of the warm desert areas protected globally (Chape et al., Reference Chape, Harrison, Spalding and Lysenko2005). To improve the conservation of the Chihuahuan Desert Cactaceae several actions are required: increase the effectiveness of the protected areas, especially those with numerous, unique, taxonomically distinctive species, and create a network of micro-reserves to protect the habitat of the highest possible number of unprotected and threatened species.
Acknowledgements
We thank Fernando Chiang and two anonymous reviewers for constructive criticisms, Julio César Montero for technical advice in the preparation of the figures, Teresa Terrazas for providing locality data and María Eugenia Correa for GIS advice. Fieldwork was carried out under collecting permits FLOR-0004 and FLOR-0094, provided by Secretaría del Medio Ambiente y Recursos Naturales, Mexico.
Appendix
The appendix for this article is available online at http://journals.cambridge.org
Biographical sketches
Héctor M. Hernández studies the systematics and biogeography of Mexican Cactaceae, primarily in the Chihuahuan Desert, with the aim of developing tools for their conservation. He is also chairman of the IUCN Cactus and Succulent Plant Specialist Group. Carlos Gómez-Hinostrosa has extensive experience of the taxonomy of the Mexican Cactaceae and is a member of the IUCN Cactus and Succulent Plant Specialist Group.


