


1. Introduction
In the early design phases of engineering products, critical decisions for the whole product’s lifecycle are made, largely determining the final costs (Ehrlenspiel Reference Ehrlenspiel1995). Usually when ideating in these early phases, the first preliminary designs are done with freehand sketching on paper (VDI 2004). It is the most ubiquitous accessible, flexible and a trusted tool for capturing and communicating geometric ideas (Schütze, Sachse & Römer Reference Schütze, Sachse and Römer2003). However, freehand sketching also has serious disadvantages in the modern engineering design context. It is a difficult task that takes lots of time to master since the three-dimensional ideas have to be transformed into a two-dimensional representation. This difference in dimensionality can additionally cause misunderstandings when using sketches to communicate ideas to others. Furthermore, the subsequent product design process is nowadays entirely digital. This leaves a gap in the process between early sketches on paper and later computer-aided design (CAD) models (Vajna et al. Reference Vajna, Weber, Zeman, Hehenberger, Gerhard and Wartzack2018).
A well-working digital tool for three-dimensional ideation in preliminary design is desirable to support the designers and move this step into the digital domain as well. Creating digital 3D data directly avoids changes from 2D to 3D and from paper to digital, accelerating product development and reducing the risk of misinterpretation and errors.
Unfortunately, CAD programs used in the later detailed engineering design steps, are inadequate for this geometrical ideation of a product model. They require a clear idea of the final geometry and are inflexible to fundamental changes (VDI 2004). Furthermore, using a 2D interface for 3D content can create an additional mental load. Direct modeling, a simpler modeling paradigm offered by some CAD tools, makes basic modeling more straightforward (Vajna et al. Reference Vajna, Weber, Zeman, Hehenberger, Gerhard and Wartzack2018) but also cannot overcome the dimensionality gap.
One technology that offers the potential for efficient and intuitive 3D modeling is virtual reality (VR), with its nowadays affordable three-dimensional input and output capabilities (Coburn, Freeman & Salmon Reference Coburn, Freeman and Salmon2017). Viewing and working directly in three dimensions reduces the mental load of the designers to understand complex product geometry (Horvat et al. Reference Horvat, Škec, Martinec, Lukačević and Perišić2019). Moreover, VR approaches allow for fast interactions with the necessary vagueness for early design which can foster a more creative concept generation (Liao & She Reference Liao and She2023). Thus, lots of research has been done on using VR technology for preliminary design, which explored different paradigms for immersive geometry creation and representation.
Immersive line sketches are a widespread variant. Where, strokes are drawn like a pen on paper but directly mid-air, creating 3D lines. They allow for quick form finding (Goethem et al. Reference Goethem, Verlinden, Watts and Verwulgen2021) and an extension of the solution space (Yang & Lee Reference Yang and Lee2020) in free-form design tasks. An extension to this is the intuitive creation and modification of parametric curves and surfaces (Lee et al. Reference Lee, Jin, Lee and Bae2022).
However, for engineering problems, this line-based modeling is less beneficial. They are not directly compatible with CAD and don’t represent engineering products well, which mostly consist of simple volumetric shapes (Samuel, Requicha & Elkind Reference Samuel, Requicha and Elkind1976). For these, primitive-based VR modeling has been proposed. Here, the designer creates bodies from simple shapes, such as cuboids and cylinders, dimensions them as required and combines them into larger models. Feeman, Wright & Salmon (Reference Feeman, Wright and Salmon2018) empirically compared such an interface with a typical CAD one in open modeling tasks. The users created more geometric features with the motion controller-based immersive interface in the same time frame and subsequently judges ranked the VR designs more creative. A way to further increase the intuitiveness of the VR interface is to employ natural interactions, which replicate or utilize real interactions for an intuitive and effective manipulation (Cordeiro et al. Reference Cordeiro, Giannini, Monti, Mendes and Ferreira2018). Fechter, Schleich & Wartzack (Reference Fechter, Schleich and Wartzack2020) created such a VR modeling interface based on natural interactions using hand and finger tracking. Later they published a user study, comparing their interface to direct-modeling CAD in a replication task (Fechter Reference Fechter2021). In VR, the users recreated the specified design faster and rated the VR interfaces’ usability higher.
It is certainly useful to show that VR modeling is better suited for preliminary design than CAD software. However, to evaluate the potential of a new modality to replace or complement the current one, it has to be compared with that one as a reference, in this case, freehand sketching. Yet, only a few researchers directly compared the capabilities of VR modeling with freehand sketching. Oti & Crilly (Reference Oti and Crilly2021) compared immersive line sketches against paper-based sketching and found that it is beneficial, as it simultaneously supports behaviors of freehand sketching, CAD modeling and physical model making. Furthermore, Seybold & Mantwill (Reference Seybold and Mantwill2021) conducted a user study where participants created and changed the conceptual design of test benches using a feature-rich VR modeling tool. They compared the VR designs with a single on-paper sketch created by an industry expert and found that VR sketches of comparable quality could be created much faster. To this point, an empirical comparison of freehand sketching and natural primitive-based VR modeling for engineering design tasks with a consistent user group is missing.
In summary, by using natural interfaces for intuitive and effective interaction, and primitive-based modeling for engineering and CAD compatibility, natural VR modeling has the potential to be a viable modern alternative for preliminary design, possibly leading to more creative solutions. Therefore, this research proposes a natural VR modeling method for preliminary design and its main contribution is to compare it with freehand sketching in an extensive empirical user study.
2. Aims and methodology
Based on the presented research into immersive early design interfaces and virtual reality technology, this paper aims to answer the following research question: Is natural VR modeling an effective alternative to freehand sketching for preliminary design?
The research methodology answering this question must be an empirical one, as the impact of human-used design tools, such as natural VR modeling, cannot be measured directly. Therefore, a research procedure that empirically compares the novel method with freehand sketching was chosen and is also represented by the structure of the paper. It is described in the following paragraph. The procedure gives insights into the user experience of VR modeling, which is critical for the acceptance of novel modalities. It also evaluates whether the created designs are suitable for further utilization in the design process.
First, Section 2.1 formulates four hypotheses about natural VR modeling in accordance with the research question. To test these, the proposed method’s necessary interactions are conceptually designed and consequently implemented into an interface prototype, which is described in Section 3. A two-stage user study then compares the VR modeling prototype with freehand sketching. Section 4 presents the design of the study. The measured results, presented in Section 5, include the user experience and preferences reported by the participants as well as an assessment of the quality of the created designs by a jury of experts. In the discussion, the results are used to confirm or refute the stated hypotheses (Section 6). From these, conclusions about the research question are drawn in the final Section 7 and a brief outlook is given.
2.1. Hypotheses
Four hypotheses are stated, each focusing on a different aspect related to the research question. The first hypothesis tests basic functionality, the second the user experience, the third the designs created, and the fourth specifically the impact on design creativity. The subsequent paragraphs describe how the latent variables of the hypotheses are operationalized.
Hypothesis 1 Natural VR modeling allows users to create digital preliminary designs of their ideas, suitable for further processing.
The first hypothesis addresses the baseline functionality that the novel preliminary design tool should achieve. To confirm this, the prototype must have the technical capability to create CAD-compatible geometry from the user’s hand-tracking input. Furthermore, the interface must enable users to create readable 3D models of their design intents. Readability is assessed by the ability of the authors and jury members to recognize what the user-designed and how it is supposed to function.
Hypothesis 2 The user-experience of natural VR modeling causes users to prefer it over freehand sketching for preliminary designs of their ideas.
The VR interface’s user experience needs to be superior to freehand sketching for it to be preferable. For this, the VR modeling interface must score accordingly in the USE and preference questionnaires.
Hypothesis 3 The preliminary designs created by VR modeling are at least of the same quality as those created by freehand sketching.
For a novel preliminary design method to be applicable, the created designs have at least to be of equal quality. For this, an evaluation by a jury will be conducted providing an informed assessment of the designs’ functionality, creativity, understandability, and aesthetics. Here, VR modeling needs to score at least as well as the traditional method.
Hypothesis 4 Natural VR modeling leads to more creative novel solutions than freehand sketching.
To evaluate this hypothesis, specific data from both the user experience and the designs created are considered. From the user’s perspective, the creativity-related questions from the questionnaires need to score better for VR modeling. For the models created, only one of the two tasks included in the user study is considered, as this was the only task for which users were encouraged to come up with a creative solution. For these designs, the jury’s assessment of the creativity of the VR modeling designs should be higher.
3. Immersive and natural modeling method for preliminary design
The following section describes the natural VR modeling method first theoretically, followed by the implementation of an interface prototype. Previous insights from Fechter et al. (Reference Fechter, Schleich and Wartzack2020) and Harlan, Schleich & Wartzack (Reference Harlan, Schleich and Wartzack2021b) were starting points for the development.
3.1. Interaction design
The VR modeling method places the users in a virtual room with a wireframe table that acts as the reference origin of the modeling space. To control the interface, two main interaction paradigms are employed: Natural hand-based interactions and a simple button-based menu. The natural interactions are used for the most common three-dimensional tasks, such as geometry creation and manipulation. These allow users to perform operations directly and intuitively. The menu is used for less frequent and non-spatial operations and settings. It is attached to the non-dominant hand and opens by looking into its palm. The contained buttons are then operated with the index finger of the other hand.
Three basic natural gestures are used throughout the method for different tasks, see Figure 1. The first is a heuristic grasp that allows natural manipulation of the position of a virtual object. Secondly, a pinching gesture is used, which is triggered by touching the tips of the index finger and the thumb while the other fingers remain outstretched. The position between the touching fingers is the pinch position. This interaction allows both precise timing and positioning of the manipulation. The final interaction is a simple finger tap. An extended index finger with the other fingers curled up is used to touch and select objects and menu items. In the following, the different modeling functionalities are described.
The three basic natural gestures utilized in the immersive modeling method.

Creating primitives: Finding natural gestures to create geometry from nothing is difficult, as there is no corresponding action in reality. Nevertheless, an intuitive and fast interaction has been adapted from the one presented by Fechter et al. (Reference Fechter, Schleich and Wartzack2020). Figure 2 shows this procedure to create a new body. First, the pinch gesture is performed with both hands to initiate the primitive shape selection. Approaching the desired shape with both pinch positions selects it for creation. The pinch gestures can now be moved freely to create the required size and position. A world axis-aligned bounding box is displayed between the two pinch gestures and defines the dimensions of the body, of which a preview is shown as well. Spheres, for example, are created at the center of the box, with their diameter set to its smallest extension. Releasing the pinches creates the body as shown.
Interaction sequence to create a primitive body. From left to right, a pinching gesture with both hands shows the shape options, moving towards a shape selects it, and it can then be positioned and dimensioned as desired.

Relocating bodies: Naturally grasping the bodies allows the user to move and place a body intuitively (Borst & Indugula Reference Borst and Indugula2005). Triggered by opposing fingertips touching the same object, its transformation is coupled to the transformation of the hand. The object follows the hand until releasing finger movements are detected. For more precise control, a pinch interaction locks the rotation and allows the position to be changed. Furthermore, an object can be selected and manipulated with a Smart-Pin interaction (Caputo, Emporio & Giachetti Reference Caputo, Emporio and Giachetti2017) which splits the transformation into fewer degrees of freedom (DOF) to allow very small adjustments.
Modifying bodies: Different types of modifications can be preselected via the hand menu and applied to a body through a single tap of the index finger. Bodies can be copied, colored and combined using Boolean operations, see Figure 4 in the next chapter.
Adjusting user perspective: Head tracking allows the user to move around and change their perspective naturally. If this is not enough or too cumbersome, the user can also change the placement and scale of the entire workspace with a bi-manual gesture. Grabbing with both hands in mid-air allows control of the model’s position along the three translational degrees of freedom, the global scale and the rotation around the vertical axis. This can be used to gain an overview or to work on smaller details. The model’s upward direction is locked to the world’s upward axis for ease of use. However, the chosen interaction supports controlling more rotational degrees of freedom.
Grid support: By default, the modeling method has grid support activated to help the user align multiple objects. Similar supports are presented by Kiyokawa et al. (Reference Kiyokawa, Takemura, Katayama, Iwasa and Yokoya1996) and Bier (Reference Bier1990). With this, the bodies can only be created in quantized size steps. Additionally, imitating toy building blocks, the bodies snap to others using connector points that are distributed across the bodies’ surfaces, as can be seen in Figure 4, right. For this, when grasping an object, an algorithm first looks for nearby bodies and then for corresponding connector points on those. If suitable pairs are found, a transformation is calculated to align them and a preview of the connected bodies is shown. Releasing the grasp in this situation applies to the proposed transformation. This grid support can be deactivated in the menu.
3.2. Interface prototype
The interface prototype is based on a software framework linking a game engine (Unreal Engine) to commercial CAD software (Siemens NX) (Harlan, Schleich & Wartzack Reference Harlan, Schleich and Wartzack2020). Figure 3 is a simplified illustration of the Model-View-Controller software architecture.
Simplified Model-View-Controller architecture of the developed immersive modeling interface prototype.

The model component manages triangulated copies of the CAD bodies via the program scripting API, utilizing the CAD software for all geometry operations as well as for persistence in a commercial file format (.prt). The view component is provided by the game engine through its scene graph and rendering features. By using an engine, the interface prototype supports many output devices allowing flexible deployment. The controller component handles all user interactions and issues the resulting operations via the model component. Here, a state machine is employed to direct the control flow, using the hand-tracking input data and collisions with the scene graph. Figure 4 shows the user’s point of view in the developed interface prototype in different situations.
Interface prototype of the natural VR modeling: (left) Provided workspace and reference model; (center) Hand menu showing the different Boolean operations; (right) Moving a created primitive with the connection points for the grid support visible.

4. User study
To confirm or reject the hypotheses, a two-stage empirical study was designed, referencing a previously published guide for user studies on immersive interfaces in engineering design (Harlan, Schleich & Wartzack Reference Harlan, Schleich and Wartzack2021a). Additionally, the findings from Üreten et al. (Reference Üreten, Eisenmann, Nelius, Garrelts, Krause and Matthiesen2020) gave useful guidance, identifying the challenges of empirical design studies and helping to overcome them with best practices. In the first stage, two preliminary design interfaces (modalities) are tested against each other in a within-subjects study. The VR modeling prototype described above is compared to freehand sketching. To avoid learning effects, the participants completed two different design tasks, each using one of the modalities. Both the order of modalities and the assignment of tasks to modalities were permuted. This results in four unique study sequences that were carried out in a balanced manner. The study is designed to include 20 participants, yields 20 design sketches on paper and 20 3D models created through VR modeling. Furthermore, the even split between the design tasks leads to 10 designs for each combination of task and modality. In the second stage, a panel of experts evaluated the created preliminary designs of both modalities, to obtain an understanding of their qualities. Both stages were tested in pre-studies to make sure everything worked correctly. Figure 5 shows an overview of this study design and the following sections describe each aspect in more detail.
Design overview of the two-stage user study.

4.1. Modalities
For VR modeling, the interface prototype described above was used. The prototype allowed for cuboids, spheres, cylinders, and cuboids with a fixed cross-section to be created with natural interactions as described in Section 3.1. A HTC Vive Pro HMD with a front-mounted Leap Motion Controller was used. The application ran on a workstation PC with an Intel Xeon E3-1220, an Nvidia Quadro P4000 and 16 GB of memory. Participants were given ten minutes to familiarize themselves with the VR interface. During this time, an in-application tutorial was provided, showing videos of the modeling interactions and all open questions were answered. Only after a verbal confirmation from the participant that they felt comfortable with all functions the actual study task was started. For freehand sketching, a pencil, paper and an eraser were provided to create the design. Besides the sketch being perspective, there were no further restrictions.
4.2. Design tasks
The two tasks were presented in a short written description of the goal with a set of basic requirements. Each task had to be completed within 15 minutes. If participants were satisfied with the results earlier, the time taken was noted. The task had different levels of familiarity for the participants.
The first one is more approachable, needing less ideation and allowing more straightforward design work. For this, a shop crane had to be designed. The crane should be manually operated and moved by a single person, allowing it to lift heavy objects up to one meter. This task is expected to be familiar to the study participants with a mechanical engineering background.
The second task is chosen to be more open, allowing for more creativity and needing more ideation effort. A marble transport mechanism for a given basic marble track had to be designed. The mechanism should allow a continuous cycle of marbles rolling down the track and being transported back to the start. The track was given as either a 3D model or a perspective image of this, depending on the modality. There were no constraints to the mechanisms and creative solutions were encouraged.
4.3. Measures
The users reported the interfaces’ usability via the proven valid and reliable USE questionnaire after solving each task (Lund Reference Lund2001; Gao, Kortum & Oswald Reference Gao, Kortum and Oswald2018). By being technology-agnostic it is suited to compare the substantially different modalities used in the study. The questionnaire contains 27 positive statements about the interface grouped into four dimensions: Usefulness, ease of use, ease of learning, and satisfaction. They are answered on a seven-point Likert scale from “strongly disagree” to “strongly agree” For this study, the questionnaire is extended by six additional statements about the created preliminary design, giving a self-reported assessment of the quality of the created designs. The complete questionnaire can be found in the the Appendix Section A.1.
To directly compare the two interfaces, participants were also asked to complete a preference questionnaire after both tasks were completed. There, the participants chose their preferred interfaces regarding seven different design aspects. This questionnaire can be found in the appendix as well (Appendix Section A.2). It was allowed to skip statements if no preference was felt. The questionnaire concluded with the possibility to write down what was liked, disliked and should be improved about the VR interface.
Besides the user-reported measures, an external quality assessment of the created designs is necessary to answer the stated hypotheses. One way of doing this is to have an experienced jury judge the design results. A popular framework for this, originating in creativity research, is the consensual assessment technique (CAT) by Amabile (Reference Amabile1982) which has also been applied in design research (Feeman et al. Reference Feeman, Wright and Salmon2018; Chaniaud et al. Reference Chaniaud, Fleury, Poussard, Christmann, Guitter and Richir2023). To compare the designs made in VR and on paper, judges rated the designs in terms of four criteria on a five-point scale from very low to very high. The criteria are functionality, creativity, understandability, and aesthetics. The first two describe characteristics of the design concept, the latter two focus on the execution of the preliminary design artifact itself. The jury members the freehand sketches as high-quality scans and the VR models in the form of 3D-PDFs. To have an efficient judging workflow, the experts could open the files and enter their judgment in an Excel sheet. There, they also found a brief description of the quality dimensions. In order to get familiar with the process, the first two designs of each task that had to be judged were taken from the test runs. The results do not include these test ratings. Afterward the designs were judged in random order with freehand sketches and VR models mixed. The presented order of the criteria was also permuted among the judges.
4.4. Participants
With both two interfaces and two tasks, four permutations of unique study sequences were to be tested in a balanced manner. To account for deviations, each permutation was planned to be repeated five times, resulting in the need for 20 study participants. These participants should have a basic knowledge of product design and experience in mechanical design. No VR experience is required as a thorough introduction to the interface is given. The participants’ year of birth, occupation, the highest achieved degree of education, field of study, previous experience in product design and relevant technology are recorded in a socio-demographic questionnaire.
For the user study, 21 participants between the ages of 27 and 32 were recruited. One more participant than planned had to be tested because of a technical failure where one VR model could not be saved. participant’s answers to the USE questionnaire are included in the results, but their created designs are not. Participation was limited to researchers from the mechanical engineering department to ensure previous design experience. As expected, all but one participant reported experience in product design from their studies, professional career or hobbies. Table 1 reports the participants’ self-reported experiences with relevant technologies. They reported low to medium previous experience with VR in general, lots of experience with 3D modeling and medium experience with freehand sketching. It was not specifically asked if some form of VR modeling has been used before and nobody mentioned it of their own accord.
Age and experience of participants and judges
Mean and standard deviation of participants’ and judges’ age in years and self-reported previous experience with relevant technologies (7–point scale, 1=“None” to 7=“Expert”

4.5. Jury
For the second stage of the study, five judges between 29 and 36 years old, rated all created preliminary designs. For consensual agreement, it is important for the judges to have experience in the field allowing them to come to similar results (Amabile Reference Amabile1982). In order to ensure this, the judges were all senior researchers with multiple years of experience in engineering design and were members of the teaching staff in various design courses. They reported very similar previous experiences as the participants, as can be seen in Table 1.
4.6. Ethics and consent
At the beginning of the study, the participants were informed about the study’s procedure. They were also informed about the possibility of VR sickness and could withdraw from the study at any time without giving a reason. None reported illness or withdrew. There was no other physical, financial, occupational or social risk to the participants. They were informed about data protection before the start of the study and voluntarily agreed to the processing and use of their data. The data collected was anonymized and treated confidentially in accordance with the legal requirements of the European General Data Protection Regulation.
4.7. Data analysis
The questionnaire answers were captured on paper and transferred to Microsoft Excel, while the judges gave their assessment directly in a spreadsheet. Most statistical analysis was done with the GraphPad Prism software and based on their comprehensive statistics guide (Reference MotulskyHarvey Motulsky). To find the significant differences between the two interfaces, paired t-tests were computed for the answers to the USE questionnaire and the juries’ judgment. These t-tests are paired as each participant used both modalities. The common significance level
 $ \alpha =.05 $
is used for all comparisons. Typical normality tests provided by the statistical software ensure a legitimate assumption of normal distribution of the data. The sample size is 21 for the USE questionnaire and 20 for the design evaluation, as described in Section 4.4. According to Cohen (Reference Cohen1988) and calculated with G*Power (Faul et al. Reference Faul, Erdfelder, Lang and Buchner2007), these tests are powered at 80% to detect a medium to large effect size (
$ \alpha =.05 $
is used for all comparisons. Typical normality tests provided by the statistical software ensure a legitimate assumption of normal distribution of the data. The sample size is 21 for the USE questionnaire and 20 for the design evaluation, as described in Section 4.4. According to Cohen (Reference Cohen1988) and calculated with G*Power (Faul et al. Reference Faul, Erdfelder, Lang and Buchner2007), these tests are powered at 80% to detect a medium to large effect size (
 $ {d}_{21}=0.66 $
,
$ {d}_{21}=0.66 $
,
 $ {d}_{20}=0.64 $
) at the used common significance level (
$ {d}_{20}=0.64 $
) at the used common significance level (
 $ \alpha =.05 $
). Only for the comparisons of the jury assessment split by tasks unpaired t-tests are used, as in that case from each participant only a single design is available. This also reduces the sample size to 10, which makes the tests powered at 80% to detect only very large effects (
$ \alpha =.05 $
). Only for the comparisons of the jury assessment split by tasks unpaired t-tests are used, as in that case from each participant only a single design is available. This also reduces the sample size to 10, which makes the tests powered at 80% to detect only very large effects (
 $ {d}_{10}=1.71 $
). This low sensitivity for these specific analyses means that smaller effects may go undetected, and the results should be interpreted with caution.
$ {d}_{10}=1.71 $
). This low sensitivity for these specific analyses means that smaller effects may go undetected, and the results should be interpreted with caution.
For the experts’ assessments, per-result averages of all judges are used. For this to be valid, an appropriate inter-judge reliability has to be assured which is done using Cronbach’s alpha (Hennessey, Amabile & Mueller Reference Hennessey, Amabile, Mueller, Runco and Pritzker2011).
The empirical data is shown as box plots in Figure 8 and Figure 10. The extent of the whiskers shows the full range of data, the box represents the 25/75 percentile and a line is placed at the median value. Brackets on top of the graphs highlight significant differences (
 $ P<\alpha $
). Increasing number of asterisks on the bracket indicates higher levels of significance (* :
$ P<\alpha $
). Increasing number of asterisks on the bracket indicates higher levels of significance (* :
 $ p\le .05 $
, ** :
$ p\le .05 $
, ** :
 $ p\le .01 $
, *** :
$ p\le .01 $
, *** :
 $ p\le .001 $
). In plain text, the measurements are noted as their sample mean and standard deviation (
$ p\le .001 $
). In plain text, the measurements are noted as their sample mean and standard deviation (
 $ \overline{x}\pm \mathrm{SD} $
).
$ \overline{x}\pm \mathrm{SD} $
).
5. Results
This section presents the results of the conducted study. First, the designs created by the participants are considered. Then the participants’ answers to the two user experience questionnaires are presented. Finally, the evaluation of the expert jury is presented.
5.1. Created designs
In this section, the designs themselves are assessed. The results are used to evaluate Hypothesis 1 and influence the evaluation of Hypotheses 3 and 4.
Every participant was able to create the two preliminary designs totaling 42 designs produced. Due to a technical failure, one VR design of the shop crane task could only be saved as a screenshot instead of a 3D model. For further evaluations of the designs, both creations of that participant are omitted. The remaining 40 designs (10 of each combination of modality and task) are shown in Figure 6 and Figure 7.
Preliminary designs were created for the shop crane task. The upper half is created with VR modeling and the lower half with freehand sketching.

Preliminary designs were created for the marble transport task. The upper half is created with VR modeling and the lower half with freehand sketching.

The hand-drawn designs include more details, both in the sketched geometry but also by using textual annotations. Furthermore, some participants created supporting views of specific details. A closer look reveals that the designs for the shop crane are much more similar to each other than the marble transport designs. Considering the familiarity of mechanical engineers with this kind of task, this is expected. Most participants did not have to think about their crane working principle and started promptly. In contrast, for the marble transport task, they often took a few moments before starting. This was a desired effect of the different tasks.
Looking only at the marble transport designs (Figure 7), the VR modeling interface created a larger variety of working principles across the participants. Eight of the ten marble-transport freehand sketches are paternoster-style vertical conveyors, the other two being a screw conveyor and a single marble lift. In VR, the paternoster was still the most frequent solution but used only in four of the ten designs. The other principles that were applied were: chain lift, seesaw, pressured air, loaded spring, transport wheel and inclined conveyor.
5.2. User experience
In this section, the results of the user experience measures are presented. These results are primarily used for Hypothesis 2, but they also influence Hypotheses 3 and 4.
USE
The answers to the USE questionnaire are analyzed using the per-participant averages of the four dimensions on a 7-point Likert scale (1 = “Strongly disagree” to 7 = “Strongly agree,” higher is better). In Figure 8, these are compared between the two modalities.
Participants’ (
 $ N=21 $
) answers to the extended USE questionnaire on a 7-point Likert scale (1 = “Strongly disagree” to 7 = “Strongly agree,” higher is better). The first four items are the per-participant averages of the USE dimensions. The following six items are the answers to the six custom statements about the designs created. The brackets on top label significant differences, with an increasing number of asterisks indicating higher levels of significance (* :
$ N=21 $
) answers to the extended USE questionnaire on a 7-point Likert scale (1 = “Strongly disagree” to 7 = “Strongly agree,” higher is better). The first four items are the per-participant averages of the USE dimensions. The following six items are the answers to the six custom statements about the designs created. The brackets on top label significant differences, with an increasing number of asterisks indicating higher levels of significance (* :
 $ p\le .05 $
, ** :
$ p\le .05 $
, ** :
 $ p\le .01 $
, *** :
$ p\le .01 $
, *** :
 $ p\le .001 $
).
$ p\le .001 $
).

The usefulness is reported slightly higher for freehand sketching (
 $ {\overline{x}}_{FS}=4.733\pm 1.126 $
,
$ {\overline{x}}_{FS}=4.733\pm 1.126 $
,
 $ {\overline{x}}_{VR}=4.442\pm 1.231 $
,
$ {\overline{x}}_{VR}=4.442\pm 1.231 $
,
 $ p=0.438 $
) and ease of use for VR modeling (
$ p=0.438 $
) and ease of use for VR modeling (
 $ {\overline{x}}_{FS}=4.442\pm 1.231 $
,
$ {\overline{x}}_{FS}=4.442\pm 1.231 $
,
 $ {\overline{x}}_{VR}=4.648\pm 0.857 $
,
$ {\overline{x}}_{VR}=4.648\pm 0.857 $
,
 $ p=0.309 $
), but both differences are not statistically significant. VR modeling got significantly higher scores for ease of learning (
$ p=0.309 $
), but both differences are not statistically significant. VR modeling got significantly higher scores for ease of learning (
 $ {\overline{x}}_{FS}=4.845\pm 1.163 $
,
$ {\overline{x}}_{FS}=4.845\pm 1.163 $
,
 $ {\overline{x}}_{VR}=5.583\pm 0.923 $
,
$ {\overline{x}}_{VR}=5.583\pm 0.923 $
,
 $ p=0.031 $
) and satisfaction (
$ p=0.031 $
) and satisfaction (
 $ {\overline{x}}_{FS}=4.175\pm 1.541 $
,
$ {\overline{x}}_{FS}=4.175\pm 1.541 $
,
 $ {\overline{x}}_{VR}=5.730\pm 0.857 $
,
$ {\overline{x}}_{VR}=5.730\pm 0.857 $
,
 $ p<0.001 $
). The users were instructed to agree or disagree with the statements concerning the design interface used. It is expected that their responses incorporate their own experience with sketching outside of the study. This may have contributed to the higher ratings in the ease of learning dimension, despite the users not learning on-paper sketching within the study. The figure also shows the answers to the six custom statements. The statement I had enough time to complete the task produced the biggest and only significant difference (
$ p<0.001 $
). The users were instructed to agree or disagree with the statements concerning the design interface used. It is expected that their responses incorporate their own experience with sketching outside of the study. This may have contributed to the higher ratings in the ease of learning dimension, despite the users not learning on-paper sketching within the study. The figure also shows the answers to the six custom statements. The statement I had enough time to complete the task produced the biggest and only significant difference (
 $ {\overline{x}}_{FS}=6.238\pm 1.814 $
,
$ {\overline{x}}_{FS}=6.238\pm 1.814 $
,
 $ {\overline{x}}_{VR}=4.286\pm 2.513 $
,
$ {\overline{x}}_{VR}=4.286\pm 2.513 $
,
 $ p=0.007 $
). Of the 21 participants 17 answered with strongly agree, which causes no box to be visible in the graph as the median, 25th and 75th percentile are all at 7. This also matches with the actual time taken to create the designs. On average participants took 11:31 minutes on paper and 13:54 minutes in VR with many participants having to stop at the limit of 15:00 minutes.
$ p=0.007 $
). Of the 21 participants 17 answered with strongly agree, which causes no box to be visible in the graph as the median, 25th and 75th percentile are all at 7. This also matches with the actual time taken to create the designs. On average participants took 11:31 minutes on paper and 13:54 minutes in VR with many participants having to stop at the limit of 15:00 minutes.
Preference
The answers to the custom preference questionnaire are shown in Figure 9.
Participants’ interface preference for different design aspects in percent. The dark-colored bars visualize how many participants preferred the VR modeling or freehand sketching. The lighter colors in turn display the percentage that preferred whatever interface they used to solve either the shop crane or the marble transport task. Hatched areas show participants who did not give an answer.

43% stated that the VR interface was overall better suited for early embodiment design and 52% preferred freehand sketching. The last 5%, one participant, did not give a preference for this statement. In all other questions about more specific design aspects, the majority of participants preferred VR modeling. With the largest difference, 81% found it easier to imagine size and scale using VR modeling. The diagram additionally aggregates whatever task was solved with the preferred interface. Furthermore, 81% of participants thought the interface they used to create the shop crane made it easier to realize their mental model. Showing a similar but not as strong task influence, 67% of the users reported to work more creatively with the interface used to solve the marble transport task.
To analyze the open questions at the end of the user study, the answers were manually tokenized into categories. Table A.1 in the appendix shows a summary of all answers. By far the most noted positive aspect was the three-dimensional view including the intuitive change of perspective, mentioned by fifteen participants. The most noted negative points were problems with hand tracking and interaction recognition (fourteen mentions). Many participants suggested increasing the amount of basic building blocks that can be created.
5.3. Jury assessment
In this section, the assessment of the jury members is presented. These results are primarily used for Hypothesis 3, while the rated creativity is also relevant to Hypothesis 4.
Following Hennessey et al. (Reference Hennessey, Amabile, Mueller, Runco and Pritzker2011), the inter-judge reliability is validated by calculating Cronbach’s alpha for each judged dimension (
 $ {\alpha}_{functionality}=0.784 $
,
$ {\alpha}_{functionality}=0.784 $
,
 $ {\alpha}_{creativity}=0.800 $
,
$ {\alpha}_{creativity}=0.800 $
,
 $ {\alpha}_{understandability}=0.831 $
,
$ {\alpha}_{understandability}=0.831 $
,
 $ {\alpha}_{aesthetics}=0.816 $
). As all alphas are above 0.8 or very close to it, there was a high agreement of the judged qualities and the inter-judge averages per design can be used for further analysis.
$ {\alpha}_{aesthetics}=0.816 $
). As all alphas are above 0.8 or very close to it, there was a high agreement of the judged qualities and the inter-judge averages per design can be used for further analysis.
Figure 10 shows these judging results. Looking at all designs, the freehand sketches were rated better than the VR models, with all four dimensions showing a significant difference: Functionality (
 $ {\overline{x}}_{FS}=3.26\pm 0.503 $
,
$ {\overline{x}}_{FS}=3.26\pm 0.503 $
,
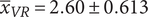 $ {\overline{x}}_{VR}=2.60\pm 0.613 $
,
$ {\overline{x}}_{VR}=2.60\pm 0.613 $
,
 $ p=0.002 $
), creativity (
$ p=0.002 $
), creativity (
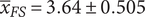 $ {\overline{x}}_{FS}=3.64\pm 0.505 $
,
$ {\overline{x}}_{FS}=3.64\pm 0.505 $
,
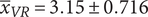 $ {\overline{x}}_{VR}=3.15\pm 0.716 $
,
$ {\overline{x}}_{VR}=3.15\pm 0.716 $
,
 $ p=0.036 $
), understandability (
$ p=0.036 $
), understandability (
 $ {\overline{x}}_{FS}=3.57\pm 0.500 $
,
$ {\overline{x}}_{FS}=3.57\pm 0.500 $
,
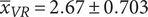 $ {\overline{x}}_{VR}=2.67\pm 0.703 $
,
$ {\overline{x}}_{VR}=2.67\pm 0.703 $
,
 $ p<0.001 $
) and aesthetics (
$ p<0.001 $
) and aesthetics (
 $ {\overline{x}}_{FS}=0.34\pm 0.711 $
,
$ {\overline{x}}_{FS}=0.34\pm 0.711 $
,
 $ {\overline{x}}_{VR}=2.87\pm 0.623 $
,
$ {\overline{x}}_{VR}=2.87\pm 0.623 $
,
 $ p=0.021 $
). Looking at the ratings split by task, the differences are even larger for the shop crane task and less drastic for the marble transport one. Both in creativity and aesthetics, the marble transport designs created with VR modeling were rated close to the ones done with freehand sketching.
$ p=0.021 $
). Looking at the ratings split by task, the differences are even larger for the shop crane task and less drastic for the marble transport one. Both in creativity and aesthetics, the marble transport designs created with VR modeling were rated close to the ones done with freehand sketching.
Jury assessment of the preliminary designs split by interface (color,
 $ N=20 $
) and additionally by task (pattern,
$ N=20 $
) and additionally by task (pattern,
 $ N=10 $
) on a 5-point scale (1 = “very low” to 5 = “very high”). The brackets on top label significant differences, with an increasing number of asterisks indicating higher levels of significance (* :
$ N=10 $
) on a 5-point scale (1 = “very low” to 5 = “very high”). The brackets on top label significant differences, with an increasing number of asterisks indicating higher levels of significance (* :
 $ p\le .05 $
, ** :
$ p\le .05 $
, ** :
 $ p\le .01 $
, *** :
$ p\le .01 $
, *** :
 $ p\le .001 $
).
$ p\le .001 $
).

5.4. Influence of experience
Finally, an analysis of the correlation between prior experience and the presented results is conducted. The correlation analysis in Table 2 of the stated experience to the results reveals expected connections.
Pearson correlation coefficient (
 $ r $
) and two-tailed P-value (
$ r $
) and two-tailed P-value (
 $ p $
) between stated experience and results
$ p $
) between stated experience and results

For each modality, the experience is compared to the average USE score, the participants’ assessment of the work result and the average jury assessment of the corresponding design. Again, asterisks mark significant correlations (*
 $ p\le .05 $
, **
$ p\le .05 $
, **
 $ p\le .01 $
, ***
$ p\le .01 $
, ***
 $ p\le .001 $
).
$ p\le .001 $
).
All results have a positive correlation (
 $ r>0 $
) with the corresponding experience, meaning with more experience in the area the results tend to get better. Only three of those are significant: The correlation between the reported experience and the average of the responses about the work results in both interfaces and between the VR experience and the average jury score of the VR designs. The greater influence of experience in VR was expected for novice users, as this modality represents a completely new experience, with few similar experiences to draw upon. In contrast, everyone has some familiarity with sketching and, furthermore, all participants are trained in engineering.
$ r>0 $
) with the corresponding experience, meaning with more experience in the area the results tend to get better. Only three of those are significant: The correlation between the reported experience and the average of the responses about the work results in both interfaces and between the VR experience and the average jury score of the VR designs. The greater influence of experience in VR was expected for novice users, as this modality represents a completely new experience, with few similar experiences to draw upon. In contrast, everyone has some familiarity with sketching and, furthermore, all participants are trained in engineering.
6. Discussion
This section discusses the results of the study evaluating the hypotheses. The subsequent subsection outlines the limitations of the study.
6.1. Hypotheses
Hypothesis 1 Natural VR modeling allows users to create digital preliminary designs of their ideas, suitable for further processing.
In the study, all 21 participants created a readable three-dimensional design with the VR modeling interface prototype, as shown in the upper halves of Figure 6 and Figure 7. They were able to understand the natural interactions and execute them to create bodies from the basic shapes as needed. Further modification and annotations using the different functions were also done regularly. Additionally, the models created using VR modeling are in a CAD format (.prt) and can be edited with CAD software immediately, saving the effort of digital remodeling or data transformation. Combining these results, this baseline hypothesis can be confirmed.
Hypothesis 2 The user-experience of natural VR modeling causes users to prefer it over freehand sketching for preliminary designs of their ideas.
In the USE questionnaire, the VR modeling scored about equal in two dimensions (usefulness and ease of use) and significantly higher in the other two (ease of learning and satisfaction). Furthermore, the VR modeling interface was preferred regarding critical aspects of early design, such as imagining size and working principle and almost half of the participants think the method is better suited for preliminary design overall. However, the longer time taken, the mixed overall preferences, and the critical responses to the open-ended questions also need to be considered. Therefore, the results support this hypothesis, but it can not clearly be confirmed.
Hypothesis 3 The preliminary designs created by VR modeling are at least of the same quality as those created by freehand sketching.
Overall, the jury considered the VR models significantly worse in all quality dimensions tested (functionality, creativity, understandability and aesthetics). The lack of flexibility and efficiency compared to freehand sketching becomes clear when inspecting the designs in more detail. The freehand sketches contain more features, details, and annotations. Nevertheless, the users were about equally satisfied with their results with both design methods. Improved hand tracking, more robust interaction recognition and more experience could increase the speed of immersive modeling, bringing the quality of the results closer together. Collectively, these results lead to a refutation of this hypothesis.
Hypothesis 4 Natural VR modeling leads to more creative novel solutions than freehand sketching.
The participants rated both the support for their creativity (
 $ {\overline{x}}_{FS}=4.524\pm 1.504 $
,
$ {\overline{x}}_{FS}=4.524\pm 1.504 $
,
 $ {\overline{x}}_{VR}=5.048\pm 1.717 $
,
$ {\overline{x}}_{VR}=5.048\pm 1.717 $
,
 $ p=0.367 $
) and the creativity of their result (
$ p=0.367 $
) and the creativity of their result (
 $ {\overline{x}}_{FS}=4.048\pm 1.746 $
,
$ {\overline{x}}_{FS}=4.048\pm 1.746 $
,
 $ {\overline{x}}_{VR}=4.238\pm 1.621 $
,
$ {\overline{x}}_{VR}=4.238\pm 1.621 $
,
 $ p=0.687 $
) on average slightly higher for VR modeling. On the other hand, the judges rated the marble transport designs from VR modeling as slightly less creative (
$ p=0.687 $
) on average slightly higher for VR modeling. On the other hand, the judges rated the marble transport designs from VR modeling as slightly less creative (
 $ {\overline{x}}_{FS}=3.82\pm 0.426 $
,
$ {\overline{x}}_{FS}=3.82\pm 0.426 $
,
 $ {\overline{x}}_{VR}=3.50\pm 0.79 $
,
$ {\overline{x}}_{VR}=3.50\pm 0.79 $
,
 $ p=0.279 $
). Furthermore, the designs created for the marble transport task with VR modeling are more varied in operating principle than those created by freehand sketching. This might be an indicator to support the hypothesis, but could also be the result of the limited design features which forced the users to scratch their first idea and think outside the box. From these similar results, the hypothesis can neither be confirmed nor refuted, only a slight support for it could be read from the veriety of VR designs.
$ p=0.279 $
). Furthermore, the designs created for the marble transport task with VR modeling are more varied in operating principle than those created by freehand sketching. This might be an indicator to support the hypothesis, but could also be the result of the limited design features which forced the users to scratch their first idea and think outside the box. From these similar results, the hypothesis can neither be confirmed nor refuted, only a slight support for it could be read from the veriety of VR designs.
6.2. Limitations
As with every user study, the one presented in this contribution has some limitations that have to be recognized. One problem is the unbalanced previous experience with the two interfaces. While the participants had little experience with VR, they were, as expected, much more experienced in freehand sketching. So, some drawbacks of VR modeling could be caused by the users not being as comfortable with the interface prototype jet. Many got recognizably more confident while working on the task, so a longer training period might improve modeling speed and the resulting design quality as well as the perceived usability. This is supported by evidence that participants with greater experience in VR performed better (see Section 5.4). It can be anticipated that this influence would be even greater with prior experience specifically in VR modeling. On the other hand, the high satisfaction values of VR modeling could drop with more time spent, because they might have been caused by early excitement from novel virtual reality technology.
Similarly to the users, also the judges were more familiar with freehand sketching from their own design and teaching work. This might have introduced a bias of them preferring their trusted medium over the unfamiliar 3D-PDF. The judges also mentioned they had a hard time judging the designs in the given dimensions, but the high inter-judge reliability shows they came to similar conclusions.
Not all participants were happy with the perspective provided for the freehand sketch of the marble transport task and would either like to draw from a different angle or completely in two dimensions. That freedom would have made the sketches less comparable but would have resembled the real world better, where no such restrictions apply.
Another important step in planning empirical design research is to choose the right tasks. In this study, two tasks with different characteristics were chosen. As the results differ noticeably between these two, the transferability of the findings to other tasks may be limited. More tasks with open solution spaces like the marble transport should give more insights into the impact of VR modeling on design creativity.
Lastly, an intriguing question in this area is the extent to which the usability of a design tool influences the resulting design quality. Understanding this could provide developers with guidance on how much effort should be invested in usability engineering. However, this study was not designed to gather insights into correlations between the result data. A posteriori examination of the correlations between the USE results and the jury assessments did reveal a slight positive correlation (VR:
 $ r=0.35 $
,
$ r=0.35 $
,
 $ p=0.13 $
; Sketching:
$ p=0.13 $
; Sketching:
 $ r=0.21 $
,
$ r=0.21 $
,
 $ p=0.35 $
). Since this represents a weak connection, it does not provide sufficient information from which to draw conclusions.
$ p=0.35 $
). Since this represents a weak connection, it does not provide sufficient information from which to draw conclusions.
7. Conclusion and outlook
This research presents a natural VR modeling method to create primitive-based three-dimensional preliminary designs as an alternative to freehand sketches. In a user study, it is shown that this natural VR modeling can be used to express the user’s design intentions. Having these designs in the form of digital CAD data opens many possibilities, for example, live and remote collaboration or immediate digital processing of the models. The interface prototype was rated mostly positively by the users in terms of user experience and suitability for early design. However, a jury rated the created digital designs worse in comparison to the conventional ones. In summary, this research cannot clearly affirm the research question stated in Section 2, that natural immersive modeling is an effective alternative to freehand sketching for preliminary design. Currently, VR modeling seems to be a preliminary design method that captures user engagement but falls short of replicating the quality of freehand sketches. However, observing the novel natural modeling method at a prototype stage performing on par with the established and widely used freehand sketching across multiple dimensions supports the need for further investigation. With advancements in technology and usability, coupled with users becoming more accustomed to VR and VR modeling, the quality of the results should significantly improve.
From these conclusions, possible further research activities open up. A direct follow-up would be to test the impact of additional and improved modeling functionalities. For example, additional domain-specific primitives could improve the effectivity and design quality. Another way to improve the design quality might be additional input technologies, supporting or replacing hand tracking. Also, testing more diverging design tasks to further understand the effects on design creativity is necessary. Lastly, a study in which users are given significantly more time, potentially working independently on their own tasks, could help to close the experience gap, leading to higher-quality designs. Furthermore, all pure virtual reality applications suffer from an interface gap. The users have to leave their usual workspace often physically, but at least virtually. For a more seamless integration of immersive tools into everyday use, hybrid augmented reality computer workstations might be a possibility (Cools et al. Reference Cools, Gottsacker, Simeone, Bruder, Welch and Feiner2022; Harlan, Goetz & Wartzack Reference Harlan, Goetz and Wartzack2023). In this way, the presented natural VR modeling could be used directly within the familiar CAD environment of the product developer without leaving the desk, allowing interleaving preliminary and detailed design without a break in medium or interface.
Acknowledgments
The authors thank all participants and judges for their time and effort needed to complete the research study.
Financial support
This study was funded by the Deutsche Forschungsgemeinschaft (DFG, German Research Foundation) – 401324164.
Competing interest
The authors declare none.
A. Appendix
A.1. Adapted USE Questionnaire (Lund Reference Lund2001 )
Statements are answered on a seven-point Likert scale.
Usefulness
-
• It helps me be more effective.
-
• It helps me be more productive.
-
• It is useful.
-
• It makes the things I want to accomplish easier to get done.
-
• It saves me time when I use it.
-
• It meets my needs.
-
• It does everything I would expect it to do.
Ease of Use
-
• It is easy to use.
-
• It is simple to use.
-
• It is user-friendly.
-
• It requires the fewest steps possible to accomplish what I want to do with it.
-
• It is flexible.
-
• Using it is effortless.
-
• I don’t notice any inconsistencies as I use it.
-
• Both occasional and regular users would like it.
-
• I can recover from mistakes quickly and easily.
-
• I can use it successfully every time.
Ease of Learning
-
• I learned to use it quickly.
-
• I easily remember how to use it.
-
• It is easy to learn to use it.
-
• I quickly became skillful with it.
Satisfaction
-
• I am satisfied with it.
-
• I would recommend it to a friend.
-
• It is fun to use.
-
• It works the way I want it to work.
-
• It is wonderful.
-
• It is pleasant to use.
Work results (Added custom statements) [noitemsep]
-
• I am satisfied with my result.
-
• My result is creative
-
• The result matches my imagination.
-
• The result will fulfill its task.
-
• I had enough time to complete the task.
-
• My creativity was well supported
A.2. Custom questionnaire
Participants chose their preference between freehand sketch and VR modeling. They could skip the question if they had no preference. The questions were stated in German.
-
• Which of the interfaces do you think is better overall for creating a preliminary design?
-
• With which interface did you find it easier to come up with new ideas, develop a mental model and plan your next steps?
-
• Which interface made it easier for you to realize this mental model or your idea?
-
• In which interface did you work more creatively?
-
• With which of the tested interfaces did you find it easier to visualize the proportions and dimensions of both the parts and the whole design?
-
• Which of the tested interfaces made it easier for you to visualize the functionality of the design?
-
• Which of the tested interfaces do you think is better suited to communicating your idea to a colleague?
Open questions allowing for textual answers:
-
• What did you like best about the VR interface? What did you like least?
-
• Do you have any suggestions for improvement?
Tokenized free-form feedback for the VR interface


 Open access