


Depression is a leading cause of disability worldwide, affecting approximately 280 million people(1). In the USA, the prevalence of major depressive disorder among adults is 8·4 %(Reference Hasin, Sarvet and Meyers2). Although pharmacological and psychological interventions exist, treatment resistance remains common, highlighting the need for preventive strategies(Reference Rush, Trivedi and Wisniewski3). In this context, dietary patterns have emerged as modifiable factors associated with mental health outcomes, with a systematic review and meta-analysis of community-dwelling adults reporting lower odds of depression among individuals adhering to healthier dietary patterns and higher odds among those consuming Western-style diets(Reference Lai, Hiles and Bisquera4). n-3 fatty acids, particularly EPA and DHA, are incorporated into neuronal membranes and influence their fluidity and function. They serve as precursors for anti-inflammatory eicosanoids and specialised pro-resolving mediators, potentially reducing neuroinflammation implicated in depression. n-3 fatty acids also modulate neurotransmitter systems (serotonin and dopamine), affect neuroplasticity and neurogenesis and may regulate the hypothalamic–pituitary–adrenal axis while reducing oxidative stress. Beyond fatty acids, other bioactive components of whole dietary patterns, such as polyphenols commonly found in Mediterranean-style diets, have also been associated with improvements in depressive symptoms, potentially through antioxidant, anti-inflammatory and gut–brain axis–related mechanisms(Reference Bayes, Schloss and Sibbritt5). In contrast, a high n-6 intake relative to n-3 intake may promote pro-inflammatory processes. Emerging evidence suggests that long-chain n-PUFA, primarily EPA and DHA from marine sources, may play a role in mental health. Meta-analyses of randomised controlled trials have shown mixed results regarding n-3 supplementation for depression, with some suggesting modest benefits for EPA-predominant formulations(Reference Grosso, Micek and Marventano6,Reference Liao, Xie and Zhang7) . However, evidence from large-scale observational studies examining habitual dietary n-3 intake in the general population is limited and inconsistent(Reference Bozzatello, Brignolo and De Grandi8,Reference Parker, Gibson and Brotchie9) . National Health and Nutrition Examination Survey (NHANES) 2021–2023 provides a unique opportunity to examine this relationship in a nationally representative sample using standardised assessment methods, with detailed dietary recall data from which individual n-3 fatty acid intakes can be derived and validated depression screening using the Patient Health Questionnaire-9 (PHQ-9)(Reference Sublette, Ellis and Geant10). This study aimed to examine the cross-sectional association between dietary intake of total and individual long-chain n-3 fatty acids (alpha-linolenic acid (ALA), EPA, DPA and DHA) and depression severity in USA adults.
Methods
Study population
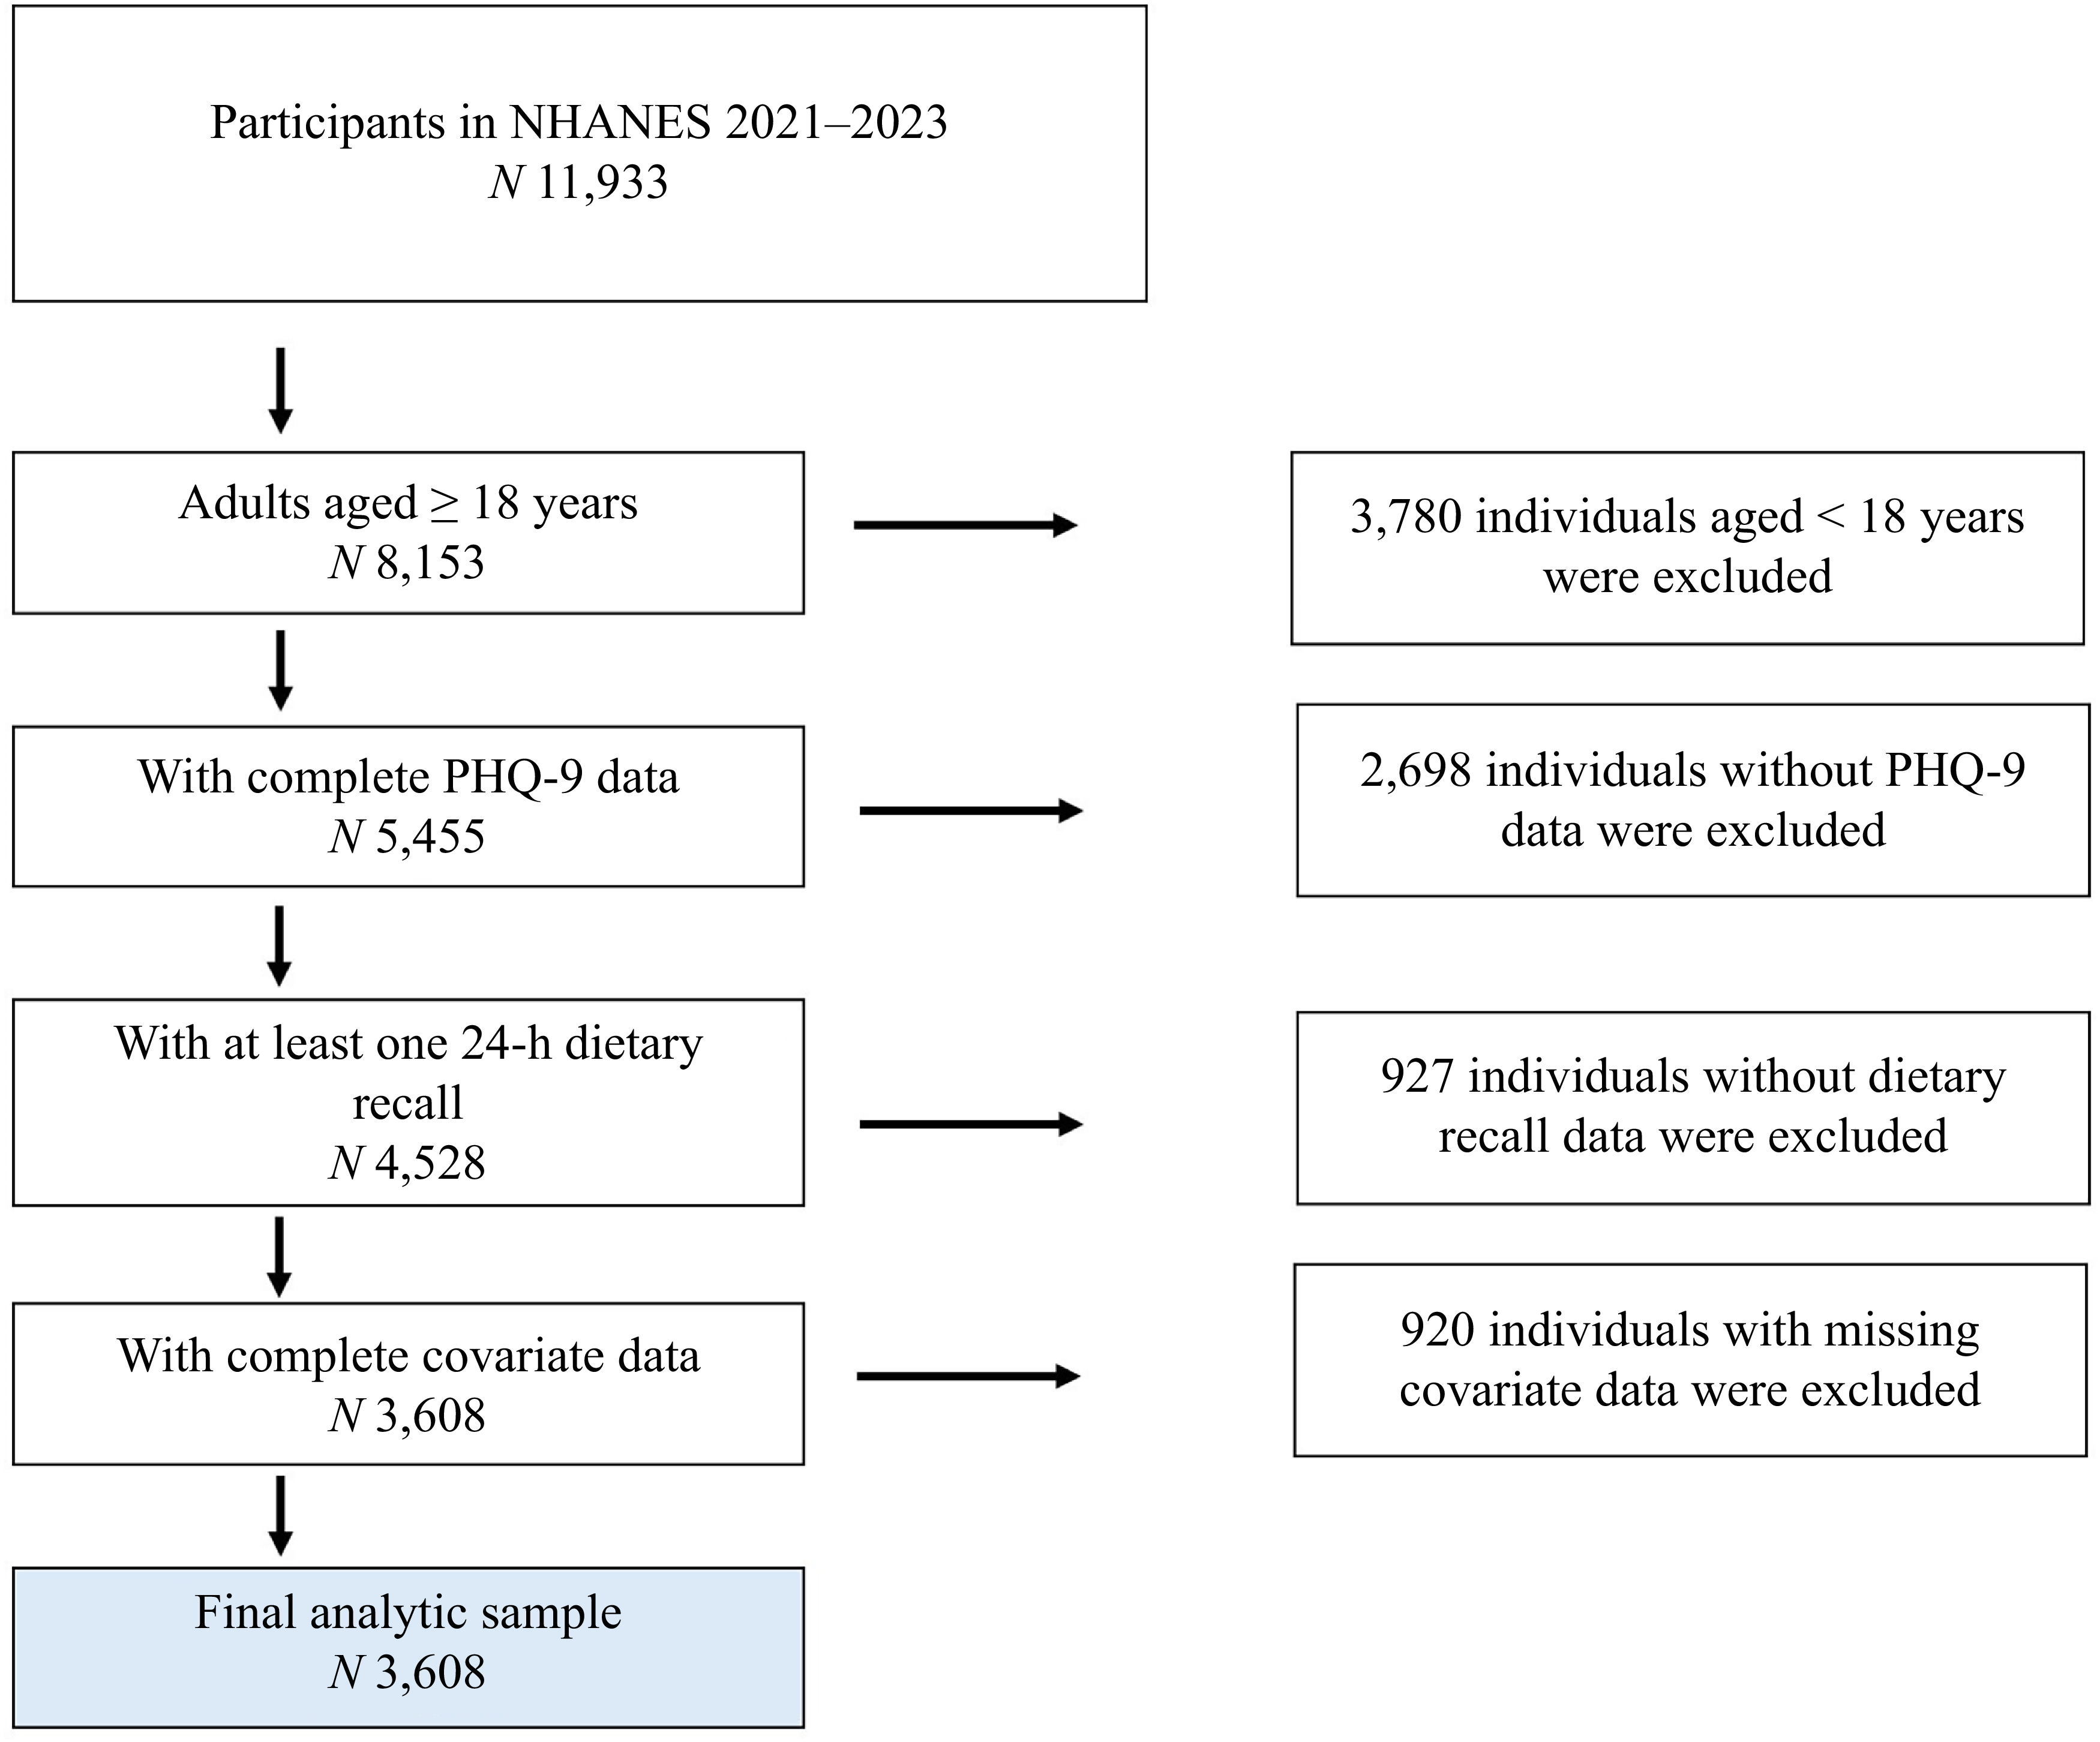
Data were obtained from the NHANES 2021–2023, a continuous, nationally representative, cross–sectional survey using a complex, multistage probability sampling design to select participants representative of the civilian, non-institutionalised USA population. The NHANES protocol was approved by the National Center for Health Statistics Research Ethics Review Board, and all participants provided informed consent in writing. This secondary analysis of de-identified, publicly available data were classified as exempt by the Utah State University Institutional Review Board (protocol #14827). We included adults aged ≥ 18 years who completed the depression questionnaire, had at least one 24-h dietary recall and had complete data on all covariates. The final analytical sample comprised 3608 participants (Figure 1).
Flow chart of participant selection. Flow chart of participant selection from the NHANES 2021–2023. The final analytic sample consisted of 3608 adults aged ≥ 18 years with complete data on depression severity (PHQ-9), dietary n-3 intake and all covariates. NHANES, National Health and Nutrition Examination Survey; PHQ-9, Patient Health Questionnaire-9.

Depression assessment
Depression severity was assessed using the Patient Health Questionnaire-9 (PHQ-9), a validated self-administered tool based on nine Diagnostic and Statistical Manual of Mental Disorders, 5th Edition criteria for major depressive disorder(Reference Kroenke, Spitzer and Williams11). Participants rated the frequency of depressive symptoms over the past 2 weeks on a four-point scale (0 = not at all to 3 = nearly every day). Total scores (0–27) were categorised as follows: None (0–4), Mild (5–9), Moderate (10–14), Moderately Severe (15–19) and Severe (20–27).
Dietary assessment and fatty acid derivation
Dietary intake was assessed using two 24-h dietary recalls conducted by trained interviewers using the United States Department of Agriculture of Agriculture Automated Multiple-Pass Method. The first recall was in-person during the Mobile Examination Center visit, and the second was by telephone 3–10 d later. Individual fatty acid intakes (α-linolenic acid (ALA, 18:3n-3), EPA, 20:5n-3, DPA, 22:5n-3 and DHA, 22:6n-3) were derived from dietary recall data using the United States Department of Agriculture Food and Nutrient Database for Dietary Studies 2021–2023(Reference Colangelo, He and Whooley12). The Food and Nutrient Database for Dietary Studies provides nutrient composition values for all foods reported in the dietary recall. Fatty acid intakes were calculated as follows: for participants with both Day 1 and Day 2 recalls, average intake across both days; for participants with only Day 1 recall, Day 1 intake only. The total n-3 fatty acid intake was calculated as the sum of ALA, EPA, DPA and DHA, expressed in grams per day.
Supplement Use: n-3 supplement use was identified using the Dietary Supplement Questionnaire by text matching of supplement names. Supplements containing ‘fish oil,’ ‘n,’ ‘EPA,’ ‘DHA,’ ‘flax’ or ‘krill’ were classified as n-3 fatty acid supplements. The dietary fatty acid intakes reported in this analysis exclude supplement sources and represent dietary intake only. n-3 supplement use was included as a binary covariate (yes/no) in all the models.
Covariates
Covariates were selected a priori based on potential associations with both n-3 intake and depression.
Demographics: Age (continuous, years), sex (male/female), race/ethnicity (Mexican American, other Hispanic, non-Hispanic White (reference) and other). Due to sparse cell counts in some race/ethnicity categories, non-Hispanic Black, non-Hispanic Asian and Other/Multiracial were collapsed into a single ‘Other’ category for analysis.
Socio-economic: Ratio of family income to poverty threshold (continuous)
Lifestyle: BMI (continuous, kg/m2), ever smoked ≥ 100 cigarettes in lifetime (yes/no), alcohol consumption (days per year, continuous) and physical activity (minutes of moderate activity per week, continuous)
Medication: n-3 supplement use (yes/no)
All covariates were assessed using standardised NHANES questionnaires and examination protocols. BMI was calculated based on the measured height and weight.
Antidepressant Medication Use: NHANES 2021–2023 prescription medication files do not allow reliable classification of antidepressant use relative to PHQ-9 symptom timing. We were unable to identify or control for antidepressant use, which is an important unmeasured confounder. This limitation is discussed in detail in the limitations section.
Statistical analysis
All analyses accounted for the complex sampling design of the NHANES, incorporating sample weights, strata and primary sampling units. A survey design object was created using the ‘svydesign’ function in R, with ‘nest = TRUE’ to account for the nested structure of primary sampling units within strata. The ‘options (survey.lonely.psu = ‘adjust’)’ setting was applied to handle the strata with single primary sampling units. Dietary Day 1 weights (WTDRD1) were applied for analyses, including participants with a single recall, consistent with the NHANES analytic guidance(13). Participants with two dietary recalls contributed average intake values but were analysed using Day 1 dietary weights, consistent with the NHANES guidance for mixed recall availability. Descriptive statistics were calculated for the total sample and stratified by depression severity. Continuous variables are presented as weighted means (standard deviations), and categorical variables are presented as weighted frequencies (percentages). The association between n-3 fatty acid intake and depression severity was examined using survey-weighted ordinal logistic regression (proportional odds model) via the ‘svyolr’ function, treating depression severity as an ordered categorical variable (0 = None to 4 = Severe). The proportional-odds assumption was assessed qualitatively. Because standard Brant testing is not directly applicable to the survey-weighted ordinal model, we examined whether the cumulative-logit relationships appeared approximately parallel across outcome thresholds; no major departures were evident.
Variable Scaling: All continuous variables (age, BMI, income:poverty ratio, alcohol consumption, physical activity and n-3 fatty acid intake) were centred and scaled to a mean of 0 and a standard deviation of 1 prior to model fitting. This scaling facilitates the interpretation of odds ratios per 1 sd) increase, improves model convergence and addresses potential multicollinearity issues.
Three models were specified.
Model 1: Unadjusted
Model 2: Adjusted for age, sex and race/ethnicity
Model 3: Fully adjusted (age, sex, race/ethnicity, income:poverty ratio, BMI, smoking status, alcohol use, physical activity and n-3 supplement use)
Model 3 represents the primary analyses. Results are presented as OR with 95 % CI and P values. All OR are expressed as per a 1 sd increase in the exposure variable. OR < 1·0 indicate an inverse association (higher n-3 intake associated with lower odds of high depression severity). Separate models were run for total n-3 intake and for each individual fatty acid (ALA, EPA, DPA and DHA). Interaction Analyses: Potential effect modification by sex and race/ethnicity was assessed by including multiplicative interaction terms (n-3 × sex, n-3 × race/ethnicity) in the fully adjusted models. Sensitivity Analyses: We conducted analyses (1) excluding n-3 supplement users and (2) restricting participants to those with two complete dietary recalls. Missing Data: Complete case analysis was performed. Participants with missing data on any of the variables were excluded. All analyses were conducted using R version 4.5.0 with the ‘survey’ package for conducting survey-weighted analyses. Statistical significance was set at P < 0·05 (two-tailed).
Results
Sample characteristics
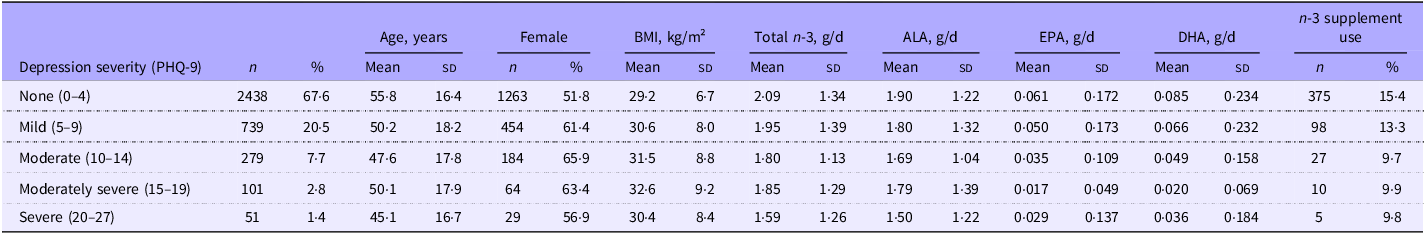
The analytical sample included 3608 adults aged ≥ 18 years. Table 1 presents the weighted participant characteristics by depression severity category. Participants with no depression (PHQ-9 score 0–4) comprised 67·6 % of the sample (n 2438), followed by mild depression (20·5 %, n 739), moderate depression (7·7 %, n 279), moderately severe depression (2·8 %, n 101) and severe depression (1·4 %, n 51). The mean age decreased with increasing depression severity, from 55·8 years in the no depression category to 45·1 years in the severe depression category. The proportion of female participants was higher in the moderate and moderately severe depression categories (65·9 % and 63·4 %, respectively) than in the no depression category (51·8 %). The mean BMI increased with depression severity, ranging from 29·2 kg/m² in the no depression category to 32·6 kg/m² in the moderately severe category. n-3 supplement use was reported by 15·4 % of participants in the no depression category and decreased to 9·8 % in the severe depression category.
Participant characteristics by depression severity category (n 3608)

ALA, α-linolenic acid.
Values were weighted to represent the USA civilian, non-institutionalised population. n represents the unweighted sample size; percentages and means are weighted.
Association between n-3 intake and depression severity
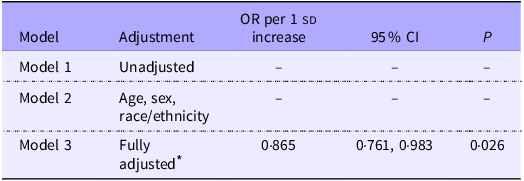
Table 2 presents the results of the survey-weighted ordinal logistic regression models examining the association between total n-3 intake and depression severity. Model 1 (unadjusted) showed convergence issues and is not reported. Model 2 (adjusted for age, sex and race/ethnicity) also showed convergence issues and is not reported. In the fully adjusted model (Model 3), which included age, sex, race/ethnicity, income:poverty ratio, BMI, smoking status, alcohol use, physical activity and n-3 supplement use, higher total n-3 intake was inversely associated with depression severity (OR 0·865 per 1 sd increase, 95 % CI 0·761, 0·983, P = 0·026).
Association of total n-3 fatty acid intake with depression severity: survey-weighted ordinal logistic regression models

* The fully adjusted model included age, sex, race/ethnicity, income:poverty ratio, BMI, smoking status, alcohol use, physical activity and n-3 supplement use. All continuous variables were scaled and centred. The OR represent the odds of higher depression severity per one sd increase in dietary n-3 intake. Models 1 and 2 are not reported due to convergence issues.
Individual fatty acids
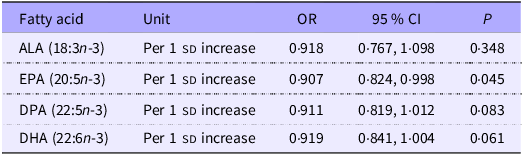
Table 3 presents the results for individual n-3 fatty acids in fully adjusted models. EPA showed a statistically significant inverse association with depression severity (OR 0·907 per 1 sd increase, 95 % CI 0·824, 0·998, P = 0·045). ALA showed a non-significant inverse association (OR 0·918 per 1 sd increase, 95 % CI 0·767, 1·098, P = 0·348). DPA showed a non-significant inverse association (OR 0·911 per 1 sd increase; 95 % CI 0·819, 1·012, P = 0·083). DHA showed a non-significant inverse association (OR 0·919 per 1 sd increase, 95 % CI 0·841, 1·004, P = 0·061).
Association of individual n-3 fatty acids with depression severity: fully adjusted survey-weighted models

ALA, α-linolenic acid.
All models were fully adjusted for age, sex, race/ethnicity, income:poverty ratio, BMI, smoking status, alcohol use, physical activity and n-3 supplement use. All continuous variables were scaled and centred. OR represent the odds of higher depression severity per one sd increase in fatty acid intakes.
Interaction analyses
The association between total n-3 intake and depression severity did not differ significantly by sex (n-3 × sex interaction, P = 0·656) or race/ethnicity (n-3 × race/ethnicity interaction, P = 0·155).
Sensitivity analyses
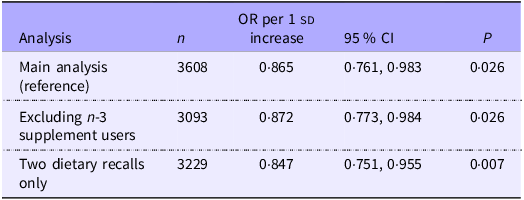
Table 4 presents the sensitivity analysis results. After excluding n-3 supplement users (n 3093), the inverse association remained statistically significant (OR 0·872 per 1 sd increase, 95 % CI 0·773, 0·984, P = 0·026). Restricting the analysis to participants with two complete dietary recalls (n 3229) yielded a stronger inverse association (OR 0·847 per 1 sd increase, 95 % CI 0·751, 0·955, P = 0·007).
Sensitivity analyses: association of total n-3 intake with depression severity

All models were fully adjusted for age, sex, race/ethnicity, income:poverty ratio, BMI, smoking status, alcohol use, physical activity and n-3 supplement use (where applicable). All continuous variables were scaled and centred. OR represent the odds of higher depression severity per standard deviation increase in total n-3 intake.
Discussion
In this nationally representative cross-sectional study of USA adults, dietary n-3 fatty acid intake was inversely associated with depression severity after comprehensive adjustment for demographic, socio-economic, lifestyle and health-related confounders. As shown in Table 2, the fully adjusted model (Model 3) demonstrated a statistically significant inverse association between total n-3 intake and depression severity (OR 0·865 per 1 sd increase, 95 % CI 0·761, 0·983, P = 0·026). Among the individual fatty acids, EPA showed a significant inverse association (OR 0·907 per 1 sd increase, 95 % CI 0·824, 0·998, P = 0·045), whereas ALA, DPA and DHA showed non-significant but consistent inverse associations (Table 3). There was no evidence of effect modification by sex (P = 0·656) or race/ethnicity (P = 0·155). The persistence of the inverse association after comprehensive covariate adjustment suggests that the relationship may be independent of measured demographic, socio-economic and lifestyle factors, although unmeasured confounding remains a possibility.
The magnitude of the observed association, although statistically significant, was modest in clinical terms. A one sd increase in total n-3 intake was associated with approximately 14 % lower odds of high depression severity (Table 2). This effect size suggests that dietary n-3 intake may contribute to population-level differences in depression severity rather than representing a primary intervention strategy for individual treatments. This modest magnitude is consistent with the multifactorial nature of depression, in which dietary factors likely operate alongside genetic, environmental and psychosocial determinants. At the population level, even modest associations can have meaningful public health implications if they reflect modifiable dietary patterns that are part of the broader lifestyle factors associated with mental health(Reference Grajek, Krupa-Kotara and Białek-Dratwa14). This association persisted after adjusting for multiple potential confounders, including age, sex, race/ethnicity, socio-economic status, BMI, smoking, alcohol use, physical activity and n-3 supplement use, suggesting a potential independence from these measured factors.
The finding that EPA showed a statistically significant inverse association (OR 0·907 per 1 sd increase, 95 % CI 0·824, 0·998, P = 0·045), whereas other individual fatty acids did not reach statistical significance (Table 3), warrants cautious interpretation. EPA is primarily derived from marine sources, particularly fatty fish, and its association may reflect broader dietary patterns rather than the specific biological effect of EPA(Reference Smorenburg, Hodun and McTavish15). Fish consumption is often associated with healthier dietary patterns, higher socio-economic status and lifestyle factors that may independently influence mental health(Reference Suominen-Taipale, Turunen and Partonen16). The non-significant associations observed for ALA, DPA and DHA (Table 3) do not necessarily indicate that these fatty acids are less relevant; rather, they may reflect measurement challenges(Reference Kipnis, Subar and Midthune17), differential bioavailability(Reference Burdge and Calder18,Reference Brenna, Salem and Sinclair19) or the possibility that EPA serves as a marker for a dietary pattern rich in marine n-3 sources(Reference Mozaffarian and Rimm20). The borderline non-significant association for DHA (OR 0·919, 95 % CI 0·841, 1·004, P = 0·061) suggests that marine n-3 fatty acids may be relevant; however, the current analysis cannot distinguish between direct effects and dietary pattern associations. This finding is consistent with previous research suggesting that EPA may be more strongly associated with depression outcomes than DHA, although the biological mechanisms underlying potential EPA-specific effects remain unclear and require further investigation(Reference Peng, Zhang and Yan21).
The consistency of the findings across the sensitivity analyses strengthens the confidence in the robustness of the observed associations. As shown in Table 4, excluding n-3 supplement users (n 3093) yielded a similar inverse association (OR 0·872 per 1 sd increase, 95 % CI 0·773, 0·984, P = 0·026), indicating that the association was not driven by supplement use patterns. Restricting the analysis to participants with two complete dietary recalls (n 3229) produced a stronger inverse association (OR 0·847 per 1 sd increase, 95 % CI 0·751, 0·955, P = 0·007), which may reflect a more accurate dietary assessment or the selection of participants with more stable dietary patterns. The persistence of statistically significant associations across these different analytical approaches, despite varying sample sizes and dietary assessment completeness, suggests that the observed relationship is not an artifact of measurement error or confounding factors such as supplement use. This consistency across sensitivity analyses, combined with the comprehensive covariate adjustment in the primary model, supports the robustness of the findings while acknowledging the limitations inherent in cross-sectional observational data.
These findings are consistent with those of previous observational studies reporting inverse associations between n-3 intake or status and depression(Reference Bigornia, Harris and Falcón22). However, meta-analyses of randomised controlled trials have shown limited evidence for n-3 supplementation in the prevention or treatment of depression in the general population(Reference Okereke, Vyas and Mischoulon23,Reference Kelaiditis, Gibson and Dyall24) . The apparent discrepancy between observational studies reporting inverse associations and randomised controlled trials showing limited evidence for n-3 supplementation may reflect fundamental differences in exposure characteristics rather than contradictory evidence. Observational studies capture long-term habitual dietary intake patterns that develop over years, whereas randomised controlled trials typically examine short-term supplementation (often weeks to months) in participants who may already have adequate baseline n-3 status(Reference Grosso, Galvano and Marventano25,Reference Carney, Steinmeyer and Freedland26) . The dietary patterns associated with higher n-3 intake in observational studies, such as regular fish consumption as part of a Mediterranean-style diet, represent complex, sustained exposures that may differ substantially from isolated supplement interventions. Additionally, randomised controlled trials often enroll participants with clinical depression or specific depression subtypes, whereas population-based observational studies capture the full spectrum of depression severity(Reference Reigada, Buchanan and Hazeltine27). The complementarity of these research approaches suggests that dietary n-3 intake may be more relevant for population-level mental health patterns and primary prevention contexts(Reference Grosso, Micek and Marventano6,Reference Deane, Jimoh and Biswas28) , whereas supplementation trials may be better suited for examining therapeutic effects in specific clinical populations(Reference Liao, Xie and Zhang7,Reference Deane, Jimoh and Biswas28) . The consistency of our findings with those of other observational studies, combined with the limitations of short-term supplementation trials in addressing long-term dietary patterns, suggests that both research approaches contribute valuable but distinct insights into the relationship between n-3 fatty acids and mental health.
This study has notable strengths, including a large, nationally representative sample with standardised assessment methods; detailed n-3 fatty acid assessment using the United States Department of Agriculture Food and Nutrient Database for Dietary Studies; examination of individual fatty acids; comprehensive adjustment for confounders; use of survey-weighted analyses to account for complex sampling design and consistency across sensitivity analyses. However, several important limitations must be considered when interpreting these findings. First, the cross-sectional design of the study did not allow for the establishment of causality. The temporal relationship between n-3 intake and depression cannot be determined, and reverse causation remains possible (e.g., depression may influence dietary choices or appetite). Second, dietary intake was assessed using 24-h recalls, which reflect short term rather than habitual dietary consumption. Fatty acid intake varies substantially day-to-day, and two recalls may not adequately capture the long-term patterns. This is particularly relevant for n-3 fatty acids that are consumed episodically (e.g., fish). Measurement error in n-3 intake assessment would likely bias the results towards the null, although some error may remain. Future studies integrating dietary data with erythrocyte or plasma n-3 biomarkers may better distinguish true associations from exposure misclassification. Third, dietary fatty acid intake did not include supplementation. While we controlled for supplement use as a covariate, total n-3 exposure (dietary + supplements) may have been underestimated in our primary exposure variable. However, sensitivity analyses excluding supplement users yielded similar results, suggesting that this limitation did not substantially affect our findings. Fourth, we were unable to control for the use of antidepressant medications. The NHANES 2021–2023 prescription medication files do not allow for the reliable classification of antidepressant use relative to the PHQ-9 symptom timing. This represents a critical unmeasured confounder, as individuals taking antidepressants would be expected to have higher depression severity scores (if the medication is ineffective) or lower scores (if the medication is effective). The inability to stratify by treatment status or adjust for medication use substantially limited causal inference from these findings. Fifth, residual confounding is possible, despite adjusting for multiple confounders. Unmeasured factors such as overall diet quality, stress, social support and genetic factors could influence both n-3 intake and depression risk. Sixth, depression was assessed using the PHQ-9, a screening tool, rather than a clinical diagnosis. Whilst well-validated, it may not capture all depression aspects or distinguish subtypes that might respond differently to n-3 fatty acids. Finally, our findings may not generalise to populations with clinical depression, specific depression subtypes or individuals with very low n-3 status.
These findings suggest an inverse association between dietary n-3 intake, particularly EPA, and depression severity in USA adults. However, the cross-sectional design and potential for unmeasured confounding factors limit causal inference. The observed associations may reflect shared lifestyle or socio-economic factors rather than the direct biological effects of n-3 fatty acids. The persistence of associations after comprehensive adjustment suggests potential independence from measured confounders, although unmeasured confounding remains possible. These findings do not support population-level recommendations for n-3 supplementation for depression prevention, given the limited evidence from randomised controlled trials. However, these findings are consistent with dietary guidelines promoting fish consumption as part of a healthy dietary pattern. Future research should focus on longitudinal studies that establish temporal relationships and account for changes in n-3 intake over time. Studies incorporating objective biomarkers of n-3 status would address dietary assessment limitations and provide more accurate exposure characterisation. Research examining effect modification by depression subtype, n-3 status, genetic factors or inflammatory markers may help identify the subgroups most likely to benefit from n-3 interventions. Additionally, studies examining the role of dietary patterns rich in n-3 sources (e.g., Mediterranean-style diets) may provide insights into the broader context in which n-3 fatty acids influence mental health outcomes.
Conclusion
In this nationally representative cross-sectional study, dietary long-chain n-3 fatty acid intake was inversely associated with depression severity after comprehensive covariate adjustment (OR 0·865 per 1 sd increase, 95 % CI 0·761, 0·983, P = 0·026). EPA showed a particularly strong inverse association (OR 0·907 per 1 sd increase, P = 0·045). However, the cross-sectional design and potential for unmeasured confounding, particularly by the use of antidepressant medication, limit causal inference. Longitudinal studies with biomarker measurements are needed to establish temporal relationships and further elucidate this relationship.
Acknowledgements
The authors thank the participants and staff of the National Health and Nutrition Examination Survey.
This research did not receive any specific grants from any funding agencies in the public, commercial or not-for-profit sectors.
J. V. V: Conceptualisation, data curation, statistical analysis, manuscript writing and editing. G. M-V: Methodology development, statistical modeling guidance, manuscript review and editing. M. S: Statistical consulting, results interpretation, manuscript editing and reviewing. H. W: Supervision, manuscript editing and critical revision of the discussion and conclusions. M. D: Manuscript proofreading, figure generation and data analysis. S. V. V: Principal investigator, study supervision, final manuscript review and approval. All authors contributed to the development and revision of the manuscript and approved the final version for submission.
The authors declare no conflict of interest.
NHANES data are publicly available at https://www.cdc.gov/nchs/nhanes/

 Open access