


Diabetes mellitus is a metabolic syndrome where pancreatic β-cells fail to meet the body’s need for insulin with resultant hyperglycaemia and increased risk of diabetic complications. The WHO recognised diabetes mellitus as the world’s fastest growing metabolic disorder. Type 1 diabetes is the result of total or near-total β-cell destruction, whereas type 2 diabetes mellitus (T2DM) is the result of β-cell dysfunction and insulin resistance. About 90 % of diabetic patients suffer from T2DM. This condition is associated with the alterations in the metabolism of lipids, carbohydrates and proteins(Reference Brand-Miller, McMillan-Price and Steinbeck1), which causes multiple complications including CVD(Reference Peters, Huxley and Woodward2), retinopathy(Reference Arzoo, Chattopadhyay and Banerjee3), neuropathy, cognitive decline(Reference Whitmer, Karter and Yaffe4), nephropathy and end-stage renal disease(Reference Arzoo, Chattopadhyay and Banerjee3).
T2DM treatments include diet together with either a single or combination of oral anti-hyperglycaemic agents, to manage dysglycaemia(Reference Simo and Hernandez5,Reference Ghadge and Kuvalekar6) . Although advances have been made recently in the treatment options to achieve better glycaemic control, they are often expensive and associated with notable adverse effects(Reference Stein, Lamos and Davis7,Reference Singh and Dwivedi8) . This focuses attention particularly in poorer countries towards herbal therapy and dietary supplements as alternative approaches to the mainstream medical treatment of T2DM. Unlike contemporary treatment, herb-based medicines are entirely natural; they possess very few adverse effects and are generally affordable(Reference Naja, Alameddine and Itani9). It has been reported that nearly 30–76 % of T2DM patients from different countries are using herbal medicines(Reference Medagama, Bandara and Abeysekera10,Reference Lunyera, Wang and Maro11) and that this approach is managing T2DM with safety(Reference Jung, Park and Lee12).
Over the last decades, functional foods received attention as a potential source of useful bioactive protein hydrolysates and peptides that have health benefits and reduce the risk of disease(Reference Ji, Han and Zhang13). In this way, many aquatic species have been studied with the generation of new and useful bioactive peptide sources. For instance, the eukaryotic microalgae and prokaryotic cyanobacteria (often called blue-green algae) utilisation in the food industry has become globally popular(Reference Ibanez and Cifuentes14,Reference Shahidi and Ambigaipalan15) . Edible microalgal and cyanobacterial proteins have been established as suitable precursors for the production of biologically active peptides(Reference Ibanez and Cifuentes14). Thus, a series of peptides isolated from microalgal or cyanobacterial hydrolysates have been demonstrated to exhibit desirable bioactivities, such as antioxidative, anticancer, anti-inflammatory and antihypertensive properties(Reference Ji, Han and Zhang13,Reference Sheih, Fang and Wu16–Reference Samarakoon, O-Nam and Ko18) .
Spirulina platensis is a unicellular cyanobacterium belonging to the Cyanophyceae class, Oscillatoriaceae family(Reference Pankaj19). This organism (cyanobacterium) is characterised by spiral chains of the cells enclosed in a thin sheath. It contains very potent naturally occurring antioxidants and free radical scavenging agents(Reference Hosseini, Khosravi-Darani and Mozafari20). S. platensis is non-toxic, bioavailable, and is believed to provide significant multiorgan protection against many drugs and chemically induced toxic assaults(Reference Abdel-Daim, Abuzead and Halawa21). Active constituents exhibit anti-inflammatory, neuroprotective, hepatoprotective, immunomodulatory and anticancer activities(Reference Deng and Chow22). A recent animal study reported potential anti-diabetic effects of S. platensis, but the mechanisms underlying such effects are unknown(Reference Oriquat, Ali and Mahmoud23–Reference Nasirian, Dadkhah and Moradi-Kor25). In this paper, we have made a detailed study of effects of S. platensis on pancreatic insulin release, dipeptidyl peptidase IV (DPP-IV) inhibition and various gastrointestinal (GI) tract actions to elucidate the mechanism and therapeutic potential of S. platensis for improvement of diabetes control.
Materials and methods
Plant material and preparation of ethanol extract
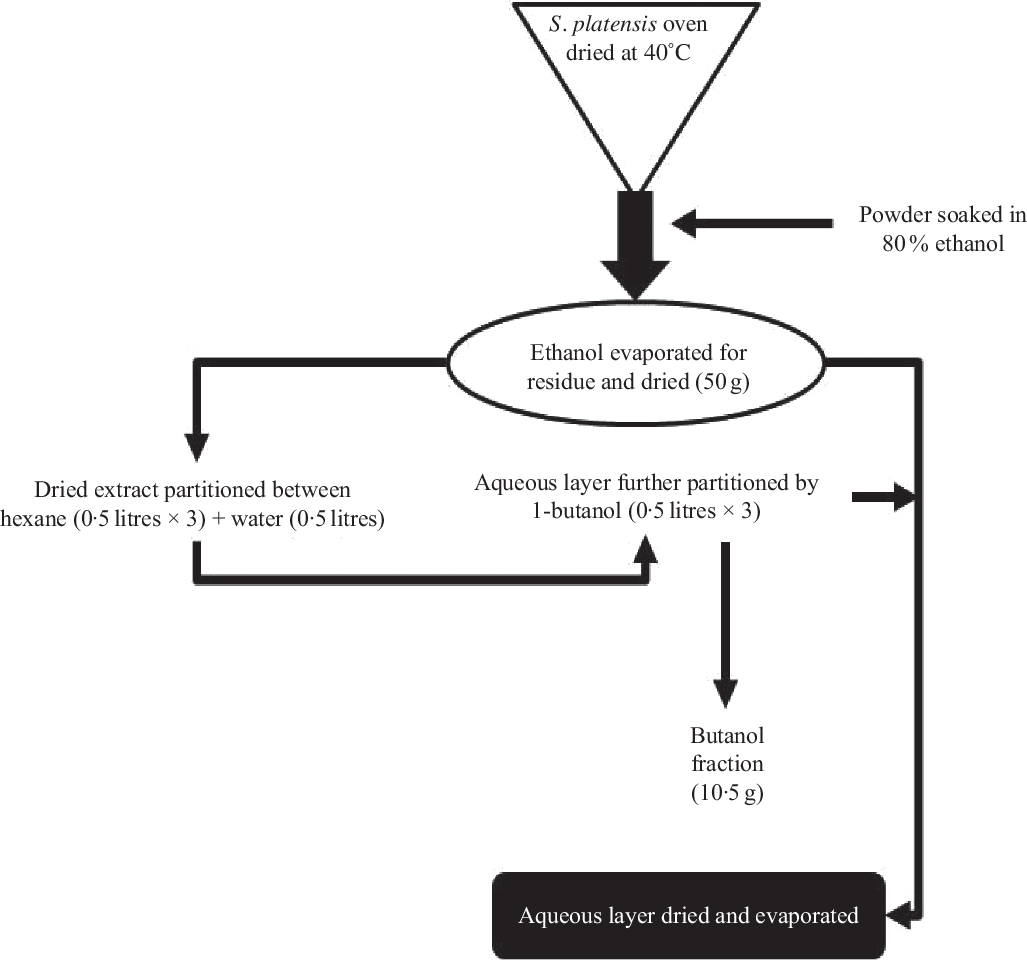
S. platensis was purchased from Bangladesh Council of Scientific and Industrial Research, Dhaka, Bangladesh and was authenticated by a botanical taxonomist. A voucher specimen was deposited in the Bangladesh National Herbarium (Mirpur, Dhaka). The whole plants were dried at 40°C (oven) and processed into fine powder by a cyclotec grinding machine. The powder (2 kg) was extracted with 80 % ethanol (10 litres) in a conical flask and put into an orbital shaker (550 rpm, 48–72 h). The extract was filtered using a Whatman filter paper, and ethanol was removed using a rotary evaporator (Fig. 1). A Varian 801 LY-3-TT freeze dryer (Varian) was used to freeze-dry the extract which was stored at 4°C until used.
Schematic diagram of preparation of ethanol extract and butanol partition fraction of Spirulina platensis.
Preparation of butanol fraction of Spirulina platensis
According to the previously described method(Reference Hannan, Marenah and Ali26), the ethanol extract (50 g) was partitioned into hexane (0·5 litres × 3) and water (0·5 litres). Hexane fraction was separated, and soluble material (15 g) was isolated after evaporation to dryness. The water layer was additionally partitioned using 1-butanol (0·5 litres × 3), and soluble materials of 1-butanol (10·5 g) were obtained after evaporation to dryness. The leftover watery portion was further concentrated using a rotary evaporator, and the end product was dried (20 g) using a freeze dryer and stored in a refrigerator at 4°C until used (Fig. 1). The ethanol extract and butanol fraction were analysed for bioactivity in the present studies.
Insulin secretion from isolated islets and β-cell lines
The effects of S. platensis on insulin release from BRIN-BD11 cells and isolated mouse islets were assessed as described previously(Reference Hannan, Marenah and Ali27). A range of concentrations of plant extract or butanol fraction or known modulators of insulin secretion were incubated with BRIN-BD11 cells in the presence or absence of glucose (1·1, 5·6 or 16·7 mm) during 40- or 20-min incubation at 37°C. Islets were isolated from the pancreas of NIH Swiss mice(Reference Hannan, Marenah and Ali27). Groups of ten islets were cultured for 24–48 h in Roswell Park Memorial Institute (RPMI) media prior to pre-incubation in Krebs-Ringer bicarbonate (KRB) buffer at 1·4 mm glucose for 60 min. Test incubations were performed in the presence of 16·7 mm glucose for 60 min. After incubation, the supernatants were collected and stored at –20°C until analysed by insulin radioimmunoassay(Reference Flatt and Bailey28).
Insulin secretion from perfused pancreas
Long-Evans male rats (180–250 g body weight (b.w.)) were anaesthetised with sodium-pentobarbital (50 mg/kg, intraperitoneal), and the pancreas was isolated and perfused at 37°C according to the method of Giroix et al. (Reference Giroix, Portha and Kergoat29). KRB buffer supplemented with 1·25 g/l bovine serum albumin and 40 g/l dextran T70 and 2·8- or 11·2-mm glucose. A mixture of O2–CO2 (95:5) was continuously used to gas the perfusate. The composition of the perfusate was changed after the first 20 min of equilibration as indicated in Fig. 3. Samples were stored at –20°C prior to measurement of insulin using ELISA kits supplied by Crystal Chem.
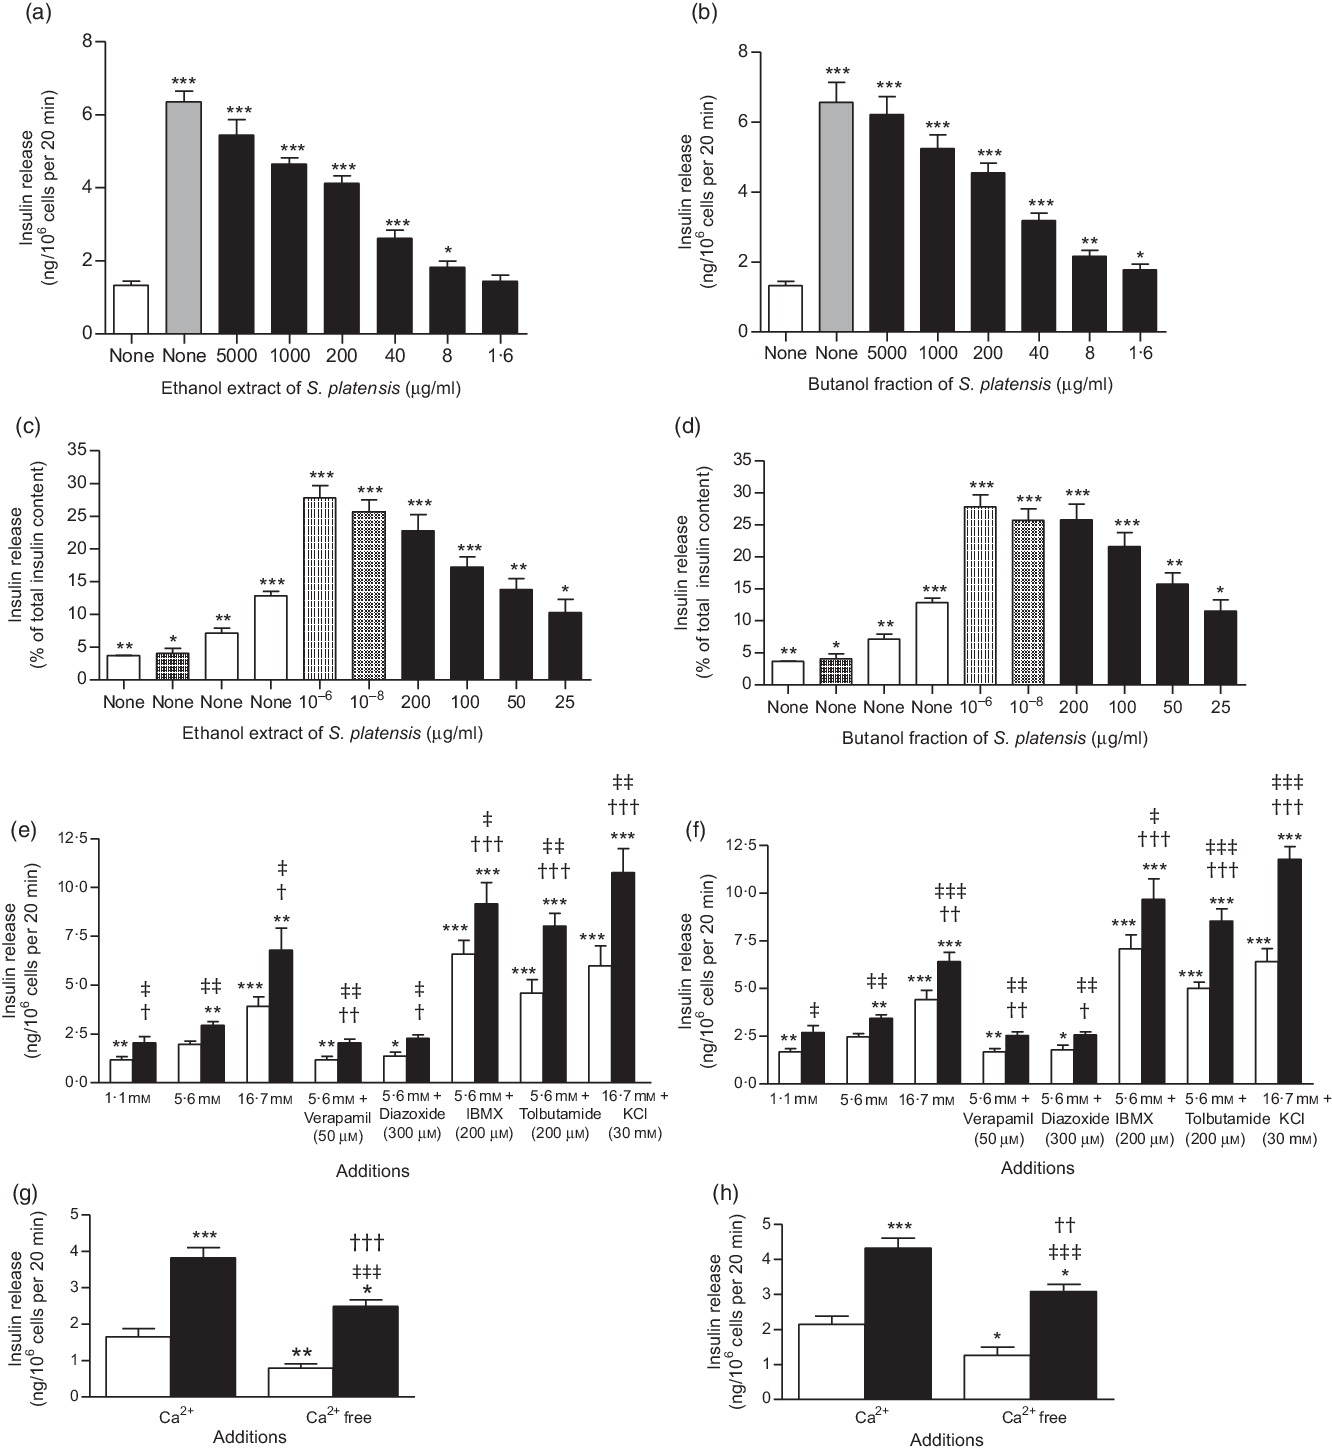
Effects of ethanol extract and butanol fraction of Spirulina platensis on insulin release from (a and b) BRIN-BD11 cells, (c and d) islets of Langerhans and (e–h) BRIN-BD11 cells in the presence of established stimulators or inhibitors of insulin secretion. Values are means with their standard errors, n 8 and 4 for insulin release. * P < 0·05, ** P < 0·01, *** P < 0·001 compared with 5·6 and 16·7 mm glucose alone. † P < 0·05, †† P < 0·01 and ††† P < 0·001 compared with 5·6 mm glucose in the presence of the extract or fraction. ‡ P < 0·05, ‡‡ P < 0·001, ‡‡‡ P < 0·001 compared with respective incubation in the absence of the extract or fraction. (a) ![]() , 5·6 mm glucose;
, 5·6 mm glucose; ![]() , 5·6 mm glucose + 10 mm alanine;
, 5·6 mm glucose + 10 mm alanine; ![]() , 5·6 mm glucose + ethanol extract (μg/ml). (b)
, 5·6 mm glucose + ethanol extract (μg/ml). (b) ![]() , 5·6 mm glucose;
, 5·6 mm glucose; ![]() , 5·6 mm glucose + 10 mm alanine;
, 5·6 mm glucose + 10 mm alanine; ![]() , 5·6 mm glucose + butanol fraction (μg/ml). (c)
, 5·6 mm glucose + butanol fraction (μg/ml). (c) ![]() , 1·4 mm glucose;
, 1·4 mm glucose; ![]() , 5·6 mm glucose;
, 5·6 mm glucose; ![]() , 16·7 mm glucose;
, 16·7 mm glucose; ![]() , 10 mm alanine;
, 10 mm alanine; ![]() , 16·7 mm glucose + glucagon-like peptide 1 (m);
, 16·7 mm glucose + glucagon-like peptide 1 (m); ![]() , 16·7 mm glucose + ethanol extract (μg/ml). (d)
, 16·7 mm glucose + ethanol extract (μg/ml). (d) ![]() , 1·4 mm glucose;
, 1·4 mm glucose; ![]() , 5·6 mm glucose;
, 5·6 mm glucose; ![]() , 16·7 mm glucose;
, 16·7 mm glucose; ![]() , 10 mm alanine;
, 10 mm alanine; ![]() , 16·7 mm glucose + glucagon-like peptide 1 (m);
, 16·7 mm glucose + glucagon-like peptide 1 (m); ![]() , 16·7 mm glucose + butanol fraction (μg/ml). (e)
, 16·7 mm glucose + butanol fraction (μg/ml). (e) ![]() , Glucose alone;
, Glucose alone; ![]() , glucose + ethanol extract (40 µg/ml). (f)
, glucose + ethanol extract (40 µg/ml). (f) ![]() , Glucose alone;
, Glucose alone; ![]() , glucose + butanol fraction (40 µg/ml). (g)
, glucose + butanol fraction (40 µg/ml). (g) ![]() , Glucose (5·6 mm);
, Glucose (5·6 mm); ![]() , glucose (5·6 mm) + ethanol extract (40 µg/ml). (h)
, glucose (5·6 mm) + ethanol extract (40 µg/ml). (h) ![]() , Glucose (5·6 mm);
, Glucose (5·6 mm); ![]() , glucose (5·6 mm) + butanol fraction (40 µg/ml).
, glucose (5·6 mm) + butanol fraction (40 µg/ml).
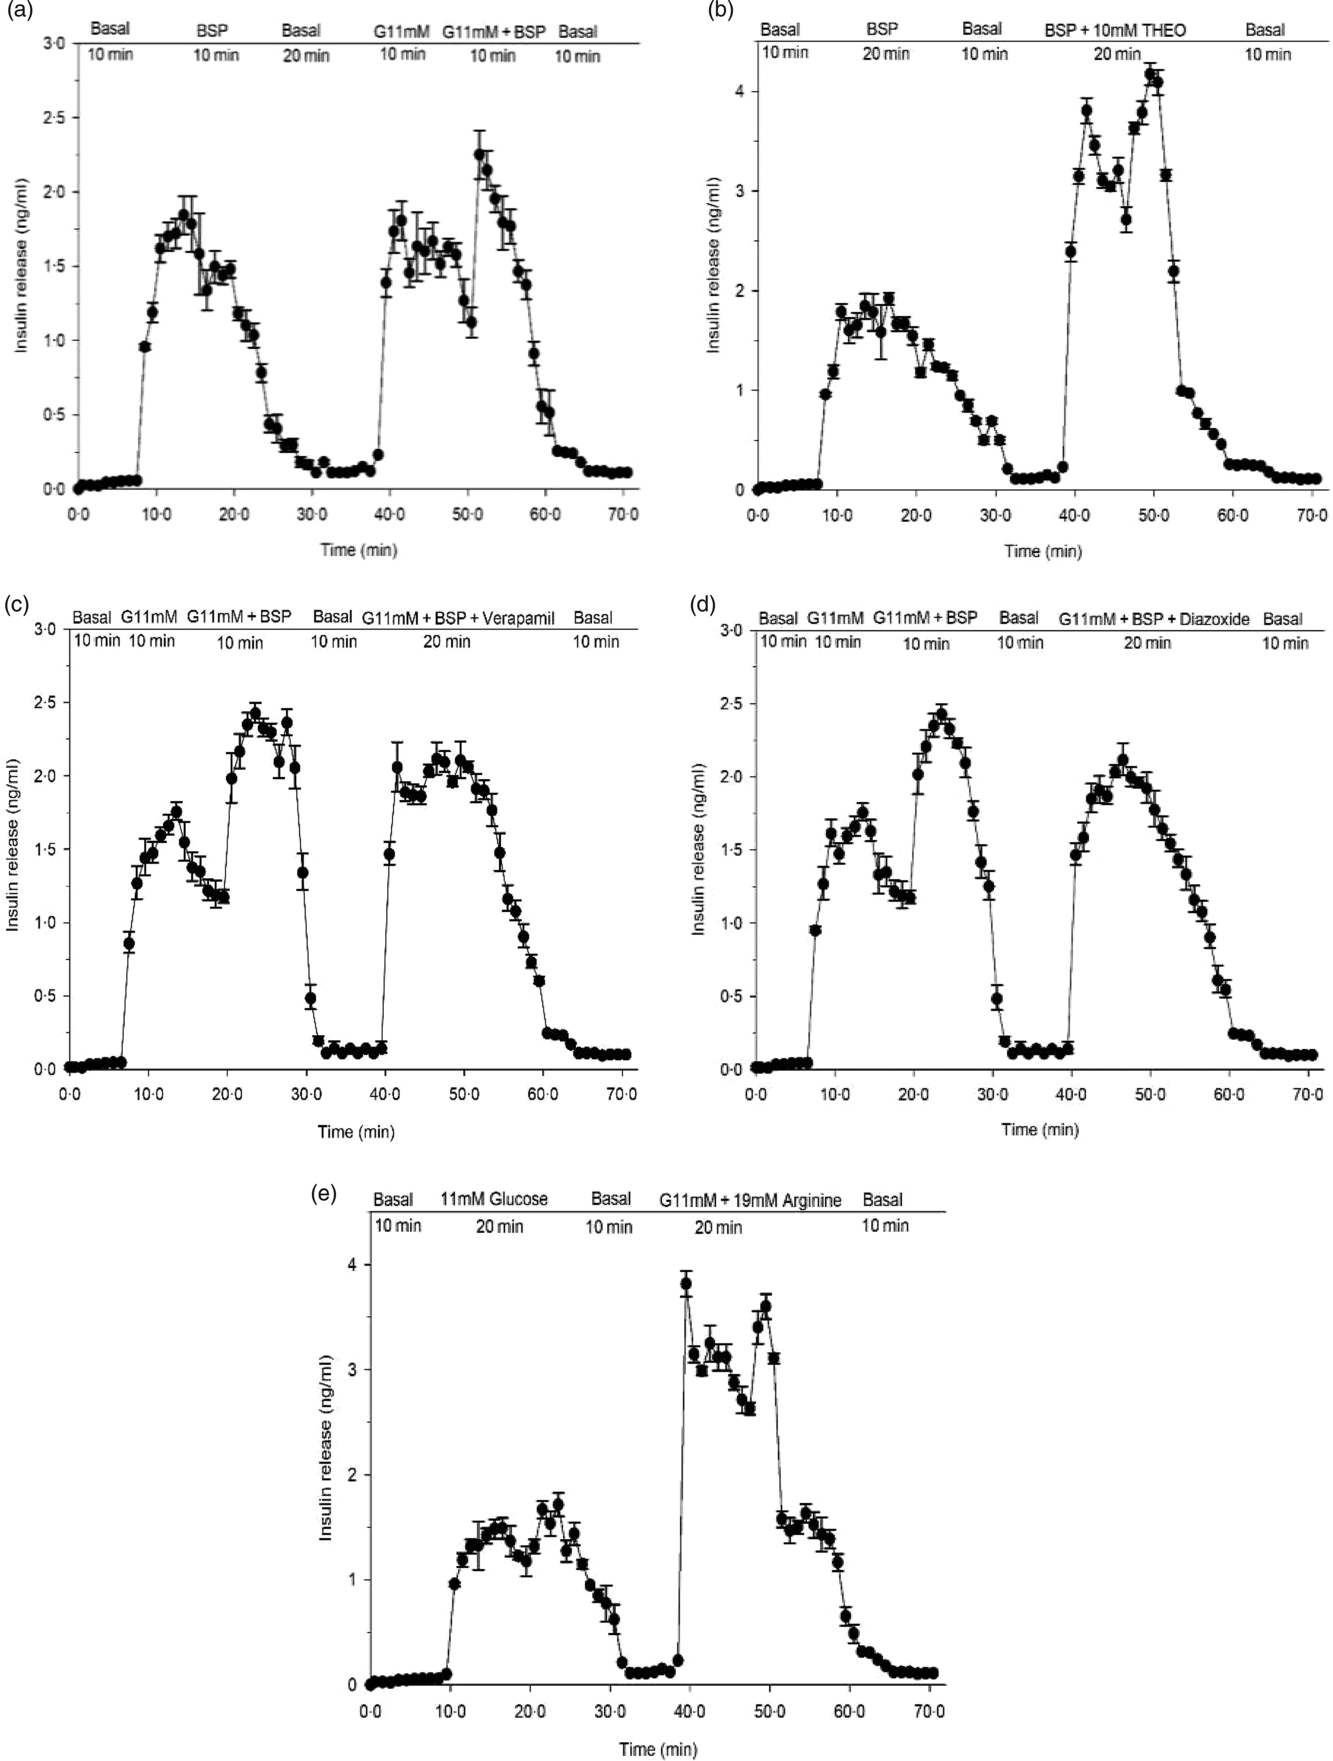
Effects of butanol fraction of Spirulina platensis on insulin release from perfused rat pancreas in the (a) absence or (b) presence of theophylline (10 mm), (c) verapamil (50 µm) and (d) diazoxide (8 mm) at 11 mm glucose and (e) control group: arginine (19 mm) alone. Values are means with their standard errors, n 4. Pancreas was perfused (1 ml/min) with butanol fraction of S. platensis at a dose of 5 mg/ml in the presence or absence of theophylline (10 mm), verapamil (50 µm) and diazoxide (8 mm) at 11 mm glucose and control group: arginine (19 mm) alone. The glucose concentration was raised from the basal level of 2·8 mm (basal) to 11 mm. G, glucose, THEO, theophylline; BSP, butanol fraction of S. platensis.
Membrane potential and intracellular calcium ([Ca2+]i)
The effects of S. platensis on membrane potential and intracellular Ca were measured using BRIN-BD11 cell monolayers as previously described(Reference Abdel-Wahab, Marenah and Flatt30,Reference Miguel, Patterson and Abdel-Wahab31) . Cells were seeded onto ninety-six-well plates (black-walled, clear-bottomed microplates, Greiner) and washed with KRB buffer prior to the addition of FLEX assay reagents (Molecular Devices). Effects of introducing extract or butanol fraction and other reagents were monitored fluorometrically using Flex Station 3 (Molecular Devices) at wavelengths of 450 and 525 nm, respectively.
Dipeptidyl peptidase IV activity
Effects of S. platensis on DPP-IV enzyme activity were determined using a fluorometric method. Enzyme activity was determined using ninety-six-well black-walled, clear-bottomed microplates (Greiner) containing 8 mU/ml of DPP-IV enzyme and 200 µm of substrate (Gly-Pro-AMC) as described previously(Reference Duffy, Green and Irwin32). Flex Station 3 (Molecular Devices) was used to measure the changes in fluorescence with an excitation and emission at 370 and 440 nm with 2·5 nm slit width, respectively.
Induction of experimental diabetes
Long-Evans male rats (150–200 g) were purchased from the International Center for Diarrheal Disease Research, Bangladesh. Standard environmental conditions with temperature of 22 (sem 5)°C, relative humidity of 55–65 % and 12 h light–12 h dark cycle were maintained. Food and fresh water were supplied ad libitum. The composition of the pelleted diet (metabolisable energy of 11·8 MJ/kg per 2820 kcal/kg) was described previously(Reference Hannan, Ali and Khaleque33). T2DM was induced in neonatal rats at 2 d of age by a single intraperitoneal injection of streptozotocin (90 mg/kg b.w.). T2DM rats were selected for the experiments at 12 weeks of age after an oral glucose tolerance test. Animals exhibiting blood glucose levels of 8–12 mmol/l were chosen as type 2 diabetes rats. The ‘Principles of Laboratory Animals Care’ (National Institutes of Health Publication no. 86-23, revised 1985) and the UK Animals Scientific Procedures Act 1986 were followed.
Residual gut sucrose content
The effects of S. platensis on sucrose digestion and absorption from the GI tract were assessed after the oral administration of sucrose solution (2·5 g/kg b.w.) to 24-h fasted T2DM rats with or without butanol fraction of S. platensis (250 mg/kg, b.w.). Blood samples were collected from the tip of the tail prior to and after 30, 60, 120 and 240 min for glucose analysis. To measure the unabsorbed sucrose content of the GI tract, rats were killed at the same time points and the tract was excised and divided into six parts: the stomach, the upper (20 cm), middle and lower (20 cm) of the small intestine, the caecum and the large intestine. Each segment was washed with acidified ice-cold saline and centrifuged for 10 min at 3000 rpm (1000 g ). The resulting supernatant was boiled for 2 h to hydrolyse the sucrose, and pH was adjusted (7·0–7·4) by adding NaOH. The concentration of serum glucose and the total amount of glucose liberated from GI tract were determined(Reference Goto, Yamada and Ohyama34).
Intestinal glucose absorption
The effects of S. platensis on intestinal glucose absorption were determined using an in situ intestinal perfusion technique(Reference Swintosky and Pogonowskawala35). Non-diabetic rats were fasted for 36 h followed by induction of anaesthesia with sodium pentobarbital (50 g/kg b.w.). Butanol fraction of S. platensis (5 mg/ml equal to 0·25 g/kg) dissolved in KRB buffer containing glucose (54 g/l) was infused via the rat pylori, and perfusate was collected at the end of ileum. The control group was treated with KRB buffer only in the presence of glucose. Perfusion of intestine was carried out at a constant rate of 0·5 ml/min for 30 min at 37°C. The results were expressed as the percentage of glucose absorbed, measured from the amount of glucose in solution before and after the perfusion of intestine.
Intestinal disaccharidase activity and gastrointestinal motility
Intestinal disaccharidase enzyme activity was determined as described previously(Reference Hannan, Ali and Khaleque33). Non-diabetic rats were fasted for 20 h followed by the oral administration of S. platensis (250 mg/kg) or water alone. The rats were killed after 1 h, and the small intestine was collected, cut longitudinally and rinsed with ice-cold saline. Volume was made up to 10 ml by adding saline (0·9 % NaCl), and the tissue was homogenised. Aliquots of the homogenate were incubated at 37°C in a 40 mm sucrose solution for 60 min. Disaccharidase enzyme activity was measured as µmol/mg protein per h. Acarbose (200 mg/kg), an established disaccharidase enzyme inhibitor, was used as a control. GI motility was measured according to the method of Chatterjee(Reference Chatterjee36). The butanol fraction of S. platensis (250 mg/kg b.w.) or water (10 ml/kg) was administered orally to non-diabetic rats. One hour later, a suspension of BaSO4 milk (10 % BaSO4 and 0·5 % carboxymethyl cellulose; w/v) was administered orally. Rats of both groups were killed after 15 min of administration of BaSO4. The length travelled by BaSO4 milk was calculated and expressed as the percentage of the total distance of the small intestine (pylorus to the ileo-caecal junction). The established drugs: Loperamide (5 mg/kg b.w.) and Sennoside (10 mg/kg b.w.) were used as positive controls.
Glucose tolerance and chronic effects in type 2 diabetic rats
The effects of butanol fraction of S. platensis on oral glucose tolerance were measured after fasting the T2DM rats for 12 h. Blood samples were obtained from the cut tip of the tail at given time points (0, 30, 60, 120 and 180 min) before and after oral administration of glucose (2·5 g/kg b.w.) with (Treated group) or without (Control group) S. platensis (250 mg/kg). The long-term effects of S. platensis on glucose homoeostasis in T2DM rats were measured by twice daily administration (oral gavage) of butanol fraction (250 mg/kg) for 28 d. Control rats received oral administration of water alone. Blood samples were collected, and serum was separated by centrifugation and stored at –20°C until measurement of glucose, insulin and lipid profiles. Glucose and insulin were measured via the glucose oxidase-phenol amino phenazone (GOD-PAP) method (glucose kit, Randox™) and rat insulin ELISA Kit (Crystal Chem™), respectively.
Effects of Spirulina platensis on liver glycogen content
The effects of Spirulina platensis treatment for 28 d on liver glycogen content were determined as previously described(Reference Vies37). Briefly, the weight of liver was measured and finely homogenised with 10 ml of 5 % trichloroacetic acid. The precipitated proteins were filtered, and glycogen content was analysed from the clear filtrate. One millilitre of the filtrate was mixed with 2 ml of 10 N KOH and boiled for 1 h at 100°C. After cooling, 1 ml of glacial acetic acid was added and the solution was made up to 10 ml by adding deionised water. Then, 1 ml of this solution was mixed on ice with 2 ml of anthrone solution (100 mg anthrone dissolved in 50 ml of concentrated H2SO4); this mixture was boiled for additional 10 min at 100°C and then cooled. Aliquots were taken in a microplate reader, and the absorbance was measured at 490 nm.
Insulin content in pancreases
Rats were killed after 28 d treatment with S. platensis (250 mg/kg), and the pancreatic tissues were dissected, weighed, homogenised and extracted in (10 ml) acid alcohol solution (23·5 % distilled water, 75 % ethanol and 1·5 % HCl 12 mm). After centrifugation, the supernatant samples were stored at –20°C. Pancreatic insulin level was determined using rat insulin ELISA Kit (Crystal ChemTM).
Chemical characterisation by reversed-phase HPLC
Crude extract was re-dissolved in solvent A (0·12 % (v/v) trifluoroacetic acid (TFA)–water) and purified by reversed-phase HPLC. The prepared crude extract solution was injected in to a Vydac 218TP1022 (C-18) reversed-phase HPLC column (Grace) equilibrated with 0·12 % (v/v) TFA/water at a flow rate of 1·0 ml/min. The concentration of acetonitrile within the eluting solvent was expanded using linear gradients 0 to 20 % over 10 min and to 70 % over a period of 25 min. The wavelengths of 254 and 360 nm were used to measure the absorbance.
Statistical analysis
Statistical analyses were performed by using SPSS for windows (version 20). The results are represented as mean values with their standard errors. Data were analysed using repeated-measures ANOVA followed by Dunnett’s adjustment and unpaired t test where applicable. P<0·05 was considered as the level of significance.
Results
Effects of Spirulina platensis on insulin secretion from clonal pancreatic β-cells (BRIN BD11)
Fig. 2(a) and (b) shows the effects of ethanol extract and butanol fraction of S. platensis on insulin secretion from BRIN-BD11 cells. Alanine (10 mm) was used as a positive control. Both extract and fraction (1·6–5000 µg/ml) stimulated insulin release concentrations dependently compared with control (5·6 mm glucose). Higher concentrations (1000–5000 µg/ml) also induced insulin release but were associated with decreased cell viability. Further tests revealed that the insulinotropic effects of a non-toxic dose of S. platensis (40 µg/ml) were significantly enhanced in the presence of 16·7 mm glucose (P < 0·001), isobutyl-methyl xanthine (P < 0·001) and tolbutamide (P < 0·001, Fig. 2(e) and (f)). The phosphodiesterase inhibitor isobutyl-methyl xanthine and tolbutamide were used to modulate the glucose-induced cAMP production and insulin secretion. In contrast, the effects of both ethanol extract and butanol fraction of S. platensis were inhibited by 40–50 % by diazoxide (P < 0·05) and verapamil (P < 0·01, Fig. 2(e) and (f)). Both diazoxide, a KATP channel opener and verapamil, voltage-gated Ca channel blocker inhibited pancreatic insulin secretion by reducing intracellular Ca2+ influx. The ethanol extract and butanol fraction also maintained an ability to increase insulin secretion in cells depolarised with 30 mm KCl (P < 0·001, Fig. 2(e) and (f)). Absence of Ca2+ (Fig. 2(g) and (h)) significantly inhibited but did not totally abolish insulin secretion induced by S. platensis.
Effects of Spirulina platensis on insulin secretion from isolated islets
The ethanol extract and butanol fraction significantly increased insulin secretion from isolated mouse islets compared with 16·7 mm glucose alone (P < 0·05–P < 0·001; Fig. 2(c) and (d)). Increasing the concentrations from 25 to 200 µg/ml resulted in 2- and 2·5-fold increase in insulin release compared with control (16·7 mm glucose); glucagon-like peptide 1 (10−6 and 10−8 m) and alanine (10 mm) were used in this experiment as positive control (Fig. 2(c) and (d)).
Effects of Spirulina platensis on insulin secretion from perfused pancreas
In a pilot study, the pancreas retained insulin secretory capacity during 70 min with exposure to glucose and arginine (Fig. 3(e)). Butanol fraction of S. platensis produced a significant (P < 0·001) biphasic increase in insulin release with a 20-fold elevation above the basal level (2·8 mm) (Fig. 3(a)). Subsequent exposure for 10 min to 11 mm glucose caused a sharp rise of insulin release from the basal level of 0·05–0·01 ng/ml to a peak of 2·4–1·5 ng/ml (P < 0·001). After adding butanol fraction to 11 mm glucose, a further enhancement in insulin release was noted (Fig. 3(a)), which opposed the decline in insulin release under the continuous exposure to 11 mm glucose alone. Theophylline (10 mm) is a methylxanthine derivative that inhibits cyclic nucleotide phosphodiesterase and increases the intracellular cyclic 3′,5′-AMP level. Addition of theophylline (10 mm) to butanol fraction increased insulin secretion further (Fig. 3(b)). As shown in Fig. 3(c) and (d), perfusion in the presence of verapamil and diazoxide at 11 mm glucose decreased insulin releasing activity of the butanol fraction by 20–30 %.
Effects of Spirulina platensis on membrane potential and intracellular calcium ([Ca2+]i) in the clonal BRIN-BD11 cell line
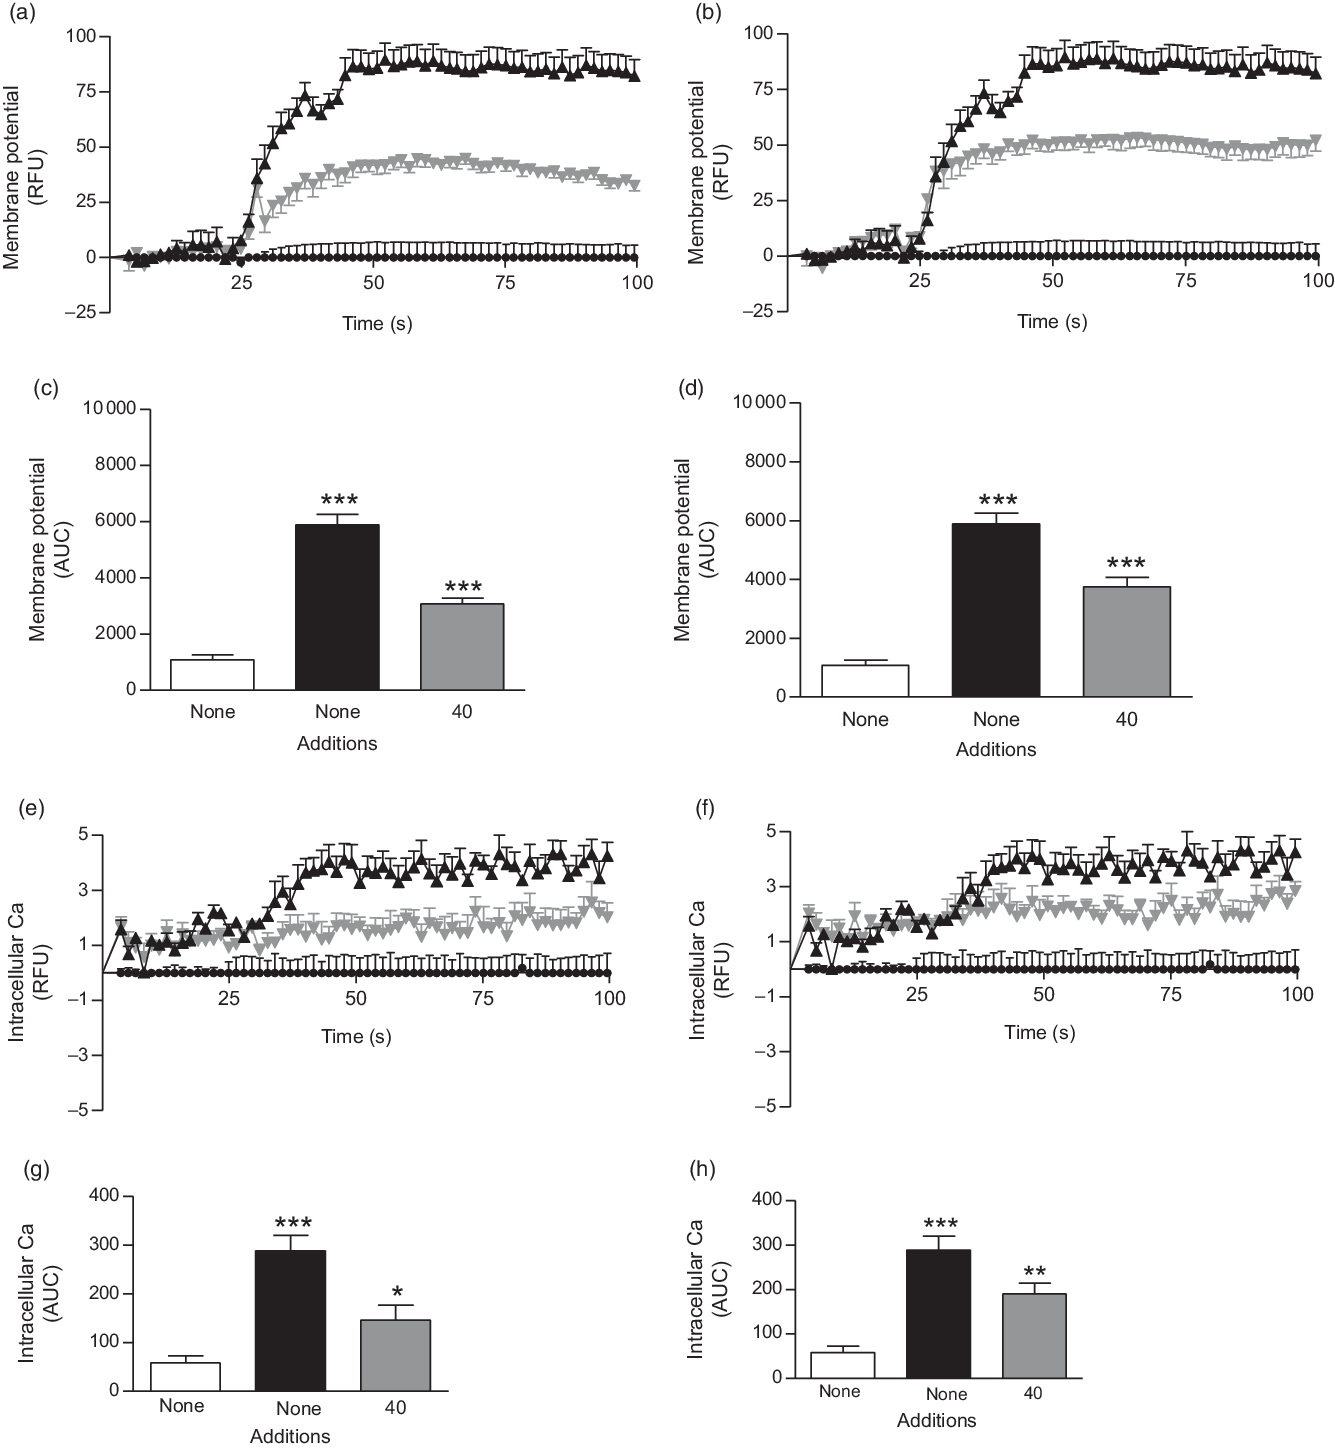
The ethanol extract and butanol fraction of S. platensis increased membrane potential and intracellular Ca ([Ca2+]i) at the presence of 5·6 mm glucose (P < 0·05; Fig. 4(a–h)) as compared with control (5·6 mm glucose alone). KCl (30 mm) and alanine (10 mm) were used as positive controls in this experiment.
Effects of ethanol extract and butanol fraction of Spirulina platensis on (a–d) membrane potential and (e–h) intracellular calcium in BRIN-BD11 cells expressed as relative fluorescence units (RFU) and respective AUC. Values are means with their standard errors, n 6 for membrane potential and intracellular calcium. *** P < 0·001 compared with 5·6 mm glucose alone. (a and c) ![]() ,
, ![]() , 5·6 mm glucose;
, 5·6 mm glucose; ![]() ,
, ![]() , 5·6 mm glucose + KCl (30 mm);
, 5·6 mm glucose + KCl (30 mm); ![]() ,
, ![]() , 5·6 mm glucose + ethanol extract (40 µg/ml). (b and d)
, 5·6 mm glucose + ethanol extract (40 µg/ml). (b and d) ![]() ,
, ![]() , 5·6 mm glucose;
, 5·6 mm glucose; ![]() ,
, ![]() , 5·6 mm glucose + KCl (30 mm);
, 5·6 mm glucose + KCl (30 mm); ![]() ,
, ![]() , 5·6 mm glucose + butanol fraction (40 µg/ml). (e and g)
, 5·6 mm glucose + butanol fraction (40 µg/ml). (e and g) ![]() ,
, ![]() , 5·6 mm glucose;
, 5·6 mm glucose; ![]() ,
, ![]() , 5·6 mm glucose + 10 mm alanine;
, 5·6 mm glucose + 10 mm alanine; ![]() ,
, ![]() , 5·6 mm glucose + ethanol extract (40 µg/ml). (f and h)
, 5·6 mm glucose + ethanol extract (40 µg/ml). (f and h) ![]() ,
, ![]() , 5·6 mm glucose;
, 5·6 mm glucose; ![]() ,
, ![]() , 5·6 mm glucose + 10 mm alanine;
, 5·6 mm glucose + 10 mm alanine; ![]() ,
, ![]() , 5·6 mm glucose + butanol fraction (40 µg/ml).
, 5·6 mm glucose + butanol fraction (40 µg/ml).
Effects of Spirulina platensis on dipeptidyl peptidase IV activity in vitro
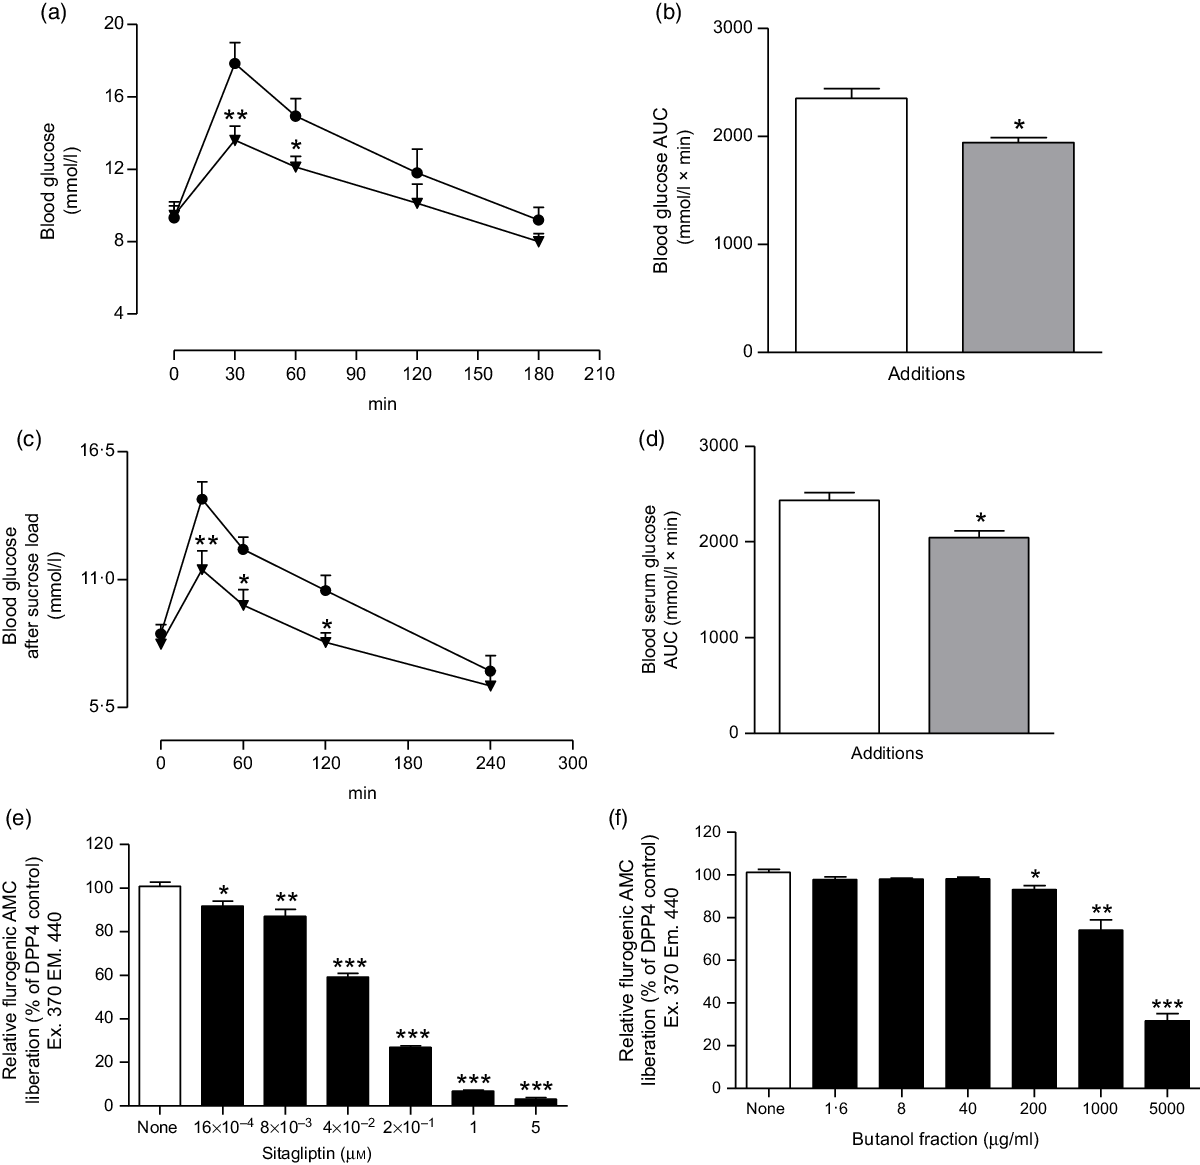
The butanol fraction significantly (P < 0·05, P < 0·01 and P < 0·001) inhibited the liberation of 7-amino-4-methylcoumarin, by 7–70 % at concentrations of 200–5000 µg/ml (Fig. 5(f)). Sitagliptin, as an established DPP-IV inhibitor, reduced DPP-IV activity by 10–97 % (P < 0·05, P < 0·01 and P < 0·001; Fig. 5(e)) at concentrations between 16 × 10−4 to 5 µm.
Effects of butanol fraction of Spirulina platensis on (a and b) glucose tolerance (GTT), (c and d) serum glucose after sucrose load (SGASL) in type 2 diabetic rats and (e and f) DPP-IV activity in vitro. Rats were fasted for 12 and 24 h and administered glucose or sucrose solution (2·5 g/kg body weight) by oral administration in presence or absence of butanol fraction of S. platensis (250 mg/kg body weight). Sitagliptin was used as established DPP-IV inhibitor. Values are means with their standard errors represented by vertical bars (n 6, for GTT and SGASL and n 3 for DPP-IV). * P < 0·05, ** P < 0·01 and *** P < 0·001 compared with control. (a and c) ![]() , Control;
, Control; ![]() , butanol fraction (250 mg/kg). (b and d)
, butanol fraction (250 mg/kg). (b and d) ![]() , Control;
, Control; ![]() , butanol fraction (250 mg/kg). (e)
, butanol fraction (250 mg/kg). (e) ![]() , Control;
, Control; ![]() , sitagliptin (µm). (f)
, sitagliptin (µm). (f) ![]() , Control;
, Control; ![]() , butanol fraction (µg/ml).
, butanol fraction (µg/ml).
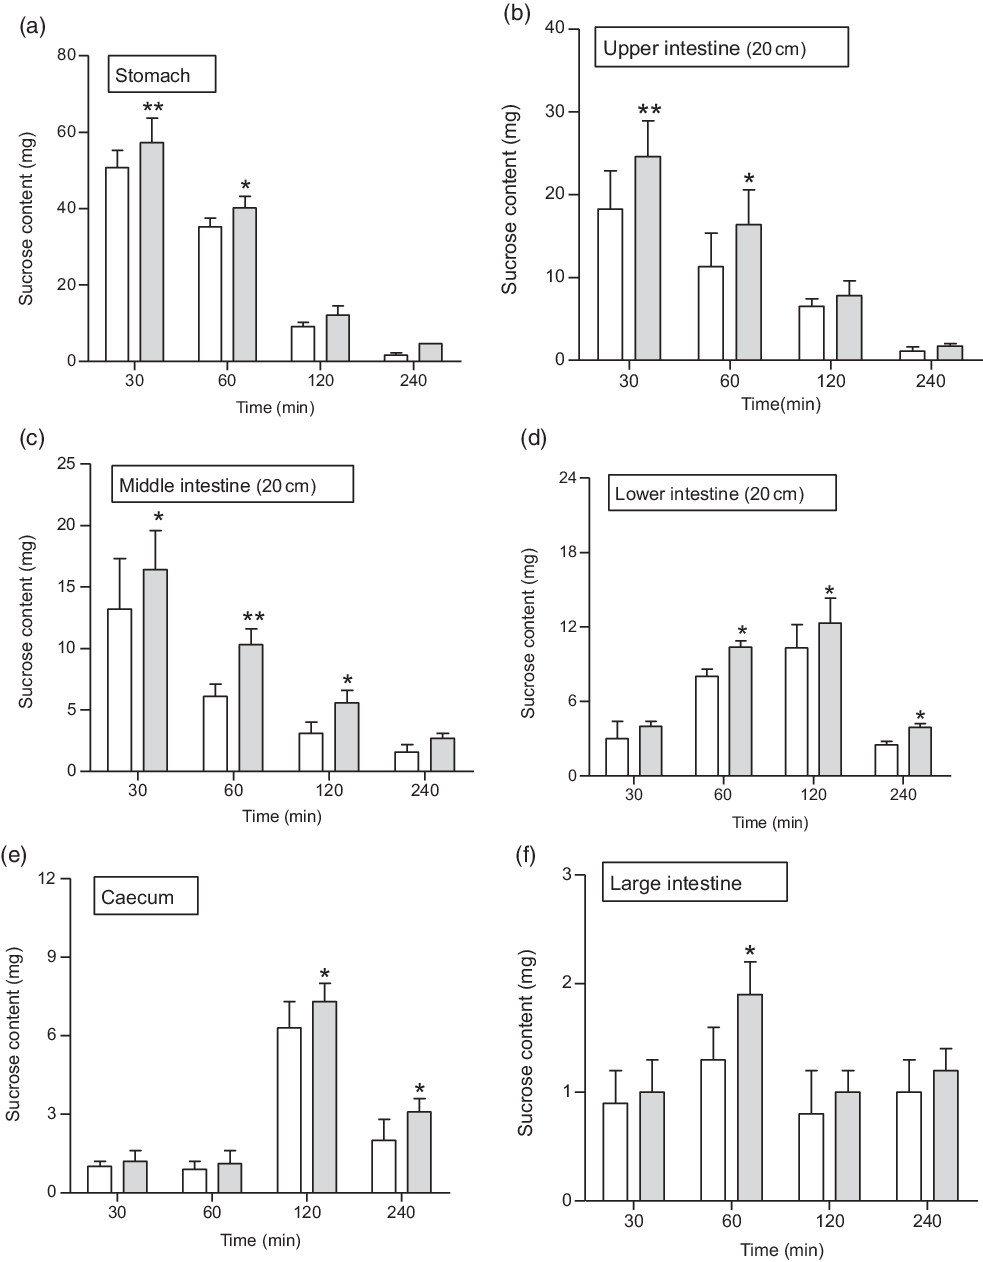
Effects of Spirulina platensis on unabsorbed sucrose content in the gut
At 1 h following sucrose load (2·5 g/kg b.w.), a significant (P < 0·05–0·01) amount of sucrose was measured in the stomach and the upper, middle, lower and large intestine (Fig. 6(a–f)). An extensive (P < 0·01) amount of sucrose found in the stomach, upper and middle intestine at 30 min, while at 2 h (P < 0·05), increased amounts of unabsorbed sucrose were measured in caecum and lower intestine. The administration of butanol fraction (250 mg/kg b.w.) with sucrose reduced sucrose absorption significantly (P < 0·01) after 30 min and up to 2 h (Fig. 6). At 4 h, sucrose content was almost nil throughout the GI tract, although a small fraction remained in the caecum and lower intestine, indicating rapid hydrolysis and absorption of sucrose in the upper part of the intestine (Fig. 6).
Effects of butanol fraction of Spirulina platensis on (a–f) gastrointestinal sucrose content after oral sucrose loading in type 2 diabetic rats. Type 2 diabetic rats were fasted for 24 h prior to the oral administration of sucrose solution (2·5 g/kg body weight) in the presence (treated group) or absence of (control group) butanol fraction of S. platensis (250 mg/kg body weight). Values are means with their standard errors represented by vertical bars (n 6). * P < 0·05 and ** P < 0·01 compared with type 2 diabetic control rats. (a–f) ![]() , Control;
, Control; ![]() , butanol fraction (250 mg/kg).
, butanol fraction (250 mg/kg).
Effects of Spirulina platensis on intestinal glucose absorption
During perfusion, the extent of glucose absorption in the intestine was almost consistent over 30 min. However, supplementation with butanol fraction significantly decreased intestinal glucose absorption (P < 0·05–P < 0·01) as illustrated in Fig. 7(a) and (b).
Effects of butanol fraction of Spirulina platensis on (a and b) intestinal glucose absorption, (c) disaccharidase enzyme activity and (d) gastrointestinal motility (by BaSO4 traversed) in non-diabetic rats. Rats were fasted for 36 h, and intestine was perfused with glucose (54 g/l) in the presence (treated group) or absence of (control group) butanol fraction of S. platensis (10 mg/ml). BaSO4 was administered at 60 min following oral feeding of S. platensis. Acarbose (200 mg/kg); and loperamide (5 mg/kg) and sennoside (10 mg/kg) were used as positive controls for determinations of disaccharidase activity and gastrointestinal motility, respectively. Values are means with their standard errors represented by vertical bars (n 8). * P < 0·05, ** P < 0·01 and *** P < 0·001 compared with controls. (a) ![]() , Control;
, Control; ![]() , butanol fraction (250 mg/kg). (b)
, butanol fraction (250 mg/kg). (b) ![]() , Control;
, Control; ![]() , butanol fraction (250 mg/kg). (c)
, butanol fraction (250 mg/kg). (c) ![]() , Control;
, Control; ![]() , butanol fraction (250 mg/kg);
, butanol fraction (250 mg/kg); ![]() , acarbose (200 mg/kg). (d)
, acarbose (200 mg/kg). (d) ![]() , Control;
, Control; ![]() , butanol fraction (250 mg/kg);
, butanol fraction (250 mg/kg); ![]() , loperamide (5 mg/kg);
, loperamide (5 mg/kg); ![]() , sennoside (10 mg/kg).
, sennoside (10 mg/kg).

Effects of Spirulina platensis on intestinal disaccharidase activity and gastrointestinal motility
Butanol fraction of S. platensis (250 mg/kg b.w.) did not affect disaccharidase enzyme activity (Fig. 7(c)). However, this fraction significantly promoted gastrointestinal motility (P < 0·05, Fig. 7(d)).
Acute and chronic effects of Spirulina platensis on glucose homoeostasis in type 2 diabetic rats
Oral administration of butanol fraction of S. platensis (250 mg/kg b.w.) together with glucose (2·5 g/kg b.w.) improved glucose tolerance at 30 and 60 min (P < 0·01–P < 0·05) in T2DM rats (Fig. 5(a) and (b)). In addition, S. platensis (250 mg/kg b.w.) treatment lowered serum glucose significantly after sucrose load (P < 0·05; Fig. 5(c) and (d)) at 60 and 120 min in T2DM rats.
Furthermore, twice daily oral administration of the butanol fraction of S. platensis (250 mg/kg b.w.) for 28 d significantly lowered serum glucose levels (P < 0·05) and increased serum insulin level (P < 0·05) compared with controls (Table 1). Pancreatic insulin and liver glycogen were increased (P < 0·05) as shown in Table 1. Measurement of lipid profile showed that the butanol fraction of S. platensis (250 mg/kg b.w.) increased HDL, while the LDL and total cholesterol were significantly decreased (P < 0·05–0·01; Table 1).
Long-term effects of the butanol fraction of Spirulina platensis on blood glucose, plasma insulin, pancreatic insulin content and other parameters in type 2 diabetic rats after a 28-d study† (n 8)
(Mean values with their standard errors)

* P < 0·05 and ** P < 0·01 compared with type 2 diabetic control rats.
† Butanol fraction of S. platensis (250 mg/kg body weight) or only saline (control) was administered orally to rats for 28 d.
Chemical characterisation by reversed-phase HPLC
The phytochemical screening of butanol fraction by HPLC (Fig. 8) revealed the presence of β-carotene, catechin and some other previously identified compounds in S. platensis such as zeaxanthin, astaxanthin, p-coumaric acid and apigenin(Reference Mendiola, Marin and Hernndez38,Reference Moor, Pieme and Biapa39) . The concentrations of nutritional chemical characterisation of S. platensis are listed in Table 2.
Representative HPLC profile of butanol fraction of Spirulina platensis using analytical C-18 column over the period of acetonitrile. The column was equilibrated with 0·1 % (v/v) trifluoroacetic acid/water at flow rate of 1·0 ml/min. The concentration of the eluting solution was raised using linear gradients from 0 to 20 % acetonitrile over 10 min, to 70 % over 25 min. Details of peaks corresponding to butanol fraction are presented in the chromatogram. UV detection was set at 254 and 360 nm, and 1 mg/ml sample was injected each run. Peaks 1–9 of unknown compounds were detected at different retention times (RT).

Major compounds identified by reversed-phase-HPLC of the butanol fraction of Spirulina platensis

RT, retention time.
Discussion
S. platensis has been reported recently to exhibit antihyperglycaemic effects, but the mechanism of action was not elucidated(Reference Oriquat, Ali and Mahmoud23–Reference Nasirian, Dadkhah and Moradi-Kor25). This study has examined the insulinotropic effects of S. platensis using the perfused rat pancreas, isolated mouse islets and the clonal BRIN-BD11 β-cell line. The results suggest that the anti-hyperglycaemic effects are partly mediated through stimulating the insulin secretion from pancreatic β-cells(Reference Hannan, Marenah and Ali27), which is further supported by observation of incremental increases in serum and pancreatic insulin after 28 d of chronic treatment.
Both the ethanol extract and butanol fraction dose-dependently enhanced insulin release from isolated islets and clonal BRIN-BD11 cells. The butanol fraction was more insulinotropic than the ethanol extract. Likewise, the butanol fraction exerted substantial insulin release from perfused rat pancreas. Non-toxic concentrations of S. platensis were used to examine mechanisms underlying stimulation of insulin secretion in the absence and presence of known modulators of β-cell function. Sulfonylureas are known to act by closing KATP channels, depolarising the plasma membrane, as induced by 30 mm KCl, and stimulating Ca2+ entry by activation of voltage-dependent Ca channels(Reference Hannan, Marenah and Ali26,Reference Boyd40) . S. platensis stimulated insulin release enhanced by tolbutamide and KCl (30 mm), suggesting its ability to potentiate insulin secretion via other pathways such as the adenylate cyclase/cAMP or the phosphatidylinositol pathway, or as a direct effect on exocytosis(Reference Hannan, Marenah and Ali26). S. platensis also clearly stimulated β-cells via its effects on Ca2+ ion channels. Thus, diazoxide, a KATP-channel opener(Reference Wang, Wang and Harvat41), inhibited the insulin-releasing effects of both the extract and fraction. This suggests that S. platensis closes KATP channels to induce insulinotropic action. Furthermore, the L-type voltage-dependent Ca2+ channel blocker, verapamil,(Reference Weinhaus, Poronnik and Cook42) also reduced the insulin-releasing effects of S. platensis. This suggests a dependency on Ca2+ channel to induce insulin release. Similar intracellular Ca2+ dependency was found in BRIN-BD11 cells, where S. platensis increased insulin release, which was inhibited by the L-channel blocker verapamil. Furthermore, studies with BRIN BD11 cells showed S. platensis induced membrane depolarisation and increased [Ca2+]i.
The insulin-releasing effects of S. platensis were also markedly increased by the phosphodiesterase inhibitors isobutyl-methyl xanthine and theophylline implicating involvement of the cAMP pathway(Reference Sharp43). Recent studies have shown that use of S. platensis in asthma as adjunct therapy has improved the condition significantly(Reference Manzon-Reyes and Andaya44). The anti-asthmatic actions have been attributed to elevation of cAMP in bronchial smooth muscle cells, promoting airway relaxation and blocking replication of smooth muscle cells(Reference Billington, Ojo and Penn45). Overall, these results indicate that the polar solvents ethanol and butanol contain active molecules of S. platensis that exert multiple effects on the β-cells mediated most importantly via ion channels.
DPP-IV is an enzyme that metabolises incretin hormones and as a result terminate the insulin-releasing and glucose-lowering actions of both glucagon-like peptide 1 and glucose‐dependent insulinotropic polypepide(Reference Singh46). DPP-IV inhibitors have been developed to enhance endogenous incretin action and treat T2DM(Reference Godinho, Mega and Teixeira-de-Lemos47). The two incretin hormones have been shown to have multiple action by increasing pancreatic insulin secretion and reducing glucagon secretion(Reference Singh46). In the present study, S. platensis significantly (P < 0·05, P < 0·01 and P < 0·001) inhibited DPP-IV enzyme activity, indicating that butanol fraction can enhance endogenous glucagon-like peptide 1 and glucose‐dependent insulinotropic polypepide activity. A recent study has shown that flavonol glycosides from the seeds of Lens culinaris Medikus (Fabaceae) inhibited DPP-IV enzyme activity in the dose-dependent manner(Reference Kim, Kim and Choi48). Therefore, it is anticipated that the same phytochemical constituents of S. platensis may be responsible for the observed DPP-IV inhibitory activity effect.
Administration of S. platensis significantly lowered blood glucose and improved glucose tolerance in T2DM rats. The butanol fraction also significantly inhibited glucose absorption during gut perfusion. As anticipated, significant amounts of unabsorbed sucrose were found in postprandial state throughout the gut. This postprandial effect may be related to the interference of intestinal glucose absorption(Reference Hannan, Ali and Khaleque33). The butanol fraction of S. platensis did not inhibit intestinal disaccharidase enzyme activity, and thus inhibition of digestion of carbohydrate is not involved in its mechanism of antihyperglycaemic action. However, increased GI motility, examined using BaSO4 milk, may inhibit carbohydrate absorption in the gut. Dietary fibres reduce postprandial food transit time in the GI tract(Reference Burkitt, Walker and Painter49); thus, shorter time is available for the carbohydrate absorption(Reference Holgate and Read50), and therefore postprandial hyperglycaemia is reduced. High sucrose content in the GI tract indicates reduced sucrose digestion. As a result, a significantly higher concentration of sucrose reaches to the large intestine and caecum and is excreted. S. platensis reduced postprandial sucrose absorption and enhanced GI motility, possibly by forming glucose–fibre complexes that reduce post prandial transit time or gastric emptying time.
A recent study using S. platensis reported potential protective activity against fat induced apoptosis and decreasing intestinal cholesterol absorption(Reference Yigit, Gurel-Gurevin and Isbilen-Basok51,Reference Ku, Kim and Pham52) . However, in the present chronic study, administration of butanol fraction of S. platensis for 28 d in type 2 diabetic rats significantly increased liver glycogen content and HDL, while it reduced LDL substantially. Interestingly, chronic treatment also enhanced plasma insulin and pancreatic insulin content in type 2 diabetic rats. Therefore, the stimulation of insulin release from β-cells as well as insulin action is possibly thereby co-related with the improvement of hepatic glucose uptake.
The phytochemical screening of S. platensis using reversed-phase HPLC revealed the presence of several phenolic acids like p-coumaric acid and other bioactive molecules such as pheophytin A, catechin, zeaxanthin, astaxanthin, apigenin and carotenoid pigments including β-carotene. This composition is in general agreement with the previous research(Reference Mendiola, Marin and Hernndez38,Reference Moor, Pieme and Biapa39) . Recent studies also claim that these compounds have antioxidant properties, trigger insulin secretion and have antihyperglycaemic activity(Reference Sayahi and Shirali53–Reference Amalan, Vijayakumar and Indumathi55).
In conclusion, this study has shown that ethanol extract of S. platensis and its butanol fraction exert prominent stimulatory effects on insulin secretion from β-cells via physiological pathways. In vivo studies in T2DM rats indicate that the butanol fraction decreased blood glucose, increased gut motility, reduced glucose absorption in GIT and improved both plasma and pancreatic insulin levels. S. platensis contains important phytochemicals and valuable micro/macronutrients, consistent with the use of this microalgae as a prophylactic or dietary supplement in the treatment of diabetes.
Acknowledgements
The authors would like to thank the School of Biomedical Sciences and members of the Diabetes Research Group for providing access to their laboratory and the use of facilities to carry out this research.
The present study was supported by the Ulster University Strategic Research Funding and award of Vice Chancellor’s research studentship to P. A.
Y. H. A. A.W. and P. R. F. were responsible for the conception and design of research and also contributed equally to the supervision of the study. P. A., J. M. A. H. and S. A. performed the experiments. P. A and S. A. analysed the data; P. A. and J. M. A. H. interpreted the results of experiments; P. A. prepared the figures; P. A. and S. A. drafted the manuscript; Y. H. A. A. W., P. R. F. and P.A. edited the revised manuscript; all authors approved the final version of the manuscript.
The authors declare that there are no conflicts of interest.


 Open access