





1. Introduction
Energy transport resulting from small-scale electrostatic fluctuations is a major impediment to sustaining nuclear fusion in magnetic confinement devices. While one can scale up the size of a reactor to offset these losses and reach the required fusion product, smaller designs with better transport properties are more likely to be built and succeed against economic competition from other energy sources. Thus precise control of the level of electrostatic fluctuations would be a boon to the fusion program. The problem of transport resulting from electrostatic turbulence has been tackled aggressively over the past decades in the context of axisymmetric tokamaks and is receiving increasingly more attention in the stellarator community. The complex magnetic geometry of stellarators makes the problem more difficult to study, but also opens the door to possible optimization by exploring the large theoretical space of stellarator designs. The current hope is that once the magnetic field shape is adjusted to confine trapped particle orbits, there will be enough remaining freedom to optimize for turbulence; see e.g. Mynick (Reference Mynick2006) for a review.
The ion-temperature-gradient mode (ITG mode) has been singled out as a leading cause of transport in magnetic fusion devices. This mode, which is driven by gradients in ion temperature, causes heat losses that act to reduce the steep gradient imposed by heating in the core of the device. Several different approaches to modelling the ITG mode in stellarators have emerged over the past decade, such as incorporating the effect of zonal flows into quasilinear turbulence saturation (Nunami, Watanabe & Sugama Reference Nunami, Watanabe and Sugama2013; Toda et al. Reference Toda, Nakata, Nunami, Ishizawa, Watanabe and Sugama2019), which add the contributions of subdominant eigenmodes into quasilinear saturation estimates (Pueschel et al. Reference Pueschel, Faber, Citrin, Hegna, Terry and Hatch2016) and calculate mode saturation by energy transfer to damped modes (Terry, Baver & Gupta Reference Terry, Baver and Gupta2006; Hatch et al. Reference Hatch, Terry, Jenko, Merz and Nevins2011). Some optimization strategies based on nonlinear modelling have also been identified, e.g. targeting key geometric quantities associated with ITG intensity (Mynick, Pomphrey & Xanthopoulos Reference Mynick, Pomphrey and Xanthopoulos2010; Xanthopoulos et al. Reference Xanthopoulos, Mynick, Helander, Turkin, Plunk, Jenko, Görler, Told, Bird and Proll2014) and increasing the correlation time of unstable modes with damped modes (Hegna, Terry & Faber Reference Hegna, Terry and Faber2018). Renewed interest in near-axis expansions for stellarators (Landreman & Sengupta Reference Landreman and Sengupta2018; Jorge, Sengupta & Landreman Reference Jorge, Sengupta and Landreman2020) has also led to calculation of the geometric features that influence the ITG mode (Jorge & Landreman Reference Jorge and Landreman2020, Reference Jorge and Landreman2021) with possible application to optimization for ITG turbulence. Much of the work just mentioned, as well as current efforts towards turbulence optimization of which we are aware, involve modelling turbulence itself. This is a challenging problem to crack, especially at the level of generality needed for stellarator design. We can solve a simpler problem that applies to any toroidal configuration, however, by finding the ITG linear critical gradient.
The critical gradient is the threshold gradient for onset of the ITG mode. While some plasma instabilities are susceptible to sub-critical turbulence that bring this onset below the linear threshold, it appears that the opposite occurs in the case of the ITG mode, with the onset occurring at a somewhat larger value of the gradient (Dimits et al. Reference Dimits, Bateman, Beer, Cohen, Dorland, Hammett, Kim, Kinsey, Kotschenreuther and Kritz2000). The critical gradient is also a valuable reference point because the thermal transport above this value tends to be ‘stiff’ in tokamaks, i.e. it often sharply increases with the gradient. If the plasma has a radial temperature profile with a constant gradient that matches the critical gradient, $\textrm {d}\ln T/\textrm {d}r=\textrm {d}\ln T/\textrm {d}r_{\textrm {crit}}=\text {const}$ ($T$
($T$ is the temperature and $r$
 is the radial distance from the core of the plasma), one can infer from integrating this profile inward in $r$
 that the temperature increases exponentially towards the core. It stands to reason that a modest improvement in the critical gradient can result in a significant gain in the core temperature. A specific gradient might be targeted so that modest turbulence is present in the desired operating regime, which may, in certain cases, help flush out impurities (Garcia-Regaña et al. Reference Garcia-Regaña, Barnes, Calvo, Parra, Alcuson, Davies, Gonzalez-Jerez, Mollen, Sanchez and Velasco2021).
1.1. Physics of the ITG mode critical gradient
The critical gradient has a long history in tokamak research. Early analytical works mapped the stability of the ITG mode in parameter space and calculated threshold gradients in various limits (e.g. Terry, Anderson & Horton Reference Terry, Anderson and Horton1982; Dominguez & Waltz Reference Dominguez and Waltz1988; Romanelli Reference Romanelli1989; Biglari, Diamond & Rosenbluth Reference Biglari, Diamond and Rosenbluth1989; Hahm & Tang Reference Hahm and Tang1989; Dominguez & Rosenbluth Reference Dominguez and Rosenbluth1989; Romanelli & Briguglio Reference Romanelli and Briguglio1990; Kadomtsev & Pogutse Reference Kadomtsev, Pogutse and Leontovich1995). For a comprehensive study of the analytical calculations and their validity, the reader is referred to Zocco et al. (Reference Zocco, Xanthopoulos, Doerk, Connor and Helander2018), in which the critical gradient is explored in the more general cases of low-shear tokamaks and stellarators in the so-called local kinetic limit. The critical gradient has also been studied for the electron-temperature-gradient (ETG) mode (e.g. Horton, Hong & Tang Reference Horton, Hong and Tang1988; Jenko, Dorland & Hammet Reference Jenko, Dorland and Hammet2001; Jenko & Dorland Reference Jenko and Dorland2002), whose behaviour mirrors the ITG in certain limits. Although the ITG critical gradient for the actual onset of turbulence will differ from the linear value, it is only expected to be greater as a result of an ‘upshift’ owing to zonal flows. That is to say, the true critical gradient in many devices is, to first approximation, set by linear physics and is improved to some degree by nonlinear effects.
The physics of the ITG is simpler near the linear threshold. The complexity introduced by multiple growing modes having the same perpendicular wavenumber is removed, as only one marginally unstable mode remains, the ‘last mode standing’. More importantly, the prediction of the linear critical gradient does not require a complete understanding of turbulence, and is universally relevant in the sense that virtually all configurations of interest are expected to have a well-defined value. The critical gradient is thus a convenient metric for comparing how susceptible different configurations are to ITG turbulence. However, there is no general method for calculating the critical gradient in arbitrary geometry aside from running a series of linear gyrokinetic simulations essentially as a root finder, which is a tedious and computationally intensive procedure. This motivates the development of an efficient and robust method, which is the main result of this paper. We also try to clarify some outstanding physics questions concerning what controls the stability of the ITG mode in a general magnetic geometry.
We distinguish here between two linear critical gradients, which correspond to the onset of the two distinct branches of the ITG mode. For configurations with low global shear, the threshold of slab-like modes, which are spread broadly along the field line, characterize the absolute critical gradient, below which no unstable modes are present. Such ‘background’ modes and the dependence of their critical gradient on the temperature ratio of ions and electrons were studied by Zocco et al. (Reference Zocco, Xanthopoulos, Doerk, Connor and Helander2018), with further evidence for slab-like modes in low-shear stellarators discussed in works such as Faber et al. (Reference Faber, Pueschel, Terry, Hegna and Roman2018). A sufficiently large global shear is expected to stabilize the slab-like background and lead to a single critical gradient, where the onset of resonant modes is related to the toroidal branch of the ITG mode whose critical gradient is set by drift curvature. These curvature-influenced modes (that still retain the parallel resonance associated with the slab mode) ‘balloon’ and localize along the field line, where they, at least in part, feed off of regions of bad curvature along the field line. The onset of these modes defines a second critical gradient, which is thought to be set by the strength of bad curvature, as well as the extent of regions of bad curvature along the field line. Both slab-like background and localized toroidal/slab modes are expected to emerge in low- to moderate-shear devices, which leads to a ‘knee’ in the plot of maximal growth rate versus temperature gradient (see Zocco et al. Reference Zocco, Xanthopoulos, Doerk, Connor and Helander2018). Which of these critical gradients is more important in setting the onset of significant heat transport remains an open question.
The traditional geometric scale invoked to understand the onset and drive of the ITG mode has been the connection length, typically the distance along the field line between the inboard and outboard sides of a tokamak (the distance between regions of ‘good’ and ‘bad’ curvature). If an ITG mode is in the toroidal branch, it will typically balloon in the centre of the bad curvature well. Near the transition to the slab mode (if one exists as in the low-shear case), it may be that the mode has to spread out to fill the entire bad curvature region, i.e. connection length, to be unstable. In the case of a stellarator, one might attempt to generalize the connection length idea, for example, to be the distance between sharp features in local shear that are inherent to non-axisymmetric fields that also tends to correspond to the scale of variation of the normal curvature. We will show that this is not completely successful in describing the critical gradient. Fortunately, a more fundamental measure is available, namely the ion correlation length, or the distance over which ion motion is correlated with the mode. Analysis of the equations will show that this is simply a properly defined characteristic frequency divided by the ion thermal velocity. Thus we find that for stellarators, the traditional notion of connection length (defined for curvature by local shear, etc.) should generally be replaced by this correlation length. The ITG mode near marginality may, depending on the size of this length scale, be driven independently of local features in the geometry and, in such cases, depends on average properties along a magnetic field line.
The paper is structured as follows. In § 2, we define the linear gyrokinetic equation and the integral form of the equation that we use to solve for the ITG critical gradient. We discuss the local, linear theory of the slab ITG mode critical gradient in § 3.1 and extend the discussion to the effects of field-line-varying geometry in § 3.2. Numerical experiments using a slab geometry model show that it is difficult to constrain the correlation length of the ITG with localized amplification of the perpendicular wavenumber in § 3.3. These experiments illustrate an example of a possible conflict between the concepts of correlation length and connection length. We also provide evidence for the onset of curvature-driven modes by extending the numerical model to include a spatially-varying curvature in § 3.4. A case study for increasing the critical gradient in near-helically symmetric toroidal configurations (§ 4) shows that attempts to reduce the curvature connection length with large toroidal field period numbers leads to a critical gradient instead set by global shear. We are thus motivated to confront the first-principles calculation of the critical gradient in § 5, the main result of the paper. Section 6 concludes the paper.
2. Linear electrostatic gyrokinetic equation
2.1. Definitions
Following Plunk et al. (Reference Plunk, Helander, Xanthopoulos and Connor2014), we let $g_{i}( {v_{\parallel }}, {v_{\perp }},\boldsymbol {x},t)$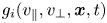 be the non-adiabatic part of $\delta f_{i}$
 and $\phi (\boldsymbol {x})$
 be the electrostatic potential, with $\boldsymbol {x}$
 as the gyro-centre position. Here the $i$
 subscript refers to a single ion population and $\delta f_{i}$
 is the gyro-averaged perturbation of the distribution function from the equilibrium Maxwellian distribution (defined below). The independent velocity coordinates are parallel $({v}_{\parallel})$
 and perpendicular ($ {v_{\perp }}$
 ) to the equilibrium magnetic field $\boldsymbol {B}(\boldsymbol {x})$
 . We use the twisted slicing representation (Roberts & Taylor Reference Roberts and Taylor1965), $(g_{i},\phi )=(\hat {g}_{i}(l),\hat {\phi }(l))\exp (\textrm {i} s-\textrm {i} \omega t)$
 , where ${\ell }$
 is the magnetic field-line-following coordinate (arc length variable) defined such that ${\hat {b}} = \boldsymbol {B}/|\boldsymbol {B}|=\partial \boldsymbol {x}/\partial {\ell }$
 . The Fourier-expanded frequency is ${\omega }$
 , $t$
, $t$ is time and $s(\boldsymbol {x})$
 is the eikonal factor containing variation in the spatial directions perpendicular to $\boldsymbol {B}$
 . The factor $\exp (\textrm {i} s)$
 contains fast spatial oscillations with the anisotropy condition $\boldsymbol {B} \boldsymbol {\cdot } \boldsymbol {\nabla } s=0$
 ensured by taking $\partial s/\partial l = 0$
 . Representing the magnetic field in flux coordinates, $\boldsymbol {B}=\boldsymbol {\nabla } \psi \times \boldsymbol {\nabla } {\alpha }$
 , we set

where $k_{\alpha }$ and $k_{\psi }$
 are constants and the variation of $\boldsymbol {k}_{\boldsymbol {\perp }}(l)$
 comes from the geometric quantities $\boldsymbol {\nabla } \alpha$
 and $\boldsymbol {\nabla } \psi$
 . Here $\psi$
 is a flux surface label and $\alpha$
 is a label for a particular field line on a given surface $\psi$
 . Thus the gyro-centre position is expressed as $\boldsymbol {x}=\boldsymbol {x}(\psi ,\alpha ,{\ell })$
 . Defining a toroidal angle $\zeta _{\text {tor}}$
 and poloidal angle $\theta _{\text {pol}}$
 , we also write $\alpha =\theta _{\text {pol}}-{\style{display: inline-block; transform: rotate(31deg)}{\raise1.5pt{\tiny{/}}}\kern-1.4pt\iota} \zeta _{\text {tor}}$
 , with ${\style{display: inline-block; transform: rotate(31deg)}{\raise1.5pt{\tiny{/}}}\kern-1.4pt\iota} ={\style{display: inline-block; transform: rotate(31deg)}{\raise1.5pt{\tiny{/}}}\kern-1.4pt\iota} (\psi )$
 as the rotational transform. These definitions allow us to re-express (2.1) as

We associate the term proportional to $\textrm {d} {\style{display: inline-block; transform: rotate(31deg)}{\raise1.5pt{\tiny{/}}}\kern-1.4pt\iota} / \textrm {d}\psi$ with global shear, which leads to a secular increase of $|\boldsymbol {k}_{\perp }|$
 as $\zeta _{\text {tor}}$
 or $\ell$
 are increased. The remaining, non-secular terms proportional to $k_{\alpha }$
 are then considered to be local shear effects.
From now on, we drop the $i$ subscript and hat notations, retaining electron ‘e’ subscripts for two subsequent definitions. We then write the linear gyrokinetic equation for the ions as

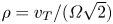
with the following definitions: $\textrm {J}_0 = \textrm {J}_0(k_{\perp }v_{\perp }/\varOmega ) = \textrm {J}_0(k_{\perp }\rho \sqrt {2}v_{\perp }/{v_{{T}}})$ ; the thermal velocity is ${v_{{T}}} = \sqrt {2T/m}$
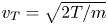 and the thermal ion Larmor radius is $\rho = {v_{{T}}}/(\varOmega \sqrt {2})$
 ; $n$
; $n$ and $T$
 are the background ion density and temperature; $q$
 is the ion charge; $\varphi = q\phi /T$
 is the normalized electrostatic potential; $\varOmega =q B/m$
 is the cyclotron frequency, with $B=|\boldsymbol {B}|$
 the magnetic field strength. Assuming Boltzmann electrons, the quasineutrality condition is
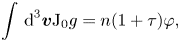
where $\tau = T/(ZT_e)$ with the charge ratio defined as $Z = q/q_e$
 . The equilibrium distribution is the Maxwellian

and we introduce the velocity-dependent diamagnetic frequency

where we neglect the background density variation and define ${\omega _*^{{T}}} = (Tk_{\alpha }/q)\,\textrm {d}\ln T/\textrm {d}\psi$ . The magnetic drift frequency is ${\tilde {\omega }_d} = {\boldsymbol {v}}_d\boldsymbol {\cdot }{\boldsymbol {k}}_{\perp }$
 and the magnetic drift velocity is ${\boldsymbol {v}}_d = \hat {\boldsymbol {b}} \times ((v_{\perp }^2/2)\boldsymbol {\nabla } \ln B + {v_{\parallel }}^2\boldsymbol {\kappa })/\varOmega$
 , where $\boldsymbol {\kappa } = \hat {\boldsymbol {b}}\boldsymbol {\cdot }\boldsymbol {\nabla }\hat {\boldsymbol {b}}$
 . We take $\boldsymbol {\nabla } \ln B = \boldsymbol {\kappa }$
 (small $\beta$
 approximation) for simplicity. We then let

where the velocity-independent drift frequency ${\omega _d}(\ell )$ generally varies along the field line.
2.2. Integral form of the equation
An integral equation can be derived from (2.3)–(2.4) by assuming ‘outgoing’ boundary conditions $g( {v_{\parallel }} > 0, \ell = -\infty ) = g( {v_{\parallel }} < 0, \ell = \infty ) = 0$ , which are consistent with ballooning modes that decay as $|\ell | \rightarrow \infty$
 (Connor, Hastie & Taylor Reference Connor, Hastie and Taylor1980; Romanelli Reference Romanelli1989). To enforce these conditions, we assume the system has non-zero global shear, $d{\style{display: inline-block; transform: rotate(31deg)}{\raise1.5pt{\tiny{/}}}\kern-1.4pt\iota} /d\psi \neq 0$
 , though it is allowed to be small. As shown in Appendix A, one then obtains

where $ {x_{\perp }} = {v_{\perp }}/{v_{{T}}}$ and $ {x_{\parallel }} = {v_{\parallel }}/{v_{{T}}}$
 , $\operatorname {sgn}$
 gives the sign of its argument, $\textrm {J}_0 = \textrm {J}_0 (\sqrt {2b(\ell )} {x_{\perp }} )$
 , $\textrm {J}_0^\prime = \textrm {J}_0 (\sqrt {2b(\ell ^\prime )} {x_{\perp }} )$
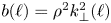
 , and $b(\ell )=\rho ^{2}k_{\perp }^{2}(\ell )$
 . The physics of the drift resonance is contained in the factor

We neglect particle trapping so $ {x_{\parallel }}$ and $ {x_{\perp }}$
 do not depend on $\ell$
 . Most evidence indicates that the ITG mode uniformly responds to changes in the parameters $\tau$
 and $\mathrm {d}n/\mathrm {d}\psi$
 , and is stabilized by increasing either of them, except for a relatively small region of parameter space where positive density gradients can destabilize the mode. For simplicity, we thus set $\tau =1$
 and $\boldsymbol {\nabla } n=0$
 .
.
3. Physics of marginally unstable ITG modes
3.1. Slab ITG mode
The historical emphasis on connection length can be shown to be motivated by the local kinetic slab ITG critical gradient from Kadomtsev & Pogutse (Reference Kadomtsev, Pogutse and Leontovich1995). In the local limit, the equilibrium quantities do not vary along ${\ell }$ . The Kadomtsev & Pogutse result can be derived by taking the linear gyrokinetic equation (2.1), assuming $\partial / \partial l \rightarrow i {k_{\parallel }}$
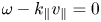
 , and combining it with Poisson's equation (2.1) to yield the linear dispersion relation. The physics of marginal stability is here connected to the parallel slab (or Landau) resonance condition ${\omega } - {k_{\parallel }} {v_{\parallel }}=0$
 , the finite Larmor radius (FLR) effects entering the linear dispersion relation through the ${k_{\perp }}$
 dependence of the $\textrm {J}_{0}$
 factors in (2.1) and (2.1), and the drive term ${\omega _*^{{T}}}$
 which also depends on $k_\alpha$
 . As reviewed by Plunk et al. (Reference Plunk, Helander, Xanthopoulos and Connor2014, (10)), if one then takes the limit $\gamma \rightarrow 0+$
 , where $\gamma$
 is the imaginary part of the mode frequency $\omega$
 , a threshold gradient for destabilization of the mode can be derived,

where the density gradient has been kept, such that $\eta =\mathrm {d} \ln T /\mathrm {d}\ln n$ , $\varGamma _{0,1}(b)=\exp (-b)\textrm {I}_{0,1}(b)$
 , $\textrm {I}_{0,1}(b)$
 is the modified Bessel function of order $0$
 or $1$
 , $b=k^{2}_{\perp }\rho ^{2}$
 and ${\omega _{\parallel }}=k_{||}v_{T}$
 . Finite $k_{\psi }$
 tends to stabilize ITG modes as it does not enter the drive term ${\omega _*^{{T}}}$
 and can amplify the effect of shear in ${k_{\perp }}$
 . In some cases, finite $k_{\psi }$
 can be destabilizing for the ITG mode if this reduces the FLR stabilization by $k_{\alpha }$
 along the flux tube. For simplicity, we set $k_{\psi }=0$
 . We then write

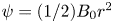
with the radial coordinate $r$ defined through $\psi =(1/2)B_{0}r^2$
 , $B_{0}$
 is a constant such that $\rho =mv_{T}/(qB_{0})$
 , and, in the last step, the poloidal wave number $k_{\text {pol}}=B_{0}k_{\alpha }(\textrm {d}r/\textrm {d}\psi )=k_{\alpha }/r$
 and temperature gradient length scale $L_{T}\equiv (\textrm {d} \ln T/\textrm {d}r)^{-1}$
 have been inserted. We let $k^{2}_{\perp }\rho ^2=k^{2}_{\text {pol}}\rho ^2=b$
 , again for simplicity, and take the limit ${\omega _*} / {\omega _{\parallel }} \rightarrow 0$
 , solving for ${\omega _*^{{T}}} / {\omega _{\parallel }}$
 (note ${\omega _*^{{T}}} = \eta {\omega _*}$
 ). Letting ${k_{\parallel }} \rightarrow 2{\rm \pi} / {\lambda _{||}}$
 , where ${\lambda _{||}}$
 is the parallel wavelength of the mode, we arrive at

with $\tau$ set equal to $1$
 . The absolute critical temperature gradient is found by minimizing $F(b)$
 , which results in $b_{\text {crit}}\simeq 0.88$
 and $(4{\rm \pi} )^{-1}{\lambda _{||}}/L_{T\text {crit}}\simeq 2.6$
 . When $b \gtrsim 1$
 , $F$
, $F$ is increased through FLR effects (i.e. the modified Bessel function factors damp the mode) while for $b< b_{\text {crit}}$
 , the drive from ${\omega _*^{{T}}} \simeq \sqrt {b}$
 is weakened, which also increases $F$
 and hence the linear critical gradient.
One can interpret ${\lambda _{||}}$ as not just the mode extent but also the parallel correlation length ${L_{\parallel }}$
 , the distance a thermal ion travels in the characteristic time scale $1/{\omega } \sim 1/{\omega _*^{{T}}}$
 . One could then estimate the damping rate associated with decorrelation as $v_{T}/{L_{\parallel }}$
 . The simple scaling $1/L_{T\text {crit}} \propto 1/{L_{\parallel }}$
 can also be inferred from (3.3), which implies that shortening the correlation length could be an effective strategy for increasing the ITG linear critical gradient.
3.2. Tunnelling of the ITG mode
It is logical to conclude that if the correlation length ${L_{\parallel }}$ can be imposed by magnetic field geometry, through e.g. local amplification of ${k_{\perp }}$
 or the size of a curvature well, then one could increase the ITG critical gradient to a desired level by controlling the magnetic field shape. Before testing this idea in slab geometry (§ 3.3), we look at the integral equation (2.8) to make qualitative arguments about the effect of shear. These arguments and subsequent numerical tests reveal that equating ${L_{\parallel }}$
 and the traditional connection length is not generally correct. Waltz & Boozer (Reference Waltz and Boozer1993) have argued that local shear and curvature in stellarators may play dominant roles in setting the radial extent and growth rate of the ITG mode. Their analysis was carried out in the cold ion fluid limit. Although local shear is thus expected to have a stabilizing effect, we find that modes are not completely confined by large, local amplification factors of ${k_{\perp }}$
 in the gyrokinetic limit.
For marginally stable modes with $\gamma = {\mathrm {Im}} [\omega ] \rightarrow 0+$ , the velocity integrals in (2.8) can be strongly suppressive (i.e. causing the integrand of the $\ell ^\prime$
 integral to be small) at sufficiently large ${\ell ^{\prime }}-{\ell }$
 . Mode suppression by shear occurs when ${k_{\perp }}(\ell$
 or $\ell ^{\prime })$
 becomes large and different from one another because of the field-line variation of $k_{\perp }$
 . We expect this to occur generally when the so-called shear amplification factor $f={k_{\perp }}^{2}({\ell })/{k_{\perp }}^{2}({\ell }=0)$
 reaches values much larger than $1$
 . This leads to a mismatch in the arguments of the two oscillatory Bessel function factors $\textrm {J}_{0}\textrm {J}_{0}^{\prime }=\textrm {J}_{0}(\sqrt {2{k_{\perp }} ({\ell })} {x_{\perp }})\textrm {J}_{0}(\sqrt {2{k_{\perp }}({\ell ^{\prime }})} {x_{\perp }})$
 . When the $ {x_{\perp }}$
 integration is performed, the overall integral (2.8) is then suppressed. In analogy with quantum mechanics, we picture the ITG mode as a wavefunction that is attempting to penetrate a steep potential barrier when it encounters a region of large $k_\perp ({\ell })$
 . We think of segments of the field line with large ${k_{\perp }}$
 as forbidden regions, through which the eigenfunction $\varphi ({\ell })$
 would need to tunnel to access the temperature gradient drive from further regions along the field line.
Another ingredient in the tunnelling picture is the ion distribution function, which accumulates phase-space structure as it propagates through the large $k_\perp$ barriers. The accumulation can be inferred from the equation (A6), in which the Bessel function factors $\textrm {J}_{0}\textrm {J}^{\prime }_{0}$
 and phase factor $M$
 will rapidly contribute phase-space structure in a manner similar to phase mixing. However, like in phase mixing, this process is technically reversible and can be partially undone if $k_{\perp }({\ell })$
 is of a similar magnitude on both sides of the barrier (which is exactly what occurs with local shear). That is, $\varphi ({\ell })$
 may be transiently suppressed in a narrow region and then recover outside this region, owing to the smoothing or ‘unwinding’ of the phase-space structure of $g$
 . As a result, large, fluctuating shear amplification factors (which one may associate with local shear ‘spikes’ in stellarators) may not be as effective in localizing the extent and drive of the ITG mode as previously thought. If ${k_{\perp }}({\ell })$
 has a secularly growing component, however, phase-space structure can continue to accumulate in $g$
 . In this case, the the amplitude of $\varphi ({\ell })$
 must inevitably decay at large ${\ell }$
 , along with the drive of the ITG mode. Global shear (see (2.2)) therefore plays a unique role in the stability of the ITG mode because it causes a secular increase of ${k_{\perp }}$
 along the field line.
We mention here a less-relevant case in which modes have $k_{\perp }\lesssim 1$ on the entire field line (which can occur for zero global shear) and for which the Bessel functions cannot suppress the mode amplitude. If this is the case, then the mode is never confined by shear and is essentially a free slab mode that violates ballooning boundary conditions. This is why we require non-zero global shear to capture ballooning modes in (2.8). In the next section, we study a sheared slab model to explore the local confinement and tunnelling phenomena in more detail.
3.3. Numerical experiments using GENE
We take the work by Plunk et al. (Reference Plunk, Helander, Xanthopoulos and Connor2014) as a starting point for our numerical experiments. In that paper, the authors solved the ITG linear dispersion relation of ‘boxed’ modes in a flux tube geometry with uniform geometric coefficients except at the boundaries, where they set $k_{\perp }=\infty$ at locations ${\ell }=-L_{0}/2$
 and ${\ell }=L_{0}/2$
 , with $L_{0}$
 the width of a box in ${\ell }$
 . We study a similar problem but the modes here are instead confined by ${k_{\perp }}$
 barriers of finite width and height, where $k_\perp ({\ell })$
 has no secularly growing component, i.e. we only retain non-global shear terms (see (2.2)). Linear flux-tube simulations are performed with the GENE gyrokinetic code (Jenko et al. Reference Jenko, Dorland, Kotschenreuther and Rogers2000) to find the ITG critical gradient in a sheared slab (i.e. with curvature set to $0$
 ). Defining the coordinates $(x,y,z)$
 similarly to Faber et al. (Reference Faber, Pueschel, Terry, Hegna and Roman2018), we set $x=(\psi -\psi _{c})/(B_{0}r_{c})$
 , $y=r_{c}(\alpha -\alpha _{c})$
 and $z={\ell }$
 . Here $\psi _{c}$
 and $\alpha _{c}$
 are the toroidal flux and field line labels, respectively, at the centre of the flux-tube simulation domain with small spatial extents perpendicular to the magnetic field line. These extents are defined as $-\Delta \psi \leqslant \psi - \psi _{c} \leqslant \Delta \psi$
 and $-\Delta \alpha \leqslant \alpha - \alpha _{c} \leqslant \Delta \alpha$
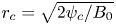
 . The radius corresponding to the centre of the simulation domain is $r_{c}=\sqrt {2\psi _{c}/B_{0}}$
 . The perpendicular wavenumbers (with no field-line dependence included yet) are $k_{x}= m{\rm \pi} B_{0} r_{c}/\Delta \psi$
 and $k_{y}=u {\rm \pi}/(r_{c}\Delta \alpha )$
 , with $m$
 and $u$
 as integers. The field-line variation of $k_{\perp }$
 is expressed through $k^{2}_{\perp }({\ell })=k^{2}_{x}g^{xx}({\ell })+k_{x}k_{y}g^{xy}({\ell })+k^{2}_{y}g^{yy}({\ell })$
 , with the metric coefficients defined as $g^{xx}({\ell })=(\boldsymbol {\nabla } x)^2({\ell })$
 , $g^{xy}({\ell })=(\boldsymbol {\nabla } x)({\ell })\boldsymbol {\cdot } (\boldsymbol {\nabla } y)({\ell })$
 and $g^{yy}({\ell })=(\boldsymbol {\nabla } y)^2({\ell })$
 . Finally, the perpendicular wavenumbers and coordinates are normalized with respect to $\rho$
 , such that ${k_{\perp }} \rho$
 and the metric coefficients are dimensionless.
By setting the amplification factor $f=k^{2}_{\perp }({\ell })/k^2_{\perp }({\ell }=0)$ , we mimic the effect of magnetic shear when simulating the growth of the ITG mode, in this case, through a localized ‘spike’ and bounding walls in the profile of $k_\perp$
 . Assuming $m=0$
 for simplicity such that $k_{x}=0$
 and $k^{2}_\perp =k^{2}_{y}g^{yy}$
 , we set $g^{yy}=(\boldsymbol {\nabla } y)^{2}$
 by hand,

The width of the box between the bounding walls is $L_{0}$ , while the localized Gaussian spike has variable amplitude $H$
 and width $w$
 . In the $H=0$
 case, the profile is that of a constant ${k_{\perp }}$
 middle region that smoothly but rapidly transitions to a constant $f=g^{yy}(\ell )/g^{yy}(0)=100$
 . When $H\neq 0$
 , the Gaussian spike causes a large change in the derivative of ${k_{\perp }}$
 near ${\ell }=0$
 , which quickly reverses sign, causing ${k_{\perp }}$
 to return to its value in the flat region on the other side of the spike. This type of rapid but transient increase in ${k_{\perp }}$
 is what we mean when we refer to local shear. Electrons are adiabatic, $T_{e}=T$
 , there is no density gradient and $|\boldsymbol {B}|$
 is constant. The parallel boundary condition is set by using twist-and-shift (Beer, Cowley & Hammett Reference Beer, Cowley and Hammett1995) with zero connections such that the electrostatic potential ${\varphi }$
 is $0$
 at the boundaries. Here, ${\varphi }$
 is well-behaved near the boundary (has no hints of mode activity) provided the walls are sufficiently wide and high. We also exclude modes with such low values of $k_{y} \rho$
 that they cannot be confined by barriers with shear amplification factors that lack a secularly growing component (as mentioned in § 3.2) and present results for $k_{y}\rho >0.4$
 , which are shown in figure 1 with corresponding data in table 1. The critical gradient is found by running a series of simulations, starting with large $L_{0}/L_{T}$
 and steadily reducing the drive until only one unstable $k_{y}\rho$
 mode remains which satisfies $\varphi ({\ell })=0$
 at the boundaries, determining both the critical $(k_{y}\rho )_\text {crit}$
 and $L_{0}/L_{T\text {crit}}$
 .
.
The $\ell$ profiles of $g_{yy}$
 (green curves) and $|{\varphi }|$
 (black curves) of the marginally unstable slab ITG mode ($\gamma \rightarrow 0+$
 ) for simulations with (a) only bounding walls, (b) walls and a wide middle spike, and (c) walls with a narrow middle spike. See table 1 for simulation parameters and critical gradients. Here $|{\varphi }|$
 is normalized to its maximum value and multiplied by 100 to match $g_{yy}$
 .
.

Slab ITG simulation results.
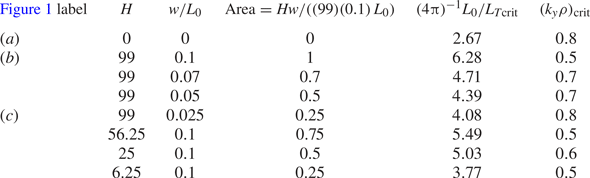
In figure 1(a), we show $g^{yy}(\ell )$ and $|{\varphi }(\ell )|$
 in the simplest case of only bounding walls, $H=0$
 , for a simulation with $(k_{y}\rho )_\text {crit} =0.8$
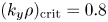 near marginality, $\gamma =4{\rm \pi} \times 10^{-3} c_{s}/L_{0}$
 . The critical gradient is $(4{\rm \pi} )^{-1}L_{0}/L_{T\text {crit}}\simeq 2.67$
 in good agreement with the Kadomtsev–Pogutse formula ((3.3), $(4{\rm \pi} )^{-1}L_{0}/L_{T\text {crit}}\simeq 2.60$
 ), though the simulation result yields a smaller $b_{\text {crit,sim}} = (k_{y}\rho )^2_\text {crit} = 0.64$
 than that of the formula ($b_{\text {crit}}\simeq 0.88$
 ). The difference in $b_{\text {crit}}$
 is not surprising in light of the fact that the ${\ell }$
 -periodic slab solution from the Kadomtsev–Pogutse result is qualitatively different from mode subject to ballooning boundary conditions. The parallel connection length inferred by the critical gradient still agrees decently well between the two cases.
We now vary $H$ and $w$
 . For $w/L_{0}=0.1$
 , figure 1(b) shows the division of $L_{0}$
 into two regions for the new marginal ITG mode, whose critical gradient has more than doubled (see table 1) and whose amplitude $|{\varphi }(\ell )|$
 goes to zero within the central spike. One can therefore still use (3.3) to estimate the critical gradient with ${\lambda _{||}}=L_{0}/2$
 , the distance between the spike and a wall. As we shall soon find, however, this estimate becomes unreliable for the case of weaker shear features.
If the spike height is maintained while its width is narrowed to $w/L_{0}=0.025$ (figure 1c), tunnelling becomes significant and the mode can maintain strong correlations across the spike. Here, ${\varphi }(\ell )$
 still approaches $0$
 for $|\ell |/w \lesssim 1$
 as a result of the large factor $f$
 , as in figure 1(b). The mode amplitude quickly recovers outside the spike and for $|\ell |/w \gtrsim 1$
 closely resembles that of the $H=0$
 case. The critical gradient is approximately $1.5$
 times larger than that of the $H=0$
 case in contrast with the factor $>2$
 increase seen in the $w/L_{0}=0.1$
 case. This means the parallel correlation length of the mode is now closer to the original $L_{0}$
 and the wall-to-spike distance no longer matches this length. To effectively reduce the ITG mode correlation length, therefore, a localized amplification $f$
 must not only be large in amplitude but also have significant width, i.e. it must have area along the field line. We can thus interpret the spike as reducing the correlation length by carving out larger or smaller pieces of the domain in figures 1(b) or 1(c), respectively, which yields larger or smaller increases in the critical gradient relative to the reference case with $H=0$
 (figure 1a). Results of scans in which $H$
 and $w$
 were gradually reduced (table 1) suggest a roughly linear scaling of the critical gradient with spike area.
The required shear amplification factors $f\sim 100$ used in these test cases are fairly large compared with those of typical low-global-shear stellarators. We refer here to the work of Jorge & Landreman (Reference Jorge and Landreman2020), who plotted the field-line variation of quantities important to ITG mode stability such as $(\boldsymbol {\nabla } \alpha )^{2}$
 and components of drift curvature ${\omega _d}$
 for many standard stellarator configurations (figures 4–13 of that paper). Inspection by eye suggests $(\boldsymbol {\nabla } \alpha )^2/(\boldsymbol {\nabla } \alpha ^2)|_{{\ell }=0}$
 for these flux tubes is in the range of $5$
 to $40$
 .
.
We caution that our model does not capture all the features of a consistent equilibrium, in particular, the modulation of the drift frequency from local shear that can affect the stability of the ITG mode. The results in this section nonetheless suggest that it is difficult to significantly increase the critical gradient with localized spikes in ${k_{\perp }}$ .
.
3.4. Curvature-driven ITG modes
ITG modes can also be excited by the drift resonance, ${\omega _*^{{T}}} \sim {\omega _d}$ , rather than the parallel resonance ${\omega _*^{{T}}} \sim v_{T}/{L_{\parallel }}$
 discussed in § 3.1. Although the local ITG linear dispersion relation including ${\omega _d}$
 must be solved numerically (see e.g. Plunk et al. (Reference Plunk, Helander, Xanthopoulos and Connor2014) and references therein), it is well known from analytic theory considerations that damping of the mode can occur when the effect of curvature is too large (e.g. Sugama Reference Sugama1999). That is, when ${\omega _d} \gtrsim {\omega _*^{{T}}}$
 , the mode is pulled out of the drift resonance and decorrelation occurs. The marginal stability criterion becomes $1/L_{T\text {crit}} \propto 1/R_{\text {eff}}$
 , where ${R_{\mathrm {eff}}}={k_{\perp }} \rho v_{T}/(\sqrt {2}{\omega _d})$
 is the effective radius of curvature and implies a parallel correlation length ${L_{\parallel }} \sim v_{T}/{\omega } \sim v_{T}/{\omega _d}$
 for curvature-driven ITG modes. This shows why larger values of bad curvature will actually increase the critical gradient. Once the mode ‘balloons’ and localizes to the curvature well, however, it will be driven more strongly beyond the threshold if curvature is increased. Therefore, we expect that when the peak bad curvature is increased, the growth rate should become stiffer (have a larger slope versus gradient) above the second critical gradient. We confirm these intuitions in the following numerical experiments.
We again take the shear profile (3.4) of just bounding walls in shear ($H=0$ ) and add a purely oscillatory drift frequency which has four periods within the shear walls, ${\omega _d}=(k_{y}\rho ) K\cos [8{\rm \pi} {\ell }/L_{0}]$
 . We run linear simulations in GENE of a slab case $K=0$
 , a weaker curvature case $K=2{\rm \pi} /L_{0}$
 and a stronger curvature case $K=4{\rm \pi} /L_{0}$
 . A scan is done over $k_{y}\rho$
 and the mode with the peak growth rate is chosen. We plot in figure 2(a) the peak growth rate $\gamma$
 in each case as a function of the imposed temperature gradient. For small values of temperature gradient $(4{\rm \pi} )^{-2} L_{0}/L_{T} < 0.5$
 , the absolute critical gradient for slab-like modes is observed. As the gradient increases, a transition occurs to faster growing modes with higher ${k_{\perp }}$
 ($k_{y}\rho =0.4 \rightarrow 0.7)$
 , which shows a ‘knee’ (Zocco et al. Reference Zocco, Xanthopoulos, Doerk, Connor and Helander2018) that is particularly visible for the stronger curvature case $K=4{\rm \pi} /L_{0}$
 . In figure 2(b), we plot the growth rate over the $k_{y}\rho$
 spectrum for $K=4{\rm \pi} /L_{0}$
 at $4{\rm \pi} ^{-2}L_{0}/L_{T} > 1.59$
 and $1.99$
 , which shows the two different peaks of the spectrum and the higher $k_{y}\rho$
 peak overtaking the low $k_{y}\rho$
 peak. The knee feature thus captures the fact that the curvature-driven mode branch ($k_{y}\rho \simeq 0.7$
 ) has higher peak growth rates for these higher temperature gradients. For this case, we extrapolate the stiffer behaviour of peak $\gamma$
 (between $4{\rm \pi} ^{-2}L_{0}/L_{T} = 1.99$
 and $4{\rm \pi} ^{-2}L_{0}/L_{T} = 1.59$
 ) back to an inferred critical gradient relating to the onset of the curvature-driven mode. The knee seems to nearly disappear when the peak curvature is reduced by a factor of two (to $K=2{\rm \pi} /L_{0}$
 ), with an extrapolated curvature-induced critical gradient approximately a factor of two smaller. This is consistent with estimating the correlation length to be ${L_{\parallel }} \propto R_{\text {eff,min}} = v_{T} k_{y}\rho /(\sqrt {2}{\omega _d}_{\text {max}})$
 , the minimum effective radius of curvature. We see too that the knee emerges as $K$
 is increased in the series of runs, for which $K{\ell }_{\text {curv}}=0,{\rm \pi} /4,$
 and ${\rm \pi} /2$
 , where ${\ell }_{curv}$
 is the width of one half-period of the cosine included in the curvature and is effectively the connection length. Because the knee starts to become visible in the weaker curvature case, $K{\ell }_{curv}={\rm \pi} /4 \simeq 0.8$
 , we infer that $K{\ell }_{curv} \gtrsim 1$
 is required to observe the knee. This threshold condition could be related to the transition between slab-like and toroidal-like regimes of ETG turbulence discussed by Plunk et al. (Reference Plunk, Xanthopoulos, Weir, Bozhenkov, Dinklage, Fuchert, Geiger, Hirsch, Hoefel and Jakubowski2019).
Onset of curvature-driven resonant ITG modes in a simple geometry model using GENE. The $g^{yy}$ profile in (3.4) is used with a drift curvature profile ${\omega _d}/(k_{y}\rho )=K\cos [8{\rm \pi} {\ell }/L_{0}]$
 added. (a) Peak growth rate $\gamma$
 versus $L_{0}/L_{T}$
 for $K=0$
 (green curve), $K=2{\rm \pi} /L_{0}$
 (blue curve, weaker curvature) and $K=4{\rm \pi} /L_{0}$
 (red curve, stronger curvature). A strong ‘knee’ is visible in the growth rate near $(4{\rm \pi} )^{-2}L_{0}/L_{T}=1.59$
 for the red curve. Data points are shown with squares. Linear extrapolation to an inferred critical gradient set by curvature is shown with a dashed black line. The two data points used in this extrapolation correspond to the points before (silver square, $(4{\rm \pi} )^{-2}L_{0}/L_{T}=1.59$
 , peak growth at $k_{y}\rho =0.4$
 ) and after (black square, $(4{\rm \pi} )^{-2}L_{0}/L_{T}=1.99$
 , peak growth at $k_{y}\rho =0.7$
 ) the transition in mode structure and growth rate of the most unstable modes as $L_{0}/L_{T}$
 is increased. A weaker knee is visible near $(4{\rm \pi} )^{-2}L_{0}/L_{T}=1.2$
 on the horizontal axis for the blue curve, with a dotted black line for its inferred critical gradient. (b) Growth rate spectra $\gamma (k_{y}\rho )$
 before and after the mode transition for $K=4{\rm \pi} /L_{0}$
 discussed above. (c) Mode profiles $|\varphi (\ell )|$
 for the two cases presented in (b) at peak growth rate, $k_{y}\rho =0.4$
 (silver curve) and $k_{y}\rho =0.7$
 (black curve). The orange curve shows the normalized drift frequency profile for the cases with curvature.
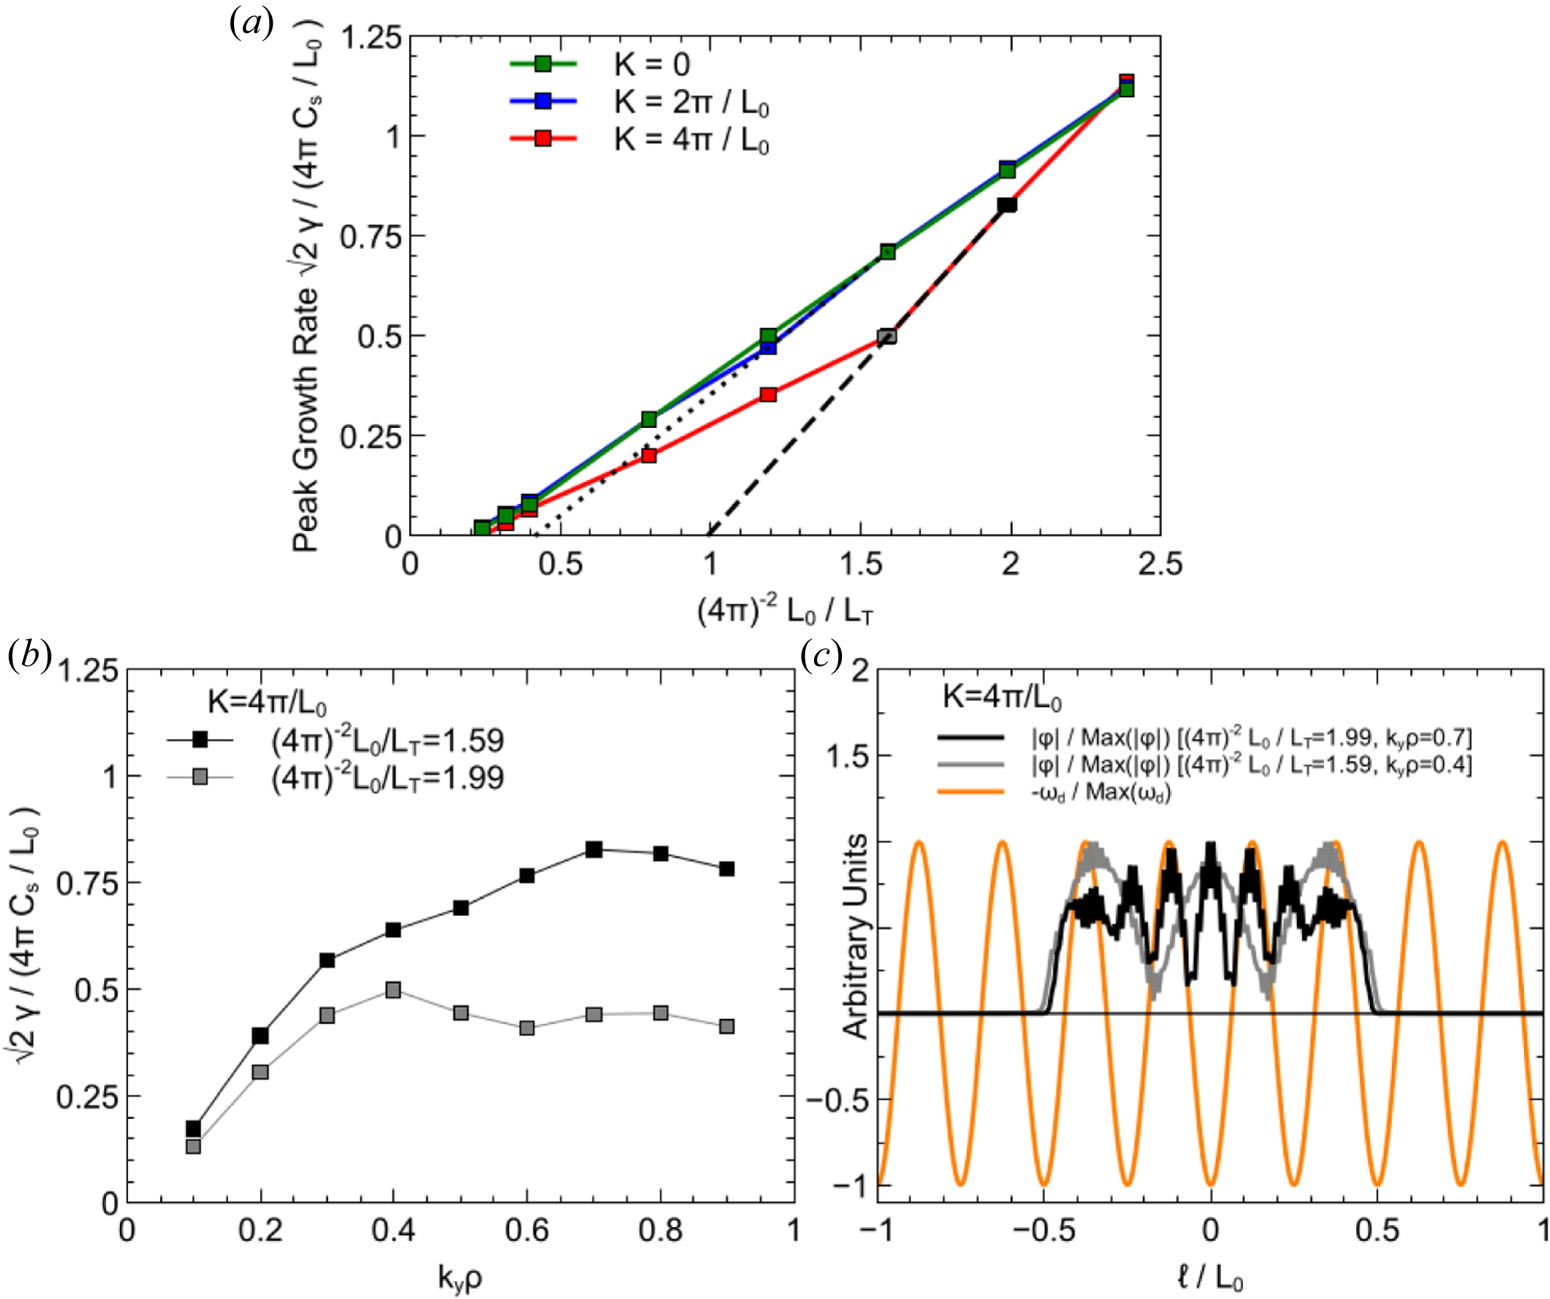
The transition between the fastest-growing-modes in the $K=4{\rm \pi} /L_{0}$ case is made more explicit in figure 2(c) by plotting the mode structures of the peak growth rate modes before [$(4{\rm \pi} )^{-2}L_{0}/L_{T}=1.59$
 , $k_{y}\rho =0.4$
 ] and after [$(4{\rm \pi} )^{-2}L_{0}/L_{T}=1.99$
 , $k_{y}\rho =0.7$
 ] the knee. The mode structure before looks like a characteristic slab mode above marginality, with two nodes in the amplitude indicating it is probably a third-harmonic mode (the fundamental mode at marginality has no interior nodes as in figure 1a). Once the transition occurs, however, the mode structure lines up neatly with the imposed curvature profile suggesting the mode is now sitting within bad curvature wells. The physics of an absolute critical gradient set by shear, and a second, curvature-induced critical gradient with a stiffer increase in growth rate can thus be modelled with bounding shear walls and an oscillatory curvature profile of fixed width. We note that our model geometry does not have consistency between the metrics and the drift curvature ${\omega _d}$
 , as ${\omega _d}$
 should be related to $g^{yy}$
 through $\boldsymbol {\nabla } y \boldsymbol {\cdot } \boldsymbol {\kappa }$
 , but this feature allows us to study the effect of the terms separately. We now proceed to a case study demonstrating that the critical gradient can be strongly affected by manipulating the geometry of actual stellarator magnetic fields.
4. Case study: controlling the critical gradient in a stellarator using field period number
Conventional wisdom holds that the ITG can be suppressed if the parallel extent of bad-curvature wells (connection length) is reduced, as this would increase Landau damping of the modes that are localized to such regions. The inverse connection length is often approximated as ${k_{\parallel }} \sim 1/(qR)$ with R as the major radius; this implies a characteristic damping frequency ${k_{\parallel }} v_{T}$
 for the ITG, as frequently used since the late 1980s in tokamak research (e.g. Dominguez & Rosenbluth Reference Dominguez and Rosenbluth1989; Kim & Horton Reference Kim and Horton1991). To test this idea in stellarators, one could manipulate a given equilibrium by increasing the toroidal field period number at constant aspect ratio so as to shorten all parallel length scales as the field periods are packed tighter into the torus (Plunk et al. Reference Plunk, Xanthopoulos, Weir, Bozhenkov, Dinklage, Fuchert, Geiger, Hirsch, Hoefel and Jakubowski2019). We carry out a procedure like this below. As we shall soon see, however, what sets the ITG critical gradient in this case is the global shear and not the local connection length as expected.
4.1. Helical magnetic fields
We begin with the helical solutions to Laplace's equation in cylindrical coordinates $(r_{\text {hel}},\phi ,z)$ described in Morosov & Solov'ev (Reference Morosov and Solov'ev1966) and employed by Bhattacharjee et al. (Reference Bhattacharjee, Sedlak, Similon, Rosenbluth and Ross1983) to create ‘straight’ stellarators. Note $\phi$
 here is not to be confused with the electrostatic potential $\phi (\boldsymbol {x})$
 introduced in § 2. The solutions are eventually embedded into tori at large aspect ratio to produce the final configurations used to calculate the ITG linear critical gradient. The pre-embedded helical vacuum fields depend only on the radius and the helical angle ${\theta }=\phi - \zeta z$
 , where $\zeta =2{\rm \pi} /L$
 is the pitch of the field lines. Here, $\theta$
 is to be distinguished from the poloidal angle $\theta _{\text {pol}}$
 defined in the introduction. The total height of the cylindrical solution is $L$
 , with $n_{\text {fp}}= \zeta n$
 as the total number of helical field periods. The helical shapes are chosen in part because this continuous symmetry automatically implies quasisymmetry, which is only slightly broken during the embedding process. The solution of $\nabla ^{2}\varPhi =0$
 ($\boldsymbol {B}=\boldsymbol {\nabla } \varPhi$
 ) is written (Morosov & Solov'ev Reference Morosov and Solov'ev1966)

where $B_{0}$ is the constant magnetic field strength of $B_{z}$
 , $b_{n}$
 are the perturbing magnetic field amplitudes that provide the rotation of the field lines, $\textrm {I}_{n}$
 is a modified Bessel function and $n$
 is the index of the perturbation harmonic. The vector potential $\boldsymbol {A}$
 is found using ${\partial } \varPhi /{\partial } r_{\text {hel}} = -{\partial } A_{\phi }/ {\partial } z$
 and $(1/r_{\text {hel}}){\partial } \varPhi /{\partial } \phi = {\partial } A_{r_{\text {hel}}}/ {\partial } z$
 , setting $A_{z}=0$
 . We choose a single helical perturbation $n=2$
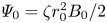
 and define the flux function as $\varPsi =\zeta r_{\text {hel}} A_{\phi }$
 . The characteristic radius $r_{0}$
 is defined through $\varPsi _{0}=\zeta r^{2}_{0}B_{0}/2$
 . Setting $\varPsi =\varPsi _{0}$
 then leads to

relating $r_{\text {hel}}$ to ${\theta }$
 for a flux surface $\varPsi _{0}$
 . Here, $n=2$
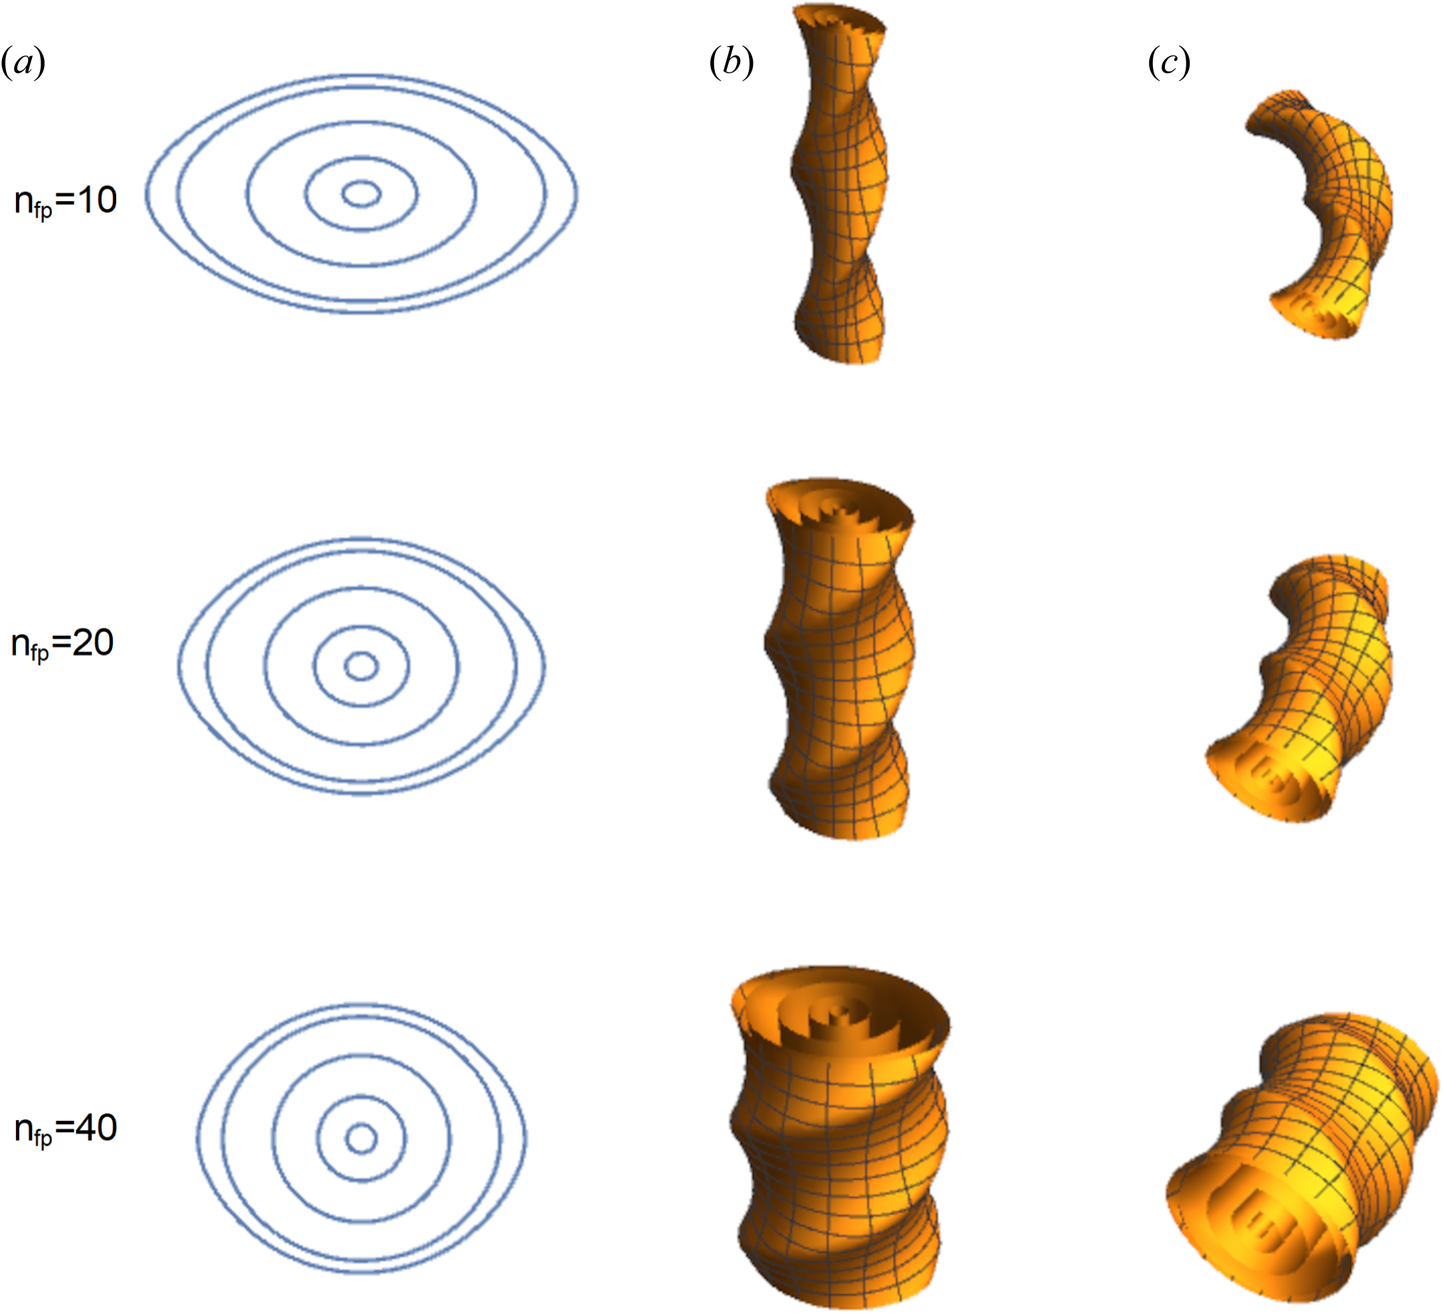
 is chosen because it is the only helical perturbation that can sustain elliptical surfaces, and hence finite rotational transform, near the magnetic axis. With this choice, (4.2) produces lens-shaped rotating flux surfaces, with ellipses at inner radii and cusp edges, as the edge surfaces are bounded by a separatrix whose radius depends on $\zeta$
 and $b_{2}/B_{0}$
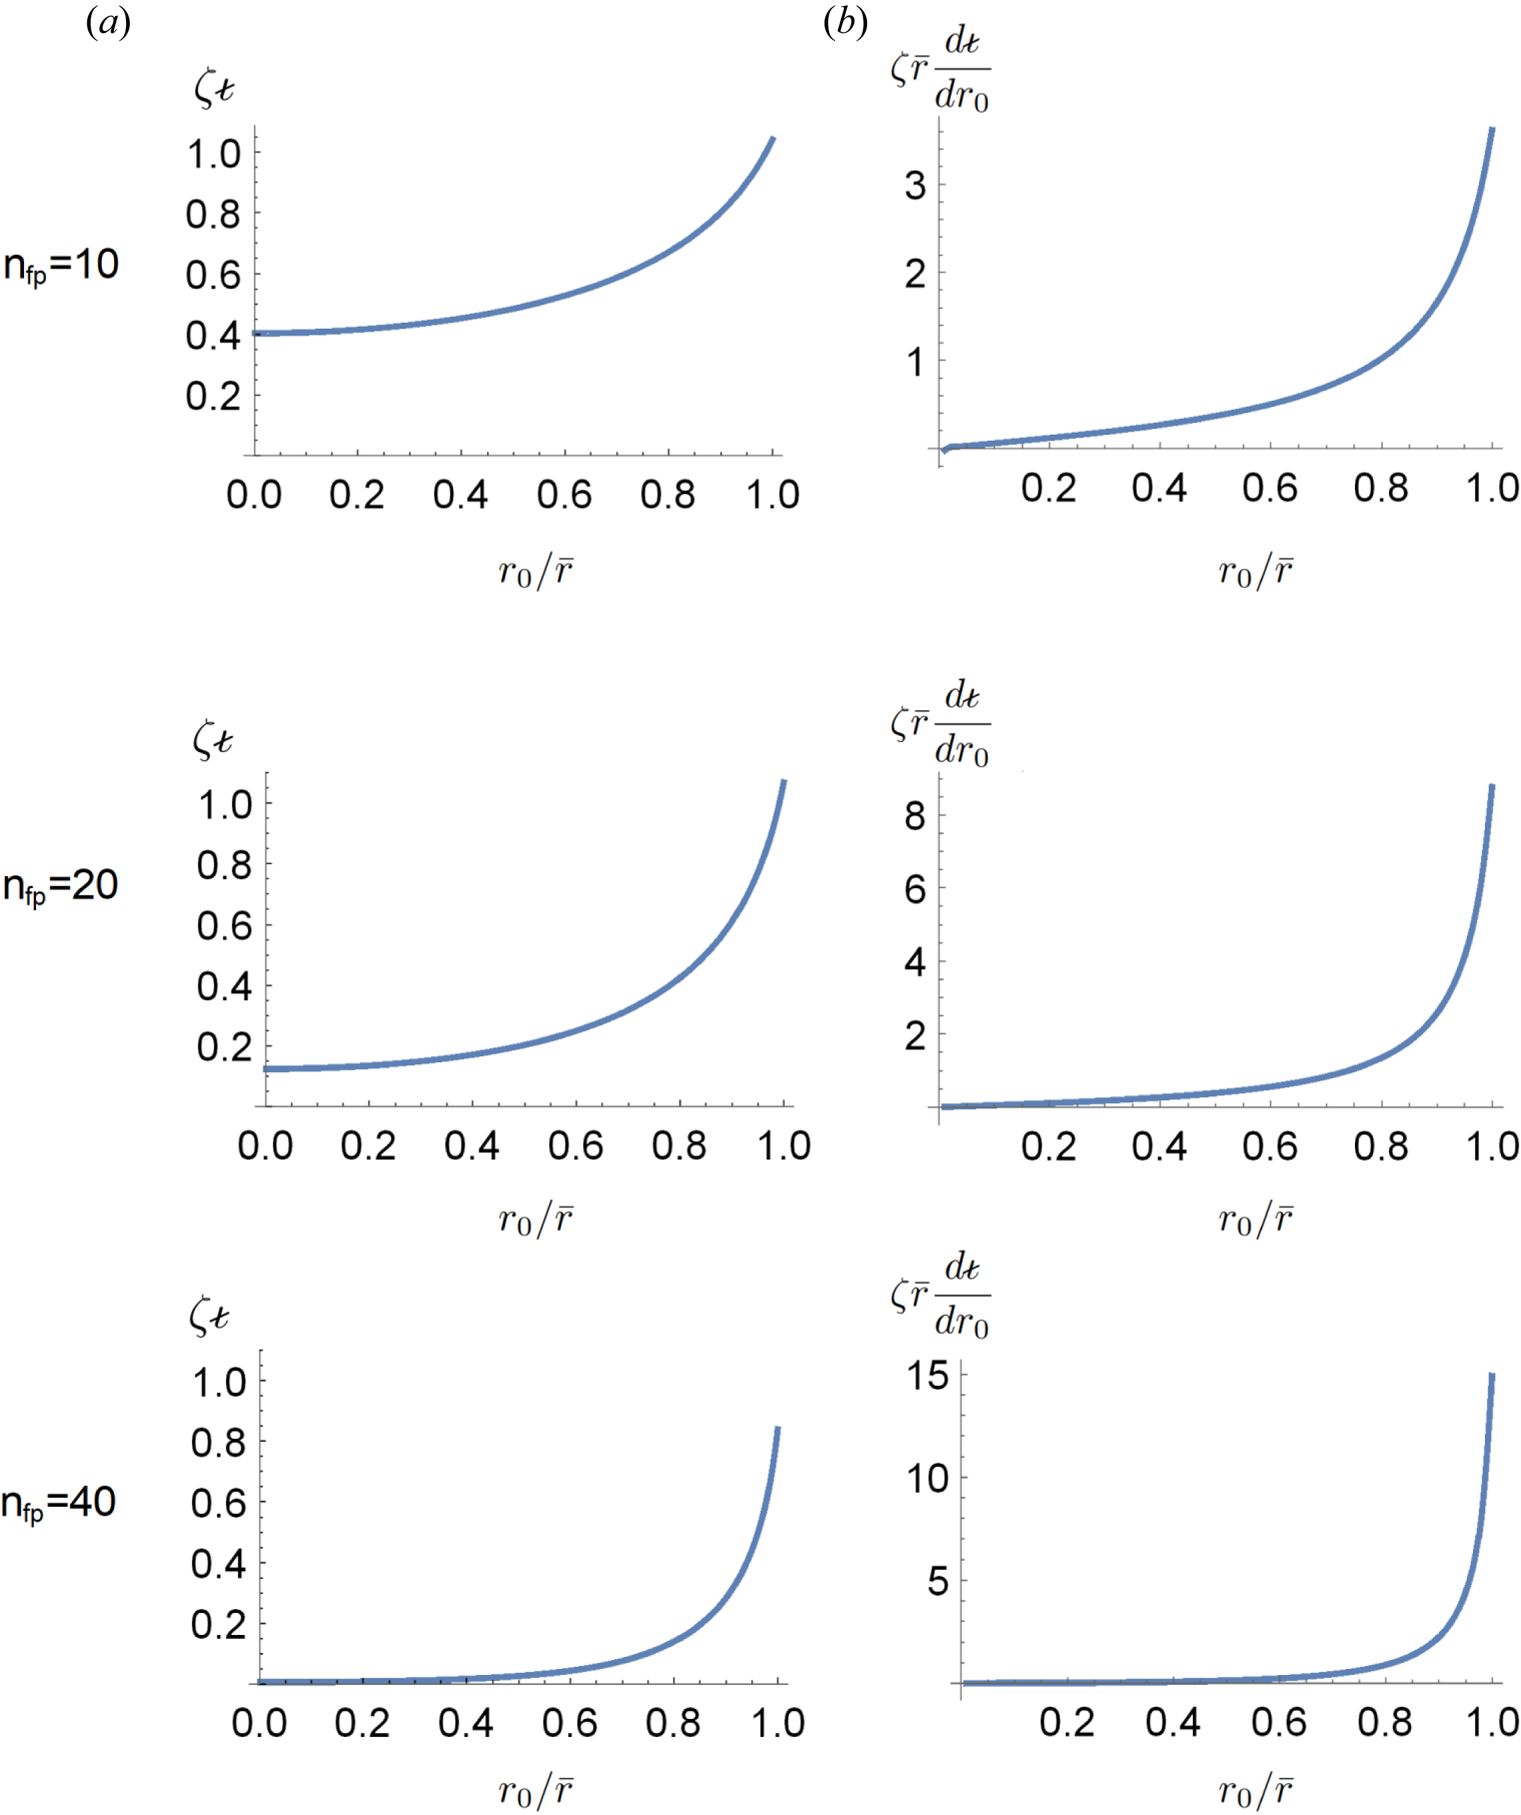
 . Cross-sections for these shapes are shown in figure 3(a), which are described in detail in § 4.3. The rotational transform and global shear profiles of these shapes are presented in figure 4.
Scan in helical field period number of the solutions to (4.2). Each row corresponds to a field period number $n_{\text {fp}}=n\zeta$ and each lettered column is a different plot. (a) Cross-sections of each configuration for a variety of flux surfaces. (b) Extrusion of the helical cross-sections into cylindrical tubes with two field periods shown. (c) The same tubes as in (b) but now embedded into a toroidal shape.
Analytic results from the helical shapes in cylindrical geometry before embedding into a torus for each field period number $n_{\text {fp}}=n \zeta$ . (a) Total rotational transform ($\zeta \times {\style{display: inline-block; transform: rotate(31deg)}{\raise1.5pt{\tiny{/}}}\kern-1.4pt\iota}$
 of (C1)) as a function of $r_{0}/\bar {r}$
 . (b) The derivative of the quantity in (a) times $\bar {r}$
 as a measure of global shear.
4.2. Toroidal embedding
To generate an equilibrium, a fixed outer surface $r_{0}=\bar {r}$ that lies within the separatrix is chosen. This surface is then used to generate a toroidal field using a mapping, described as follows. The outer surface of the helical field, denoted by $r_{H}({\theta },z)$
 in the helical coordinate system, is first found by solving (4.2). The toroidal surface is then described by $x_{T}({\theta },\phi _{T})=\hat {R}(\phi _{T}) R_T({\theta },\phi _{T}) + \hat {z}_{T} Z_{T}({\theta },\phi _{T})$
 , where $R_T({\theta },\phi _{T})=R_{0}+r_{H}({\theta },\phi _{T}/(2{\rm \pi} ))\cos ({\theta })$
 and $Z_{T}({\theta },\phi _{T})=r_{H}({\theta },\phi _{T}/(2{\rm \pi} ))\sin ({\theta })$
 . The $z$
 -axis of the helical system is thereby mapped to a circle, with $\phi _{T}=2{\rm \pi} z$
 . Here, $\phi _{T}$
 is a geometric toroidal angle not to be confused with the azimuthal angle $\phi$
 in cylindrical coordinates. Note that the helical angle $\theta$
 has become a geometric poloidal angle in these coordinates (it is a one-to-one mapping), and the $\hat {z}_{{T}}$
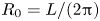
 unit vector points vertically, aligned with the axis of the toroidal surface. We have also defined a major radius-like parameter $R_{0}=L/(2{\rm \pi} )$
 .
.
The toroidal surface is passed to VMEC (Hirshman & Whitson Reference Hirshman and Whitson1983) as the input. The inverse aspect ratio of the torus is approximately ${\epsilon }=\bar {r}/R_{0}=1/10$ , as $\bar {r}$
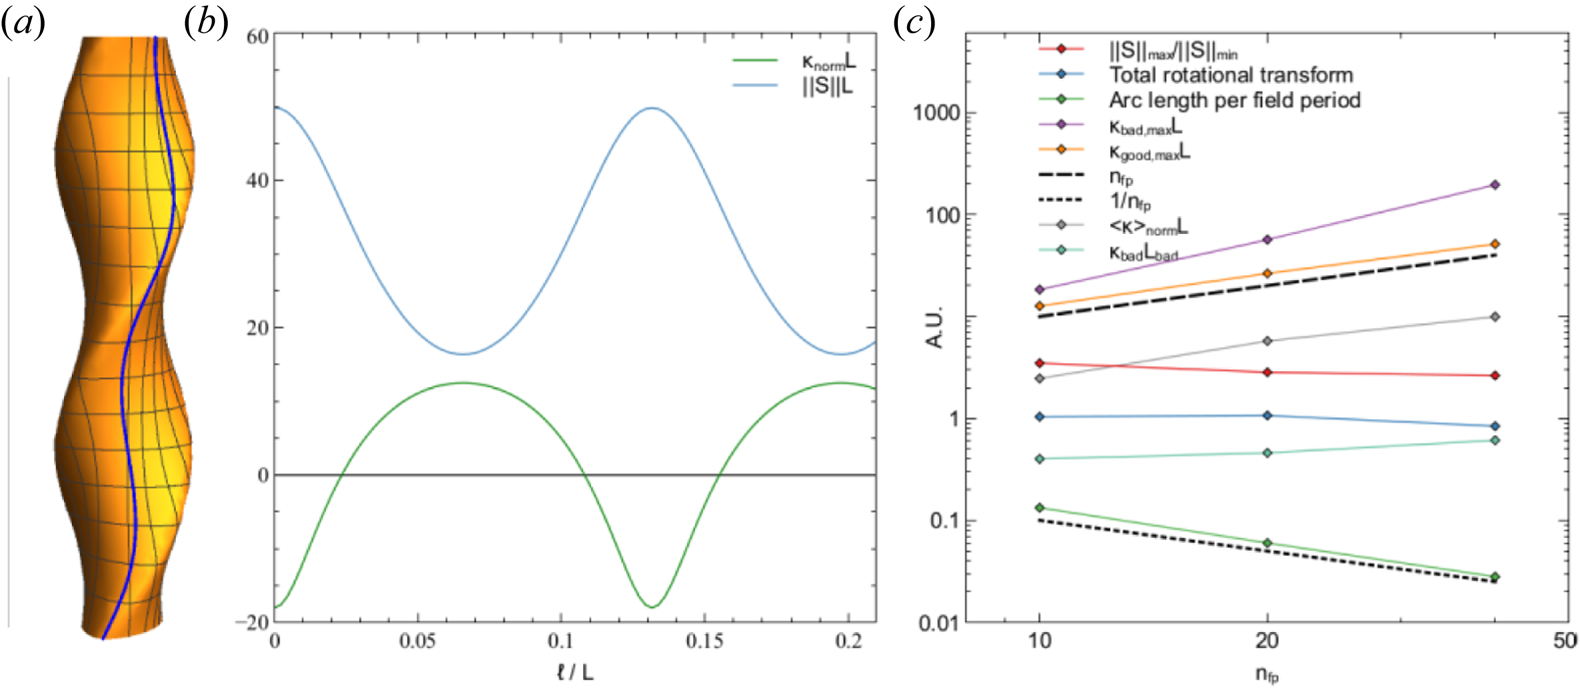
 is effectively the minor radius of the outer surface of the VMEC solution. Because the inverse aspect ratio is small, most geometric quantities, such as rotational transform, are well approximated by the values of the helical solution. As such, we approximate the scaling of important quantities, such as arc length per field period and rotational transform, in the final toroidal configurations using the analytic theory in cylindrical coordinates (Appendix C). In figure 5(a), we show a field line on the surface $r_{0}/\bar {r}=0.9$
 for $n_{\text {fp}}=10$
 . The field line alternates between regions of ‘good’ (positive) and ‘bad’ (negative) normal curvature $\boldsymbol {\kappa } \boldsymbol {\cdot } \boldsymbol {\nabla } \varPsi$
 (figure 5b).
Field-line geometry calculations. (a) The surface $r_{0}/\bar {r}=0.9$ for $n_{\text {fp}}=10$
 (orange) and the magnetic field line starting at $\phi =0,z=0$
 (blue curve). (b) Normal curvature and shear amplification (C5) along the field line in (a). (c) Field-line geometry outputs as a function of $n_{\text {fp}}$
 with diamonds representing data points and curves connecting them on a log–log plot. The curves are: shear amplification factor $||S||_{\mathrm {max}}/||S||_{\mathrm {min}}$
 (C5) (red), total surface rotational transform $\zeta \times {\style{display: inline-block; transform: rotate(31deg)}{\raise1.5pt{\tiny{/}}}\kern-1.4pt\iota}$
 of (C1) (light blue), arc length per field period (green), maximum bad normal curvature (purple), maximum good normal curvature (orange), the line $y=n_{\text {fp}}$
 (black dashed), the line $y=1/n_{\text {fp}}$
 (black double dashed), average normal curvature (grey), and maximum bad curvature times the length of the bad curvature well (turquoise).
4.3. Scaling up field period
We now increase the field period number of the original helical equilibria by scaling up $\zeta$ but keeping $\bar {r}$
 and $n=2$
 fixed and reducing $b_{2}/B_{0}$
 to maintain closed flux surfaces [$b_{2} \simeq 0.3/(\zeta \,\textrm {dI}_{2}(2\zeta r_{\text {hel}})/\textrm {d}(2\zeta r_{\text {hel}})|_{\bar {r}})$
 ]. Reducing $b_{2}/B_{0}$
 decreases poloidal derivatives and keeps edge rotational transform roughly constant, while increasing $\zeta$
 at fixed minor radius scales up the toroidal and radial derivatives as dictated by the vacuum solutions. The results of the field period scaling are shown in figure 3 for $n_{\text {fp}}=n\zeta =10$
 , $20$
 and $40$
 , where each field period number is a row of the figure. Figure 3(a) shows the cross-sections of several surfaces in each configuration. At lower field period, the surfaces are noticeably elliptical all the way inward to the axis, while the cross-sections become circular as $\zeta$
 is increased, except for cusp-like edges that persist near $\bar {r}$
 . Figure 3(b) shows two helical field periods of each configuration and the vertical compression of these field periods from larger field period number while figure 3(c) shows the same two field periods after the toroidal embedding. We find in plots of the rotational transform (C1) and its derivative (figures 3(c) and 3(d), respectively) that the strong radial derivatives at high-field period suppress rotational transform in the core of the configurations and sharpen the cusp-like edges, which increases global shear near the outermost flux surface. In addition, the regions of bad curvature get squeezed into smaller and smaller field line segments as the field period is scaled up (figure 5c).
As the field period is increased, global shear at the edge becomes the dominant factor in setting the ITG mode correlation length and thus the critical gradient. Gyrokinetics in the sheared slab limit (cf. Landreman, Plunk & Dorland Reference Landreman, Plunk and Dorland2015) tells us that, based on dimensionless ratios, the shearing length $L_{s}$ replaces ${\lambda _{||}}$
 in the estimate (3.3) for the critical gradient such that $L_{s}/L_{T\text {crit}}=F$
 , where $F$
 depends on dimensionless system parameters such as $\tau$
 . The shearing length, which comes from the secularly growing part of $g^{yy}$
 , can be estimated by fitting a parabola to the profile of $g^{yy}({\ell })$
 and setting the resulting coefficient of ${\ell }^2$
 to be $1/L^{2}_{s}$
 . This component increases with global shear and thus the critical gradient increases in proportion with toroidal field period number.
4.4. GENE simulations near the outer flux surface
The ITG linear critical gradients for the three equilibria $n_{\text {fp}}=10,20,40$ (figure 6) are found by generating the solutions with the VMEC code (Hirshman & Whitson Reference Hirshman and Whitson1983), passing them to the GIST package (Xanthopoulos et al. Reference Xanthopoulos, Cooper, Jenko, Turkin, Runov and Geiger2009) and running the GENE code with the GIST output. In the GIST normalization, the temperature gradient and parallel length scales are now expressed relative to an effective minor radius $a \simeq \bar {r}$
 . As in § 3.3, $T_{e}=T$
 , electrons are adiabatic, there is no density gradient and $m=0$
 such that $k_{x}=0$
 . The standard twist-and-shift parallel boundary condition is used. We choose a flux tube in the outboard midplane $\theta _{\text {pol}}=0$
 on the surface where (toroidal flux/edge $\text {toroidal flux}=0.99$
 ) for the three cases, with the toroidal angle defined to be zero, starting where the rotating cross-section is level with the midplane. The ITG linear critical gradient is found by varying $a/L_{T}$
 until $\gamma \rightarrow 0+$
 , where $a$
 is the average minor radius and is a constant set in the GIST package. Here we do a scan in $k_{y}\rho$
 to determine the global marginal mode. In figure 6(a), we plot the results of $a/L_{T}$
 scans in which the critical mode was found. We obtain a critical gradient $a/L_{T}\simeq 2.40$
 for $n_{\text {fp}}=10$
 , which then scales almost exactly with field period $(a/L_{T}\sim 2,4,8)$
 . The profiles of $g^{yy}$
 along the flux tube are plotted in figure 6(b), from which it becomes clear that the dominant length scale is set by the global shear parabola. The mode structures along the field line for the critical modes are plotted in figure 6(c). It can be inferred from these results that the lower bound on the critical gradient of the ITG mode, which pertain to broad-along-the-field-line, low-$k_{y}$
 resonant modes, is set by global shear. Note that lower $k_{y}\rho$
 modes than those predicted by the local slab theory (3.1) are to be expected, because $k_{y}\rho$
 corresponds to the minimum value of ${k_{\perp }} \rho$
 and ${k_{\perp }} \rho$
 increases away from ${\ell }=0$
 when global shear is included. Thus small $k_{y}\rho$
 is a signature of the sheared slab mode, as observed in GENE simulations of low-global-shear stellarators such as W7-X (Zocco et al. Reference Zocco, Xanthopoulos, Doerk, Connor and Helander2018) and HSX (Faber et al. Reference Faber, Pueschel, Terry, Hegna and Roman2018). Because $n_{\text {fp}}=1/\epsilon =10$
 retains rotational transform at the centre of the device (figure 4a), we speculate that setting $n_{\text {fp}}=1/\epsilon$
 may help the ITG-mode stability, as such a configuration can still enjoy the benefits of reduced parallel length scales (compared with smaller field period numbers) while not increasing global shear too sharply throughout the volume.
ITG linear simulations of toroidally embedded helical equilibria on the field line $\theta _{\text {pol}}=0$ on the surface with $99\,\%$
 of the edge toroidal flux. The colour coding is $n_{\text {fp}}=10$
 (light blue), $20$
 (green) and $40$
 (red). (a) Scan in $a/L_{T}$
 with $a$
 as the normalized average minor radius. Convergence to the linear critical gradient $\gamma \rightarrow 0$
 for the last growing mode near marginality is found. (b) Plot of $g^{yy}$
 along the field line showing strong global shear as well as helical ripples. (c) Plot of $|\varphi |$
 normalized to its maximum value along the field line showing reduction of the mode width as shear increases.

5. Direct calculation of the ITG linear critical gradient
The integral equation (2.8) includes the full physics of the linear electrostatic ITG critical gradient with adiabatic electrons. It also assumes $\mathrm {d}|\boldsymbol {B}|/\mathrm {d}{\ell }=0$ such that particle trapping is neglected and all ions can be treated as passing. The integrals contained can be challenging to evaluate as they contain a singularity and are oscillatory. Equation (2.8) has been solved for the case of a circular tokamak geometry (Romanelli Reference Romanelli1989) assuming finite $\gamma$
 and a density gradient. We start by setting $\gamma = {\mathrm {Im}} [\omega ]=0$
 and, as mentioned in § 3.2, curvature now enters into the problem by modifying the phase factor $\lambda$
 , which we define as

where (2.9) was used and $\left \langle \cdot \right \rangle$ denotes an average over the parallel length between $\ell$
 and $\ell ^{\prime }$
 , i.e.

If ${\left \langle {\tilde {\omega }_d} \right \rangle } = {\left \langle {\omega _d} \right \rangle }( {x_{\parallel }}^2+ {x_{\perp }}^2/2)$ is positive (‘average bad curvature’), cancellation with ${\omega }$
 can happen, which leads to a decrease of $\lambda$
 and thus an increase in the effective correlation length $v_{T}/\lambda$
 through the drift resonance. This is the primary drive mechanism for the toroidal branch of the ITG and leads to the onset of resonant modes driven by curvature explored in § 3.4. Because the case ${\left \langle {\omega _d} \right \rangle } < 0$
 (average ‘good curvature’) eliminates the resonance (we use the sign convention ${\omega _*^{{T}}},{\omega }>0$
 ), it is expected to provide uniform stabilization of the mode by increasing the magnitude of the phase factor and effectively decreasing the correlation length $v_{T}/\lambda$
 . However, even ${\left \langle {\tilde {\omega }_d} \right \rangle }>0$
 can lead to damping of the mode, as mentioned in § 3.4, by pulling the mode out of the drift resonance once ${\left \langle {\tilde {\omega }_d} \right \rangle } > {\omega }$
 . Thus, in the cases where $\lambda$
 is large and of either sign, curvature can result in a damping effect from decorrelation similar to that of the parallel slab resonance (§ 3.1).
Note that the effect of curvature on the drive of the mode may not be reflected in the mode width. For instance, the average curvature can be roughly uniform and have no outward effect on the mode structure, but it may affect the drive of the mode, especially for an extended slab-like mode as tends to be seen near marginality. We thus caution that the mode width and the distance between local features in the geometry (nominal connection length) are both potential ‘red herrings’ that generally do not reveal the correlation length ${L_{\parallel }}$ . In fact, ${L_{\parallel }}$
 is a ‘hidden’ length captured by the integral equation (2.8) that can be less than the mode width. With some basic understanding of the physics of curvature in hand, we now outline the steps to solving (2.8).
5.1. $ {x_{\perp }}$ Integration

Some analytical progress can be made in (2.8) by performing the $ {x_{\perp }}$ integral first (Romanelli Reference Romanelli1989) using Weber's formula,

where the first term of the magnetic drift velocity $\boldsymbol{\boldsymbol{\nabla}}\ln B$ , has been absorbed into the factor $p=1+\textrm {i}\, {\bar {\omega }_{d}}/(2 {x_{\parallel }} {v_{{T}}})$
 , with ${\bar {\omega }_{d}} \equiv |\ell -\ell ^{\prime }|\left \langle {\omega _d} \right \rangle$
 . The singularity at $ {x_{\parallel }}=0$
 in $p$
 causes no obvious issues because Weber's formula is valid for $\mathrm {Re}[p]>0$
 , which is guaranteed by the $1$
 coming from the Maxwellian in x⊥. The term $\propto {x_{\perp }}^3$
 from the ${\omega _*^{{T}}}$
 factor can also be integrated analytically by writing it as a $p$
 derivative of (5.3) yielding what we call ${\widehat {\varGamma _{1}}}$
 (Appendix B).
The $\hat {\varGamma }$ functions contain interactions between curvature and shear. Curvature can provide additional oscillatory behaviour to the integral through the imaginary term in $p$
 and can suppress the effect of shear in the exponent and $\textrm {I}_{0}$
 if $1/p$
 is very small, although this tends to be the limit where phase mixing from ${\bar {\omega }}$
 already suppresses the integral for ${\left \langle {\omega _d} \right \rangle } < {\omega }$
 . The ${\widehat {\varGamma _{0}}}$
 behaves similarly to a Dirac delta function $\delta (({b(\ell )} - {b(\ell ^{\prime })})/p)$
 , which causes large suppression if ${b(\ell )}$
 and ${b(\ell ^{\prime })}$
 are very large and different but gives a finite contribution to the integral if ${b(\ell )} \simeq {b(\ell ^{\prime })}$
 or $1/p<{b(\ell )} - {b(\ell ^{\prime })}$
 . These observations follow from the asymptotic form of $\textrm {I}_{0}$
 at large argument.
5.2. $ {x_{\parallel }}$ Integration

Equation (2.8) can now be written

where ${\bar {\omega }} \equiv |\ell -\ell ^{\prime }|{\omega }$ . The $ {x_{\parallel }}$
 integration can also be done analytically in the case of $p=1$
 (${\omega _d}=0$
 ) when written as Meijer G-functions times ${\widehat {\varGamma _{0}}}$
 or ${\widehat {\varGamma _{1}}}$
 , although the logarithmic singularity at ${\ell ^{\prime }}={\ell }$
 and $ {x_{\parallel }}=0$
 must still be avoided in the ${\ell ^{\prime }}$
 integration.
Returning to the general case including curvature, we note that for ${\ell } \ne {\ell ^{\prime }}$ , the $ {x_{\parallel }}^{-1}$
 singularity is shielded by the oscillatory behaviour in the ${\bar {\omega }}$
 exponent and also negated by the factor $1/p \rightarrow 0$
 for $ {x_{\parallel }} \rightarrow 0$
 and ${\left \langle {\omega _d} \right \rangle } \ne 0$
 in (5.4). In numerical solutions of the $ {x_{\parallel }}$
 integration (we know of no analytical expression for the integral including ${\omega _d}$
 ), the $ {x_{\parallel }}$
 integrand at ${\ell } = {\ell ^{\prime }}$
 is replaced by the centred average of its values at ${\ell ^{\prime }}= {\ell } \pm \xi \delta {\ell }$
 , where $\delta {\ell }$
 is the spacing of the parallel coordinate grid and $\xi = 1/8$
 for the results presented in § 5.4.
5.3. ${\ell ^{\prime }}$ Integration

We now discretize $\varphi ({\ell })$ to evaluate the integral in (5.4) by assuming that $\varphi$
 is piecewise constant over $N$
 sub-domains, with ${\ell }$
 set to be at the centre point of each sub-domain. This allows us to extract the constant $\varphi$
 and integrate the remaining kernel numerically across each sub-domain, which yields an $N \times N$
 matrix $\boldsymbol {G}$
 such that (5.4) becomes $\varphi _{i}=G_{ij}\varphi _{j}$
 . The numerical integration is done over an ${\ell ^{\prime }}$
 grid with $N^{\prime }$
 points. The ${\ell }$
 grid overlaps with the ${\ell ^{\prime }}$
 grid but we use a finer resolution in ${\ell ^{\prime }}$
 such that $N^{\prime }\geqslant 2N+1$
 . This reduces the total number of integral evaluations by a factor $N^{\prime }/N$
 compared with a scheme where $N=N^{\prime }$
 but can resolve basic mode structures, such as a mode that peaks near ${\ell }=0$
 and decays for large enough $|{\ell }|$
 , as could be modelled with $N \geqslant 3$
 . The scheme still captures some of the effect of fine-scale features in the geometry through the ${\ell ^{\prime }}$
 integration.
Equation (5.4) is finally written as

where ${\mathbb 1}$ is the identity matrix of size $N$
 . Note that condition (5.5) is satisfied only if there is an eigenvector with zero eigenvalue, because the determinant is the product of the eigenvalues.
5.4. Eigenvalue problem
Equation (5.5) is traditionally considered as an eigenvalue problem, with the complex quantity ${\omega }$ as the eigenvalue. Here we reinterpret it by treating the pair of real frequencies $({\omega },{\omega _*^{{T}}})$
 as the eigenvalue. It is not clear a priori whether the integral equation should be well-behaved at $\gamma =0$
 (because it was derived assuming $\gamma >0$
 as in Connor et al. Reference Connor, Hastie and Taylor1980). We find, however, that the determinant smoothly approaches zero and a root can be found to eight digits of precision, which proves the concept for finding the critical ${\omega _*^{{T}}}$
 (and hence critical gradient) as an eigenvalue of the dispersion relation. We use a numerical Newton solver to obtain roots to this equation for three test cases: the sheared slab geometry plotted in 1(a) (3.4), the same case but with constant ‘bad’ curvature ${\omega _d}=\sqrt {2}k_{y}\rho v_{T}/(2L_{0})$
 and the case with constant ‘good’ curvature ${\omega _d}=-\sqrt {2}k_{y} \rho v_{T}/(2L_{0})$
 , where the effective radius of curvature in the latter two cases is ${R_{\mathrm {eff}}}=k_{y} \rho v_{T}/(\sqrt {2}{\omega _d})=L_{0}/2$
 . The mode has $k_{y}\rho ={k_{\perp }}\rho =0.8$
 , i.e. no sweep in $k_{y}$
 space is performed to find the true critical mode, but the change in the onset of the single, marginal ITG mode with $k_{y}\rho =0.8$
 is tracked. A root is found for the values $N=1,10,20,40,80$
 ($1< N<10$
 does not always converge on a sensible answer), keeping a fixed $N^{\prime }=161$
 for the three cases.
In figure 7(a), we plot the eigenvalues ${\omega _*^{{T}}}$ against the critical gradients obtained from linear GENE simulations with the same shear profile and the appropriate constant curvature added. For large $N$
 , the curves show agreement with the GENE critical gradients to within $6\,\%$
 . The convergence is non-uniform (fluctuating about the presumed fully converged answer) because the numerical method uses three grids to evaluate the ${\ell ^{\prime }}$
 integral, only one of which is refined in this series by increasing $N$
 . There is uncertainty in the critical gradients read off from the GENE simulations owing to finite precision of the GENE solution and the requirement of finding a mode above marginality ($\gamma >0$
 ). As such, we consider convergence to within $6\,\%$
 deviation from the GENE critical gradient to be acceptable.
Validating solutions of (5.4) against GENE simulations. (a) Scan in $N$ , the number of points in ${\ell }$
 , used for the solution of (5.4) showing convergence of the eigenvalue ${\omega _*^{{T}}}_\text {crit}$
 (squares connected by dashed lines) for the shear geometry of § 3.3 with varying constant curvature, where black is the slab case with no curvature, green is with ‘good’ curvature ${R_{\mathrm {eff}}}=-L_{0}/2$
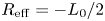 and red is the ‘bad’ curvature case ${R_{\mathrm {eff}}}=L_{0}/2$
 . Values taken from GENE are plotted as solid horizontal lines for validation of the root find. (b) Mode structures from GENE for the three geometries in (a) with the same colour scheme and dashed lines for cases with curvature. (c) Step function representation of $|{\varphi }|$
 from the solution of (5.4) with $N=20$
 overlaid on the GENE solution of $|{\varphi }|$
 (dashed) for the slab case with no curvature.

As expected in the case of a modified slab mode with ${\omega } > {\left \langle {\omega _d} \right \rangle }$ , curvature shifts the critical gradient for $k_{y0}=0.8$
 up (good curvature) or down (bad curvature) by roughly $10\,\%$
 , which is comparable to the ratio ${\left \langle {\omega _d} \right \rangle }/{\omega }_{\mathrm {slab}}\simeq 1/5$
 . The plots of $|{\varphi }({\ell })|$
 from GENE confirm that the slab solution mode structure is barely affected by the curvature (figure 7b). For the solutions with $N=1$
 in figure 7(a), very little difference between the good, bad and zero curvature cases is seen and the critical gradients from the root finds are approximately half the converged answers. A large deviation for $N=1$
 is not surprising because the requirement that $\varphi =0$
 at the boundaries in ${\ell }$
 is not even satisfied by a constant $\varphi$
 . In figure 7(c), we show the approximate eigenfunction for $N=20$
 overlaid on the GENE solution for the zero curvature case to visualize the discretization scheme. The choice $N=20$
 captures the rapid decay of the eigenfunction near $|{\ell }|/L_{0}=1/2$
 particularly well.
A convergence check for the $N=10$ bad curvature case was also performed with finite positive gamma to ensure that no discontinuities between $\gamma =0$
 and $\gamma > 0$
 were present, e.g. delta function terms $\propto \delta (\gamma )$
 that appear in quasilinear theory of the ITG mode (Helander & Zocco Reference Helander and Zocco2018). A root was found after setting a fixed $\gamma /|{\omega }|\simeq 0.01$
 , where ${\omega }$
 is that of the $\gamma =0$
 solution. A corresponding increase of one percent in both ${\omega }$
 and ${\omega _*^{{T}}}$
 relative to the case of $\gamma =0$
 occurred, which suggests the solutions are smooth near $\gamma =0$
 . It may be that an averaging effect from integrating over many points in ${\ell ^{\prime }}$
 helps regularize the integral for $\gamma =0$
 .
.
6. Discussion
In this work, the gyrokinetic ITG mode linear critical gradient has been investigated using analytic theory and numerical models in flux tube geometries. We found that traditional connection length estimates often do not adequately capture the physics of the onset of the linear electrostatic ITG mode, and that instead the correlation length ${L_{\parallel }}$ , which emerges in the solution of the integral equation (2.8), is the appropriate reference length that sets the critical gradient through the damping frequency $v_{T}/{L_{\parallel }}$
 . The correlation length can be determined by local shear, global shear, curvature or some combination of all three of these geometric properties. It has long been assumed that strong local shear features inherent to stellarators will stabilize ITG turbulence. However, in § 3.3, we discovered using numerical experiments that large shear amplification factors of the perpendicular wavenumber ${k_{\perp }}({\ell })$
 with broad extent along the field line are needed to significantly increase the ITG mode linear critical gradient. Using this model as a basis, we then showed the onset of curvature-driven resonant ITG modes, whose correlation length is set by the peak magnitude of drift curvature in § 3.4. Subsequent experiments in § 4 revealed that the absolute critical gradient for the ITG can be predictably increased through global shear by the field period number using helical stellarator shapes. The optimal field period number may be close to the toroidal aspect ratio of the configuration, because for larger field periods, the benefits to the ITG mode are localized to small radial layers. Motivated by this evidence, we turned to direct calculation of the critical gradient in § 5.4 through solving equation (2.8), in which we observed that average magnetic drift over the mode extent is likely the most important factor in setting the critical gradient aside from global shear.
We note that several approximations were made in solving equation (2.8) that constrain the validity of the solution, such as neglecting particle trapping and electromagnetic effects on the ITG mode associated with finite plasma $\beta$ (Zocco, Helander & Connor Reference Zocco, Helander and Connor2015). However, trapped particles may ultimately only contribute weakly to the linear behaviour of the ITG (Proll, Xanthopoulos & Helander Reference Proll, Xanthopoulos and Helander2013), especially if this particle population is small. This may occur in optimized stellarators because reducing trapped particle fractions is one way to lower neoclassical transport (Dinklage et al. Reference Dinklage, Beidler, Helander, Fuchert, Maaßberg, Rahbarnia, Sunn Pedersen, Turkin, Wolf and Alonso2018).
The method we have devised to calculate the linear critical gradient has several potential advantages over running a traditional gyrokinetic linear solver. First, simulations become increasingly difficult approaching the critical gradient, owing to the large timescales required for convergence, whereas there is no time variable for our eigenvalue problem. The numerical grid for gyrokinetic solvers generally also includes two velocity coordinates, whereas our approach integrates over these variables, leaving a single variable, the field line following coordinate. While we can only speculate for now, we suspect an optimized solution of (2.8) using tabulated integrals and a decent initial guess for $({\omega },{\omega _*^{{T}}})$ should take approximately a second per value of $k_{x}$
 or $k_{y}$
 on a single processor for $N=10$
 points used in the discretization of the eigenmode structure. For reference, the parallelized GENE simulation close to the critical gradient depicted in figure 1(a) took approximately 20 s for the marginal $k_{y}\rho$
 , and this was the result of a sweep downward from higher guesses of $a/L_{T}$
 .
.
The simple numerical model developed in § 3 and used to validate the solver in § 5.4 does not use the true geometry of stellarators but does contain field-line varying metric coefficients. As such, while a stellarator would have more complicated variation along the field line, the evaluation of the geometry inputs would be the same as in our simple model. The possibility of a rapid calculation of the critical gradient,as a general figure of merit for ITG turbulence, is an appealing prospect for stellarator optimization. Work toward this goal is now underway.
Acknowledgements
G.T.R.C. would like to thank M.J. Pueschel, T. Görler, and A. Bañon Navarro for essential help with running the GENE code, as well as A. Zocco for helpful discussions and comments on the manuscript. We also thank the anonymous reviewers for their help in improving the clarity and content of the manuscript. The GENE simulations were carried out on the draco cluster located at IPP Garching in Germany.
Editor William Dorland thanks the referees for their advice in evaluating this article.
Funding
This work was supported by a grant from the Simons Foundation (No. 560651, P. H.).
Declaration of interests
The authors report no conflict of interest.
Appendix A. Ballooning theory
Equation (2.3) is a differential at the first order in $\ell$ and can be recast in integral form by taking the right-hand-side as a source and integrating directly, as shown by Connor et al. (Reference Connor, Hastie and Taylor1980). This is done for each sign $\sigma = \mbox {sign}( {v_{\parallel }})$
 separately, because we will need to use $\sigma$
 -dependent boundary conditions. Rewriting (2.3) using $ {v_{\parallel }} = \sigma | {v_{\parallel }}|$
 , we have

We multiply this equation by the quantity $\exp (-\textrm {i}\sigma M(\ell _0, \ell ))$ , where

and integrate to arrive at the expression

where $ {v_{\parallel }}^{\prime } = {v_{\parallel }}(\ell ^{\prime })$ and $\textrm {J}_0^{\prime } = \textrm {J}_0(k_{\perp }(\ell ^{\prime })v_{\perp }(\ell ^{\prime })/\varOmega )$
 .
.
To fix the constant of integration $g_0$ , consider ${\mathrm {Im}}[{\omega }] = \gamma > 0$
 and $\ell _0 = -\sigma \infty$
 , then note that exponential divergence of the term $g_0 \exp (-\textrm {i} \sigma M)$
 will occur unless $g_0 = 0$
 . This is equivalent to applying the boundary conditions


Equation (A3) then becomes

Substituting this into (2.4) yields (2.8). This equation is also derived by Romanelli (Reference Romanelli1989) following Connor et al. (Reference Connor, Hastie and Taylor1980).
Appendix B. Weber integral
The term including the factors ${\omega _*^{{T}}} {x_{\perp }}^{3}$ in (2.8) is

where ${\widehat {\varGamma _{0}}}$ is defined in (5.3).
Appendix C. Helical equilibria calculations
C.1. Rotational transform
The average rotational transform on a helical surface can be computed from the equation of a field line, $r\, \mathrm {d}\phi /\mathrm {d}r=B_{\phi }/B_{r}$ . We quote the result of Morosov & Solov'ev (Reference Morosov and Solov'ev1966) for $n=2$
 ,
,


where $\hat {{\style{display: inline-block; transform: rotate(31deg)}{\raise1.5pt{\tiny{/}}}\kern-1.4pt\iota} }$ is the rotational transform per two helical field periods (called ${\omega }$
 in Morosov & Solov'ev Reference Morosov and Solov'ev1966), $r_{\mathrm {max}}$
 is the maximal surface radius (where ${\theta }=0$
 ), $r_{\mathrm {min}}$
 is the minimal radius (${\theta }={\rm \pi} /4$
 ) and $\delta \phi$
 is the total azimuthal displacement of a field line as ${\theta }$
 varies by $-{\rm \pi} /2$
 . Note that oscillatory behaviour is superimposed on the secular increase of $\phi$
 per field period and averaged out by the integration.
C.2. Coordinate-free representation of the geometry
The analytic solutions for the helical shapes (4.2) can be used to find geometric quantities. For instance, we can calculate a proxy measure for local shear from $\boldsymbol {S}=\boldsymbol {\nabla } \hat {b}$ , where ${\hat {b}}$
 is the unit magnetic field vector (not to be confused with $b=k^{2}_{\perp }$
 ). Noting that $\hat {b} \boldsymbol {\cdot } \boldsymbol {\nabla } {\alpha } = \hat {b} \boldsymbol {\cdot } \boldsymbol {\nabla } \varPsi = 0$
 , we find

where $\boldsymbol {k}_{\perp 0}=\boldsymbol {k}_{\perp }({\ell }=0)$ and $f({\ell })=k^{2}_{\perp }({\ell })/k^{2}_{\perp 0}$
 is the shear amplification factor. Thus we can find $f({\ell })$
 by extracting the perpendicular components of $\boldsymbol {S}$
 , defining

In this notation, a proxy for the upper bound on amplification by local shear (which would operate in tandem with the secular increase from global shear) is

where the final two definitions do not require magnetic coordinates to be defined. In the case of the helical surfaces (4.2), only the equation for a field line in cylindrical coordinates must be solved and derivatives taken. Here, $\boldsymbol {S}$ also yields the variation of normal curvature ($\boldsymbol {\kappa } \boldsymbol {\cdot } \boldsymbol {\nabla } \varPsi$
 ) along the field line because $\boldsymbol {\kappa }=\hat {b} \boldsymbol {\cdot } \boldsymbol {S}$
 , the sign of which can tell whether curvature will be favourable or unfavourable for the toroidal branch of the ITG mode. The $\boldsymbol {S}$
 also has the well-known property that $\boldsymbol {S}\boldsymbol {\cdot } {\hat {b}}=0$
 .
.


 Open access

