




1. Introduction
Tones in Southeast Asian and African languages are well documented, whereas tone languages in South Asia, which belong to the Tibeto-Burman language family, are less studied. There are more than 100 tone languages spoken in the Tibeto-Burman language-speaking areas of South Asia. Mizo (ISO 639-3 code: lus) (ISO 2007) is one of the tone languages spoken in northeastern India. Mizo still lacks a dedicated description of its tonal acoustics. Considering this, the present work focused on the acoustic-phonetic description of tones in Mizo, which is spoken primarily in the state of Mizoram and its neighboring states, such as Manipur, Tripura, Meghalaya, and Assam in Northeast India (Simons & Fennig Reference Simons and Fennig2017). Mizo is also spoken in the Chin state of Myanmar and the Chittagong Hill Tracts (CHT) in Bangladesh. According to the latest census, i.e., the Census of India 2011, there are 830,846 speakers of Mizo in India (Chandramouli Reference Chandramouli2018). In Bangladesh, unconfirmed reports say about 1,500 to 2,000 ethnic Mizos live there who do not regularly use the Mizo language. Similarly, in Myanmar, there are about 12,500 speakers of Mizo (Simons & Fennig Reference Simons and Fennig2017). Mizo belongs to the Central Kuki-Chin subgroup of the Tibeto-Burman language family (VanBik Reference VanBik2007).
While linguistic descriptions of Mizo surfaced in the latter half of the nineteenth century (Lewin Reference Lewin1874), tones in the language received attention from scholars only since the mid-century (Henderson Reference Henderson1948). Previous studies on the linguistics of Mizo provided information on the existence of tones in Mizo. However, the descriptions of tones in these works were found to be inconsistent. For example, while most studies on Mizo tones agreed that Mizo has four tones, there was no agreement on the type of tones. While one study considered the tone associated with the word /lei/ bridge to be low-rising (Henderson Reference Henderson1948), another study considered it a low tone (Fanai Reference Fanai1992). Although several earlier studies explored the tones in Mizo, tone analysis was restricted to impressionistic accounts, without any acoustic analysis (Henderson Reference Henderson1948, Weidert Reference Weidert1975, Fanai Reference Fanai1992, Chhangte Reference Chhangte1993, Lalthangliana 1997). Sarmah & Wiltshire (Reference Sarmah and Wiltshire2010b) provided one of the first acoustic analyses of Mizo tones; however, the acoustic data collected contained speech from a single Mizo speaker. Later, several works on Mizo provided information on the fundamental frequency (f0) contour associated with Mizo tones. However, none of these focused only on the acoustic description of the tones in Mizo (Govind, Sarmah & Prasanna Reference Govind, Sarmah and Mahadeva Prasanna2012; Sarmah, Dihingia & Lalhminghlui Reference Sarmah, Dihingia and Lalhminghlui2015; Dey et al. Reference Dey, Lalhminghlui, Priyankoo Sarmah, Samudravijaya, Prasanna, Sinha and Nirmala2017; Kalita et al. Reference Kalita, Lalhminghlui, Horo, Priyankoo Sarmah, Prasanna and Dandapat2017; Sarma et al. Reference Sarma, Dey, Lalhminghlui, Gogoi, Sarmah and Prasanna2018; Lalhminghlui & Sarmah Reference Lalhminghlui and Sarmah2018; Kothapalli et al. Reference Kothapalli, Sarma, Dey, Gogoi, Lalhminghlui, Priyankoo Sarmah, Prasanna, Nirmala and Sinha2018; Lalhminghlui, Terhiija & Sarmah Reference Lalhminghlui, Terhiija and Sarmah2019; Gogoi et al. Reference Gogoi, Dey, Lalhminghlui, Sarmah and Mahadeva Prasanna2020). The previous studies extracted tone-specific f0 information from a variety of tone-bearing-units (TBU) in various phonetically uncontrolled contexts (Lalhminghlui & Sarmah Reference Lalhminghlui and Sarmah2018, Lalhminghlui et al. Reference Lalhminghlui, Terhiija and Sarmah2019, Sarmah et al. Reference Sarmah, Dihingia and Lalhminghlui2015). In contrast to these previous studies, the current study uses data collected from 10 native speakers of Mizo, with tones appearing in minimal sets and three distinct spoken contexts, namely, in isolation, in sentence frames (referred to as sentence context in the rest of the article) and in an example sentence with semantically coherent context (referred to as semantic context in the rest of the article).
To explore the acoustic correlates of the tones in Mizo, conventional acoustic parameters, such as average f0, f0 slope, and tone duration are obtained from the recorded data. Apart from that, to obtain the pitch contour characteristics of the Mizo tones, f0 contour values are transformed using Discrete Cosine Transform (DCT) and three DCT coefficients are reported, namely, C0, C1, and C2. While C0 provides the mean f0 of the tone contour, C1 and C2 provide information on the dynamic nature of the f0 contour. To investigate the role of duration, the mean f0 and the dynamic property of the f0 contour in characterizing the Mizo tones, a quadratic discriminant analysis (QDA) is performed with the first three DCT coefficients, namely, C0, C1, C2 along with the duration. Apart from that, the role of the acoustic features was also explored by conducting Linear Mixed Effects (LME) modeling. Finally, this study converts the f0 values of the Mizo tones to Chaos tone numerals.
The organization of the paper is as follows: Section 2 reviews previous work on Mizo tones. Section 3 describes the methodology applied in the present study. Subsequently, the results of the present study are reported in Section 4. Finally, Section 5 discusses the observations and findings and concludes the paper.
2. Literature review
Previous studies on tones in Mizo did not agree on the number and types of tones in the language. Even in the case of acoustic studies on the tones of Mizo, there was no study that controlled the segmental contexts in the production of tones. One of the first descriptions of Mizo tones is provided by Henderson (Reference Henderson1948). Based on the speech of one speaker, Henderson concluded that Mizo has five tones, namely, high-level, high-falling, low-rising, low-falling, and low-level tones. According to Henderson, a low-level tone is a variant (an allotone) of the low-falling tone triggered by a glottal stop or any other stops in the coda position and carried by short vowels. This allotone may also appear in syllables where a diphthong is followed by a /lʔ/ or a /rʔ/. Henderson subsumed both allotones under the low-falling category. Weidert (Reference Weidert1975) claimed that Mizo has two types of tones based on the phonetic vowel duration and the syllable types, namely, Type I (full) and Type II (reduced). Type I consists of high, low, falling, and rising tones, in which vowels are realized with long temporal values in comparison to Type II tones. Phonetically, the Type I tones are high-level, high-falling, low-rising, and low-level. On the other hand, Type II has the reduced tones of all the tones in Type I, which are realized as high-level and low-level tones, with short vowels bearing the tones. It is mentioned that in Type II tones, there is no time for rising or falling (Weidert Reference Weidert1975, 6). Type I tones are found in syllable structures such as /CV/, /CVN/ ∼ /CVCt/ and /CVːN/ ∼ /CVːCt/ (where, C = consonant, V = vowel, N = nasal and Ct = continuant, including semivowels) while Type II tones are found only in /CV/ syllables.
It is to be noted that even though Weidert used the long vowel symbols, e.g. Vː, he mentioned that longer vowel duration may be phonetic and not phonemic. He further substantiated it by saying the type of tone determined the vowel duration realized on the TBU. On the other hand, Chhangte (Reference Chhangte1993) claimed that there is a phonological vowel length difference in Mizo. The existence of four contrastive tones in Mizo, namely, high, low, falling, and rising tones, was also reported in Fanai (Reference Fanai1992). Fanai (Reference Fanai1992) grouped them into three distinct types as per the pattern of the pitch contours: a level (high tone), a contour (low tone), and two complex tone clusters (rising and falling tones). The same study showed that the high tone is the only static tone, phonetically, while the other three are dynamic. Fanai (Reference Fanai1992) also reported the presence of an extra low tone in the presence of a glottal stop in the coda. This extra low tone is considered an allotone of the low tone in Mizo. A similar description of Mizo tones is provided by Chhangte (Reference Chhangte1993), who categorized Mizo tones into the plain series and the glottal series. As the name suggested, the plain series consists of tones without abrupt rise or fall, while the glottal series consists of syllables with a glottal coda, resulting in the abrupt termination of the pitch. The plain series includes high, low, rising, and falling, and the glottal series consists of low glottal, high glottal, and a falling glottal tone. Lalthangliana (1997) also reported five Mizo tones, namely, high-rising (Tone 1), falling-rising (Tone 2), high-falling (Tone 3), low-rising (Tone 4) and low-falling (Tone 5). He further claimed that these five tones have no absolute phonetic exponency since each tone is prone to contextual variations, and thus the five tones have allotones. Table 1 summarizes the descriptions of Mizo tones reported in various studies. The table depicts the inconsistencies observed regarding the number and types of Mizo tones in the literature.
Mizo tonal inventories reported in the previous studies
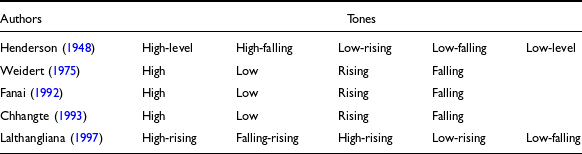
Table 1 Long description
A table comparing Mizo tonal inventories reported in previous studies, showing authors and their descriptions of tones. The table has five rows and two columns. The first column lists the authors and their publication years: Henderson (1948), Weidert (1975), Fanai (1992), Chhangte (1993), and Lalthangliana (1997). The second column lists the tones described by each author. Henderson (1948) describes high-level, high-falling, low-rising, low-falling, and low-level tones. Weidert (1975) describes high, low, rising, and falling tones. Fanai (1992) describes high, low, rising, and falling tones. Chhangte (1993) describes high, low, rising, and falling tones. Lalthangliana (1997) describes high-rising, falling-rising, high-rising, low-rising, and low-falling tones. The table highlights the inconsistencies in the number and types of Mizo tones reported in various studies.
Apart from the inconsistencies in description, there are some limitations in selecting lexical items in the previous studies. For example, Weidert (Reference Weidert1975) and Chhangte (Reference Chhangte1993) used minimal sets, but the word representing the high tone /pa/ basket is not a frequently used word. Henderson (Reference Henderson1948) also provided a tonal minimal set for the /vai/ syllable, where the lexical word for high tone is a nativized loan word from Hindi, /bhai/ brother.
In terms of acoustic analysis of Mizo tones, the preliminary acoustic study by Sarmah & Wiltshire (Reference Sarmah and Wiltshire2010b) supported that Mizo has four lexical tones, namely, high, low, falling, and rising. It is stated in this work that the f0 contour of the high tone is fairly level, and it also suggested that it is more appropriate to label the low tone as a low falling tone since the low tone in Mizo has a gradual falling contour. In terms of duration of rime, the same study reported that the rime duration is not reliable for distinguishing the four tones in Mizo. Though the rime of the falling tone has the shortest duration and is statistically significantly different from the other three tones, none of the rime of the other tones is significantly distinct from each other in terms of duration. The presence of consonant effects on the tones is reported by Sarmah & Wiltshire (Reference Sarmah and Wiltshire2010b), who found that at least the initial 20% of the rime duration is affected. It is also mentioned in this work that the four tones in Mizo are significantly different from each other in terms of the f0 slopes. Govind, Sarmah & Prasanna (Reference Govind, Sarmah and Mahadeva Prasanna2012) also confirmed that the slope of the f0 contour is an important parameter in enhancing the perception of Mizo tones. It is also reported that the canonical f0 characteristics of Mizo tones differ when they are in the context of each other (Sarmah, Dihingia & Lalhminghlui Reference Sarmah, Dihingia and Lalhminghlui2015). It is shown in Sarmah et al. (Reference Sarmah, Dihingia and Lalhminghlui2015) that Mizo tones have bidirectional variations. They observed carryover and anticipatory effects throughout the total duration of the preceding and the following tones. It is noticed that the contour tones (rising and falling) are more prone to have anticipatory effects than the low and high tones. Carryover effects in Mizo tones demonstrate an assimilatory effect. On the other hand, anticipatory effects depicted dissimilatory effects. This work also reported the presence of tone sandhi in Mizo, in which a rising tone becomes a low tone when it is followed by either a high or falling tone. Lalhminghlui & Sarmah (Reference Lalhminghlui and Sarmah2018) investigated the production and perception of the rising tone sandhi in Mizo where it was found that the canonical low tone and the derived low tone from rising tone sandhi are phonetically different in terms of production and perception. Tones are realized in different contexts with different tones or with the same tone and can also have relations with the vowels. Lalhminghlui, Terhiija & Sarmah (Reference Lalhminghlui, Terhiija and Sarmah2019) reported the presence of intrinsic pitch (If0) where high vowels in Mizo (/i, u/) induce high f0 at the initiation of the f0 contours and the low vowel (/a/) lowers the f0. Prominent vowel-specific differences are observed more in high tones than in lower pitch.
There are some attempts to automatically classify the Mizo tones. For example, recently, Gogoi et al. (Reference Gogoi, Dey, Lalhminghlui, Sarmah and Mahadeva Prasanna2020) used a deep neural network-based classifier to recognize Mizo tones with an accuracy of 74.11% with f0 features capturing average f0 and f0 slope. The confusion matrix reported in this work showed that 30% of the errors were due to the misclassification of the falling tones as low tones and vice-a-versa. As mentioned earlier, the previous studies on Mizo tones did not attempt to conduct any controlled production experiment to characterize the acoustic properties of Mizo tones. The only acoustic study dedicated to characterizing Mizo tones, i.e., Sarmah & Wiltshire (Reference Sarmah and Wiltshire2010b), has limited data, that too recorded from a single female speaker. Additionally, the impressionistic accounts of Mizo tones did not provide minimal sets of contrasting lexical tones in commonly used words in Mizo. These gaps have resulted in disagreement regarding the number and types of lexical tones in Mizo as mentioned in this section. Hence, in the present study, we aim to fill these gaps in knowledge by recording complete minimal sets and near-minimal sets from multiple speakers. With a more thorough data collection methodology, we provide an exhaustive better acoustic description of the tones in Mizo.
3. Methodology
The current study is a production study aimed at determining the primary acoustic features associated with the tones in Mizo. The data collection procedure, analysis, and statistical modeling methods are described in the following subsections.
3.1 Participants
There were 10 Mizo native speakers (five male, five female) who participated in this study, and they all were born and brought up in Mizoram. At the time of recording their speech in 2019, they were studying in Guwahati city of Assam and were affiliated to various academic institutions. Their age range is 22–29 with an average of 25 years. Besides Mizo, all participants could speak and understand English.
3.2 Data lists
The data list consisted of two Mizo tonal minimal sets and two other tonal near minimal sets obtained from the syllables /thaŋ, vai/ and /bel, lem/ respectively, resulting in 16 unique words as presented in Table 2. As shown in the table, the segmental contexts (onset and coda) are the same for the 16 lexical words used in the study, however, there are vowel length differences as claimed by Chhangte (Reference Chhangte1993). As mentioned in Section 2, some of the words in the minimal sets reported in the literature are not frequently used; therefore, the participants were unfamiliar with them. Hence, words with phonological vowel length differences that were familiar to the participants were included. The vowel length difference is considered a fixed effect in all statistical analyses in this work. As mentioned in Section 1, the 16 lexical words are recorded in three different contexts: in isolation, which is the citation form; in sentence context; and in semantic context. In the sentence context, each of the 16 lexical words is embedded in a sentence frame, /lálîn ____ tìʔ hì moí á tì/, meaning Lali thinks the word ____ is beautiful. Therefore, the preceding and following tones are always the same, falling and low tones, respectively. In the semantic context, all 16 lexical words are embedded in different meaningful natural sentences, as provided in Table A1 of Appendix A. In the sentence context, the target word appears in a fixed sentence frame with fixed tones, whereas in the semantic context, it appears in a natural sentence where words vary, resulting in tone variation.
Tonal minimal and near minimal sets in Mizo
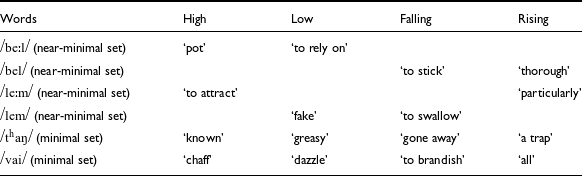
Table 2 Long description
The table presents a comparison of tonal minimal and near minimal sets in the Mizo language. It consists of four columns labeled High, Low, Falling, and Rising, and six rows labeled with different phonetic sets. Each cell contains a word representing a specific tonal pattern. The first two rows show near-minimal sets for the syllables /bel/ and /lem/, while the last two rows show minimal sets for the syllables /tha/ and /vai/. Notable words include 'pot', 'to rely on', 'thorough', 'to stick', 'to attract', 'particularly', 'fake', 'to swallow', 'known', 'greasy', 'gone away', 'a trap', 'chaff', 'dazzle', 'to brandish', and 'all'. The table highlights the differences in vowel length and tonal patterns within these sets.
3.3 Recording procedure
The data lists were recorded in a quiet room in Guwahati using a Shure SM-10 head-mounted microphone connected to a Tascam DR-100 MKII solid-state recorder. The participants were given the data lists printed on a paper sheet and asked to read aloud as naturally as possible. As mentioned in the previous section, firstly, a speaker reads the target word in the semantic context, then in isolation, and finally in the sentence context. While the order of the contexts remained the same, the order of the words was randomized. Each speaker produced the 16 lexical words in three contexts with three repetitions, resulting in 144 tokens. In total, 1,440 tokens were recorded from 10 speakers in this study. However, only 1,384 tokens were analyzed, as 56 tokens were mispronounced.
3.4 Acoustic and statistical analysis
The speech data was transferred to a PC for analysis using Praat 6.0.21 (Boersma Reference Boersma2001) and subsequent statistical analysis was done in R (Fox & Weisberg Reference Fox and Weisberg2019). Since the TBU in Mizo consists of the vowel and the following sonorant in a syllable (Fanai Reference Fanai1992), the first author, a native speaker of Mizo, marked and annotated the beginning of the vowel and the end of the vowel or sonorant consonant by carefully examining the sound files visually and by hearing. Using a Praat script, pitch values were extracted at every 2% of the total duration of the TBU. The rest of the analyses were done using R. To show gender and person-specific differences in the f0 contours, the raw f0 values are plotted. To normalize the speaker effects, z-score normalization (Rose Reference Rose1991) was carried out for the raw f0 values. The normalized f0 values are plotted for visual analysis.
To see the pitch contour characteristics and to generate smoothened pitch contours for the Mizo tones, the raw pitch values were subjected to DCT. The DCT can represent the temporal behavior of sequences in a compact form in terms of DCT coefficients. The first few DCT coefficients often have significant magnitudes, so the original, long sequence of data points (f0 values in this work) can be represented in terms of a few DCT coefficients. The discrete cosine transform was proposed to represent the fundamental frequency (f0) contours of speech (Teutenberg, Watson & Riddle, Reference Teutenberg, Watson and Riddle2008). Later works demonstrated that a finite number of DCT coefficients can be used to synthesize speech of better quality, as it was able to capture the f0 patterns of intonational phrases more efficiently (Yin et al. Reference Yin, Lei, Qian, Soong, He, Ling and Dai2016).
DCT can help characterize the f0 contours of a tone language, specifically when the language has a combination of contour and register tones, as in the case of Mizo. Given a sequence of f0 values (of length 51 in the present study) of a TBU, the DCT yields a sequence of DCT coefficients of the same length. The initial coefficient C0 provides the mean f0 of the tone contour. C1 compares the given pitch contour to a falling half cycle of a cosine curve and provides similarity measurements in positive or negative values. Hence, a tone with a falling contour would have a high positive C1 value, whereas a rising tone will have a negative C1 value. C2 compares the given f0 contour with one full cycle of the cosine curve and thus provides information about the presence of a peak or a valley in the f0 contour. Hence, the value of C2 will be positive for a falling-rising f0 contour and will be negative for a rising-falling f0 contour. Since the f0 contour of a Mizo TBU may contain utmost a minor peak or valley, the first three DCT coefficients were used, in this work, to model the f0 contour of a TBU.
DCT has been successfully used in other languages for prosody modeling, f0 synthesis and tone recognition. Teutenberg et al. (Reference Teutenberg, Watson and Riddle2008) showed the efficacy of DCT in modeling and synthesizing prosody. Schellenberg & McDonough (Reference Schellenberg and McDonough2014) used DCT to characterize tone trajectories of two Athabaskan languages, namely, Dene S łine (Chipewayan) and Tl
 ch
ch Yatiì (Dogrib). In the case of Mandarin Chinese, Wu et al. (Reference Wu, Qian, Soong and Zhang2008) have demonstrated the ability to model and synthesize tonal and intonational f0. Wu, Zahorian & Hu (Reference Wu, Zahorian and Hu2013) used the DCT coefficients as features for automatic tone recognition in Mandarin Chinese. In the current study, we extracted the first three coefficients for the Mizo tones. Later, f0 contours reconstructed from the DCT values were provided for smoothened f0 contour visualization.
For statistical exploration in this work, Linear Mixed Effects (LME) models were built for tones in Mizo using the lme4 package (Bates et al. Reference Bates, Mächler, Bolker and Walker2015) on R (R Core Team 2023). To see how average f0, f0 slope and duration differ in tonal categories, we built four LME models with C0, C1, C2 and duration as dependent variables. In the LME models, TONE (high, low, rising, falling), CONTEXT (sentence, isolation, semantic), VOWEL LENGTH (short, long) and GENDER (male, female) were considered fixed effects and ITERATION, SPEAKER and WORD were considered random effects. In the LME models, GENDER was considered a fixed effect as it has a predictable effect on f0. CONTEXT was also considered a fixed effect, assuming a correlation between the f0 of tones and the context in which they are produced. The final LME models looked as shown in (1).Footnote 1
-
(1) TONE * CONTEXT * GENDER* VOWEL LENGTH + (1|SPEAKER) + (1|ITERATION) + (1|WORD)
The LME models were subjected to a Type II Wald χ 2 test for analysis of deviance using the car package (Fox & Weisberg Reference Fox and Weisberg2019) on R. The results of the test provide χ 2 values corresponding to each of the fixed effects, where a higher χ 2 value would imply more separability among the classes. The results also provide a probability value that ascertains whether a fixed effect is significant or not. Each model was also subjected to a pairwise comparison test by using the emmeans package (Lenth Reference Lenth2019) with Bonferroni adjustment to explore the significance of difference among the levels in the fixed factor.
As the first three coefficients of DCT of the pitch contour for Mizo tones are representative of average f0 and f0 slope, to ascertain their importance in Mizo tone characterization, we attempted a QDA using the DCT coefficients and tone duration. QDA is a statistical classifier that can classify different classes based on two or more variables. The acoustic features that yield higher accuracy in tone classification can be considered representative of the Mizo tones. Hence, in this work, we attempt to classify Mizo tones using C0, C1, C2 and DURATION features in increments.
4. Results
To characterize the Mizo tones, we obtained the time normalized f0 contours for each tone. Initially, the raw f0 values were speaker normalized using the z-score normalization method, and the f0 contours were plotted for each tone for visual examination. Further, the tone characteristics are presented after converting the f0 values to Chao letters.
4.1 f0 contours of tones in Mizo
This section presents the tone contours associated with the Mizo tones in raw and normalized values. We present tone contours in raw values that preserve speaker and gender-specific values to see the speakers specific differences. On the other hand, to see tone contours without speaker-induced effects arising due to physiological differences, we present the speaker-normalized f0 values for tone contours.
The average f0 contours of Mizo tones in Figure 1 are obtained from the four distinct lexical tones in Mizo, namely, high, low, rising, and falling tones. Tones were obtained in three contexts, namely, isolation, semantic context, and sentence context. As observed in the previous studies, the high tone appears to be fairly level compared to the other tones. However, the high tone also rises slightly with time, with a drop in f0 just before its termination. This f0 drop is observed in tones having high f0 termination, that is, high and rising tones. The rising tone begins with the lowest f0 among the four Mizo tones. The f0 of the rising tone shows a slight dip in the initial 25% of the total duration, and then it rises and surpasses the f0 of the high tone towards the end. Like the observations in Sarmah & Wiltshire (Reference Sarmah and Wiltshire2010b), the low tone has a falling contour from the beginning to the end of the tone. Although the low tone and the falling tone have similar f0 contours, the low tone has a lower f0 than the falling tone.
Average raw f0 contours of the four Mizo tones in all contexts, plotted by gender.
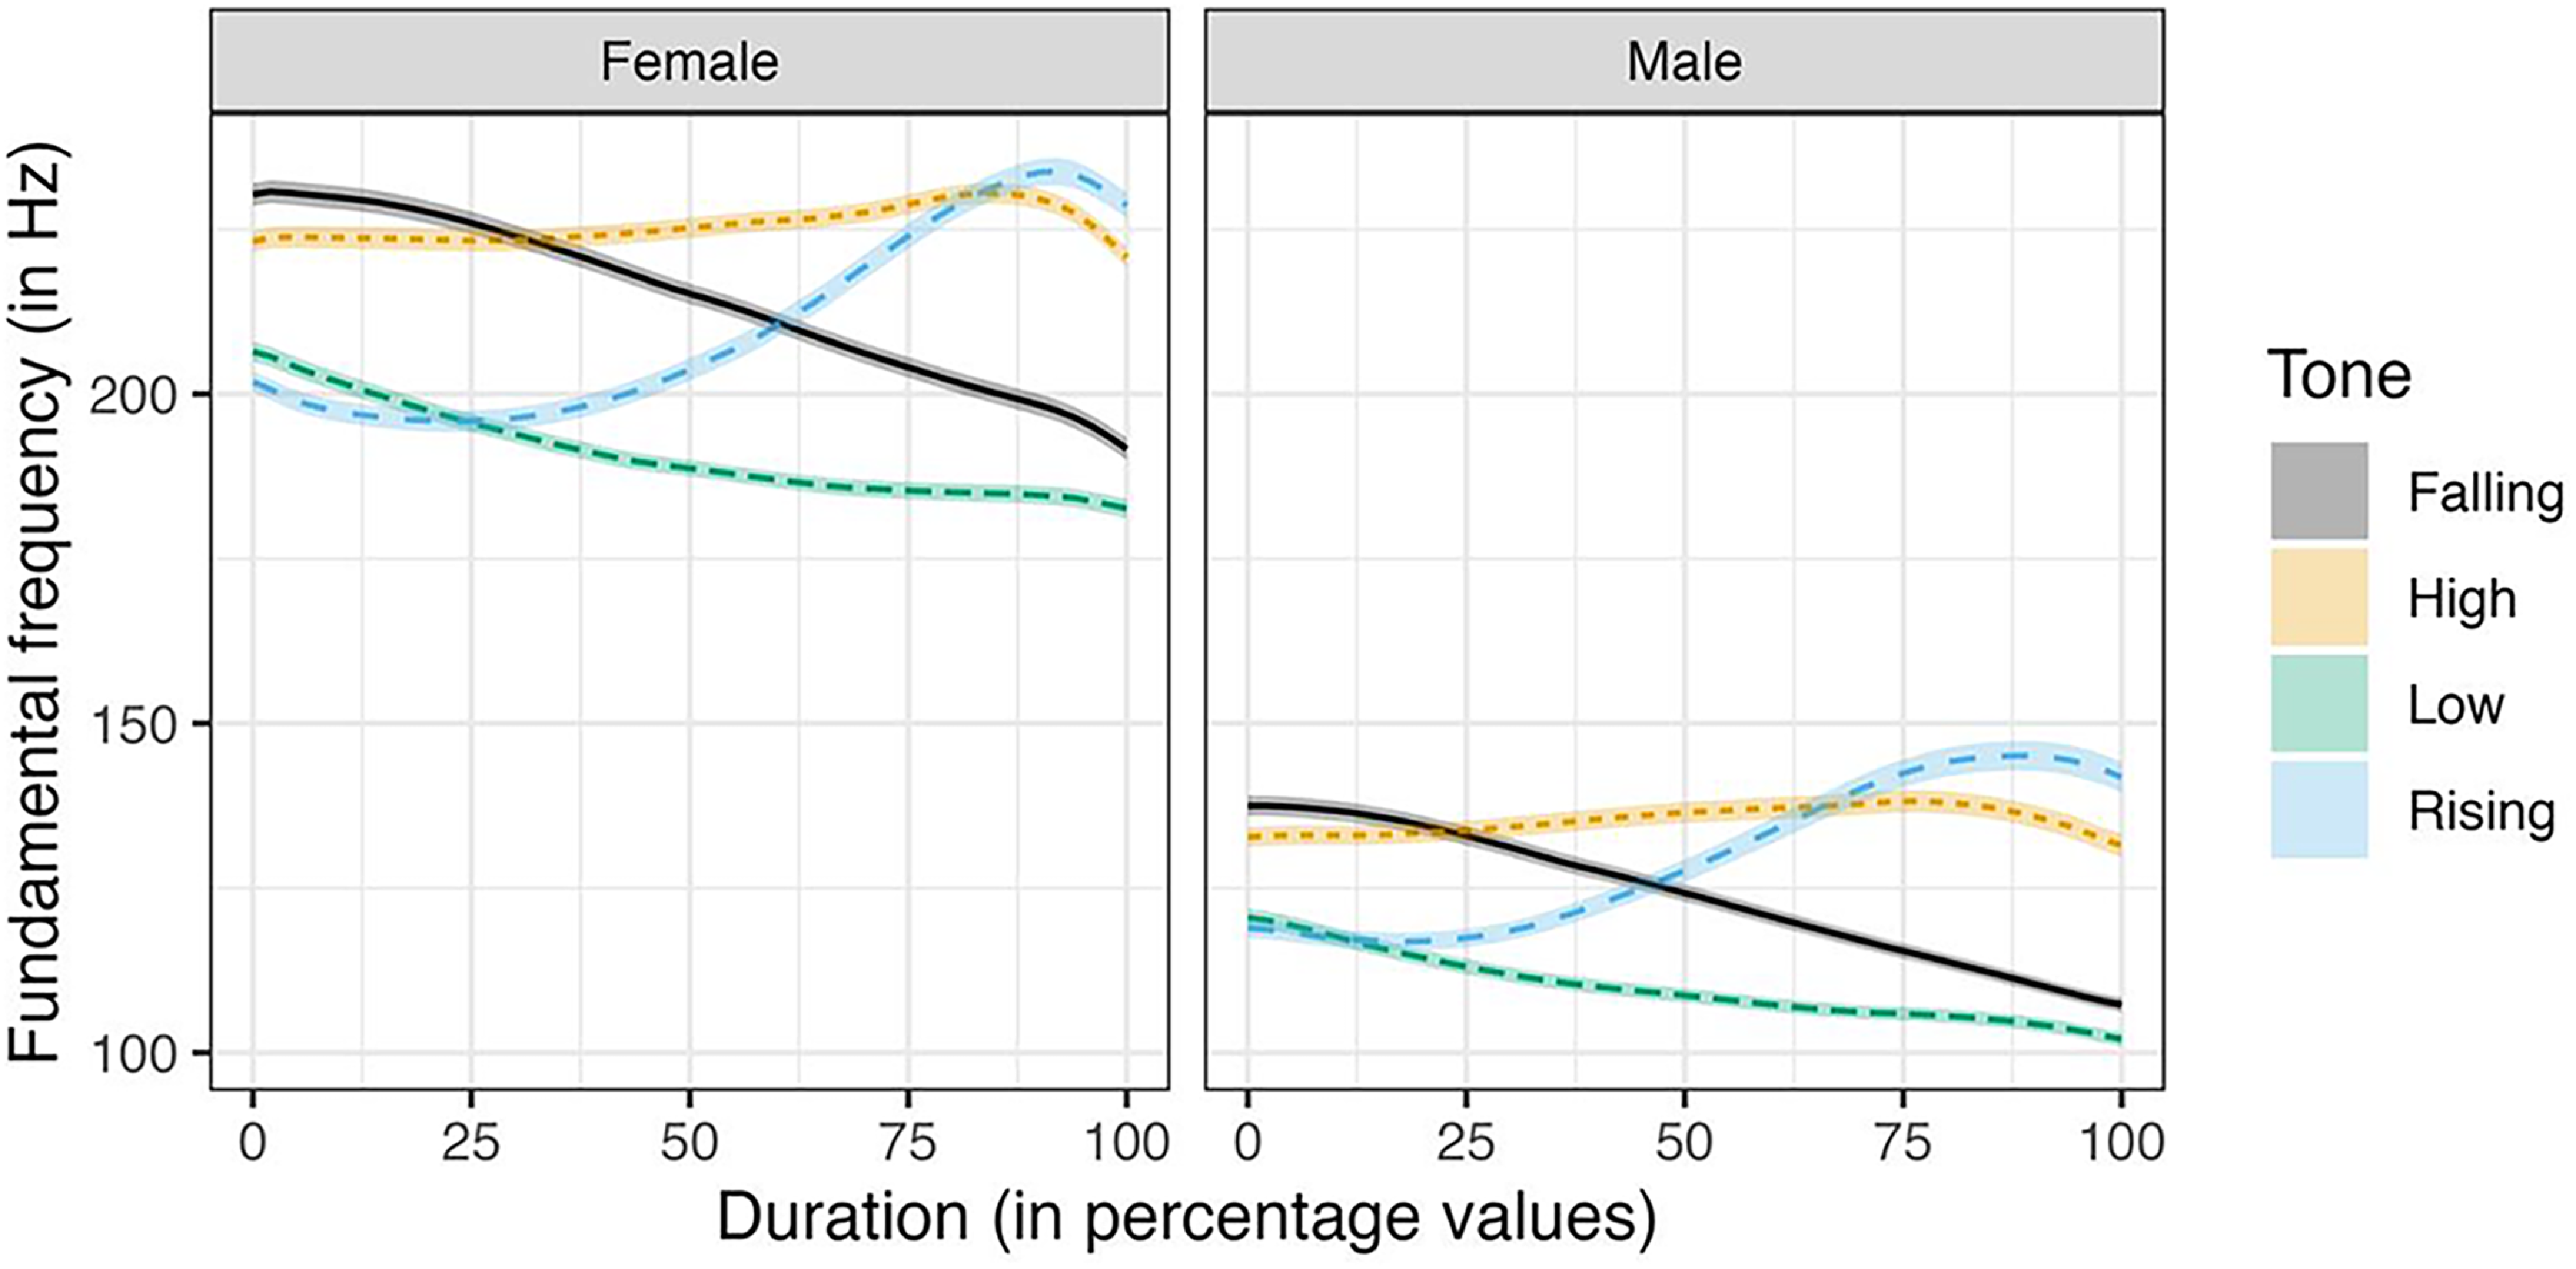
Figure 1 Long description
The line graph presents the average raw f0 contours of four Mizo tones, categorized by gender. The x-axis measures duration in percentage values, ranging from 0 to 100. The y-axis measures fundamental frequency in Hertz, ranging from 100 to 250. The graph is divided into two sections: one for female speakers and one for male speakers. Each section contains four lines representing different tones: falling, high, low, and rising. For female speakers, the falling tone starts around 220 Hertz and gradually decreases to about 180 Hertz. The high tone begins near 220 Hertz, slightly increases, and then stabilizes around 210 Hertz. The low tone starts at approximately 180 Hertz and remains relatively constant. The rising tone begins at around 180 Hertz, increases to about 220 Hertz, and then slightly decreases. For male speakers, the falling tone starts around 140 Hertz and decreases to about 120 Hertz. The high tone begins near 140 Hertz, slightly increases, and then stabilizes around 130 Hertz. The low tone starts at approximately 120 Hertz and remains relatively constant. The rising tone begins at around 120 Hertz, increases to about 140 Hertz, and then slightly decreases. All values are approximated.
To illustrate the tone-specific f0 contours, without speaker and gender effects, the normalized f0 contours of the four words in isolation are plotted in Figure 2. While the normalized f0 ranges are not similar, the trend of the f0 contours for each tone is similar across the words. The difference in f0 ranges occurs due to the onset consonants, as the /thaŋ/ set has a higher f0 range. Similar effects of onset consonants on the following f0 ranges were previously observed in Mizo and Dimasa (Sarmah & Wiltshire Reference Sarmah and Wiltshire2010a,b). Figure 3 shows the average normalized f0 contours of the four words produced in the sentence context. Visually, minor differences are observed between the tone contours produced in sentence contexts and isolation. The termination f0 of each tone in the sentence context is noticeably lower than in the isolation context. We assume that this is in anticipation of the following low tone associated with the word /tiʔ/ to think of the sentence frame. In summary, we do not see any significant difference between the f0 contours of the Mizo tones produced in isolation and sentence frames.
Average normalized f0 contours of Mizo tones in four words in isolation.
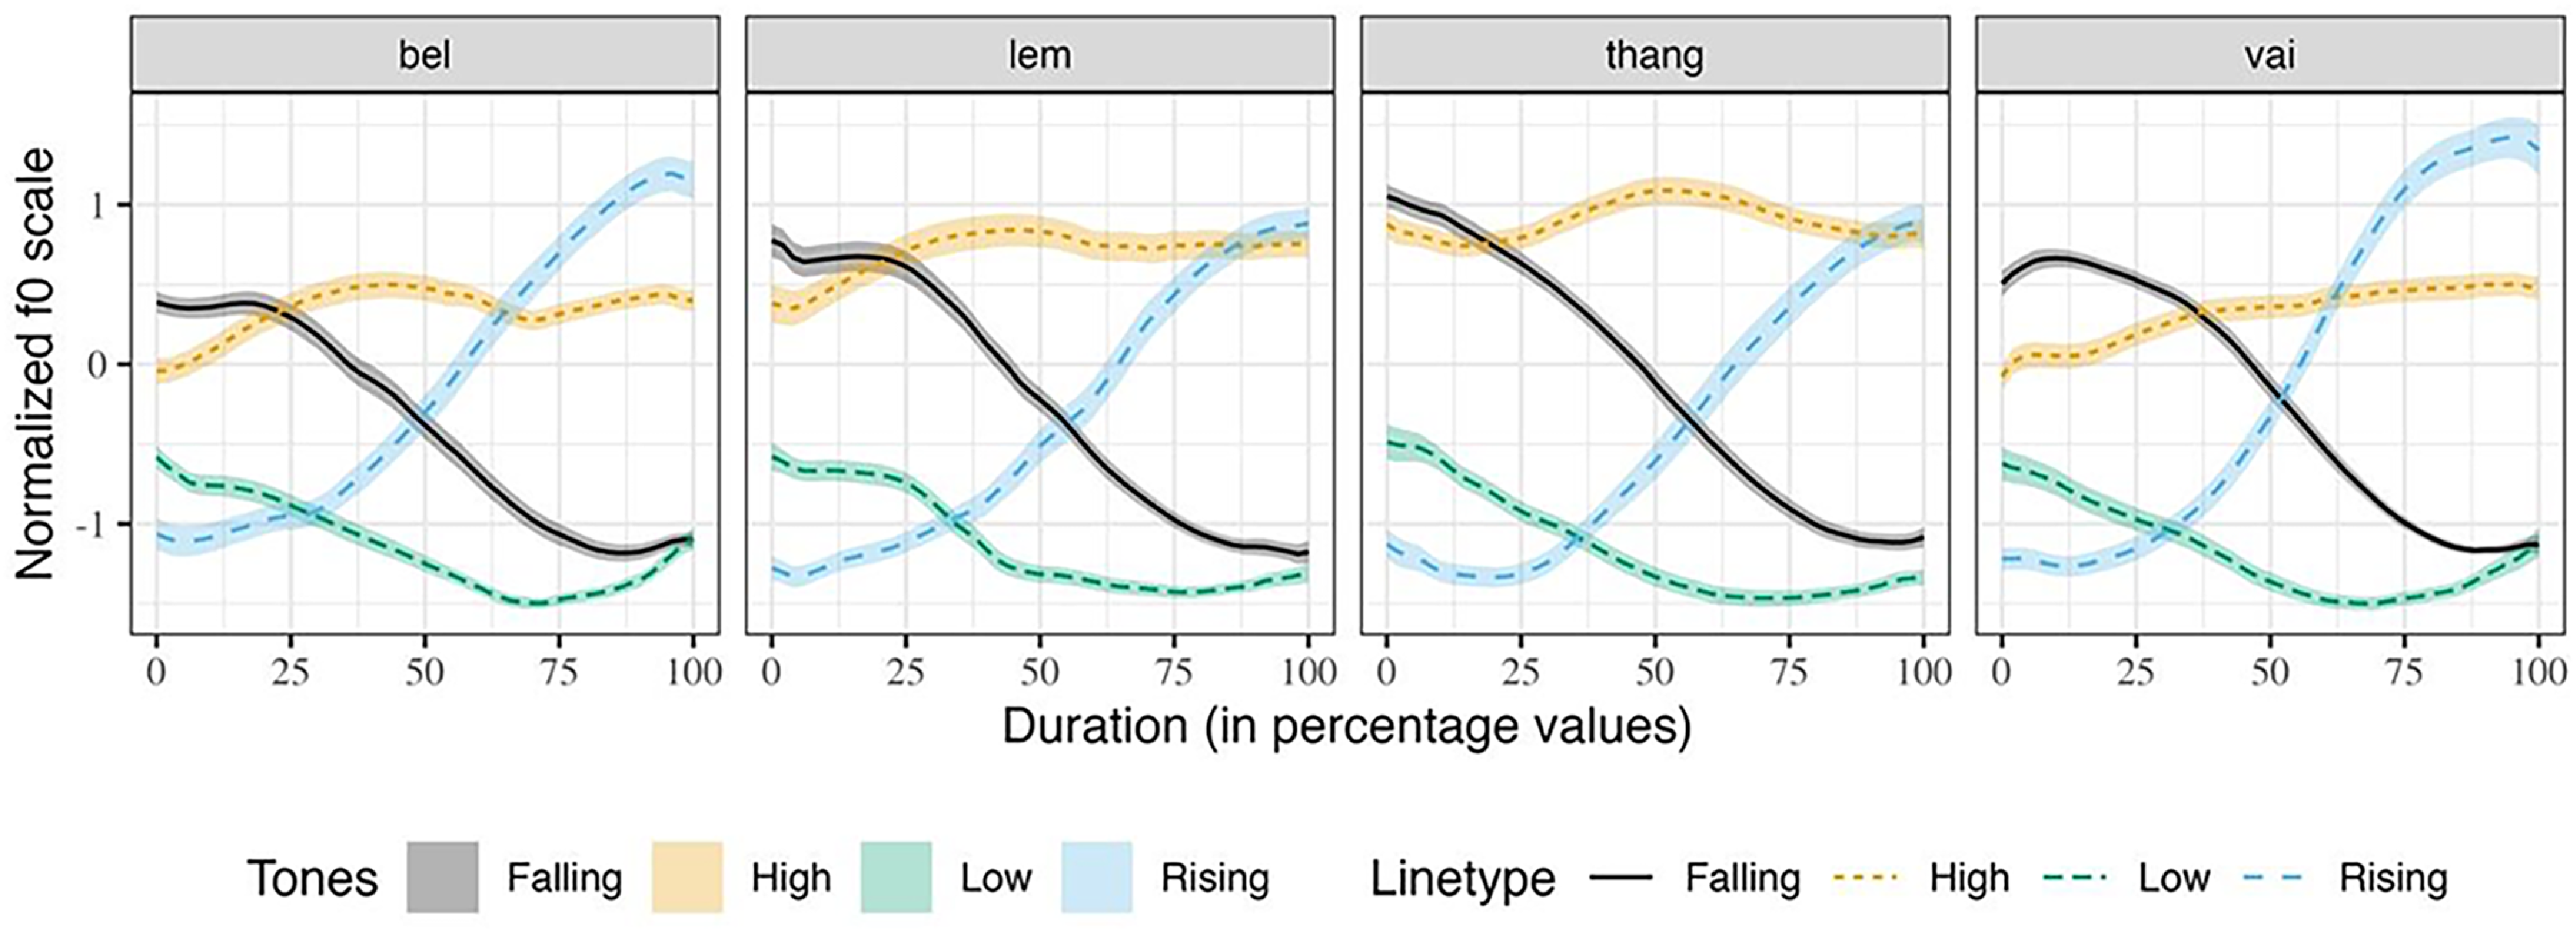
Figure 2 Long description
The image consists of four line graphs, each representing the average normalized f0 contours of Mizo tones in four different words in isolation. The graphs are labeled 'bel', 'lem', 'thang', and 'vai'. Each graph displays four different tones: falling, high, low, and rising, represented by different colors and line types. The x-axis of each graph indicates the duration in percentage values, ranging from 0 to 100. The y-axis represents the normalized f0 scale, ranging from -1 to 1. The black solid line represents the falling tone, the yellow dashed line represents the high tone, the green dashed line represents the low tone, and the blue dashed line represents the rising tone. The graphs show how the f0 contours vary over time for each tone in the specified words.
Average normalized f0 contours of Mizo tones in four words in sentences.
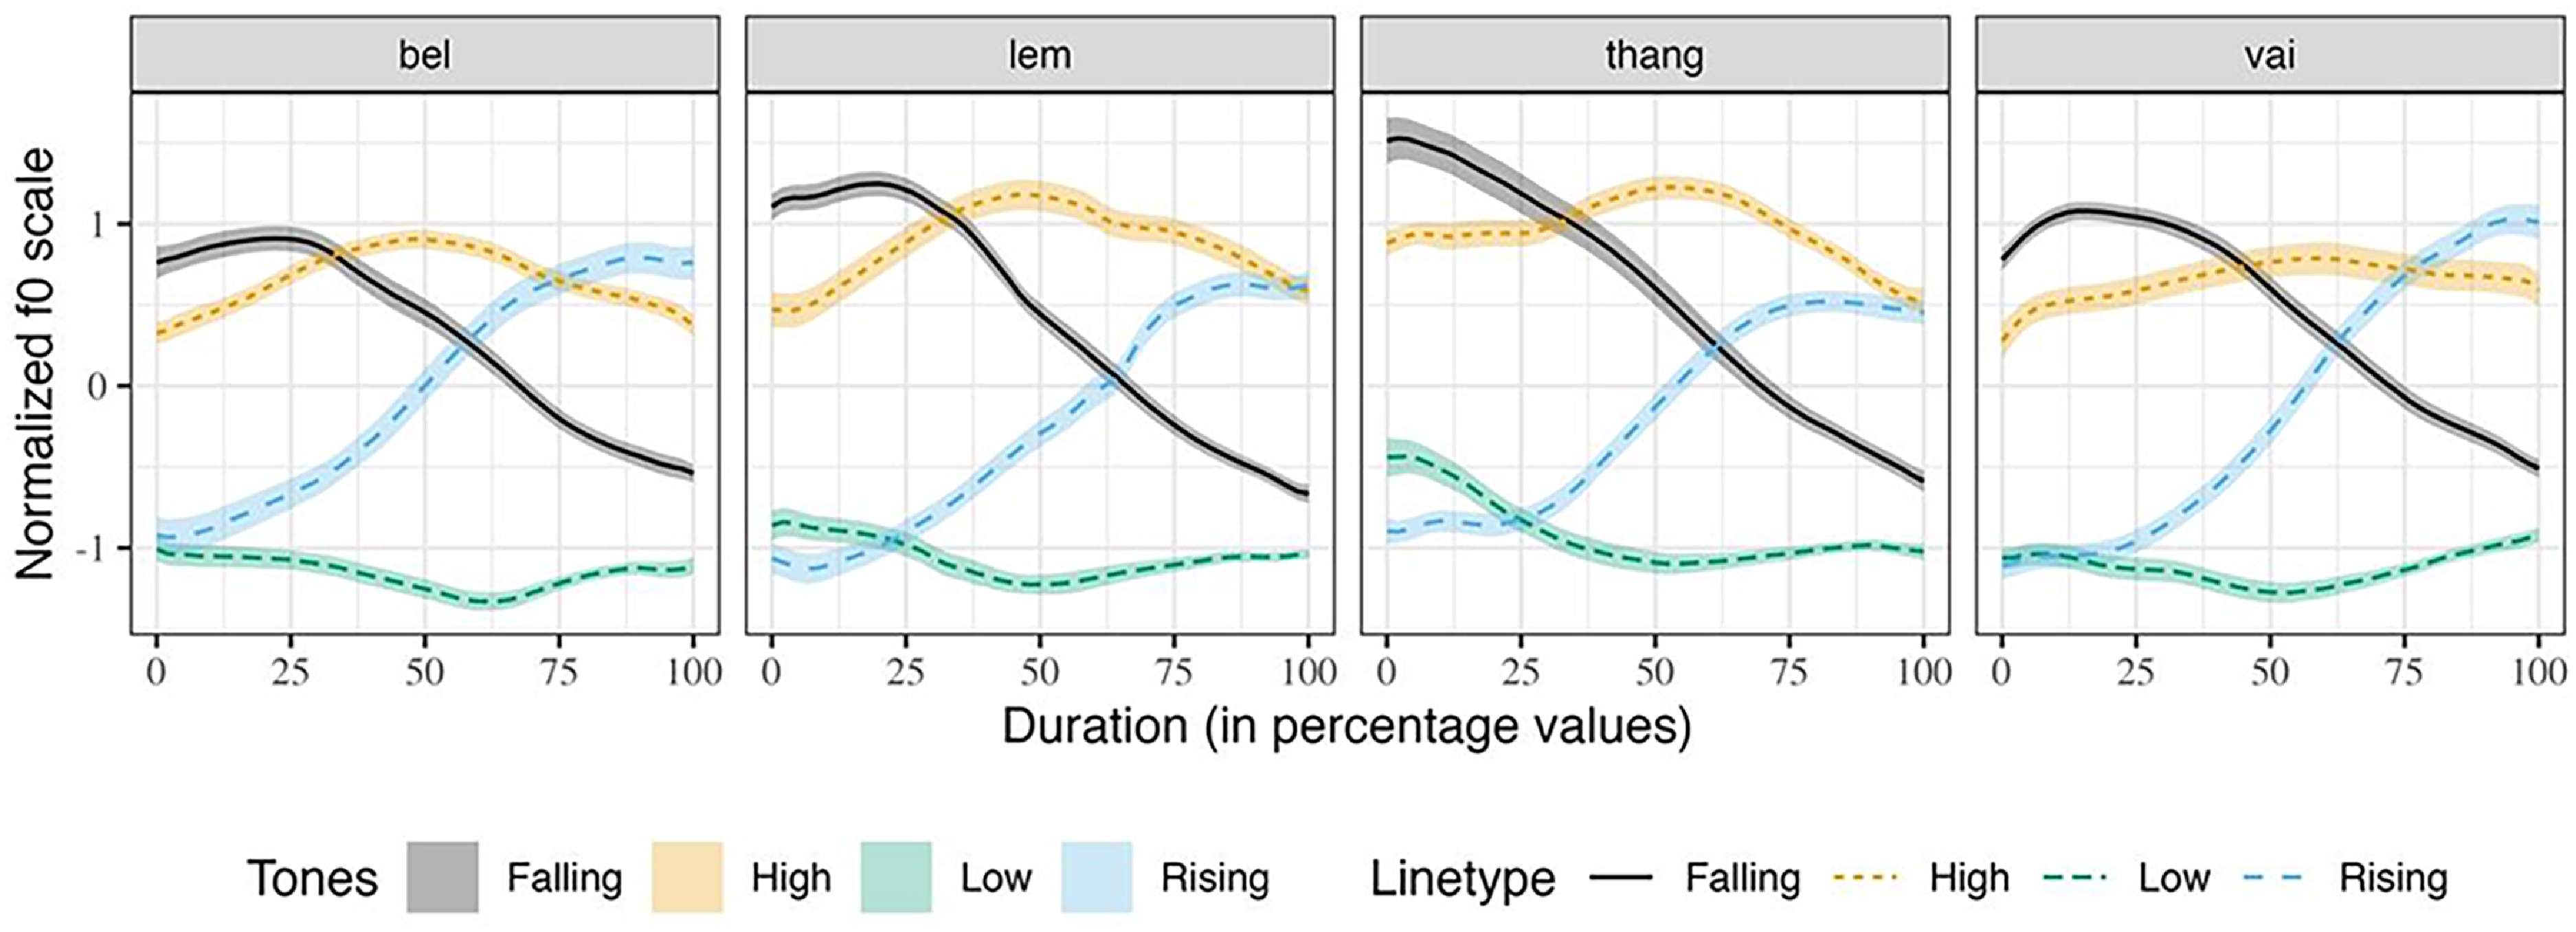
Figure 3 Long description
The image contains four line graphs, each representing the average normalized f0 contours of Mizo tones in different words over a duration expressed in percentage values. The graphs are labeled 'bel', 'lem', 'thang', and 'vai'. Each graph displays four different tone types: Falling, High, Low, and Rising, distinguished by different colors and line types. The x-axis represents the duration in percentage values, ranging from 0 to 100, while the y-axis represents the normalized f0 scale. The lines within each graph show the variation of the tones over time, with solid, dashed, and dotted lines indicating different tone types.
The differences between the four words are noticeable in the semantic context. The f0 contours of the words embedded in the semantic context are shown in Figure 4. It is observed that the rising tones produced in the /thaŋ/ and /vai/ syllables are different. In the case of /thaŋ/, the rising tone contour has become like the high-level tone contour. This is a coarticulatory change triggered by the rising tone of the preceding syllable. The high termination of the f0 of the preceding rising tone makes the initial f0 of /thaŋ/ rise. Apart from that, the aspiration at the onset of the word may also contribute to making the initial f0 of /thaŋ/ higher. In the case of /vai/ with the rising tone, we notice that while the shape of the rising tone is retained, the overall pitch range of the tone is higher. There are two possible reasons for it. Firstly, /vai/ with the rising tone means all and there is a possibility that the speakers, while producing it, must have stressed the word, making its overall f0 register rise. Secondly, as in the case of the /thaŋ/ with a rising tone, /vai/ with the rising tone is also preceded by another rising tone word /kan/ which means we, which may have raised its f0 since the termination of /kan/ is high f0. While we have provided tentative reasons for the change in the rising tone contours for /thaŋ/ and /vai/ in the semantic context, further investigation is required to account for the changes definitively.
Average normalized f0 contours of Mizo tones in four words in semantic context.
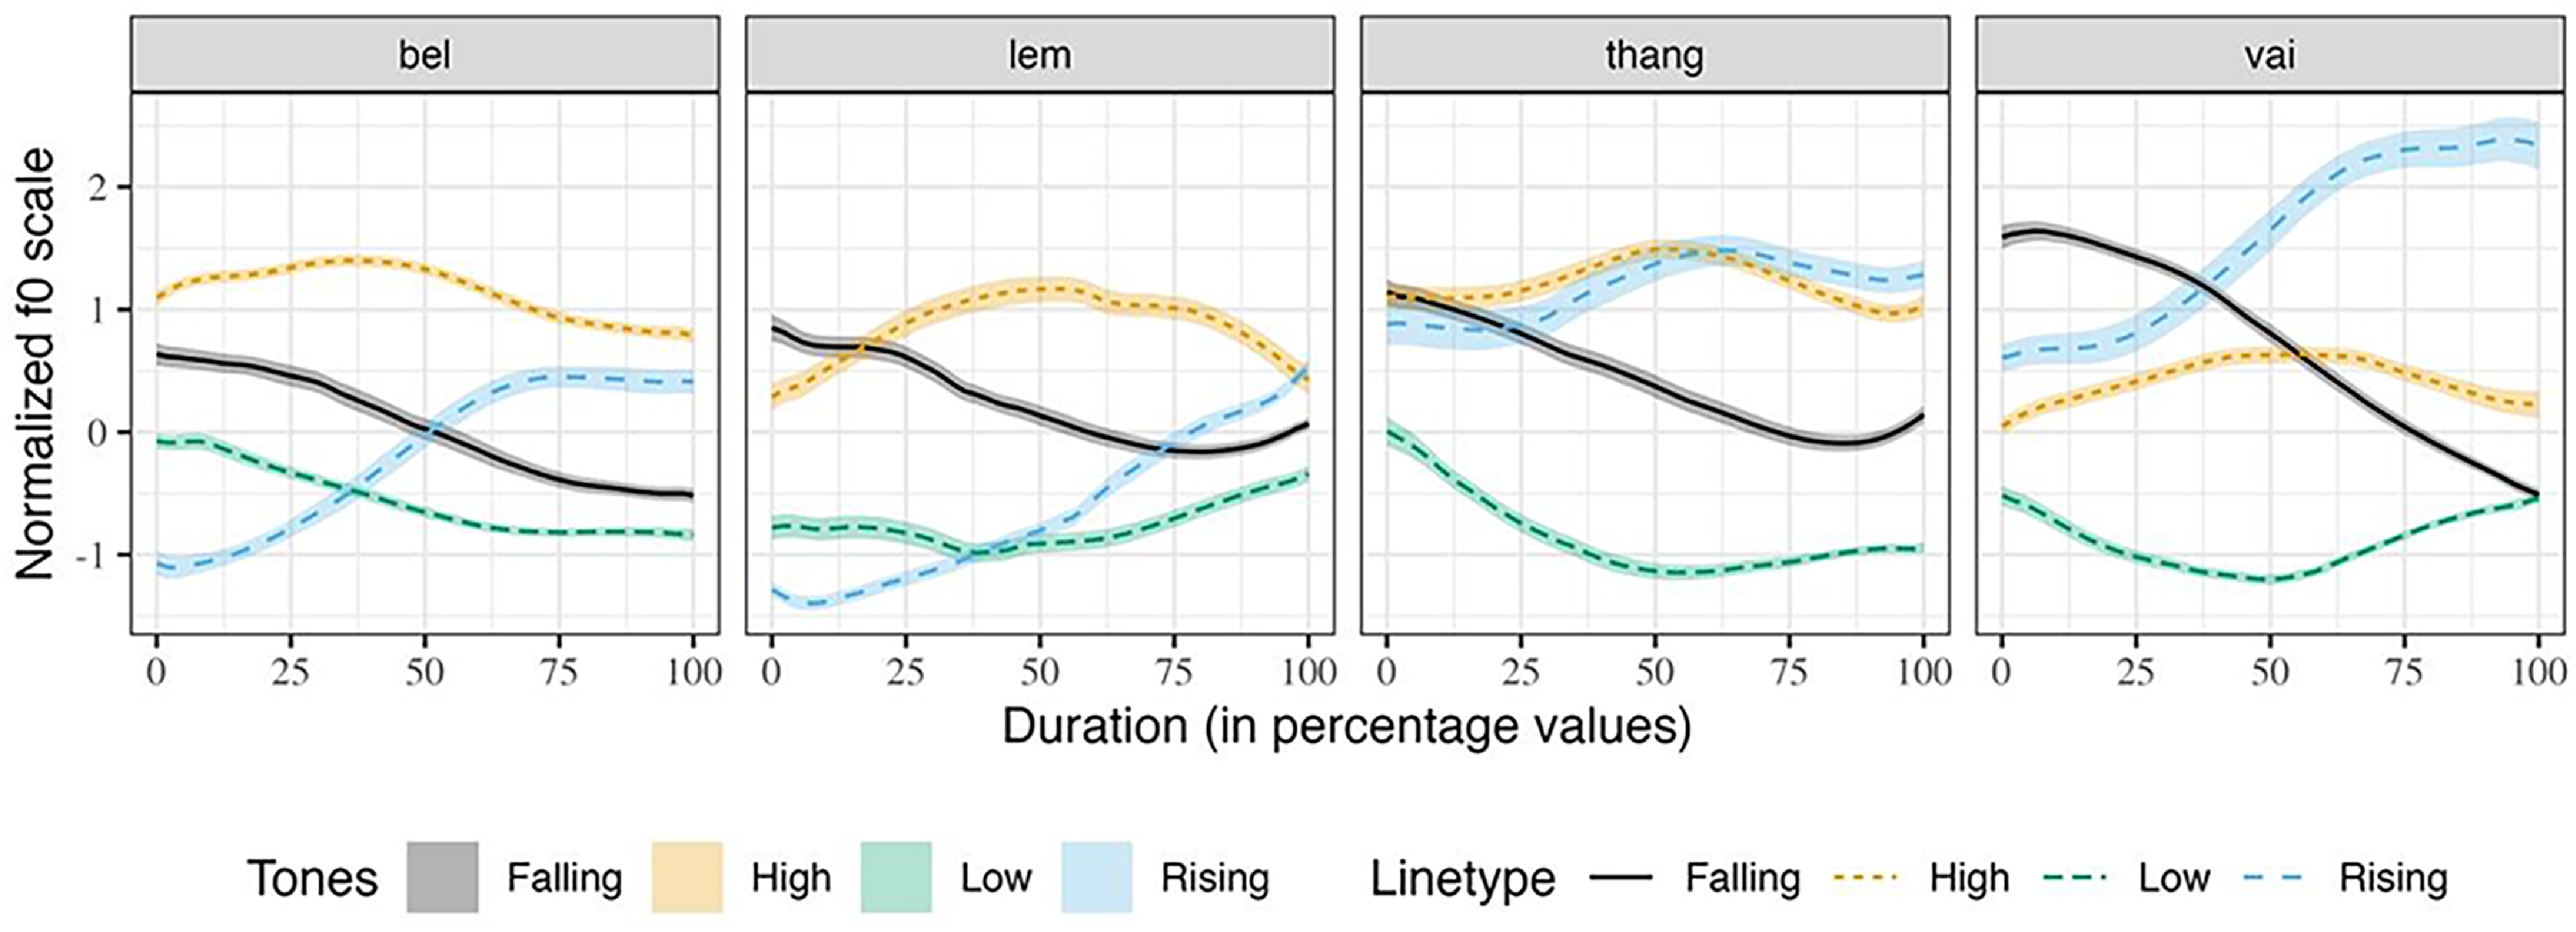
Figure 4 Long description
The image contains four line graphs, each representing the average normalized f0 contours of Mizo tones in different words. The graphs are labeled as bel, lem, thang, and vai. Each graph displays four different tone types: falling, high, low, and rising, represented by distinct line styles. The x-axis of each graph indicates duration in percentage values, while the y-axis shows the normalized f0 scale. The lines within each graph illustrate how the f0 contours vary over time for each tone type in the specified words.
Figure 1 shows the evidence of gender-specific differences in f0 ranges. However, the same Figure indicates that there is no difference in the shapes of the f0 contours of the tones in terms of gender. From Figure 1, the f0 ranges for the male speakers are narrower than that of the female speakers. In Figure 5, the Mizo tones are represented in semitone scale using the Hertz to semitone conversion function, namely, f2st in the R package hqmisc (Quene, Reference Quene2022). Figure 6 provides the averaged raw f0 contours of the four Mizo tones in isolation as produced by all the 10 speakers in this study. As far as speaker-specific differences are concerned, we noticed only physiologically motivated f0 differences in the production of tones, as shown in Figure 6. The speaker-wise plots of Mizo f0 contours of tones produced in semantic and sentence contexts are provided in Figure B1 and Figure B2 of Appendix B. Barring the speaker-specific and gender-specific f0 range differences, the overall shape of the tone contours was not noticeably different among the speakers and gender in this study. Hence, the patterns of the f0 contours are not affected by gender or individual differences, even though absolute f0 values are.
Tone contours of the four Mizo tones in semitones by gender.
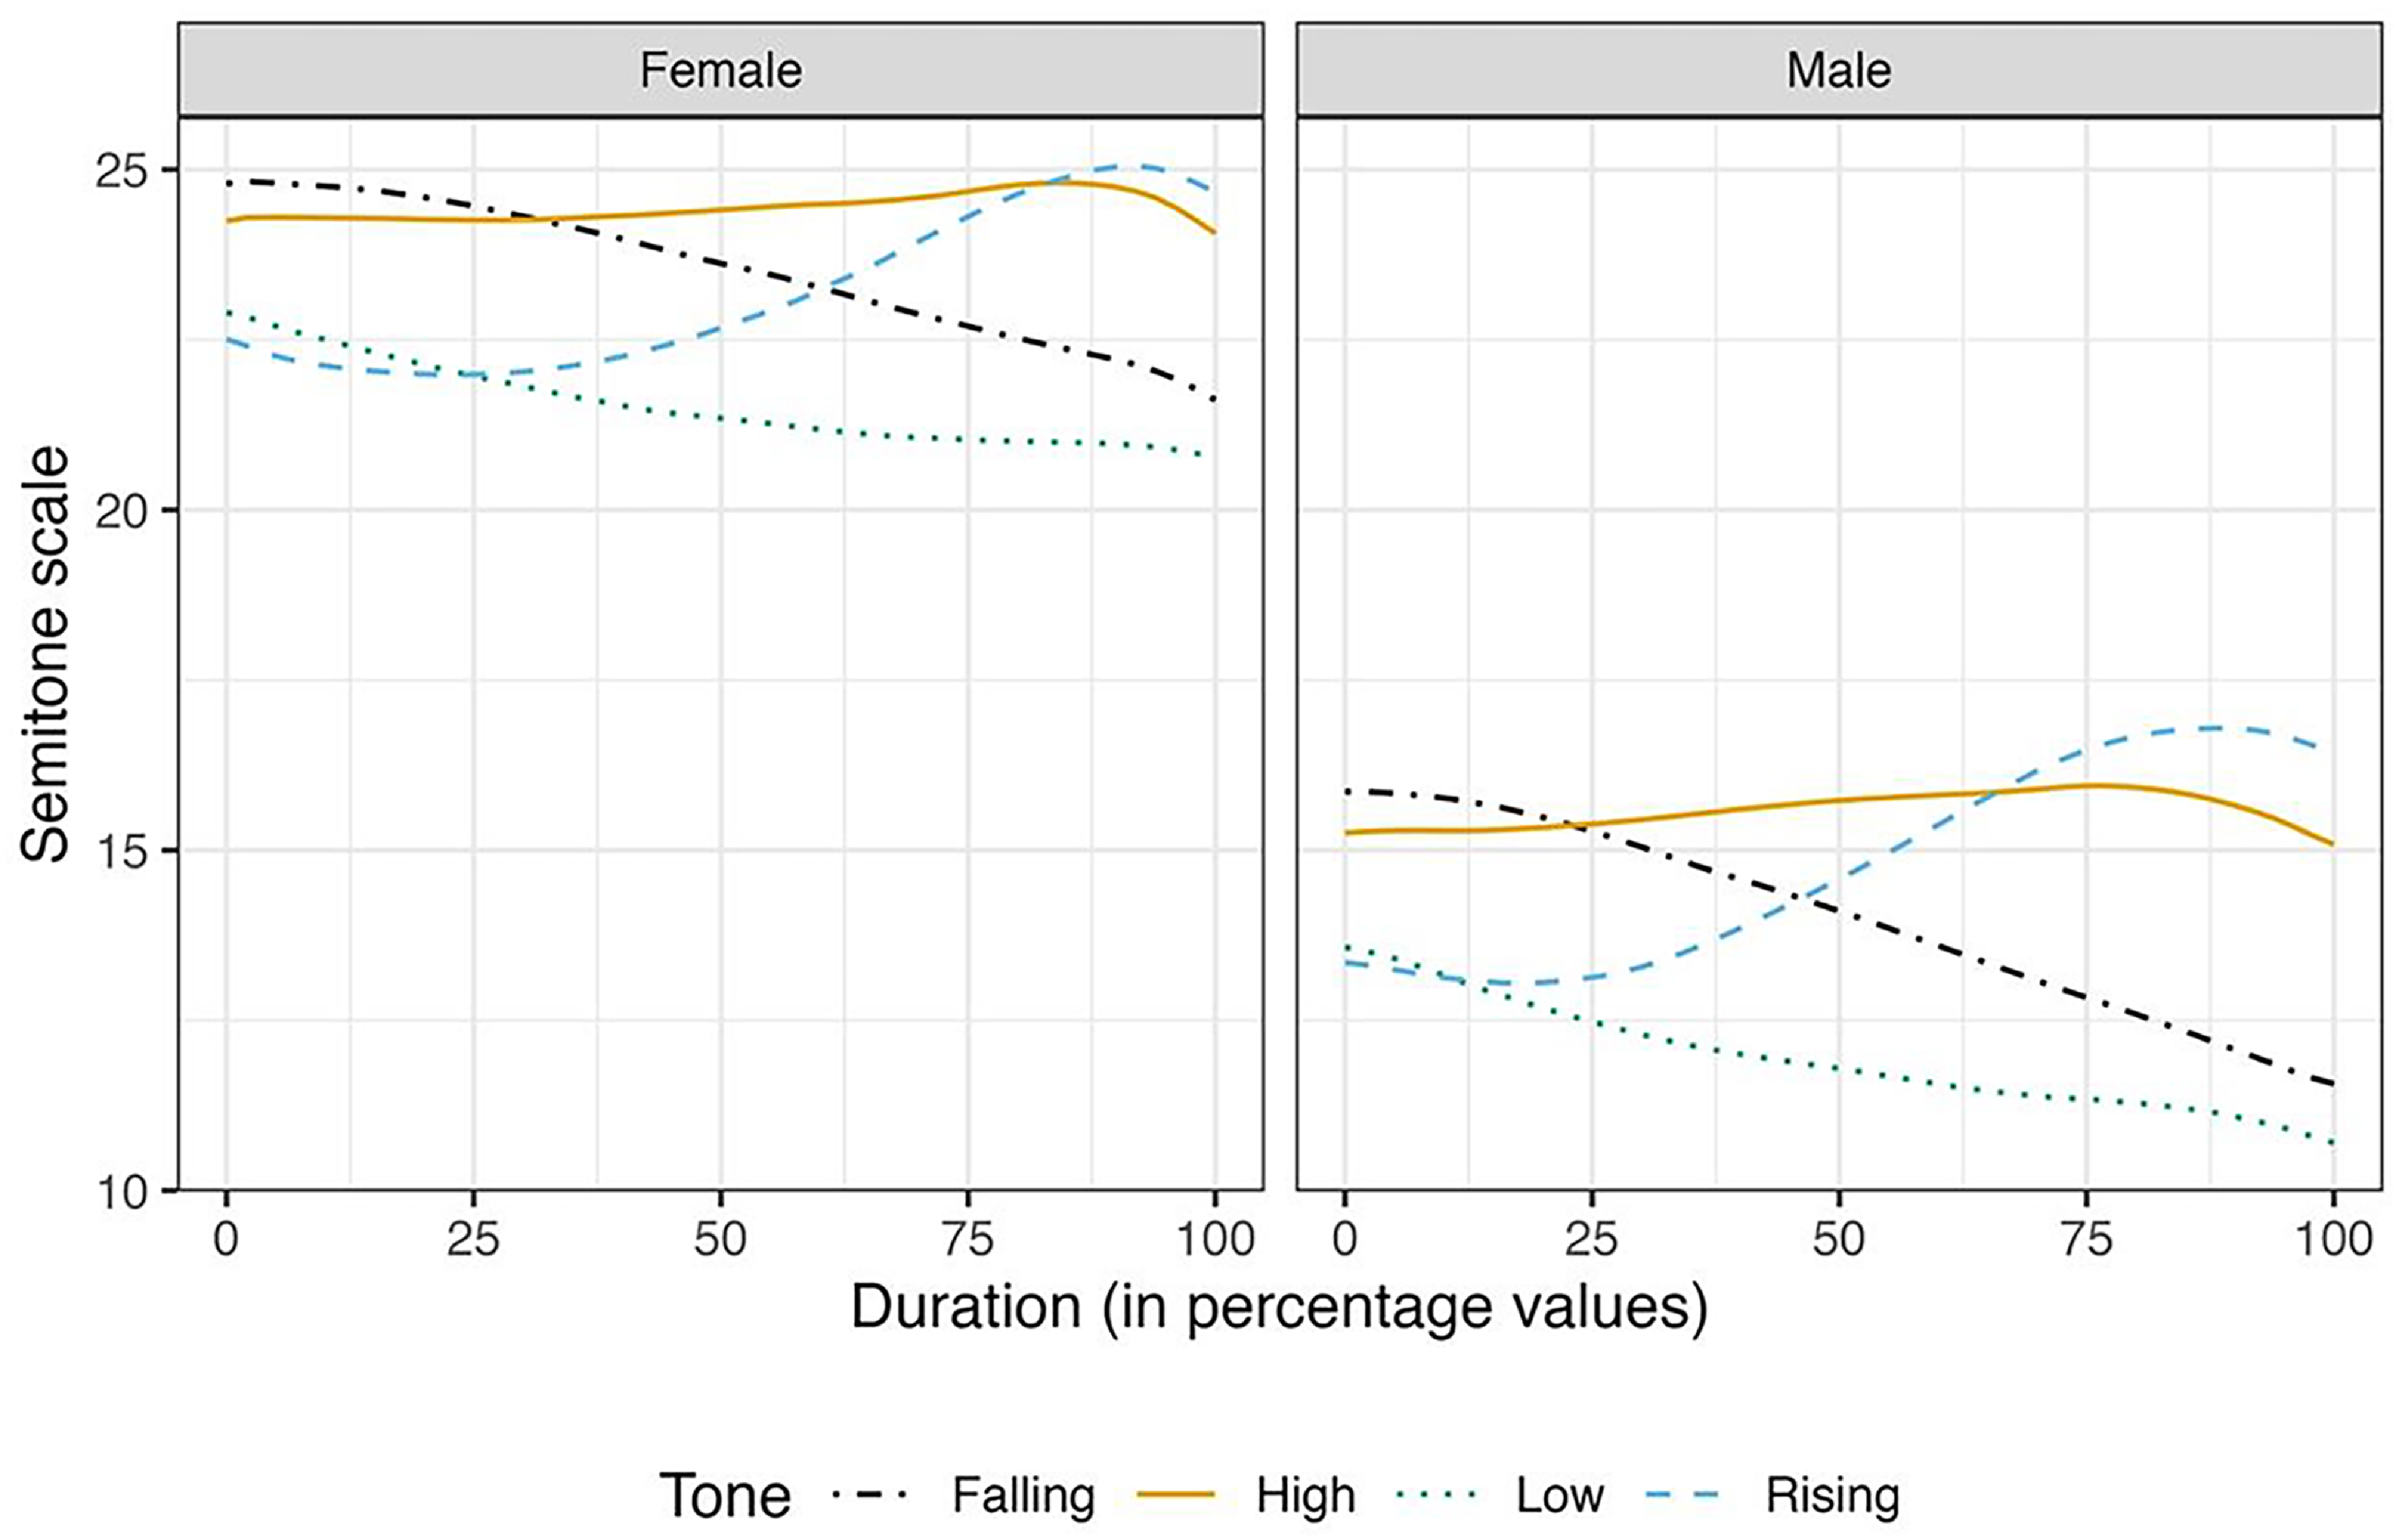
Figure 5 Long description
The line graph displays tone contours of the four Mizo tones in semitones, separated by gender. The x-axis represents duration in percentage values, ranging from 0 to 100. The y-axis represents the semitone scale, ranging from 10 to 25. The graph is divided into two panels: one for female speakers and one for male speakers. Each panel contains four lines representing different tones: falling, high, low, and rising. In the female panel, the falling tone is depicted with a black dashed line, the high tone with a solid yellow line, the low tone with a dotted blue line, and the rising tone with a dashed blue line. In the male panel, the same color and line patterns are used. The lines show variations in tone contours across the duration for both female and male speakers. All values are approximated.
Mean and standard error of raw f0 contours of four Mizo tones produced in isolation.
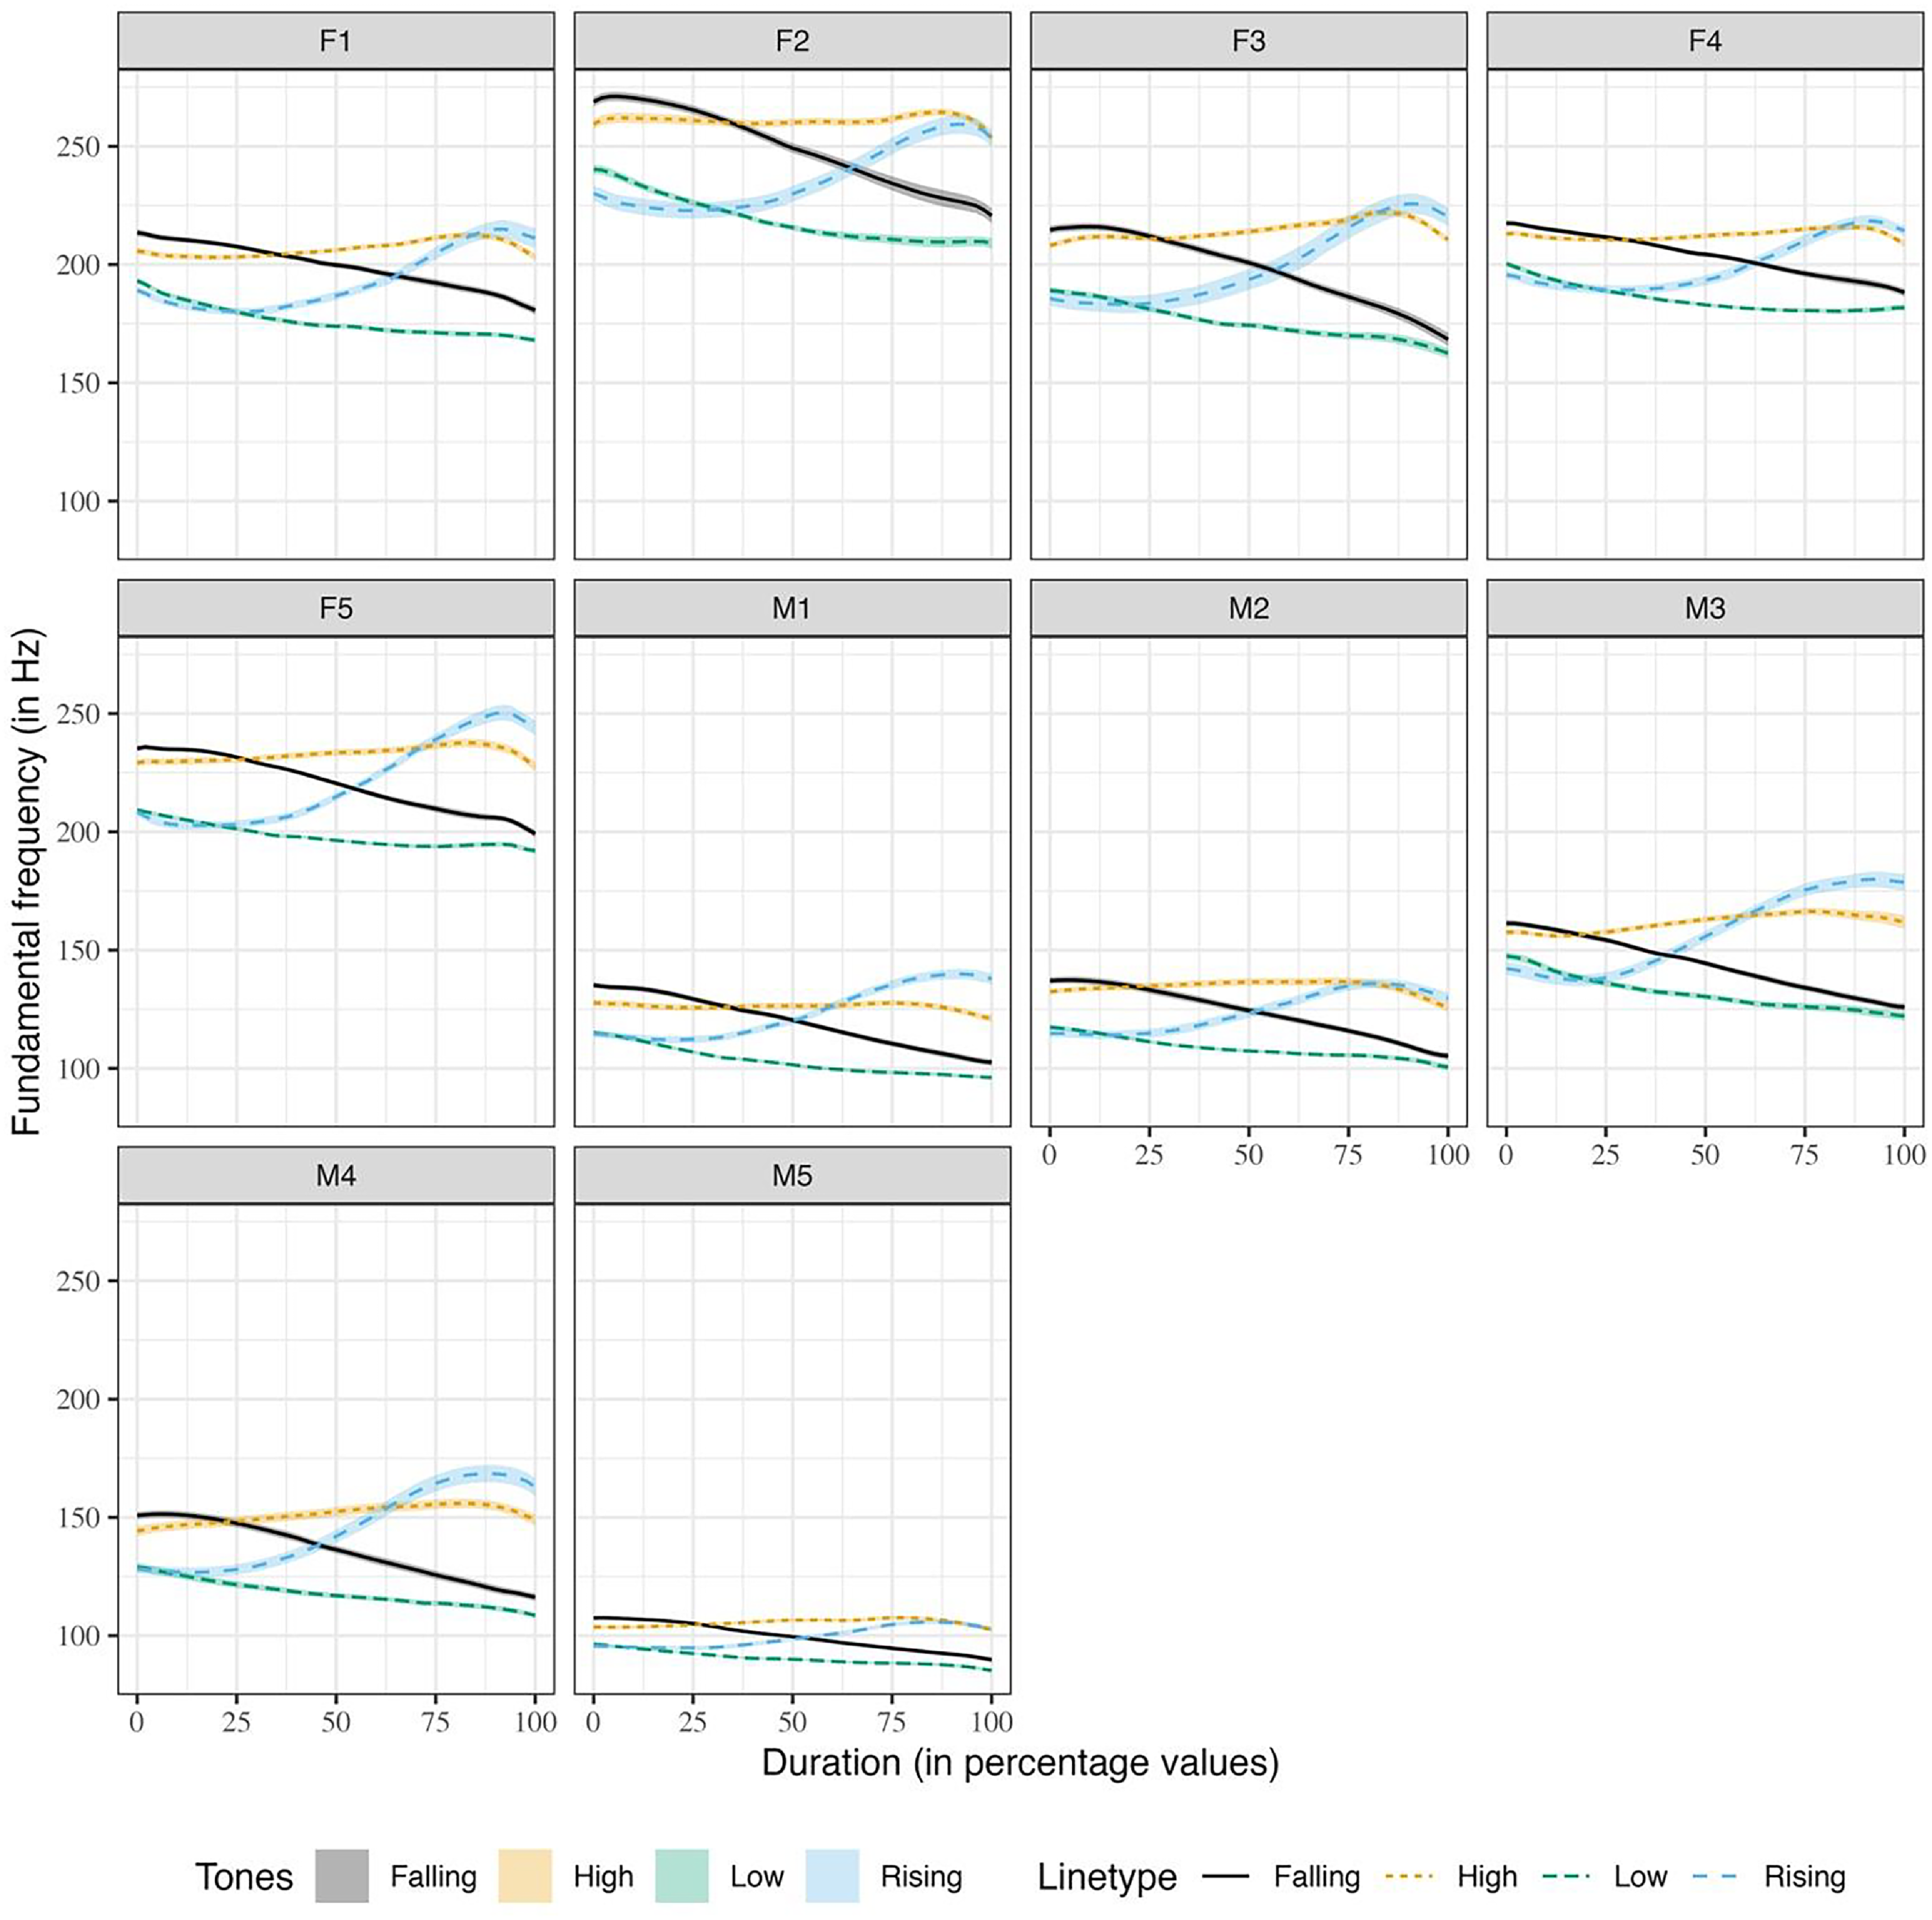
Figure 6 Long description
The image contains ten line graphs arranged in a grid, each representing the fundamental frequency (in Hertz) over duration (in percentage values) for different tones produced in isolation. The graphs are labeled as F1, F2, F3, F4, F5, M1, M2, M3, M4, and M5. Each graph shows four lines representing falling, high, low, and rising tones, distinguished by different colors and line types. The x-axis represents duration in percentage values, ranging from 0 to 100, while the y-axis represents fundamental frequency in Hertz, ranging from 100 to 250. The lines indicate the mean and standard error of raw f0 contours for each tone. The falling tone is represented by a solid black line, the high tone by a dashed yellow line, the low tone by a dashed green line, and the rising tone by a dashed blue line. The graphs illustrate the variations in fundamental frequency over time for each tone category.
4.2 Duration of tones
The TBU in Mizo consists of the vowel and the subsequent sonorant coda; hence, we considered the entire TBU for tone duration. However, as mentioned in Section 3, we have two types of vowels in the data explored in this work, distinguished by phonological vowel length. To reduce the effect of the phonological vowel length in estimating tone durations, we removed the tokens with long vowels in plotting the boxplot shown in Figure 7. Another box plot of the duration of tones, including all the tokens, is also available in Figure B3, Appendix B. From Figure 7, it can be observed that the high tones are longer when produced in isolation. When produced in the semantic context, the rising tones seem shorter. However, when produced in sentence context, the low tones seem marginally longer than the other tones. To see the tone durations for each word, we provided the average duration of each word in each context in Table 3.
Duration of Mizo tones in the three contexts excluding tokens with long vowels.
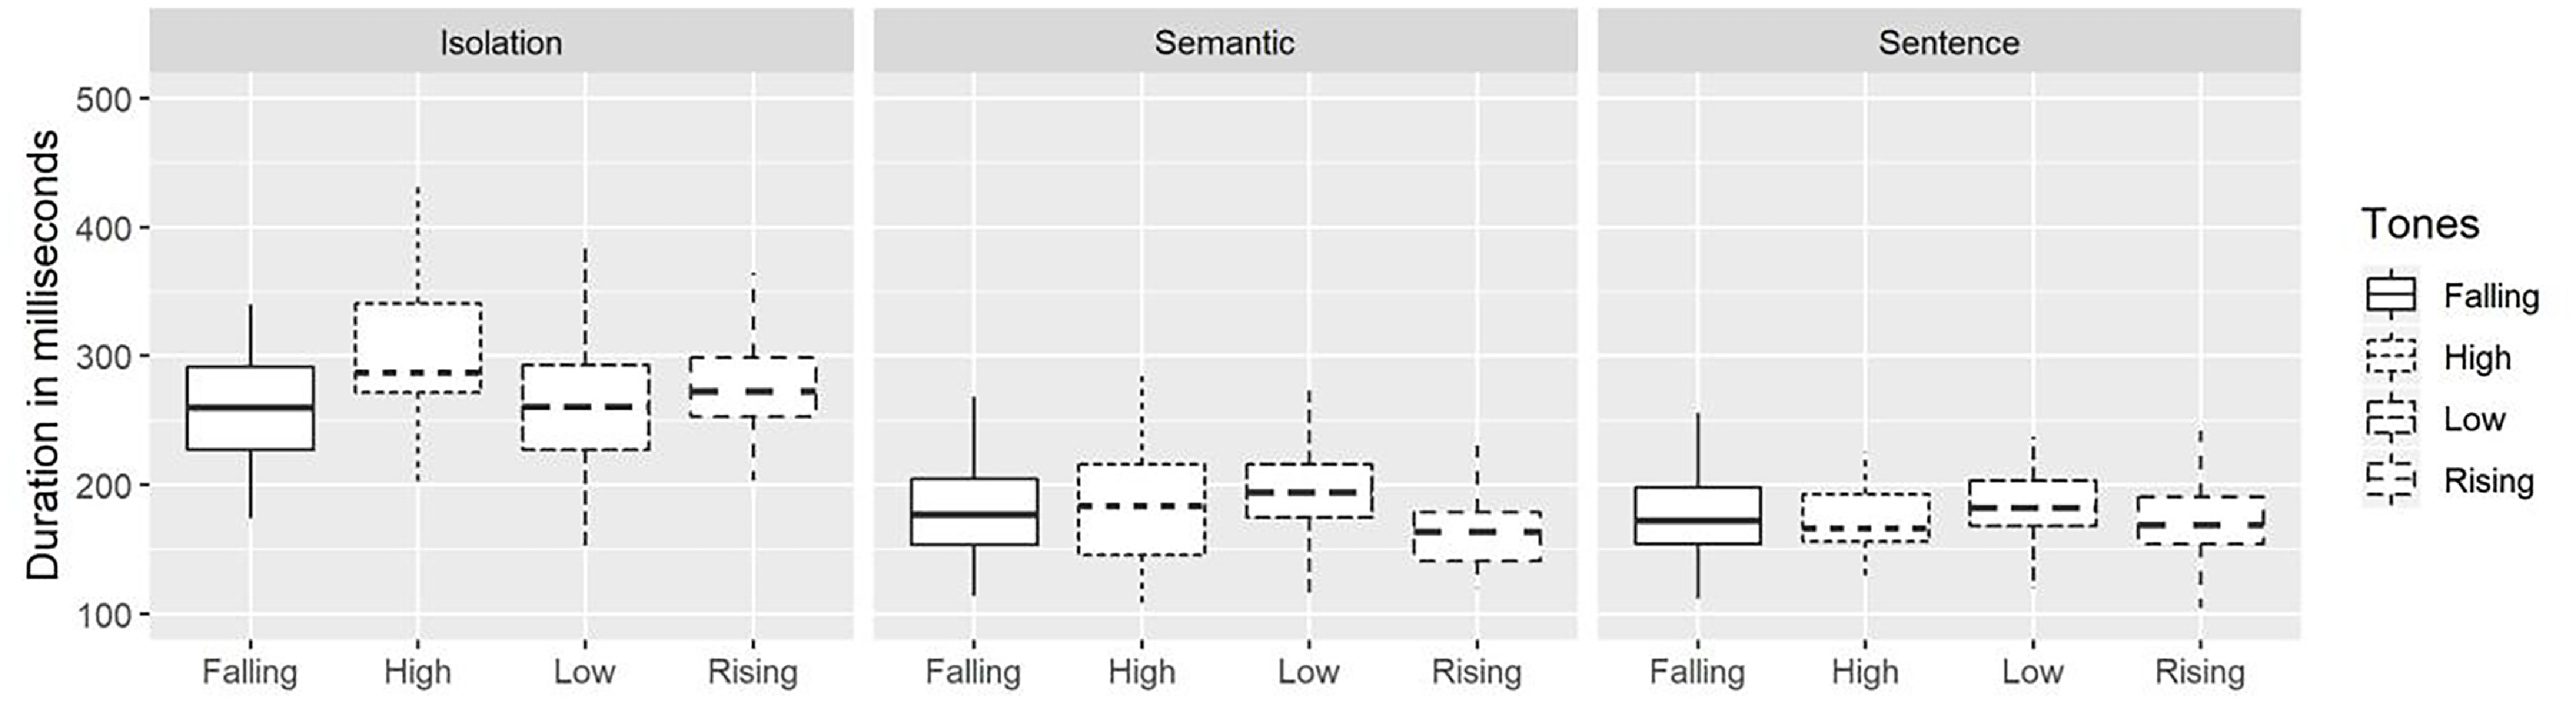
Figure 7 Long description
The box-and-whisker plot displays the duration of Mizo tones in three contexts: Isolation, Semantic, and Sentence. Each context features four box plots representing different tone types: Falling, High, Low, and Rising. The x-axis categorizes the tone types, while the y-axis measures the duration in milliseconds, ranging from 100 to 500 milliseconds. The plot uses different line styles to distinguish between the tone types: solid for Falling, dotted for High, dashed for Low, and dash-dotted for Rising. In the Isolation context, the Falling tone has a median duration around 250 milliseconds, with a wider spread compared to other tones. The High tone shows a similar median but with more outliers. The Low and Rising tones have slightly lower medians and narrower spreads. In the Semantic context, all tones exhibit lower median durations, around 200 milliseconds, with the Falling tone having the widest spread. The Sentence context shows even lower median durations, approximately 150 milliseconds, with all tones having relatively narrow spreads. The plot indicates that the duration of Mizo tones varies significantly across different contexts and tone types, with the Isolation context generally having longer durations. All values are approximated.
Average duration of Mizo tones (in milliseconds) for each word and context, with standard deviations in parentheses
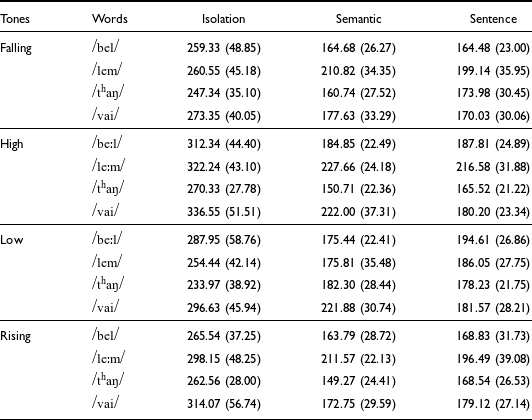
Table 3 Long description
A table displaying the average duration of Mizo tones in milliseconds for various words and contexts, including isolation, semantic, and sentence contexts. The table has four rows for each tone category: falling, high, low, and rising, with four words analyzed under each category. Each cell contains the average duration in milliseconds followed by the standard deviation in parentheses. Notable trends include high tones being longer in isolation, rising tones being shorter in semantic context, and low tones being marginally longer in sentence context.
The normalized f0 contours of the four Mizo tones averaged from three contexts.
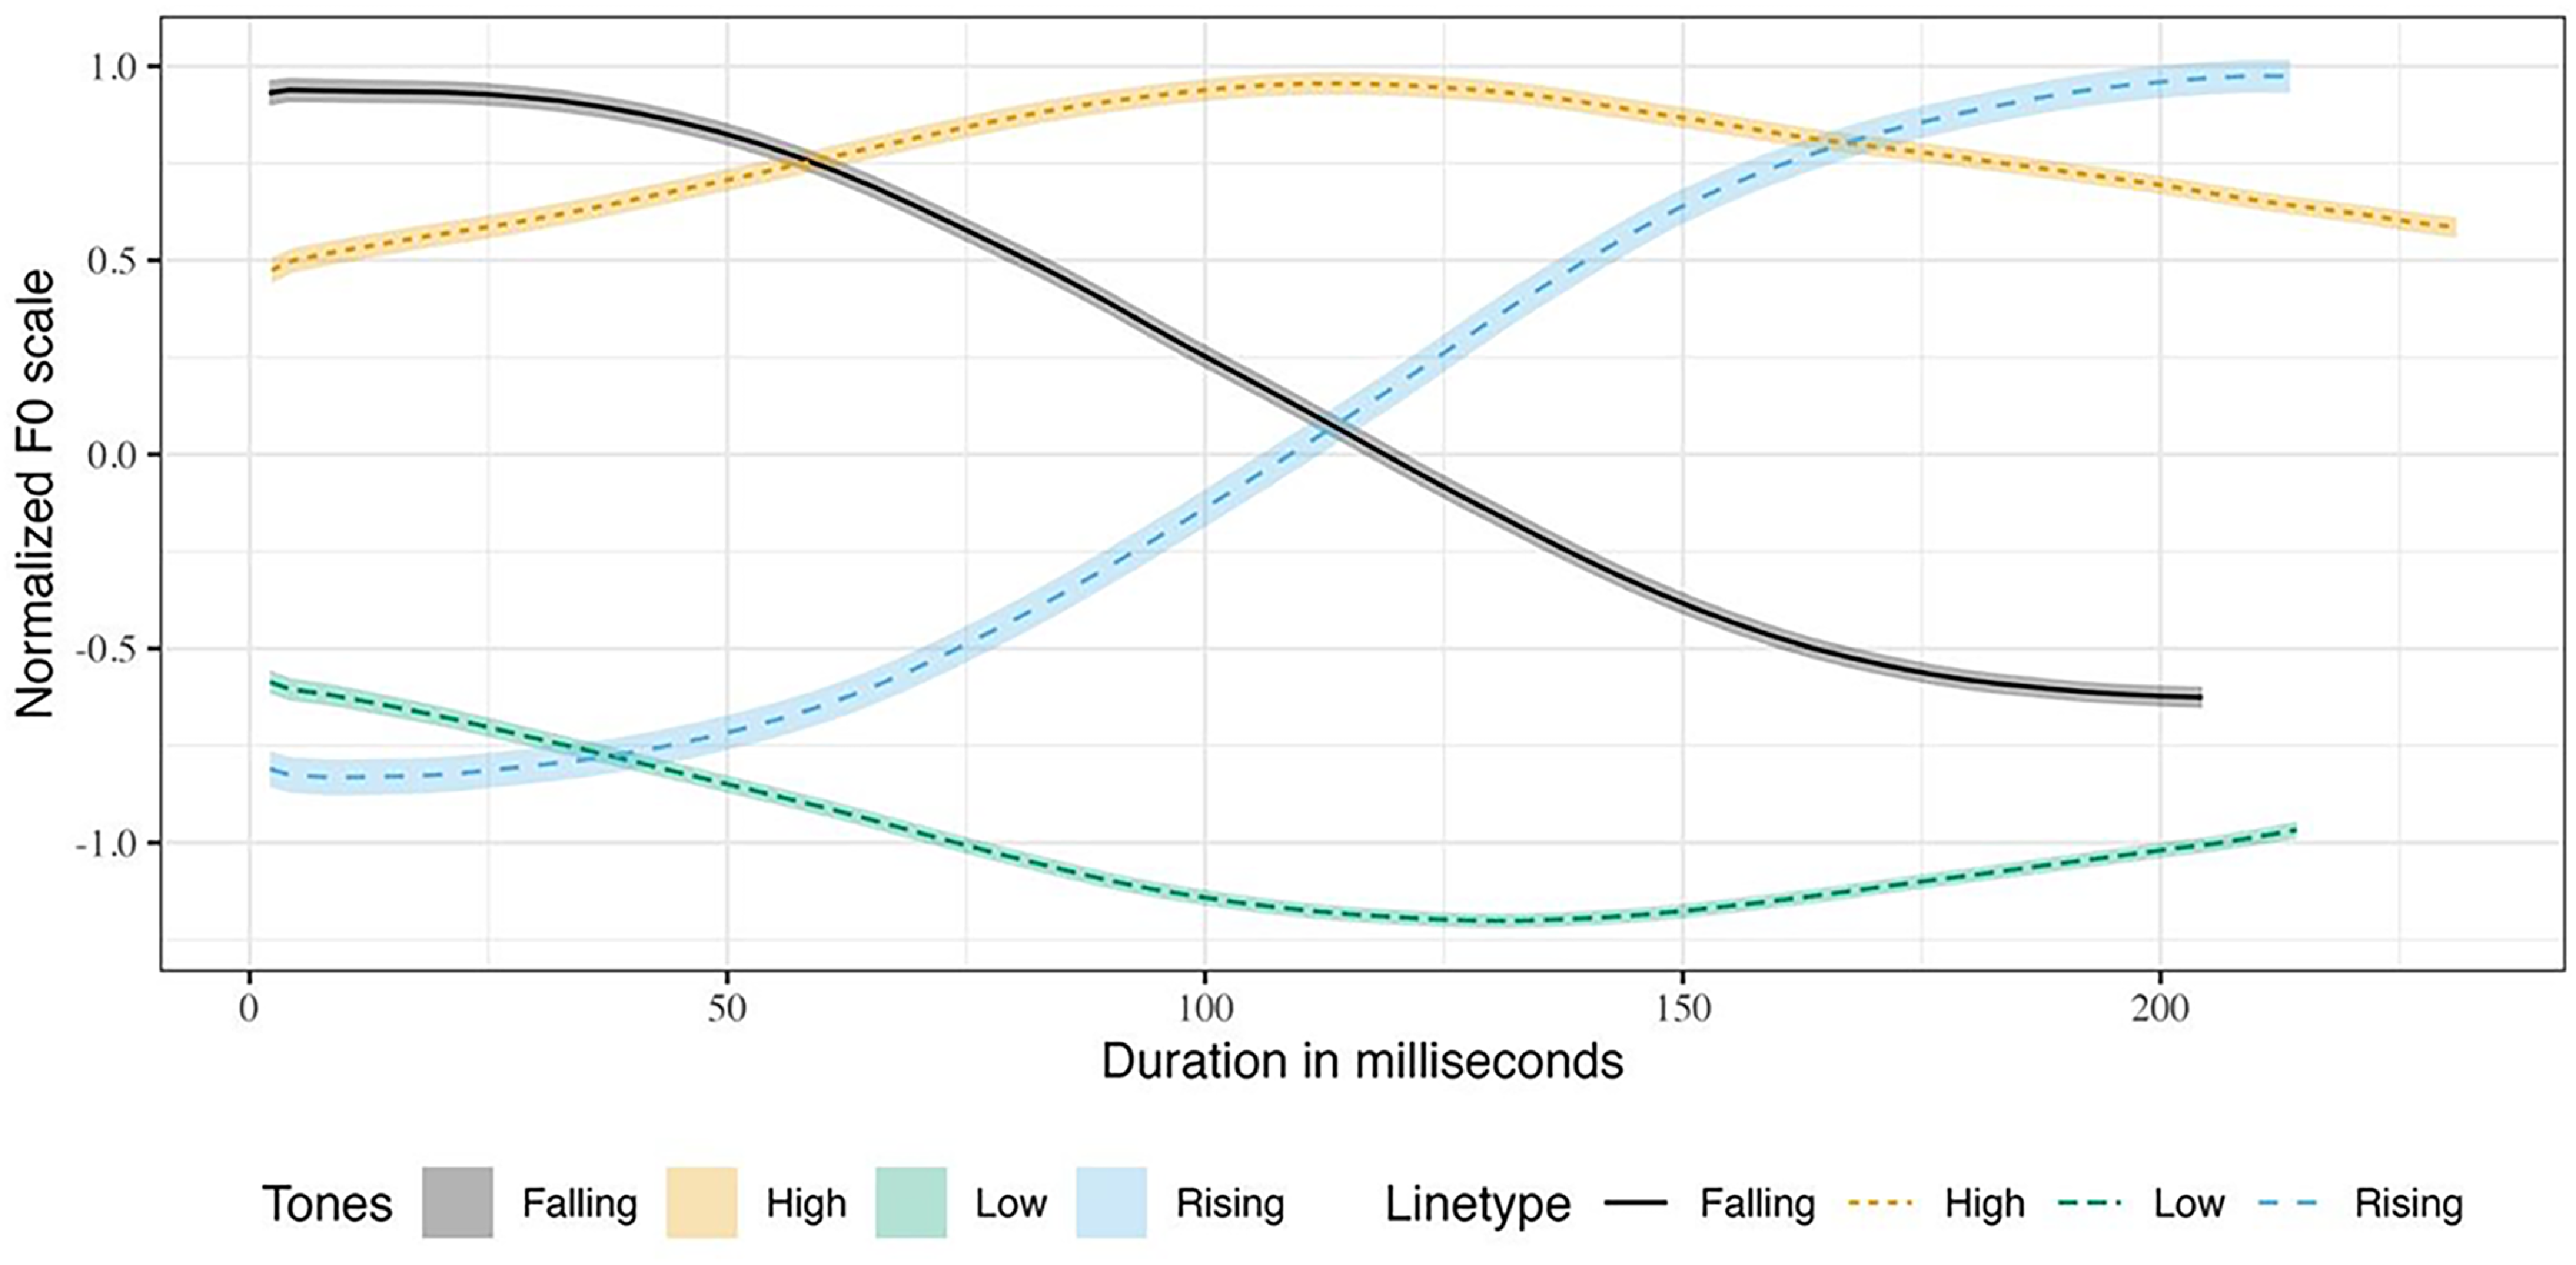
Figure 8 Long description
The line graph displays normalized f0 contours of four Mizo tones over a duration of 200 milliseconds. The x-axis represents the duration in milliseconds, ranging from 0 to 200. The y-axis represents the normalized f0 scale, ranging from -1.0 to 1.0. The graph includes four data lines representing different tones: Falling, High, Low, and Rising. The Falling tone is depicted with a solid black line, the High tone with a dashed yellow line, the Low tone with a dashed green line, and the Rising tone with a dashed blue line. Each line shows the average f0 contours for the respective tone. The Falling tone starts at a high value and gradually decreases, while the Rising tone starts low and increases over time. The High tone remains relatively stable at a high value, and the Low tone remains relatively stable at a low value. All values are approximated.
To have a better visualization of the Mizo tones, Figure 8 shows the speaker-normalized tone contours averaged across the 1,384 iterations of tones in this study. Figure 8 shows the duration of tones as averaged across all tokens. Likewise, Figures B6 to B14 in Appendix B present the f0 contours of the four tones scaled to their average durations. It is seen that a high tone has the longest duration, and a falling tone has the shortest duration. Low and rising tones have similar duration. The mean durations for the Mizo words shown in Table 3 reveal several interesting observations. Firstly, we notice that the tones in the long vowels are relatively the same duration as those in words with non-long vowels. For example, in the case of words produced in isolation, we see that the tone duration of /vai/ is longer than that of /beːl/ and /leːm/, despite the latter having trimoraic rimes. However, in the semantic context /vai/ is only longer than /beːl/. In sentence frames, the tones in words with trimoraic rimes are consistently longer than the other words. To see if these differences are statistically significant or not, we resort to exploratory statistical analyses as described in the following paragraph.
To ascertain the effect of tone types, contexts, and vowel length on tone duration, we performed exploratory statistical modeling using LME. An LME model was built with CONTEXT (sentence, semantic, isolation), TONE (high, low, rising, falling), GENDER (male, female) and VOWEL LENGTH (short, long) as fixed effects and SPEAKER, WORD, and ITERATION as random effects. Further, the LME model was subjected to a Type II Wald χ 2 test for deviance, the results of the test are provided in Table 4. As seen in the table, while all four fixed effects have significant effect on tone duration, owing to the high χ 2 values, CONTEXT seems to have the strongest effect. We also note a significant interaction of TONE × CONTEXT × VOWEL LENGTH [χ 2 (4) = 41.96, p < .001], indicating significant differences in tone durations in each context and across the short and long vowel categories. Hence, the three-way interaction confirmed that the words with the trimoraic rimes, namely, /beːl/ and /leːm/, had a significant effect on the duration of the tones. On the other hand, TONE × CONTEXT × VOWEL LENGTH × GENDER did not yield any statistically significant interaction indicating no effect of gender in the tone duration.
Wald χ 2 tests on duration model on the entire database. Asterisk indicates p < .001.
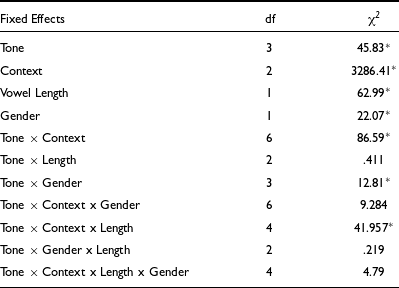
Table 4 Long description
The table presents the results of Wald chi-square tests on a duration model for tone duration, focusing on fixed effects and their interactions. The table has seven rows and three columns. The columns are labeled 'Fixed Effects', 'df', and 'χ²'. The rows list different fixed effects and their interactions, including Tone, Context, Vowel Length, Gender, Tone x Context, Tone x Length, Tone x Gender, Tone x Context x Gender, Tone x Context x Length, Tone x Gender x Length, and Tone x Context x Length x Gender. Notable trends include significant effects of Tone, Context, Vowel Length, Gender, Tone x Context, and Tone x Context x Length, with Context having the strongest effect. The interactions Tone x Context x Length and Tone x Gender x Length are not significant. The table uses asterisks to indicate p-values less than 0.001.
To confirm the effect of tones on vowel duration and to eliminate the possibility of vowel-length effect, we conducted another LME test only on the bimoraic tokens listed in Table 2. An LME model was built with DURATION as a dependent variable and TONE, CONTEXT and GENDER as fixed effects, and SPEAKER, WORD, and ITERATION as random effects.
The model was subjected to a Type II Wald χ 2 test for deviance and both the fixed effects, and their interaction had a significant effect on tone duration. The results of the test are provided in Table B1, Appendix B. To see the pairwise comparison of tone duration in each context, we subjected the LME model to a Bonferroni post-hoc test using the emmeans package (Lenth Reference Lenth2019). The results of the Bonferroni post-hoc tests are summarized in Table 5, and the complete results are provided in Table B2, Appendix B. The summary in Table 5 and Table B2 of Appendix B confirm that, in isolation, the high tones are significantly longer than the other tones. However, when produced in the semantic context, no such pattern is noticed. Nevertheless, in the semantic context, the rising tones are significantly shorter than the high and the low tones. Finally, when produced in sentence frames, tones do not exhibit any significant differences in duration. Hence, from this discussion, we conclude that the durational differences we observed in tones are not systematic across contexts, and when produced in phrasal contexts, such differences diminish.
Summary of comparison of tone duration in short vowels. Statistical significance is indicated by an asterisk while non-significance is indicated by n.s.
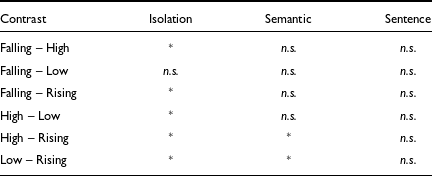
Table 5 Long description
A table with four rows and four columns comparing tone duration in short vowels across isolation, semantic, and sentence contexts. The columns are labeled Contrast, Isolation, Semantic, and Sentence. The rows list different tone contrasts: Falling High, Falling Low, Falling Rising, High Low, High Rising, and Low Rising. Statistical significance is indicated by an asterisk while non-significance is indicated by n.s. In isolation, high tones are significantly longer than other tones. In semantic context, rising tones are significantly shorter than high and low tones. In sentence frames, tones do not exhibit significant differences in duration.
4.3 Discrete Cosine Transform and f0 slope
As mentioned in Section 3.4, the first three DCT coefficients were used to model the f0 contours of the Mizo tones in this work. The f0 contours can be reconstructed by computing the DCT of a zero-padded sequence containing the three DCT coefficients. Such reconstructed tone contours, along with their standard errors for the four Mizo tones, produced by male and female speakers in all contexts, are shown in Figure 9. The shapes of these reconstructed tone contours are slightly different from those of the average raw f0 contours presented in Figure 1. The initiation of f0 in high tone has a low range of f0 which is even lower than the starting point of the falling tone. While the f0 contour for the high tone seems fairly level, it actually is slightly rising. The f0 contours of falling and low tones are quite similar, where both tones start to fall gradually, almost parallel to each other until half of the total duration. As suggested in Sarmah & Wiltshire (Reference Sarmah and Wiltshire2010b), an appropriate characterization for the low tone should be low-falling. The falling tone continues to fall until the end, while the low tone begins to show level contour from about 75% of the total duration until the end. The f0 termination points of falling and low tones are almost the same. The f0 initiation of a rising tone is lower than a low tone, which is also assumed to start with a low pitch. The rising tone rises from about 25% of the total duration until the end.
The averages of C1 and C2 values for each of the Mizo tones, categorized by the context in which they were spoken, are provided in Table 6. As C0 is gender dependent, we are not providing the C0 values here. Table 6 shows that the dynamic nature of the f0 contours of Mizo rising and falling tones are captured well by the second DCT coefficient, C1. Apart from the two contour tones, the low tone in Mizo has a falling pitch contour, as evident from the high C1 values. The slight rise in the high tones of Mizo is captured by the negative C1 values. A high positive C2 value shows a fall-rise pattern of the f0 contour, and a high negative value is characterized by a rising-falling pitch contour. When produced in isolation, the high tone in Mizo has a rising contour captured by the positive C2 values. However, the rise appears as rise-fall when the high tone is produced in the sentence and semantic contexts. This leads to negative C2 values for the high tone. In the case of the rising tone, the pitch contour has a clear fall-rise which is captured by high positive C2 values. However, in the sentence and semantic contexts, the fall-rise is reduced to a simple rise characterized by lower C2 values. Considering this, we can conclude that C2 in Mizo captures phonetic variations in the pitch contour that covary with the context. Hence, only C2 will not be able to characterize the phonological tones of Mizo. We decided to conduct a QDA with different combinations of the C0, C1, and C2, including the tone duration information, to see how well these features help automatically classify the tones in Mizo.
Average C1 and C2 values for Mizo tones in the three contexts
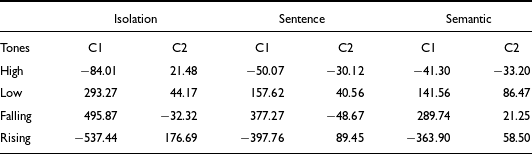
Table 6 Long description
The table presents the averages of C1 and C2 values for each of the Mizo tones, categorized by the context in which they were spoken. It includes three contexts: Isolation, Sentence, and Semantic, with four tones: High, Low, Falling, and Rising. The table has four rows for the tones and three columns for each context, providing C1 and C2 values. Notable trends include high C1 values for the Low tone indicating a falling pitch contour, and negative C1 values for the High tone indicating a slight rise. The C2 values show a fall-rise pattern for the Rising tone and a rise-fall pattern for the High tone in the Isolation context, which changes to a simple rise in the Sentence and Semantic contexts. The data highlights how the dynamic nature of the f0 contours of Mizo tones is captured by the second DCT coefficient, C1, and how C2 captures phonetic variations in the pitch contour that covary with the context.
Reconstructed f0 contours from DCT coefficients of Mizo tones.
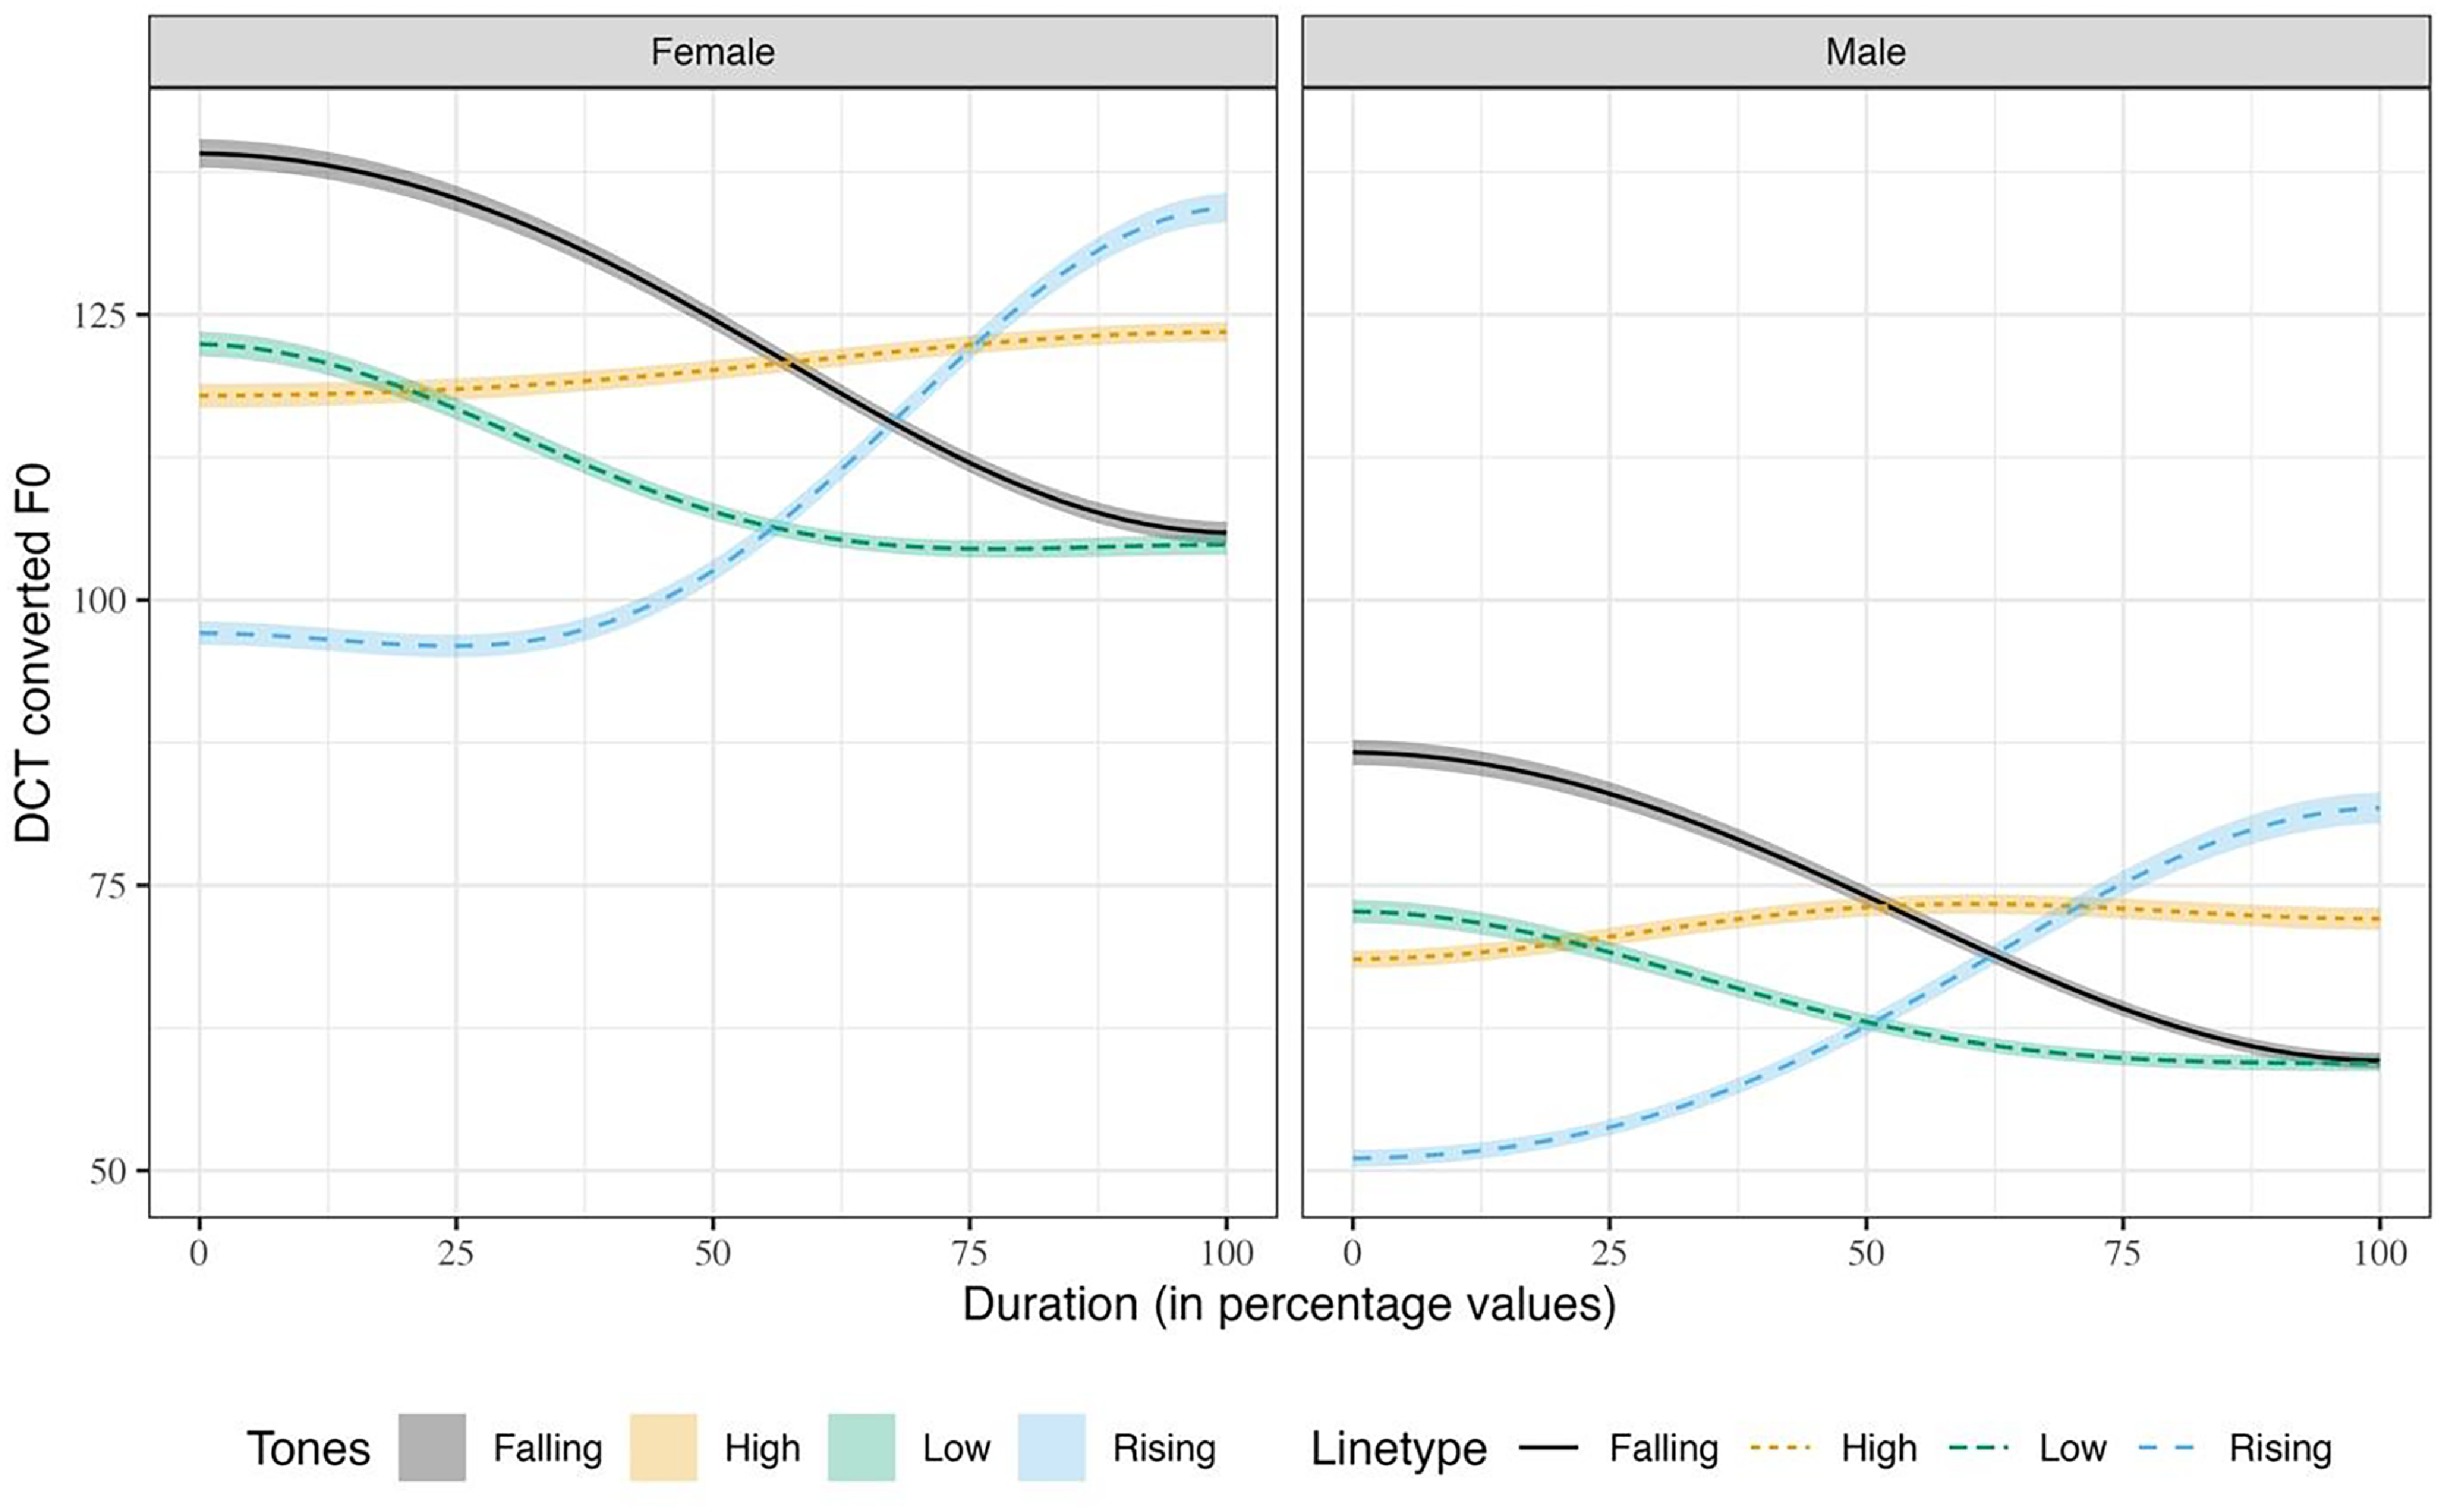
Figure 9 Long description
Two line graphs compare DCT converted F0 values over duration for female and male speakers, showing different tone contours. The left graph represents female speakers, while the right graph represents male speakers. Each graph displays four tone types: falling, high, low, and rising, represented by different colors and line styles. The x-axis indicates duration in percentage values, and the y-axis shows DCT converted F0 values. In the female graph, the falling tone starts high and decreases, the high tone remains relatively stable, the low tone starts low and slightly increases, and the rising tone starts low and significantly increases. In the male graph, similar patterns are observed but with different F0 values. The falling tone decreases, the high tone remains stable, the low tone slightly increases, and the rising tone significantly increases. The graphs illustrate the distinct F0 contours associated with each tone type for both female and male speakers.
The QDA classification results reported in Table 7 show that among the single features, C1 can classify the Mizo tones with an average accuracy of 75.6%. Average f0, characterized by C0 yields only 28.9% accuracy, and C2 yields 48.4% accuracy. Hence, it can be concluded that the rise or fall of the tone contour is sufficient for categorizing Mizo tones. However, the combination of the C0, C1, and C2 coefficients significantly improves the accuracy of tone classification to 86.4%. Adding tone duration as a feature marginally improves the results of tone classification by 0.7%. From the QDA classification, it can be concluded that only C1 represents the toneme-specific information, while C0, C2 and duration provide phonetic information associated with the tones.
Accuracy of classification of tones using QDA (values in %)
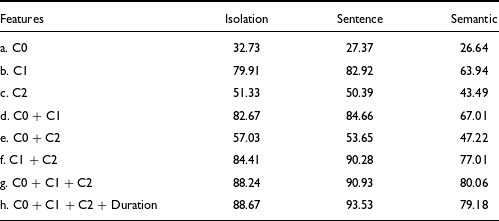
Table 7 Long description
The table presents the accuracy of classification of tones using QDA, with values given in percentages. It features eight rows and four columns, including headers for Features, Isolation, Sentence, and Semantic. The rows detail different combinations of features (C0, C1, C2, and Duration) and their corresponding accuracy percentages across three contexts: Isolation, Sentence, and Semantic. Notably, C1 alone achieves the highest individual accuracy, particularly in Sentence context at 82.92%. Combining C0, C1, and C2 significantly boosts accuracy, peaking at 90.93% in Sentence context. Adding Duration further improves results marginally. The data suggests that C1 is crucial for toneme-specific information, while C0, C2, and Duration provide additional phonetic details.
The results of the QDA show that tones are best classified when they are produced within sentence frames containing fixed preceding and following phonetic contexts. On the other hand, when they are produced in the semantic context, where the preceding and following phonetic contexts vary, tone classification is the worst. In the case of tones produced in isolation, classification is better than the semantic context but worse than the sentence context. We can conclude that such patterns in the QDA classification are due to tonal coarticulation. In the sentence context, co-articulatory effects are controlled, resulting in better tone models.
However, in the case of the semantic context, co-articulatory effects are manifold; hence, tone models are less robust. We assume that a portion of these errors are also due to the tone alteration in /thaŋ/ and /vai/ that we reported in Section 4.2. Again, in the case of tones produced in isolation, even though phonetic contexts are non-existent, the production of tones may not be as controlled, leading to poor tone models.
We also conducted a few exploratory statistical measurements to see the effect of tone types on DCT coefficients. As mentioned in Section 3.4, the three LME models for C0, C1 and C2 were subjected to Wald χ 2 tests. The results obtained are provided in Table 8. The table shows that all three DCT coefficients have a significant effect on TONE in Mizo. However, from the high values of C1, it is evident that coefficient C1 has a strong correlation with tone types in Mizo. Apart from the main effect of tone, we also see that in all three models, there is significant interaction of tone and context, confirming that the difference in the values of the first three DCT coefficients by tones is also different depending on the context. We also notice that for C2, there is significant three-way interaction of tone, context, and gender, but not for C0 and C1. This indicates that gender-wise C2 values are significantly different, indicating differences in the realization of the tone contour. We investigated the interaction more closely by plotting an interaction plot for C2 as shown in Figure 10. The interaction plot clearly shows that in the case of the Mizo rising tones produced in isolation, the female speakers have a much higher C2 value than the male speakers. When investigated further we found that the Mizo female speakers produce the rising tones in isolation with clear falling-rising f0 contour, resulting in higher positive values for C2. To confirm this, we plotted the f0 contours reconstructed from the DCT coefficients separately for each speaker producing the Mizo tones in isolation.
Wald χ 2 tests on C0, C1 and C2 models
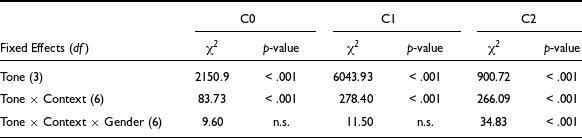
Table 8 Long description
The table presents Wald 2 test results for three models, C0, C1, and C2, focusing on fixed effects. It includes three rows for different fixed effects: Tone with 3 degrees of freedom, Tone and Context with 6 degrees of freedom, and Tone, Context, and Gender with 6 degrees of freedom. Each row shows chi-square values and p-values for the models. For Tone, the chi-square values are 2150.9 for C0, 6043.93 for C1, and 900.72 for C2, all with p-values less than 0.001. For Tone and Context, the chi-square values are 83.73 for C0, 278.40 for C1, and 266.09 for C2, all with p-values less than 0.001. For Tone, Context, and Gender, the chi-square values are 9.60 for C0, 11.50 for C1, and 34.83 for C2, with p-values not significant for C0 and C1 but less than 0.001 for C2. The table indicates significant effects of tone and context interactions across all models and a significant three-way interaction of tone, context, and gender for the C2 model.
Interaction plot for C2 showing the interaction of Tone × Context × Gender.
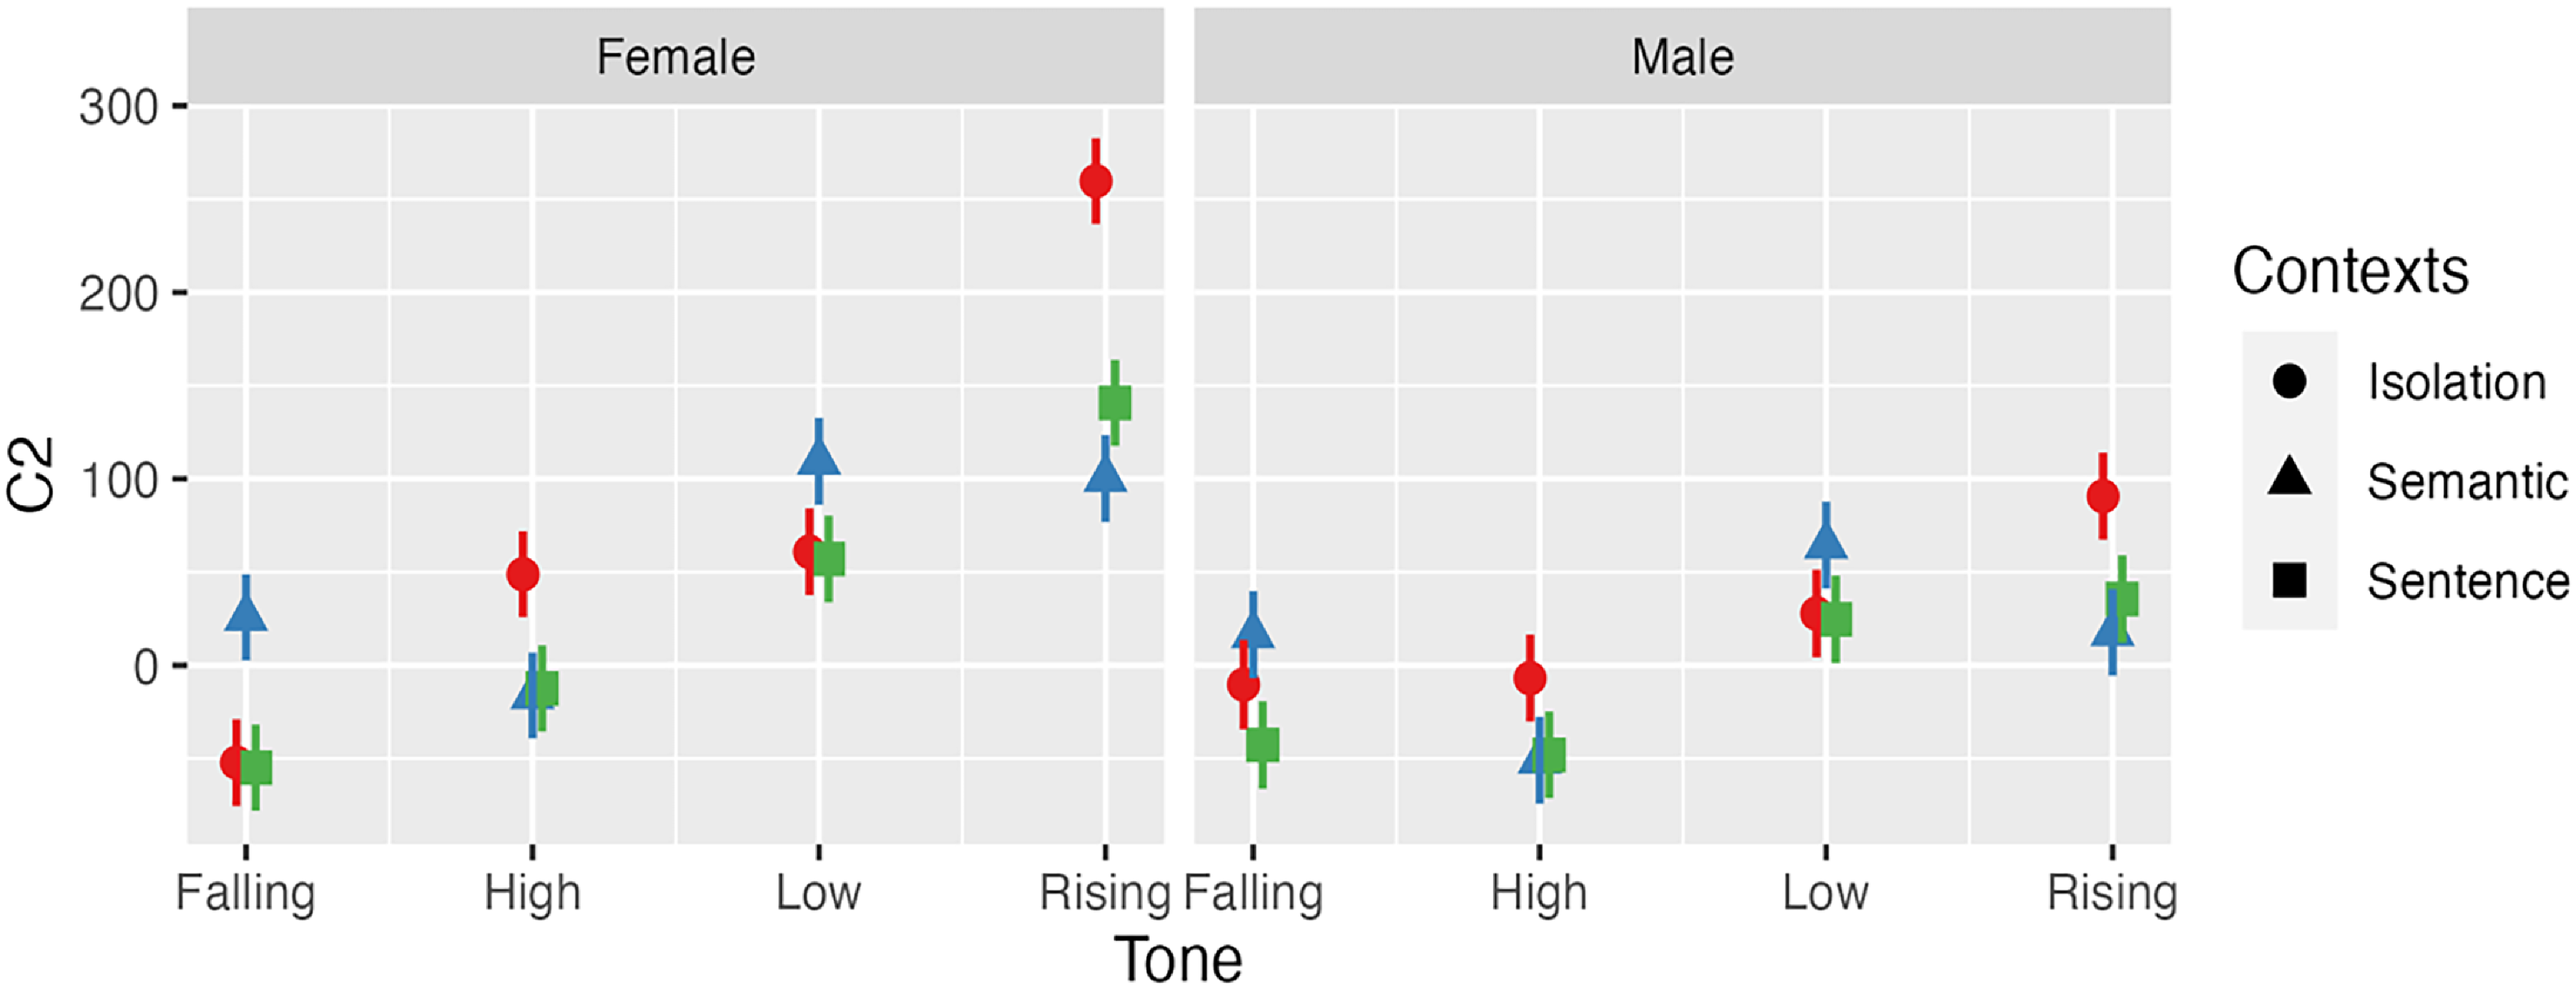
Figure 10 Long description
The image presents an interaction plot for C2, illustrating the interaction of Tone, Context, and Gender. The plot is divided into two sections: Female and Male. Each section contains data points for different tones: Falling, High, Low, and Rising. The contexts are represented by different symbols: circles for Isolation, triangles for Semantic, and squares for Sentence. The y-axis represents C2 values, ranging from 0 to 300. For females, the data points show variations in C2 values across different tones and contexts, with notable differences in the Rising tone context. For males, the data points also vary across tones and contexts, with significant differences in the Low and Rising tone contexts. The plot highlights how C2 values interact with tone and context for both genders, providing insights into the linguistic descriptions of Mizo tones. All values are approximated.
Tone f0 contours produced in isolation, reconstructed using DCT coefficients.
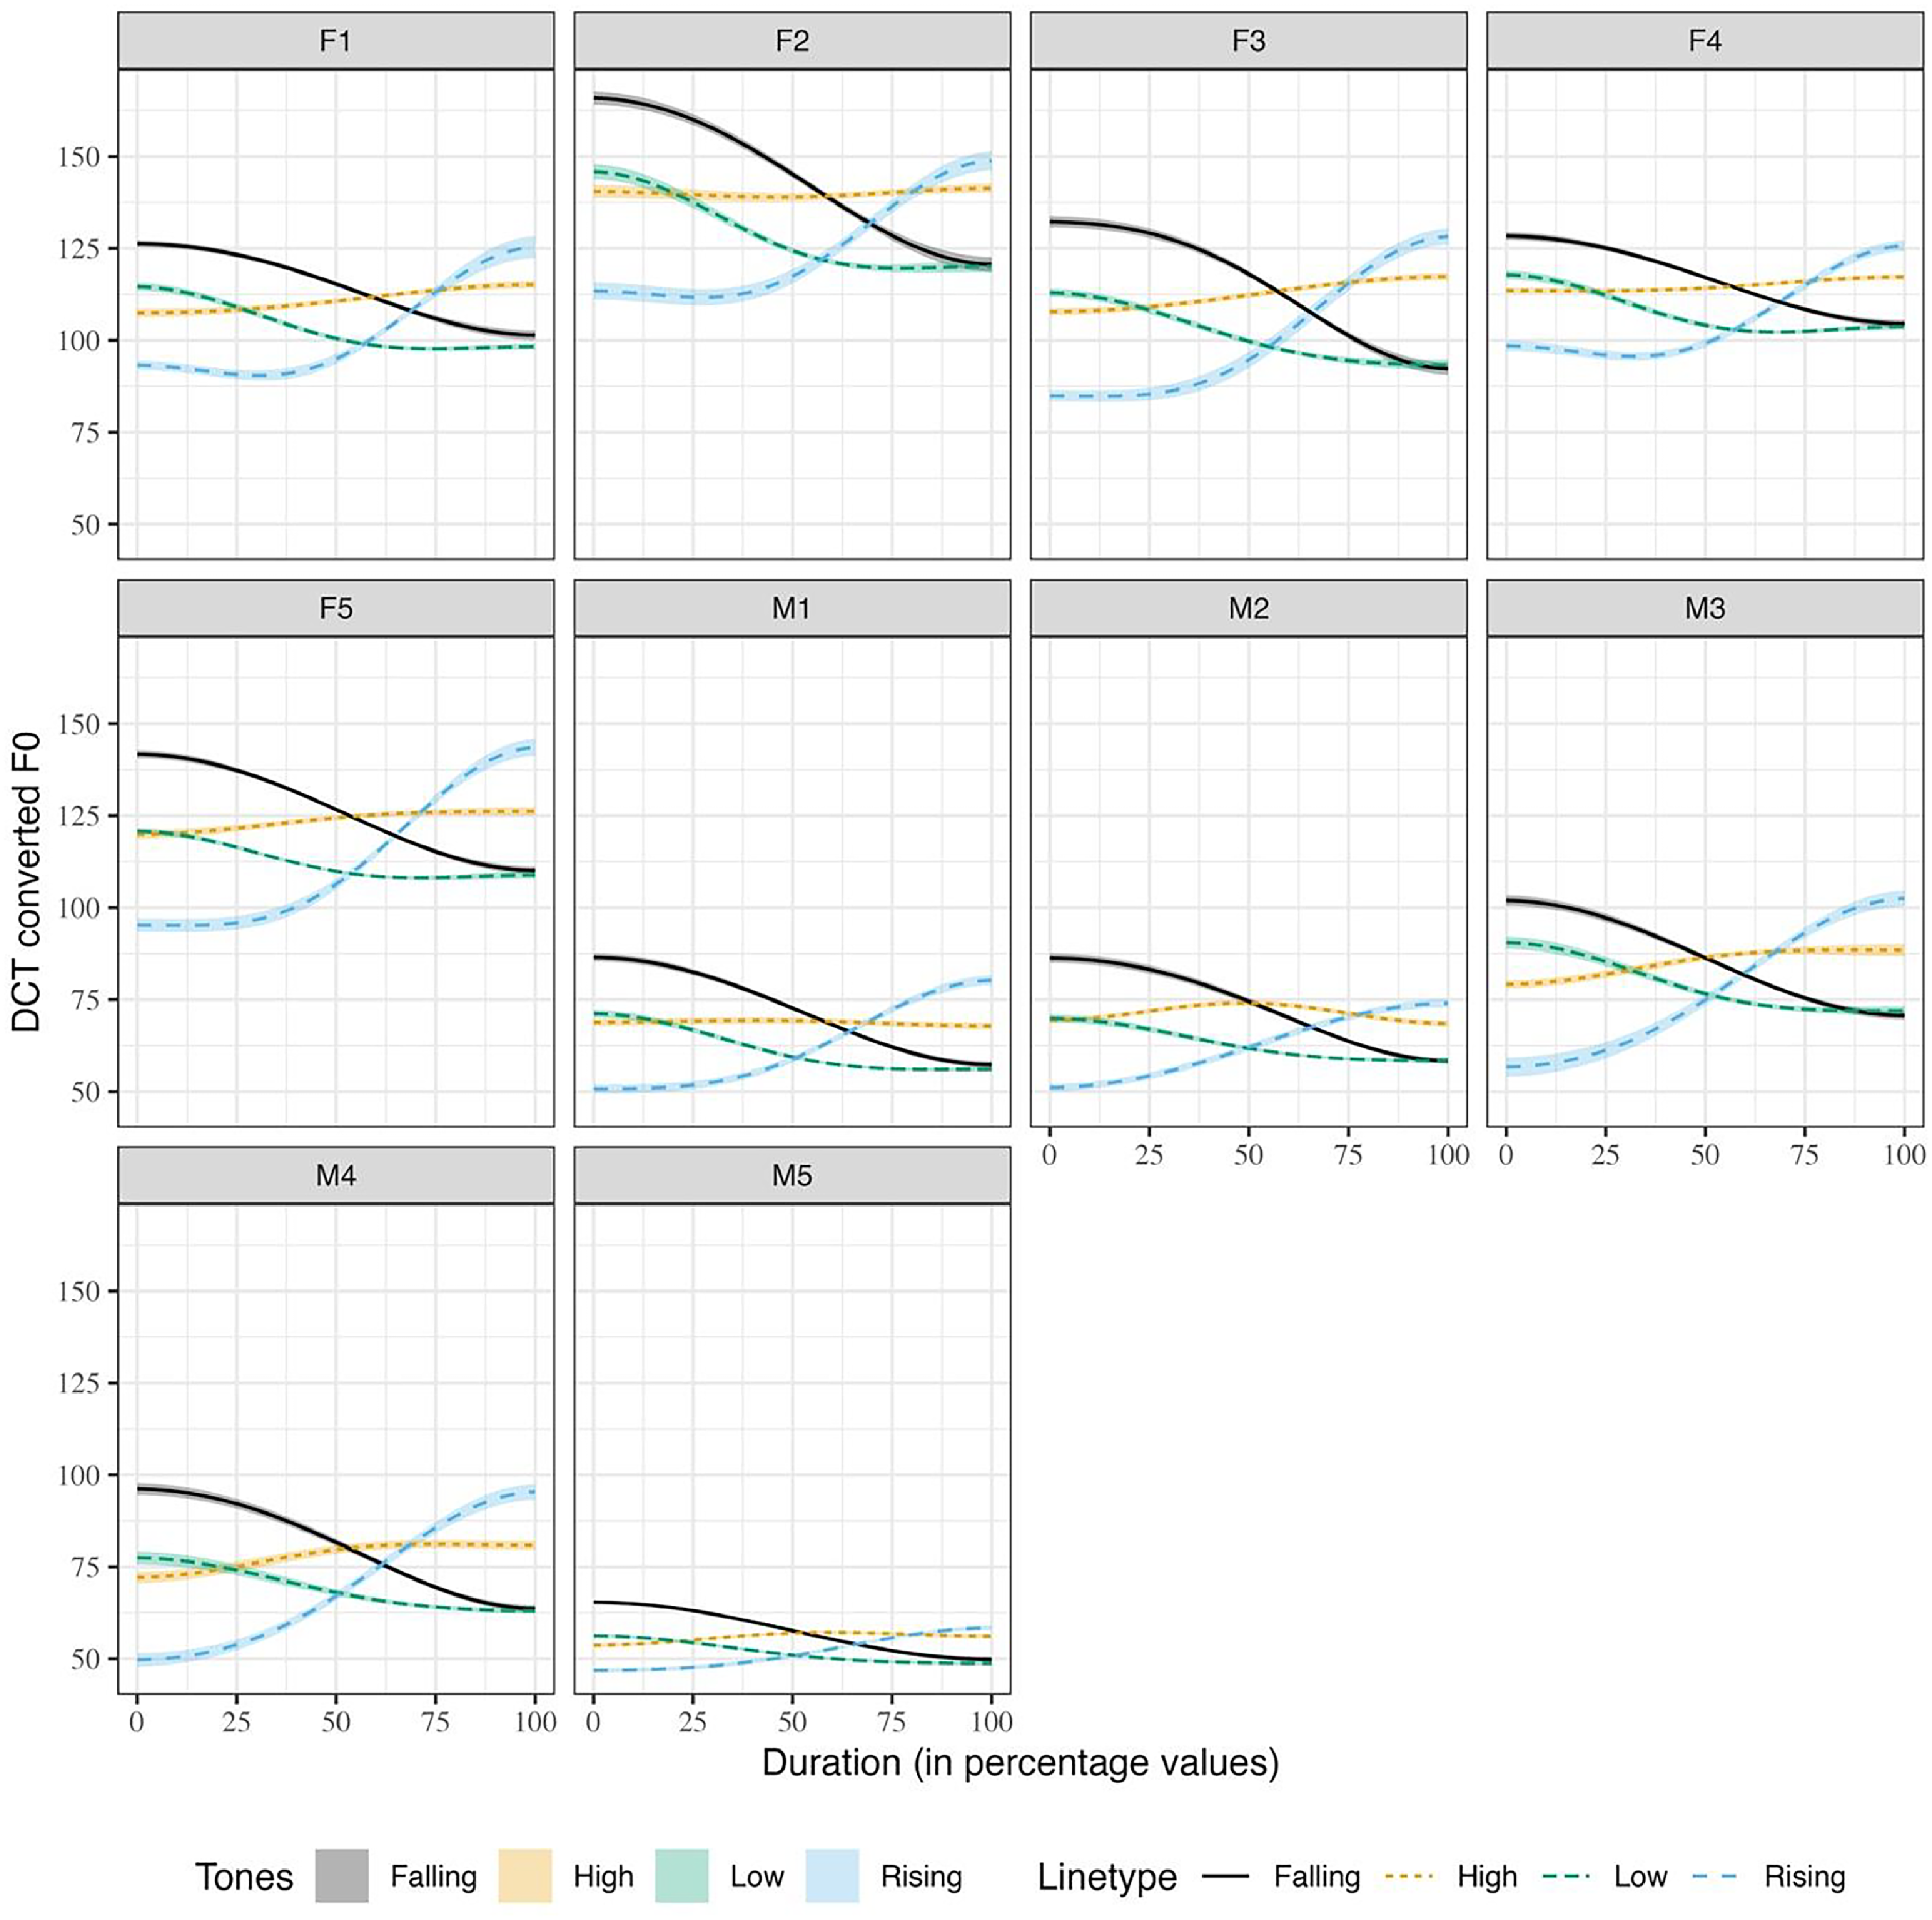
Figure 11 Long description
The image contains multiple line graphs showing tone F0 contours produced in isolation and reconstructed using DCT coefficients. The graphs are organized in a grid with each subplot representing data from different speakers labeled as F1, F2, F3, F4, F5, M1, M2, M3, M4, and M5. The x-axis represents duration in percentage values ranging from 0 to 100, while the y-axis represents DCT converted F0 values ranging from 50 to 150. Each subplot contains three lines representing falling, high, and rising tones, distinguished by different line types: solid for falling, dashed for high, and dotted for rising. The colors used are black for falling, yellow for high, green for low, and blue for rising tones. The graphs illustrate the variation in F0 contours across different speakers and tone types. All values are approximated.
Figure 11 shows the tones produced in isolation by all 10 speakers in this study. As seen from the figure, the female speakers and a couple of male speakers (M3 and M4) have more precise parabolic falling-rising f0 contour for the rising tones produced in isolation. As discussed in the previous paragraphs on the QDA classification, we conclude that C0 and C1 can capture tone-specific differences convincingly and gender differences do not have any significant effect on C0 and C1. On the other hand, the C2 values, as we discussed above, represent finer phonetic details of the tone contour and hence, can capture gender-specific tone contour differences.
To see the contrasts between each pair of tones in terms of the three coefficients, we subjected the models to post-hoc Bonferroni tests. The results of the test for contrasts are provided in Table 9. Table 9 shows that in terms of C0, the falling and the rising tones are not significantly different. This is expected, considering C0 is the average f0 of the falling and the rising pitch contour of the tones. In the case of C1, all the tones in Mizo are significantly different from each other as the contour of each tone is distinct. In terms of C2, the falling and the high tones are not distinct; however, all the other tone pairs are different. Considering this, it can be summarized that in the case of Mizo, the C1 coefficients are the best estimators of tones. This also corroborates the results seen in the QDA classification test in Table 7.
Comparison of Mizo tones in terms of three DCT coefficients
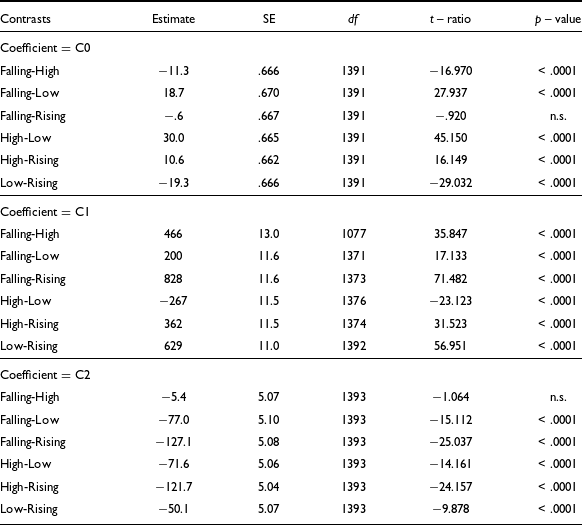
Table 9 Long description
A table comparing Mizo tones in terms of three DCT coefficients. The table has 12 rows and 6 columns. The columns are labeled Contrasts, Estimate, SE, df, t-ratio, and p-value. The rows are grouped by Coefficient with three groups: C0, C1, and C2. Each group compares different tone pairs: Falling-High, Falling-Low, Falling-Rising, High-Low, High-Rising, and Low-Rising. For Coefficient C0, the Falling and Rising tones are not significantly different. For Coefficient C1, all tones are significantly different. For Coefficient C2, the Falling and High tones are not distinct, but all other tone pairs are different. The table provides detailed statistical values for each comparison.
The four Mizo tones represented in Chaos five-point tone scale number
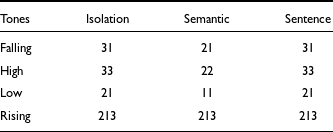
Table 10 Long description
The table presents data on the four Mizo tones—Falling, High, Low, and Rising—across three contexts: Isolation, Semantic, and Sentence. It consists of four rows and four columns. The columns are labeled Tones, Isolation, Semantic, and Sentence. Each row lists a tone and its corresponding values in the three contexts. The Falling tone has values 31, 21, and 31. The High tone has values 33, 22, and 33. The Low tone has values 21, 11, and 21. The Rising tone has values 213, 213, and 213. The table highlights the differences in the representation of each tone across different contexts.
The f0 contours of four Mizo tones in isolation plotted with Chaos tone numerals.
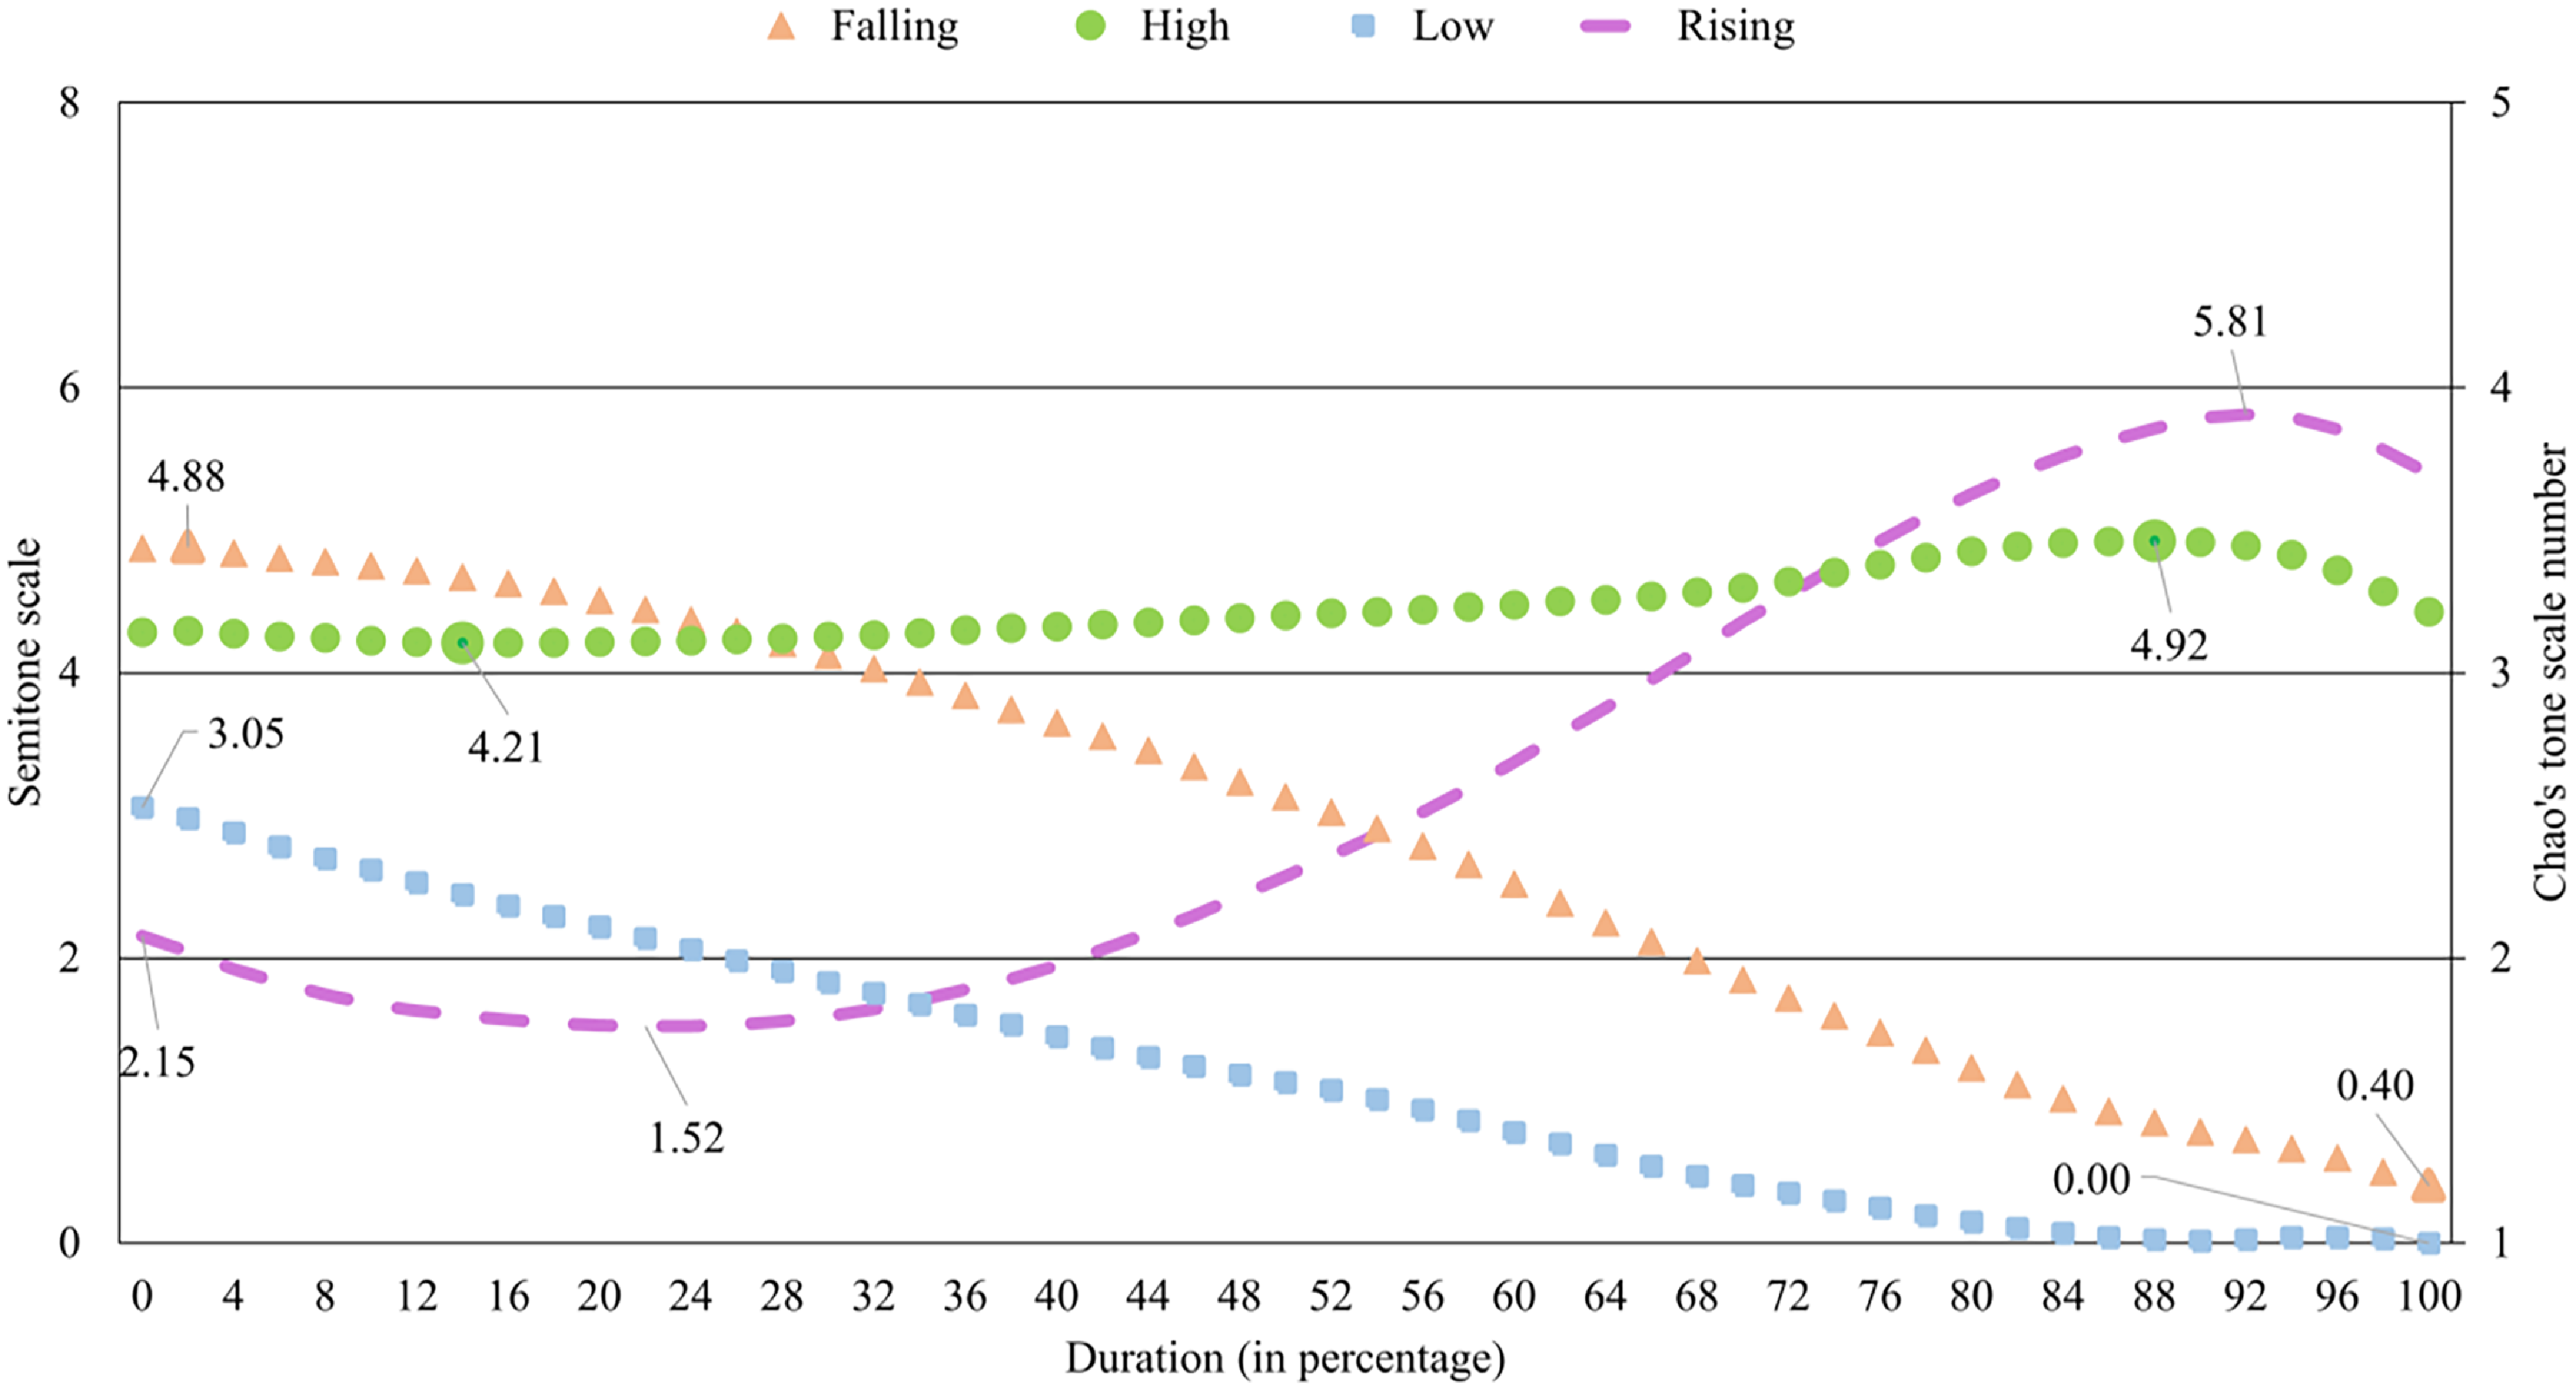
Figure 12 Long description
A line graph displays the f0 contours of four Mizo tones in isolation plotted with Chao's tone numerals. The x-axis represents the duration in percentage, ranging from 0 to 100. The y-axis on the left represents the semitone scale, ranging from 0 to 8, while the y-axis on the right represents Chao's tone scale number, ranging from 1 to 5. The graph includes four data series: Falling, High, Low, and Rising tones, each represented by different symbols. The Falling tone starts at a semitone scale of approximately 4.88 and gradually decreases to 0.40. The High tone remains relatively stable around a semitone scale of 4.92. The Low tone starts at a semitone scale of approximately 3.05 and gradually decreases to 0.00. The Rising tone starts at a semitone scale of approximately 2.15 and increases to 5.81. All values are approximated.
4.4 Mizo tones in Chao tone numerals
To provide a better representation of tones in Mizo and to help readers to compare the Mizo tones with East Asian tone languages, in this section, we convert the four Mizo tones to the first version of Chaos five-point tone numerals following the method obtained from Fon & Chiang (Reference Fon and Chiang1999). The data considered in this experiment is the same data set as the three contexts used for the rest of the paper, namely, isolation, semantic, and sentence contexts. The calculation is based on the TBU in Mizo, the vowel, and the following sonorant sound. The method for this conversion is summarized in Equation (1). In Equation (1), T is Chao tone numeral, and f i is fundamental frequency in Hertz at the i th point of the pitch contour of a given tone. The i th point should be the points with the lowest and highest fundamental frequencies for each tone category. For the rising tone in Mizo, considering its dipping-rising pattern, f0 values are obtained at three points, namely the initial point, the lowest point in the dip and the highest point, as seen in Figure 12. The lowest fundamental frequency across all tone categories is represented as f min . Once the values are plugged into Equation (1), the decimal parts of the result are ignored, and the integer values are considered the Chao tone letter. Table 10 shows the representation of the four Mizo tones of three contexts in Chaos five-point scale. Figure 12 demonstrates the semitone scales calculated using the numerator portion of Equation (1) for the Mizo tones in isolation. Note that to derive the Chao letters, the semitone scales must be further divided by 2 and then added to 1. For example, the highest point of the falling tone in Figure 12, i.e., 4.88, is reduced to 3.44.
 \begin{equation}T = \frac{{39.86 \times \left( {\log {f_i} - \log {f_{min}}} \right)}}{2}+1\end{equation}
Table 10 shows a slight variation in the Chao tone numerals for the three contexts. It is worth mentioning that while the conversion equation provides Chao letters for Mizo high tones as 33, considering the marked high pitch production of the high tones in Mizo, the appropriate Chao letters for the tones should be at least 44. While the Chao tone numeral values obtained for the tones produced in sentence context and isolation agree, the values obtained for the semantic context are slightly lower. Nevertheless, it is seen that only three tonal levels are sufficient to represent the four Mizo lexical tones, irrespective of the context. The context-specific difference observed in Mizo is not unusual, as a similar phenomenon is also observed in Mandarin Chinese as reported in Fon & Chiang (Reference Fon and Chiang1999). Fon & Chiang (Reference Fon and Chiang1999) showed that Taiwanese Mandarin tones, 44 in word-final position and 42 in word-initial position, may become tones 33 and 43, respectively. The Mizo tone-specific pitch contours for the semantic and the sentence contexts are provided in Figure B4 and Figure B5 of Appendix B, respectively. The overall pitch contours of the four tones are captured by the Chao tone numerals extracted from the raw f0 values.
5. Discussion and conclusion
In the current study, we report four contrasting tones in Mizo, concurring with most of the previous studies (Chhangte Reference Chhangte1993, Fanai Reference Fanai1992, Sarmah & Wiltshire Reference Sarmah and Wiltshire2010b). The current work attempts to provide a clear understanding of the acoustic correlations of the tones in Mizo. As far as tone contours are concerned, we noticed that the high tone is the only level tone in Mizo, which can be represented as 33, in terms of the Chao tone numerals. The rising tone in Mizo has a falling-rising f0 pattern that is represented in terms of the Chao numerals as 213. The f0 contour of the rising tone has a gradual dip until about 25% of the total duration. Then it rises, making its termination point highest among the four tones in Mizo. We noticed that the female speakers produce the rising tones with a more pronounced dip of the f0 contour in isolation. While we are unsure about the reason behind this, it seems likely the female speakers tend to produce rising tones more distinctively than the male speakers in careful speech.
The f0 contours of the falling and the low tones are similar in their direction, both with a falling contour and terminating almost at the same point. However, they begin at two distinct f0 levels; the falling tones begin with a much higher f0 and then fall until the endpoint. On the other hand, the falling contour of the low tone is gradual in comparison to the falling tone. The low and the falling tones are represented as 21 and 31, respectively, in terms of the Chao tone numerals. However, it is to be noted that, despite having contour tones with 21 and 31 contours, Mizo has only one high-level tone (33), and there are no level tones with 11 and 22 levels. According to Pike (Reference Pike1948), the absence of level tones for the levels involved in contour tones indicates that the contour tones of the language may not be composed of levels. However, to claim so for the Mizo tones, we require further evidence from the Mizo phonology. Considering three of the four Mizo tones are contour tones, the slope of the f0 contour can characterize the Mizo tones distinctively. Hence, in the case of the DCT coefficients, the second coefficient, C1, which captures the slope of the tone, can classify the four Mizo tones with considerable accuracy. The first three DCT coefficients, namely, C0, C1 and C2 can classify the Mizo tones with an average accuracy of 86.41%. An error analysis of the classification data showed that most of the errors occur due to the wrong classification of the falling tone as a low tone and vice-versa. This confusion between the falling and the low tone is primarily due to the falling f0 contour feature shared by both tones. The classification accuracy improved marginally with the addition of the duration feature. While no tone-specific durational differences were observed, adding tone duration improved the tone classification accuracy to 87.12%.
In this study, we have also made an additional observation. We noticed that the flattening of the rising tone contour in /thaŋ/ is due to the contextual effect of the neighboring tones. Our assumption is that the rising tone preceding /thaŋ/ with a rising tone triggers the change in the rising contour of /thaŋ/. Similarly, in case of /vai/ with a rising tone meaning all, the f0 contour is higher than in canonical forms when it is preceded by another TBU with a rising tone. However, the increased f0 in /vai/ meaning all is possibly due to some speakers producing the word with stress for focus. The interaction of focus and tone in Mizo is yet to be investigated and is not within the scope of the current study. In future, we also intend to conduct a more detailed study of tonal coarticulation in Mizo. This study reported an acoustic analysis of the tones in Mizo. As acoustic analysis of tones in Tibeto-Burman languages from South Asia is less reported, this work attempts to fill the void. We hope the results of this study will contribute to a better understanding of tonal phonology and phonetics of Mizo and of the Kuki-Chin languages.
Appendix A
Words and sentences recorded from Mizo speakers
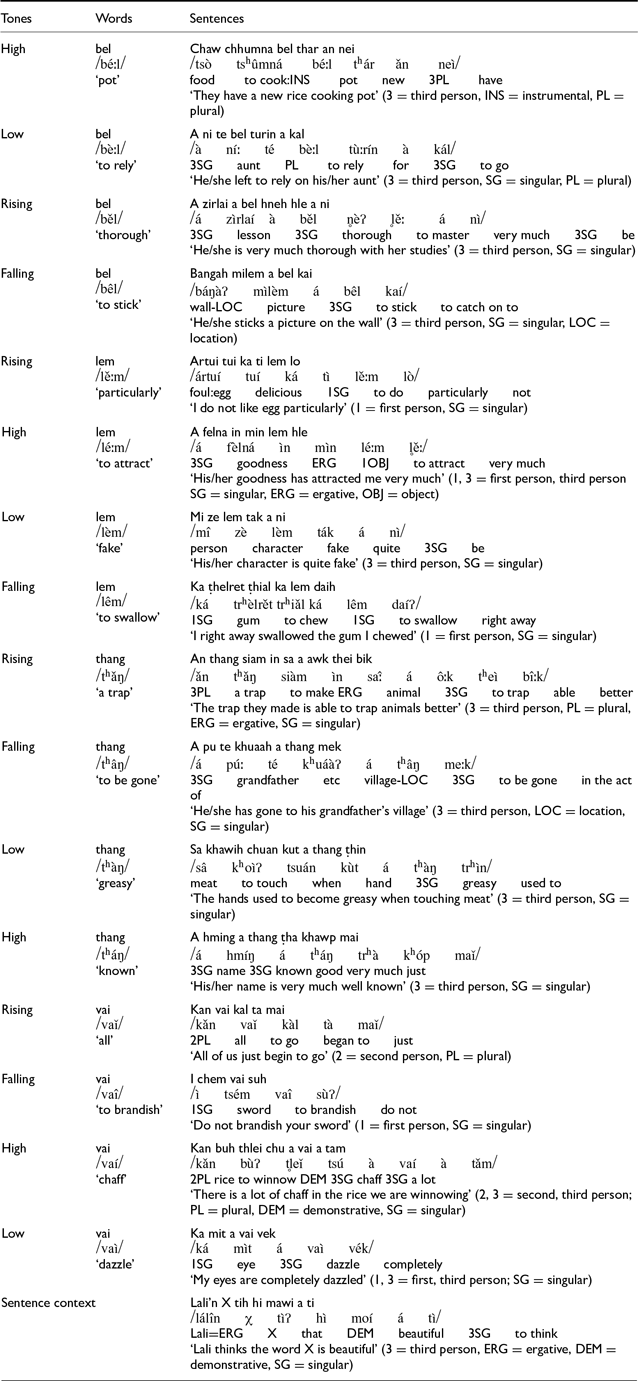
Table A1 Long description
A table comparing Mizo tonal minimal and near minimal sets, focusing on words and sentences. The table has four columns labeled Tones, Words, Sentences, and includes rows with specific tonal categories such as High, Low, Rising, and Falling. Each row lists a word, its tone category, and a corresponding sentence in Mizo. The table details how different tones affect the meaning of words in Mizo, with examples like 'pot' and 'to rely on' under the High tone category, and 'to stick' and 'thorough' under the Falling tone category. The sentences provide context for how these words are used in isolation and within phrases.
Appendix B
Wald χ 2 tests on duration model excluding the tokens with long vowels. Asterisk indicates, p < .001
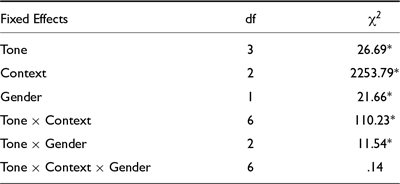
Table B1 Long description
The table presents the results of a comparison of tone duration in short vowels, with statistical significance indicated by an asterisk and non-significance by n.s. The table has four rows and seven columns. The columns are labeled as Contrast, Isolation, Semantic, and Sentence, with sub-columns for Falling, High, Low, and Rising. The rows detail the comparisons between different tone contrasts. Notable trends include high tones being significantly longer than other tones in isolation, rising tones being significantly shorter than high and low tones in semantic contexts, and no significant differences in tone duration when produced in sentence frames. The table provides a concise summary of the statistical analysis, highlighting the variability in tone duration across different contexts.
Comparison of tone duration excluding the tokens with long vowels.
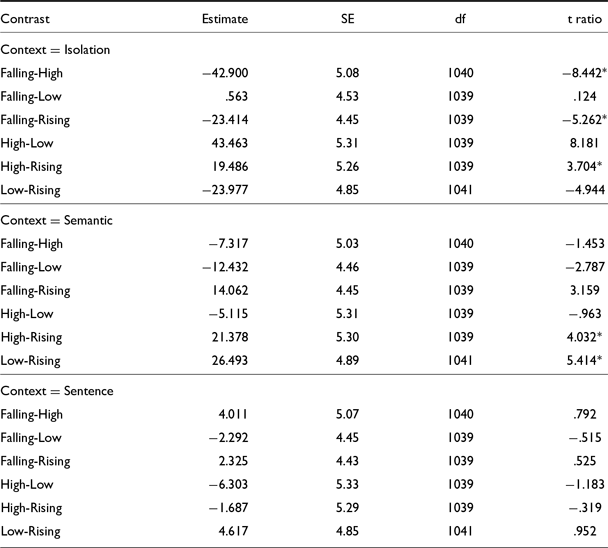
Table B2 Long description
The table presents a comparison of tone duration excluding tokens with long vowels, focusing on three contexts: Isolation, Semantic, and Sentence. It consists of three main sections, each detailing the contrast between different tone types (Falling-High, Falling-Low, Falling-Rising, High-Low, High-Rising, Low-Rising) and their statistical significance. The table has three columns labeled Contrast, Estimate, SE, df, and t ratio, and multiple rows providing specific data for each context. In the Isolation context, high tones are significantly longer than other tones. In the Semantic context, rising tones are significantly shorter than high and low tones. In the Sentence context, tones do not exhibit significant differences in duration. Statistical significance is indicated by an asterisk, while non-significance is marked as n.s.
Mean and standard error of the raw f0 contours of four Mizo tones in semantic context, plotted speaker-wise.
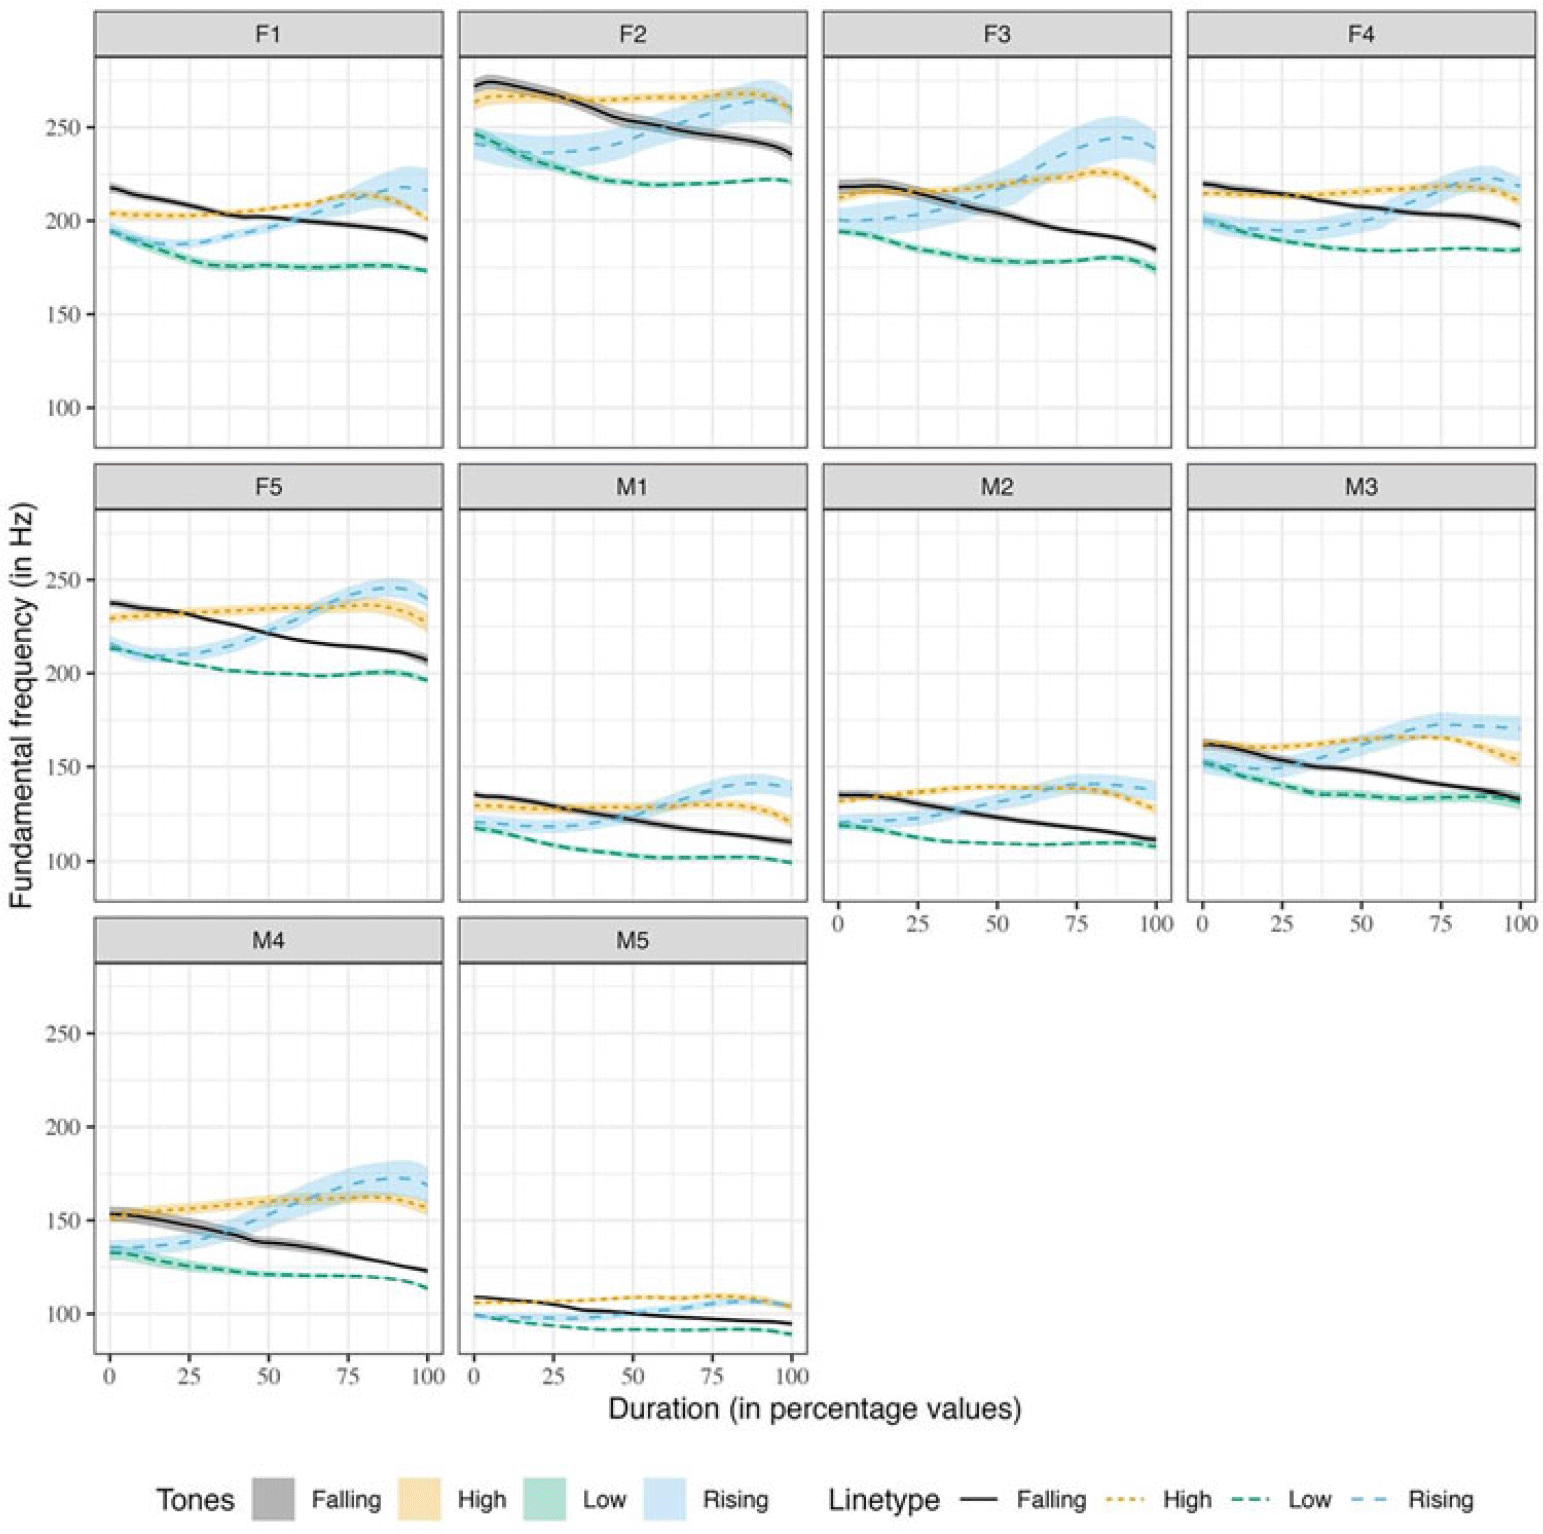
Figure B1 Long description
The image contains ten line graphs, each representing a different speaker, showing the mean and standard error of the raw f0 contours of four Mizo tones in semantic context. The x-axis represents the duration in percentage values, ranging from 0 to 100, while the y-axis represents the fundamental frequency in Hertz, ranging from 100 to 250. Each graph includes four lines, each corresponding to a different tone: falling, high, low, and rising. The lines are color-coded: black for falling, yellow for high, green for low, and blue for rising. The graphs illustrate how the fundamental frequency varies over time for each tone across different speakers. The trends show distinct patterns for each tone, with some speakers exhibiting more pronounced variations than others. The standard error is represented by shaded areas around each line, indicating the variability in the data. All values are approximated.
Mean and standard error of the raw f0 contours of four Mizo tones in sentence context, plotted speaker-wise.
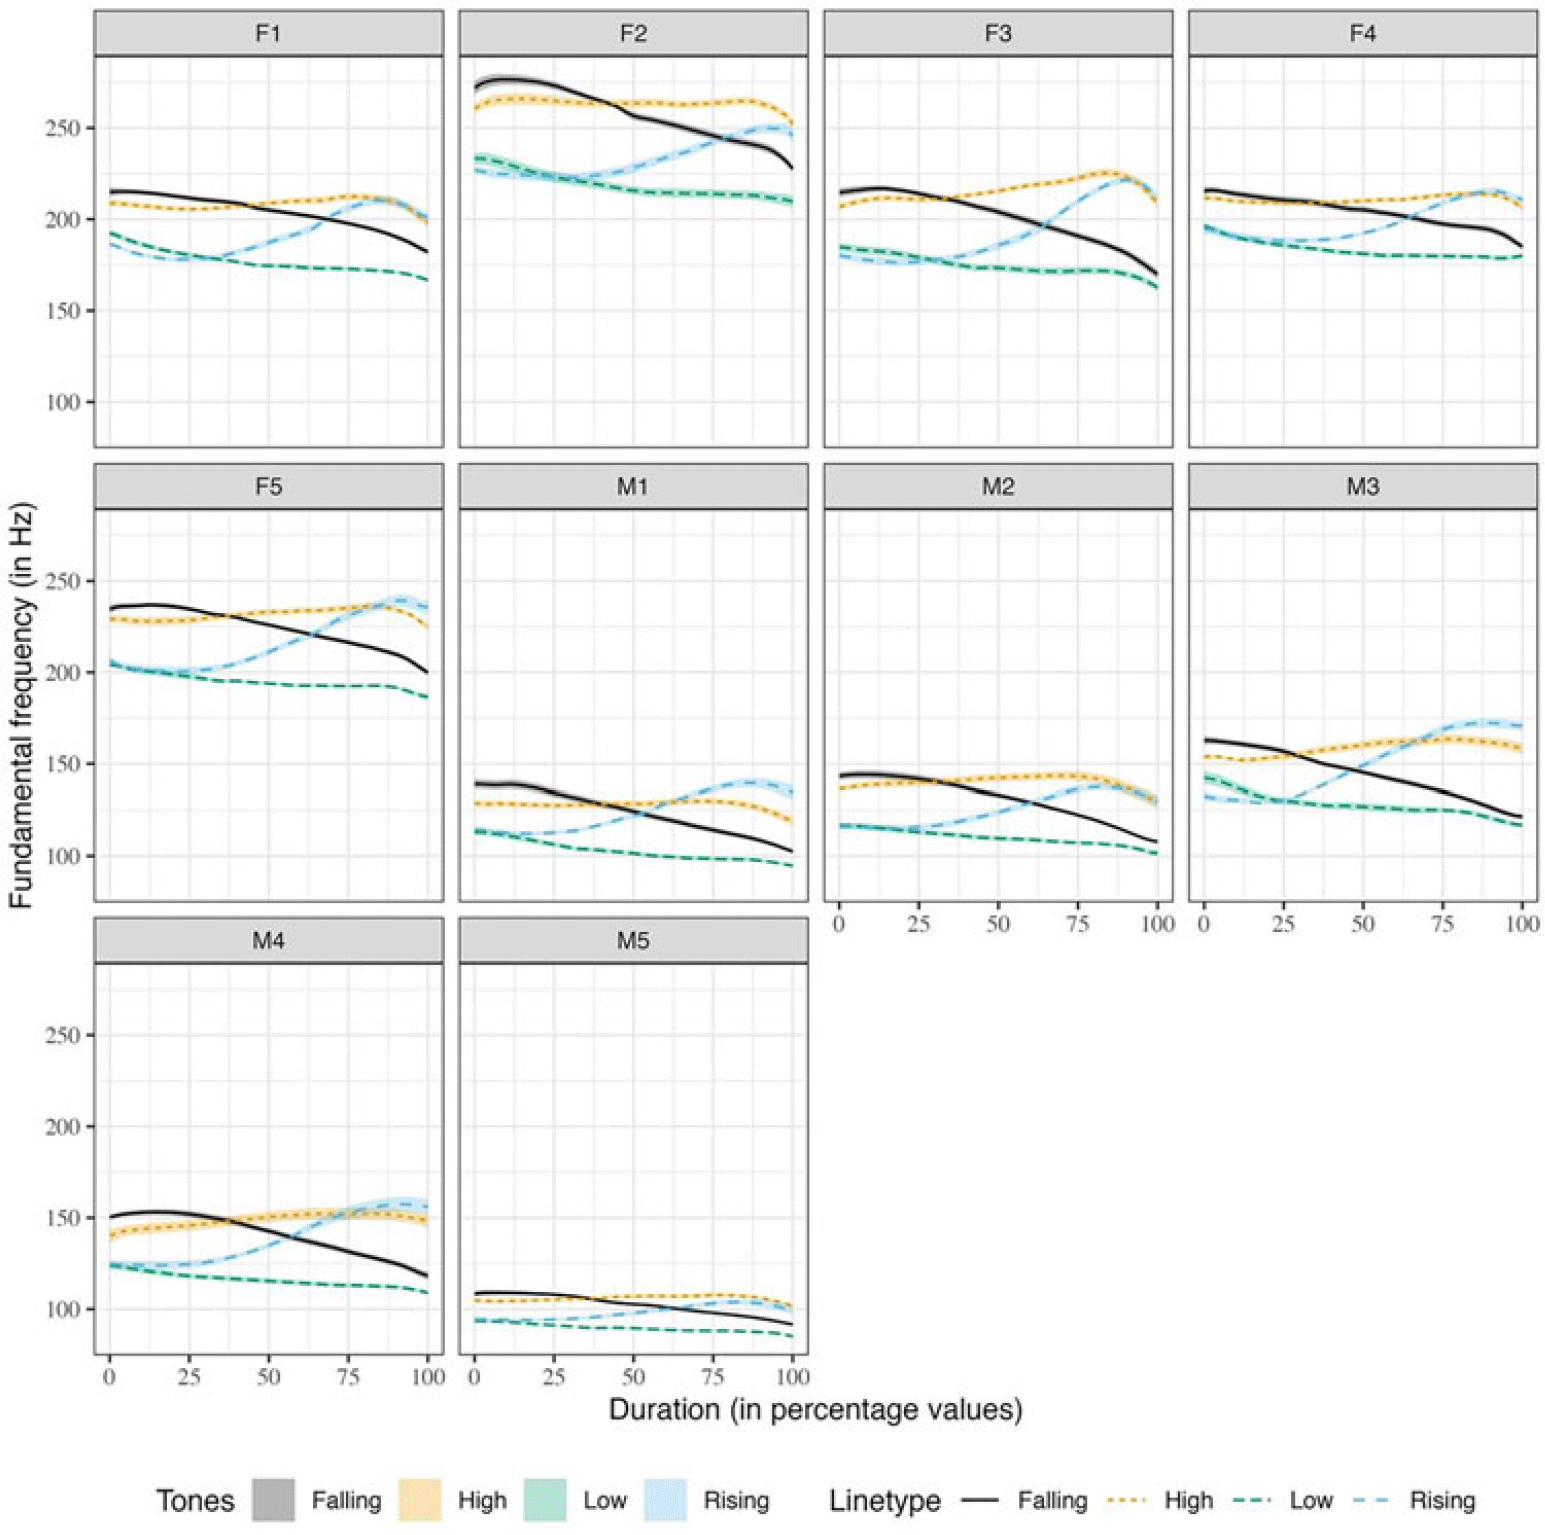
Figure B2 Long description
The image contains ten line graphs arranged in a grid, each representing a different speaker labeled as F1, F2, F3, F4, F5, M1, M2, M3, M4, and M5. The x-axis represents duration in percentage values, while the y-axis represents fundamental frequency in Hertz. Each graph shows four lines corresponding to falling, high, low, and rising tones, distinguished by different colors and line types. The falling tone is represented by a solid black line, the high tone by a dashed yellow line, the low tone by a dashed blue line, and the rising tone by a dashed light blue line. The graphs illustrate the variation in fundamental frequency over time for each tone type across different speakers. All values are approximated.
Duration of Mizo tones in all three contexts.
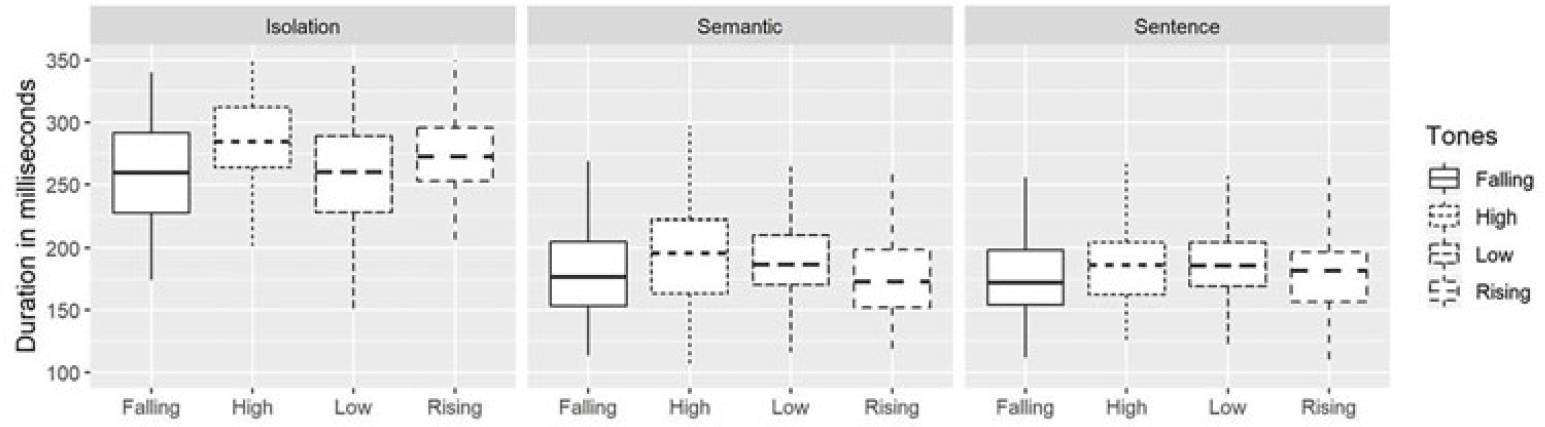
Figure B3 Long description
The box-and-whisker plot displays the duration of Mizo tones in three contexts: isolation, semantic, and sentence. The x-axis represents the tone types: falling, high, low, and rising. The y-axis represents the duration in milliseconds, ranging from 100 to 350 milliseconds. Each context has four box plots corresponding to the four tone types. In the isolation context, the falling tone has a median duration around 250 milliseconds, with a wider spread compared to other tones. The high tone has a median duration slightly above 250 milliseconds, with a similar spread. The low tone has a median duration around 275 milliseconds, with a slightly narrower spread. The rising tone has a median duration around 275 milliseconds, with a spread similar to the low tone. In the semantic context, the falling tone has a median duration around 200 milliseconds, with a narrower spread. The high tone has a median duration slightly above 200 milliseconds, with a similar spread. The low tone has a median duration around 225 milliseconds, with a slightly wider spread. The rising tone has a median duration around 225 milliseconds, with a spread similar to the low tone. In the sentence context, the falling tone has a median duration around 200 milliseconds, with a narrower spread. The high tone has a median duration slightly above 200 milliseconds, with a similar spread. The low tone has a median duration around 225 milliseconds, with a slightly wider spread. The rising tone has a median duration around 225 milliseconds, with a spread similar to the low tone. The plot includes whiskers indicating the range of data and outliers if present. The legend indicates the tone types with different box styles. All values are approximated.
f0 contours of four Mizo tones in semantic context with Chaos tone numerals.
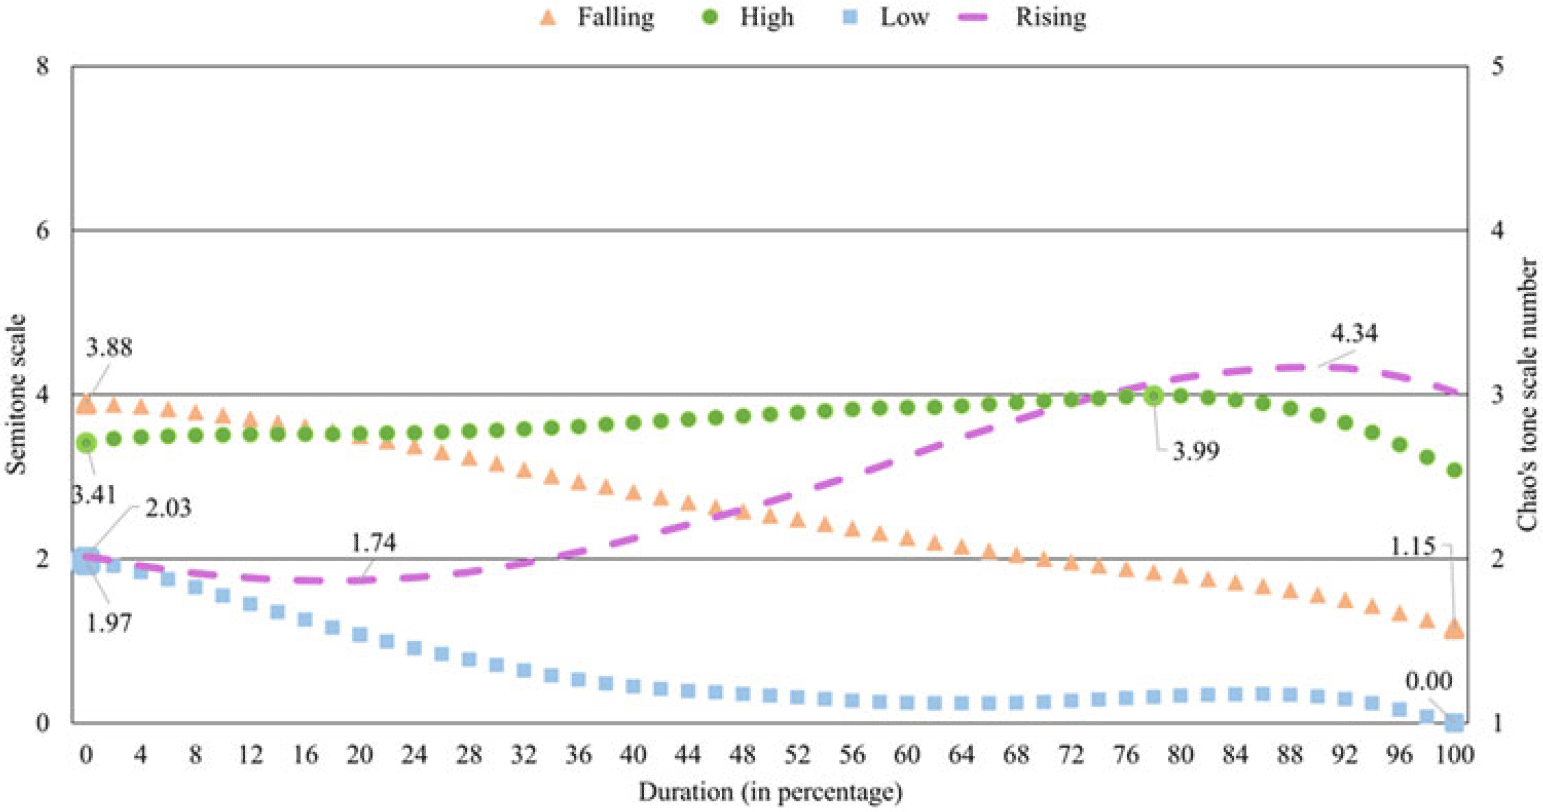
Figure B4 Long description
The line graph displays the contours of four Mizo tones in semantic context, using Chao's tone numerals for reference. The x-axis represents the duration in percentage, ranging from 0 to 100. The y-axis on the left represents the semitone scale, ranging from 0 to 8, while the y-axis on the right represents Chao's tone scale number, ranging from 1 to 5. Four distinct data lines are plotted: falling, high, low, and rising tones. The falling tone starts at a semitone scale of 3.88 and gradually decreases to 1.15. The high tone remains relatively stable around a semitone scale of 4, with a slight increase to 4.34 towards the end. The low tone starts at 1.97 and decreases to 0. The rising tone starts at 2.03, increases to 3.99, and then slightly decreases to 3. All values are approximated.
f0 contours of four Mizo tones in sentence context with Chaos tone numerals.
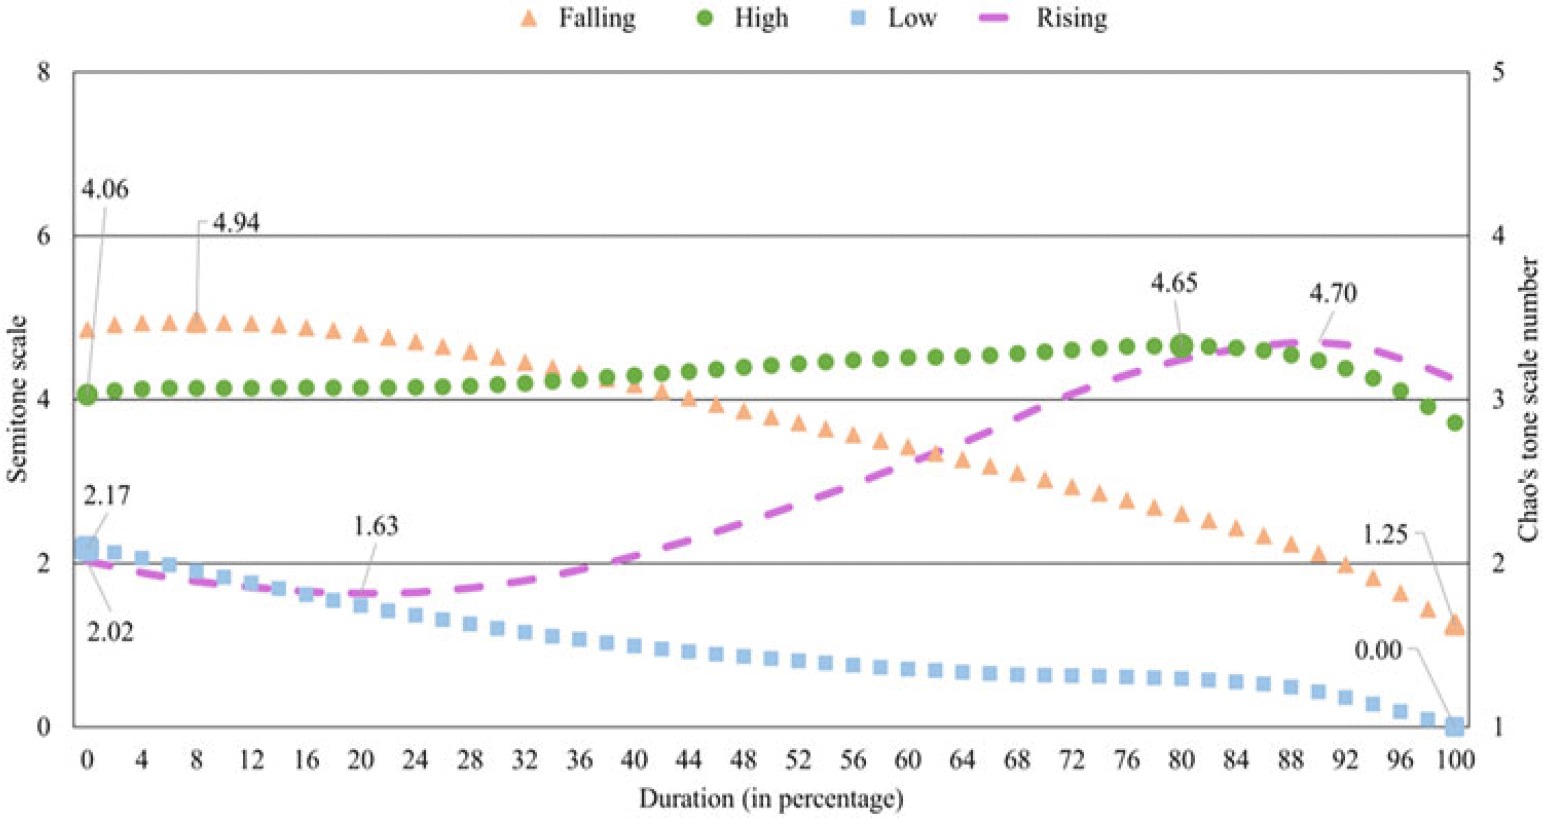
Figure B5 Long description
A line graph displays the f0 contours of four Mizo tones in sentence context with Chao's tone numerals. The x-axis represents the duration in percentage, ranging from 0 to 100. The y-axis on the left represents the semitone scale, ranging from 0 to 8, while the y-axis on the right represents Chao's tone scale number, ranging from 1 to 5. The graph includes four data lines: Falling (orange triangles), High (green circles), Low (blue squares), and Rising (purple dashed line). Key data points include Falling at 4.06 and 4.94, High at 4.65 and 4.70, Low at 2.17 and 1.63, and Rising at 2.02 and 1.25. All values are approximated.
Average raw f0 contours with average duration of the four Mizo tones in all contexts, plotted by gender.
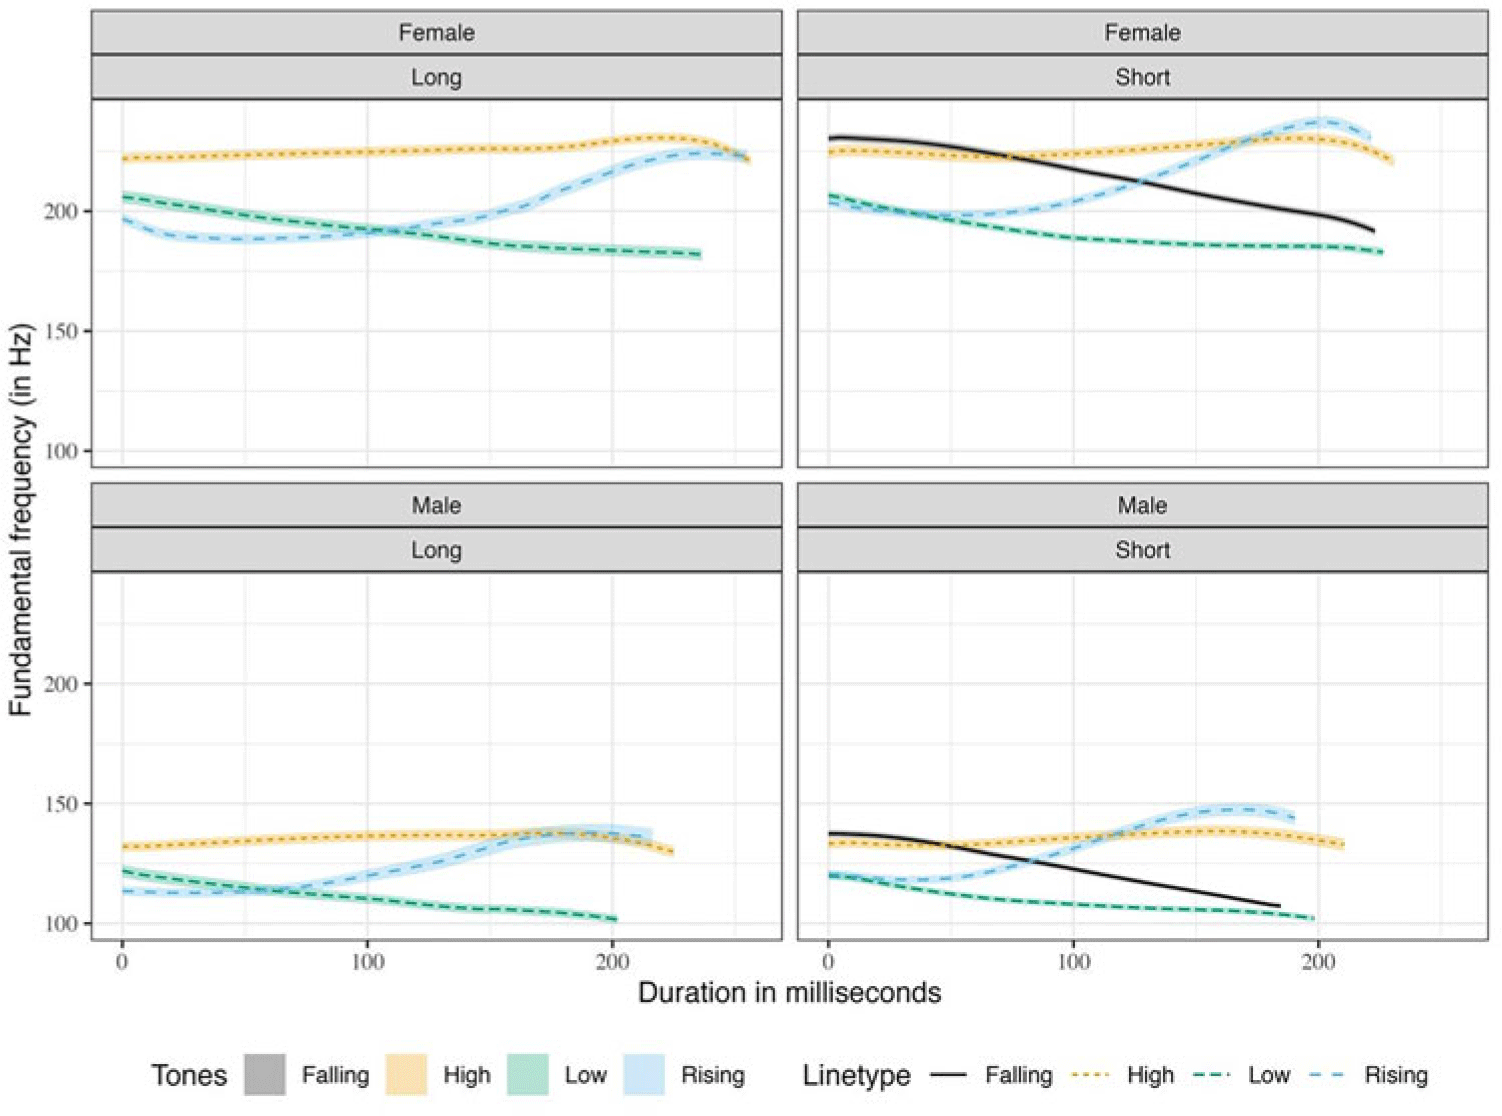
Figure B6 Long description
The image contains four line graphs that illustrate the fundamental frequency in Hertz over time in milliseconds for male and female voices with long and short tones. The graphs are divided into four quadrants: Female Long, Female Short, Male Long, and Male Short. Each graph displays four different tone types: Falling, High, Low, and Rising, represented by distinct line styles and colors. The x-axis represents the duration in milliseconds, ranging from 0 to 200, while the y-axis represents the fundamental frequency in Hertz, ranging from 100 to 200. The lines show how the fundamental frequency changes over time for each tone type. The Female Long graph shows relatively stable frequencies for High and Falling tones, with slight variations for Low and Rising tones. The Female Short graph indicates a decreasing trend for the Falling tone and varying trends for the other tones. The Male Long graph shows a similar pattern to the Female Long graph but with lower overall frequencies. The Male Short graph displays a notable decrease in the Falling tone and varying trends for the other tones. All values are approximated.
Average normalized f0 contours with average duration of Mizo tones in four words in isolation.
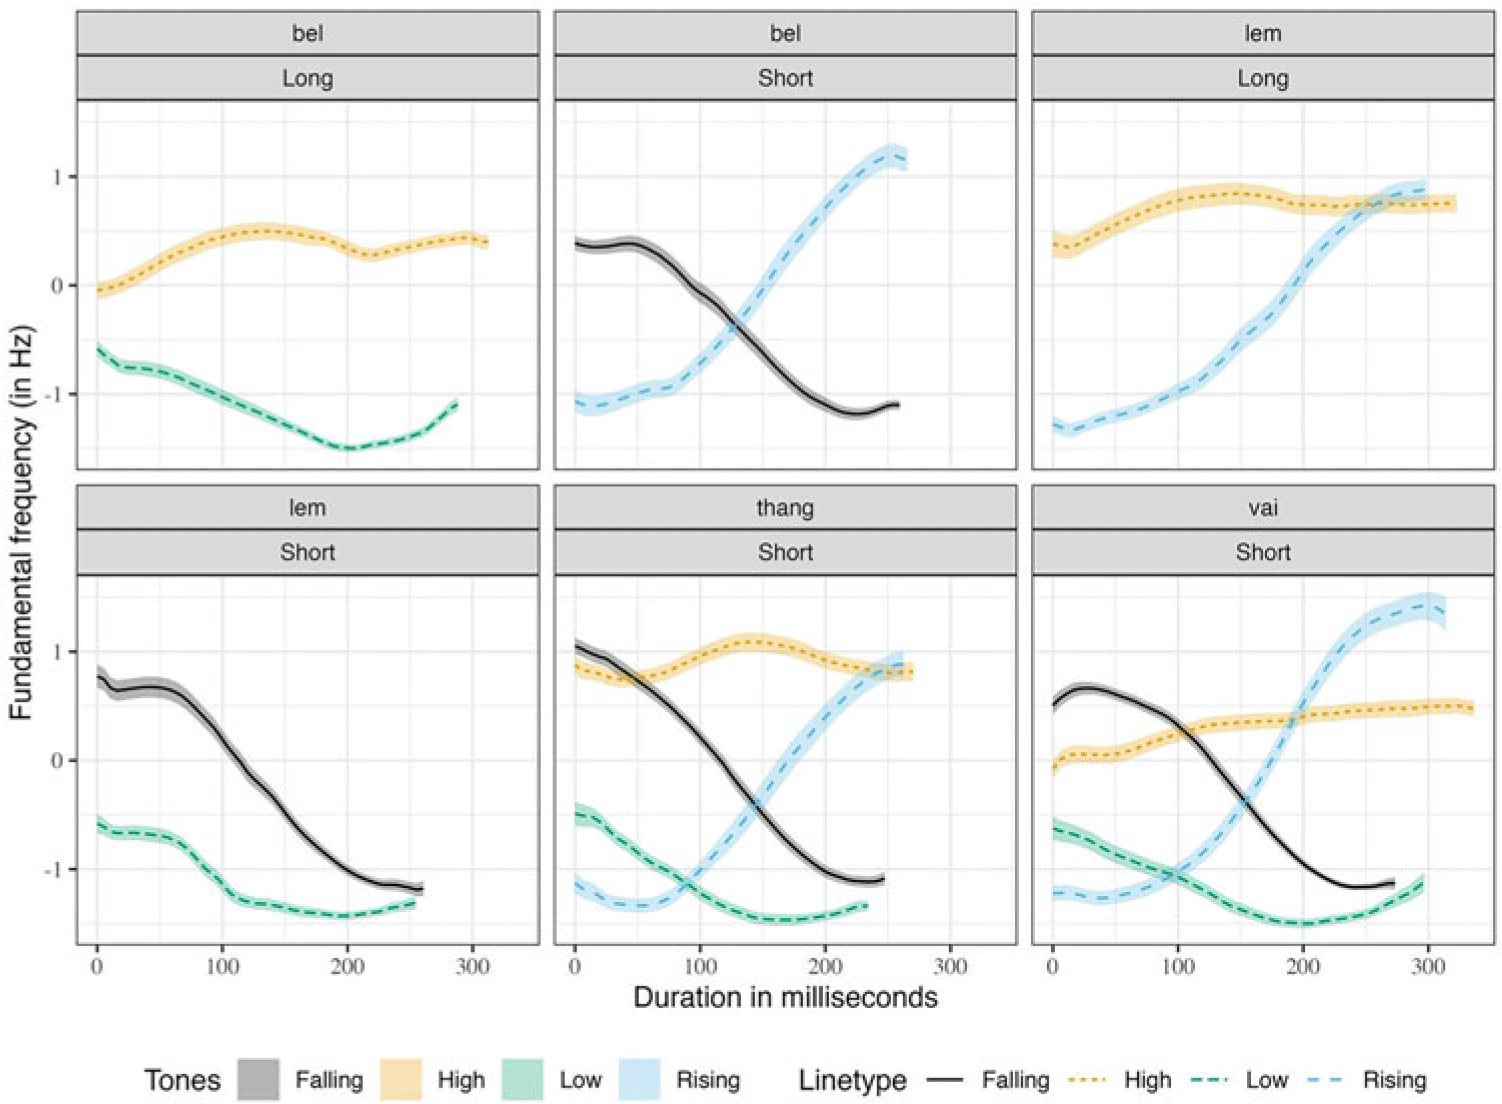
Figure B7 Long description
The image contains six line graphs showing the fundamental frequency contours of Mizo tones in different words and contexts. Each graph represents a different word: bel long, bel short, lem long, lem short, thang short, and vai short. The x-axis represents the duration in milliseconds, ranging from 0 to 300 milliseconds. The y-axis represents the fundamental frequency in Hertz, ranging from -1 to 1. Each graph includes four lines representing different tones: falling, high, low, and rising. The lines are color-coded and use different line types to distinguish between the tones. The graphs show how the fundamental frequency changes over time for each tone in the specified words and contexts. All values are approximated.
Average normalized f0 contours with average duration of Mizo tones in four words in sentences.
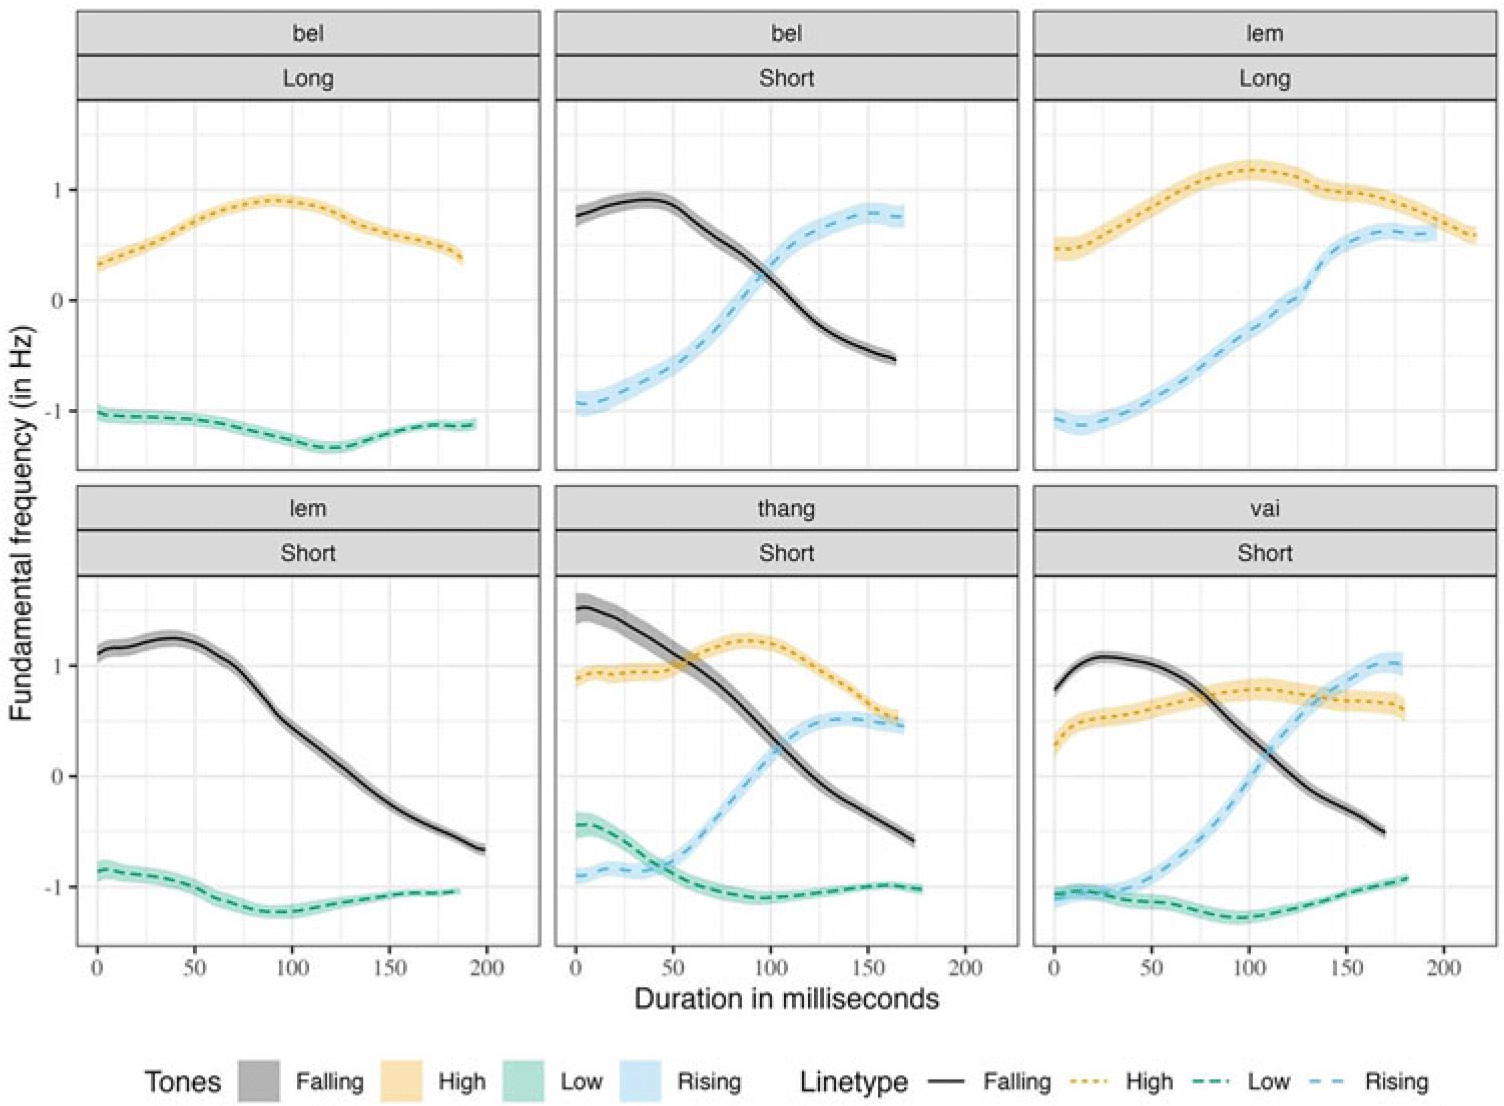
Figure B8 Long description
The image contains six line graphs arranged in a grid, each representing the fundamental frequency in Hertz over a duration of 200 milliseconds for different tones in Mizo words. The graphs are labeled with different words and tone types: bel Long, bel Short, lem Long, lem Short, thang Short, and vai Short. Each graph shows multiple lines representing different tone types: Falling, High, Low, and Rising. The lines are color-coded and styled differently: solid black for Falling, dotted yellow for High, dashed green for Low, and dashed blue for Rising. The x-axis represents the duration in milliseconds, and the y-axis represents the fundamental frequency in Hertz. The graphs illustrate how the fundamental frequency changes over time for each tone type in the specified words. All values are approximated.
Average normalized f0 contours with average duration of Mizo tones in four words in semantic context.
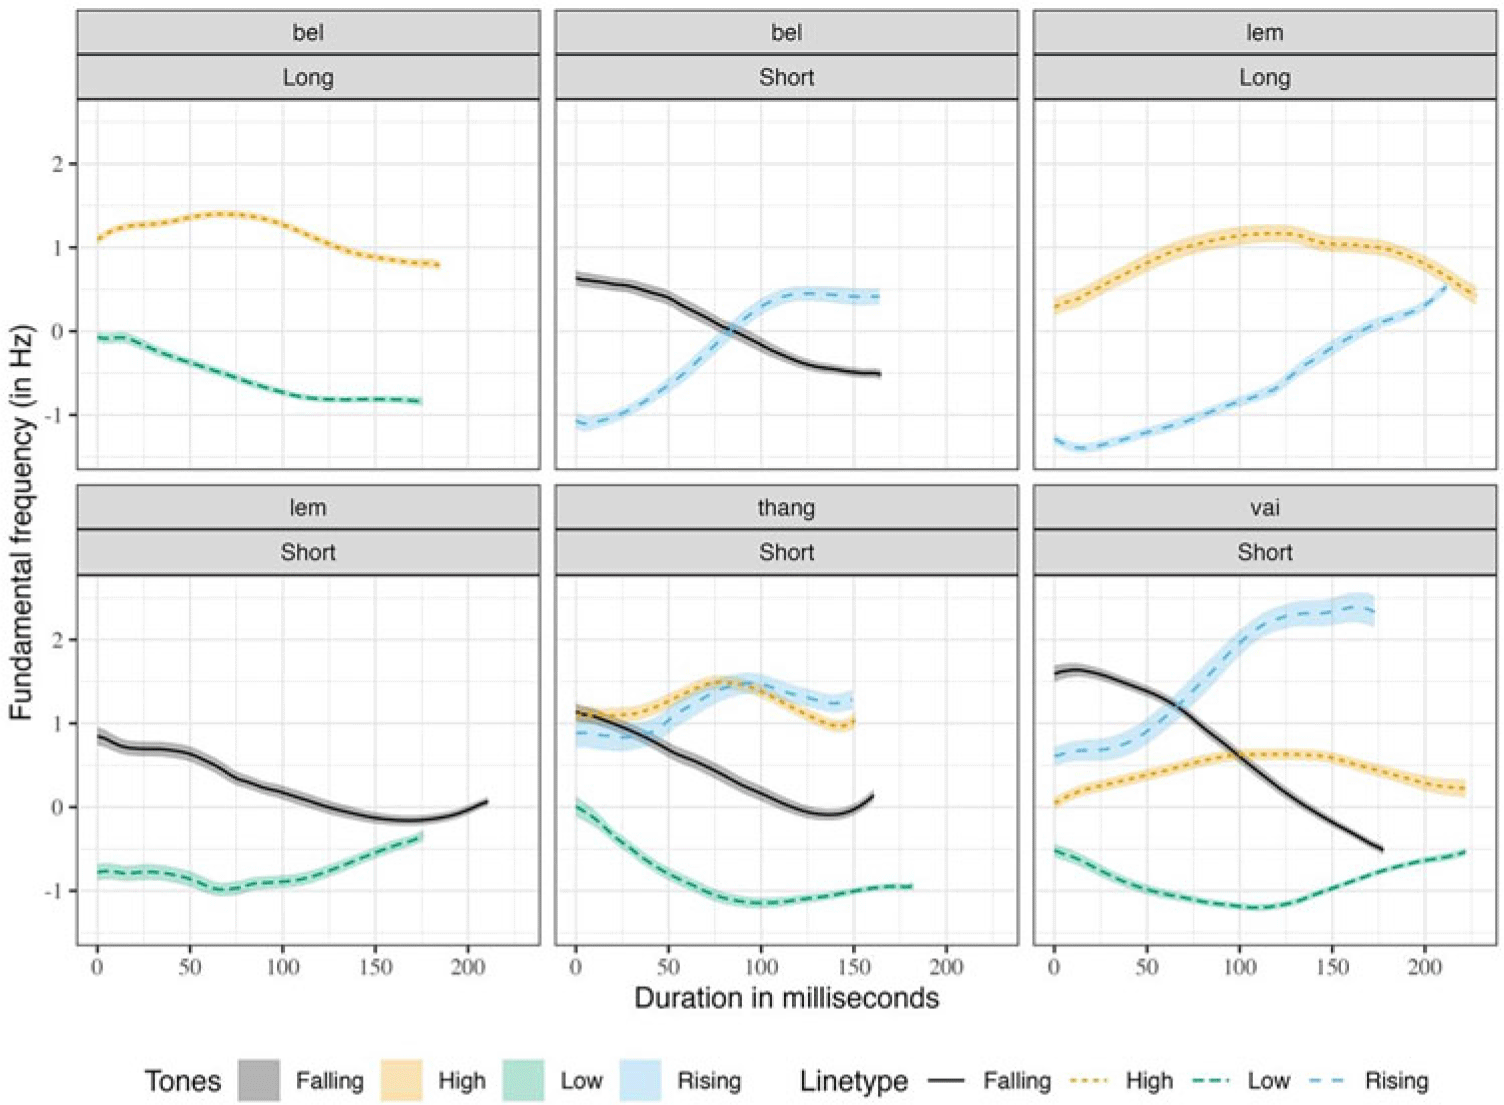
Figure B9 Long description
The image contains six line graphs arranged in a grid, each representing the fundamental frequency contours of Mizo tones over time. The x-axis of each graph indicates duration in milliseconds, while the y-axis shows fundamental frequency in Hertz. The graphs are labeled with different tone types: bel Long, bel Short, lem Long, lem Short, thang Short, and vai Short. Each graph features three lines representing falling, high, low, and rising tones, distinguished by different colors and line styles. The falling tone is depicted with a solid black line, the high tone with a dashed yellow line, the low tone with a dashed green line, and the rising tone with a dashed blue line. The graphs illustrate how the fundamental frequency changes over time for each tone type, with the falling and low tones showing similar downward contours but starting at different frequency levels. The high and rising tones exhibit distinct upward and rising patterns, respectively. The interaction between these tones and their contours provides insights into the phonological characteristics of Mizo tones. All values are approximated.
Mean and standard error of raw f0 contours with average duration of four Mizo tones produced in isolation by female speakers.
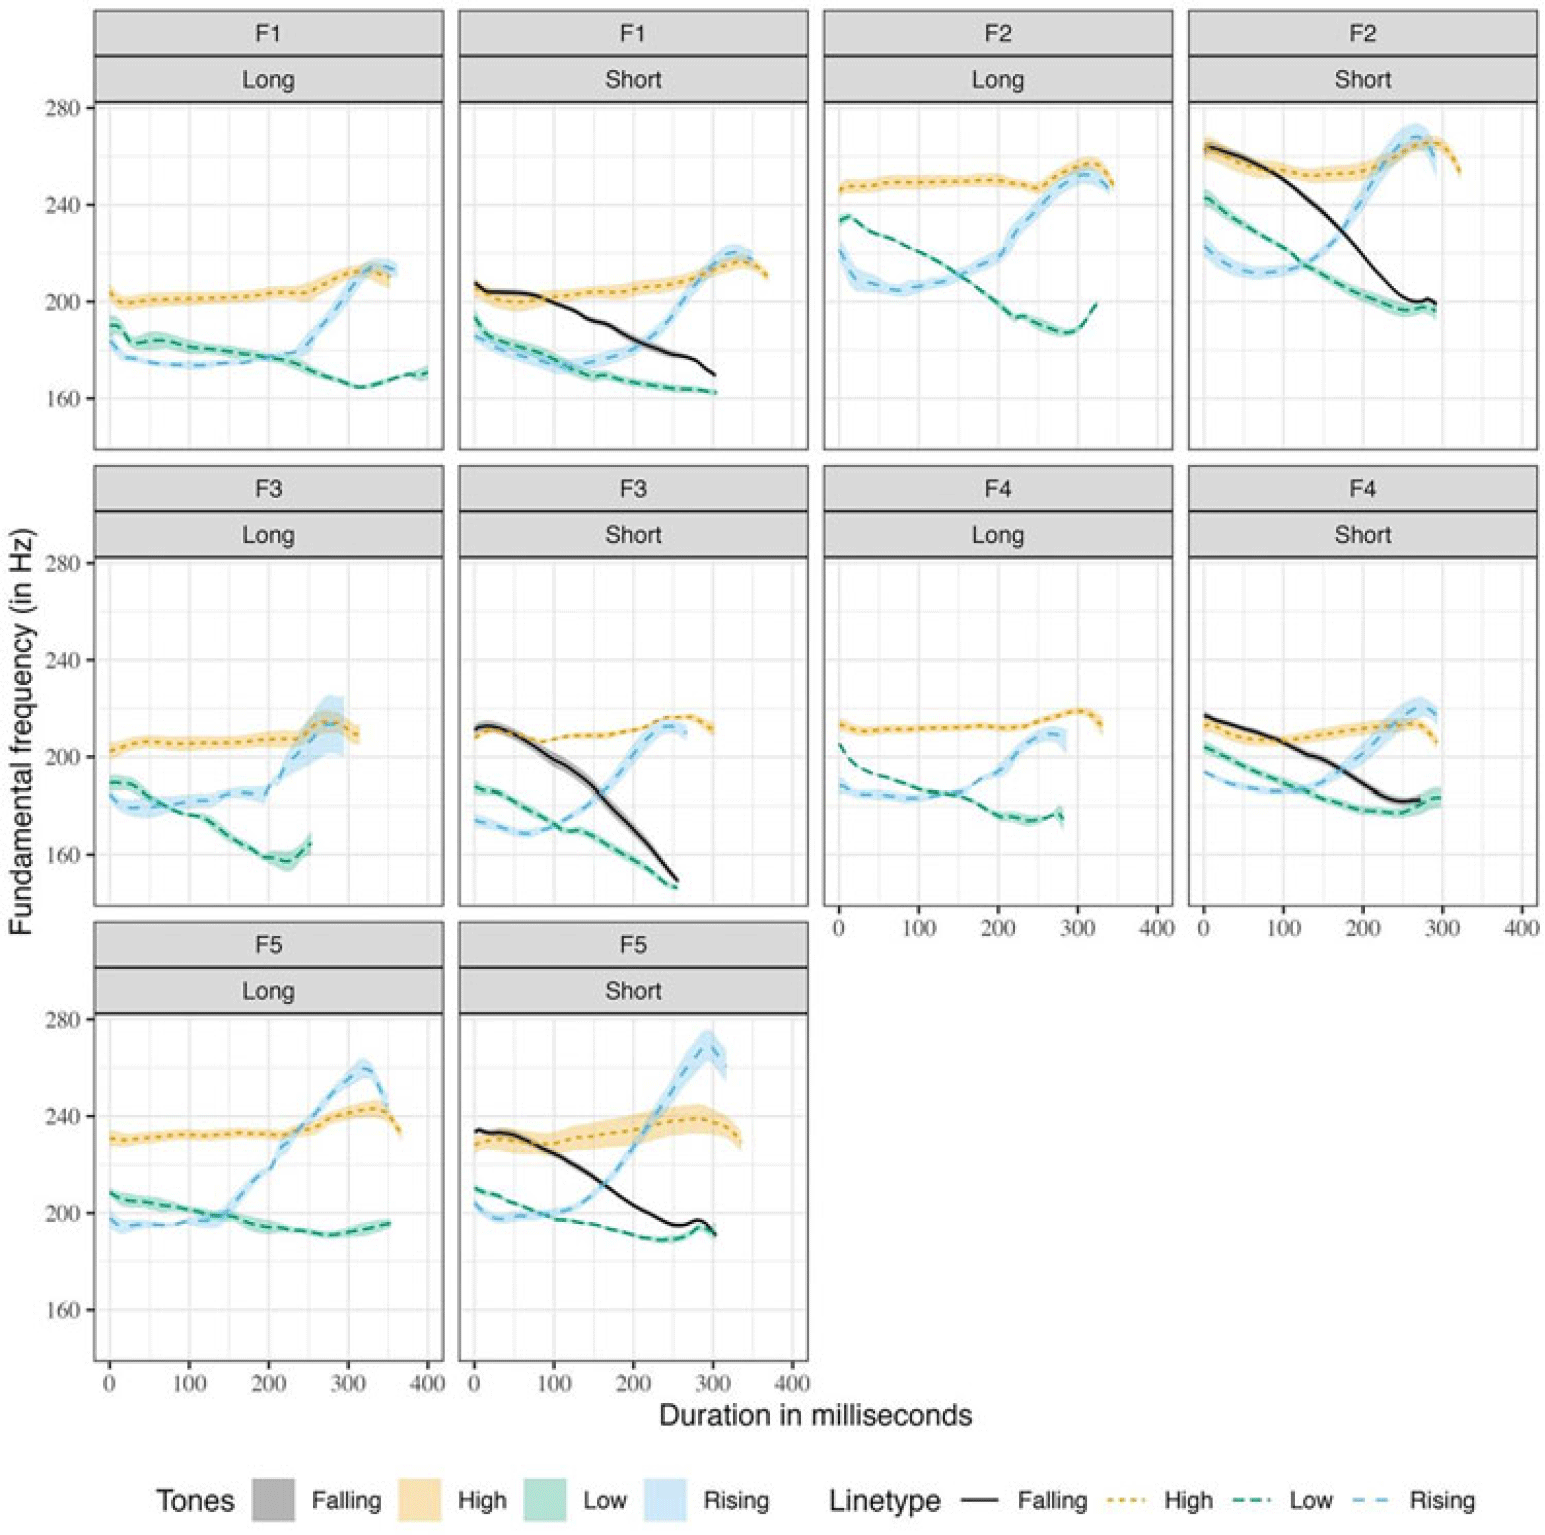
Figure B10 Long description
The image contains twelve line graphs arranged in a grid, each representing the fundamental frequency in Hertz over time in milliseconds for different tones and durations produced by female speakers. The graphs are organized by tone (F1, F2, F3, F4, F5) and duration (Long, Short). Each graph shows lines for falling, high, low, and rising tones, with different colors and line types representing each tone category. The x-axis represents the duration in milliseconds, ranging from 0 to 400, while the y-axis represents the fundamental frequency in Hertz, ranging from 160 to 280. The lines indicate the mean and standard error of the raw f0 contours, showing variations in frequency over time for each tone and duration. The graphs illustrate the differences in fundamental frequency contours for the four Mizo tones produced in isolation by female speakers.
Mean and standard error of raw f0 contours with average duration of four Mizo tones produced in isolation by male speakers.
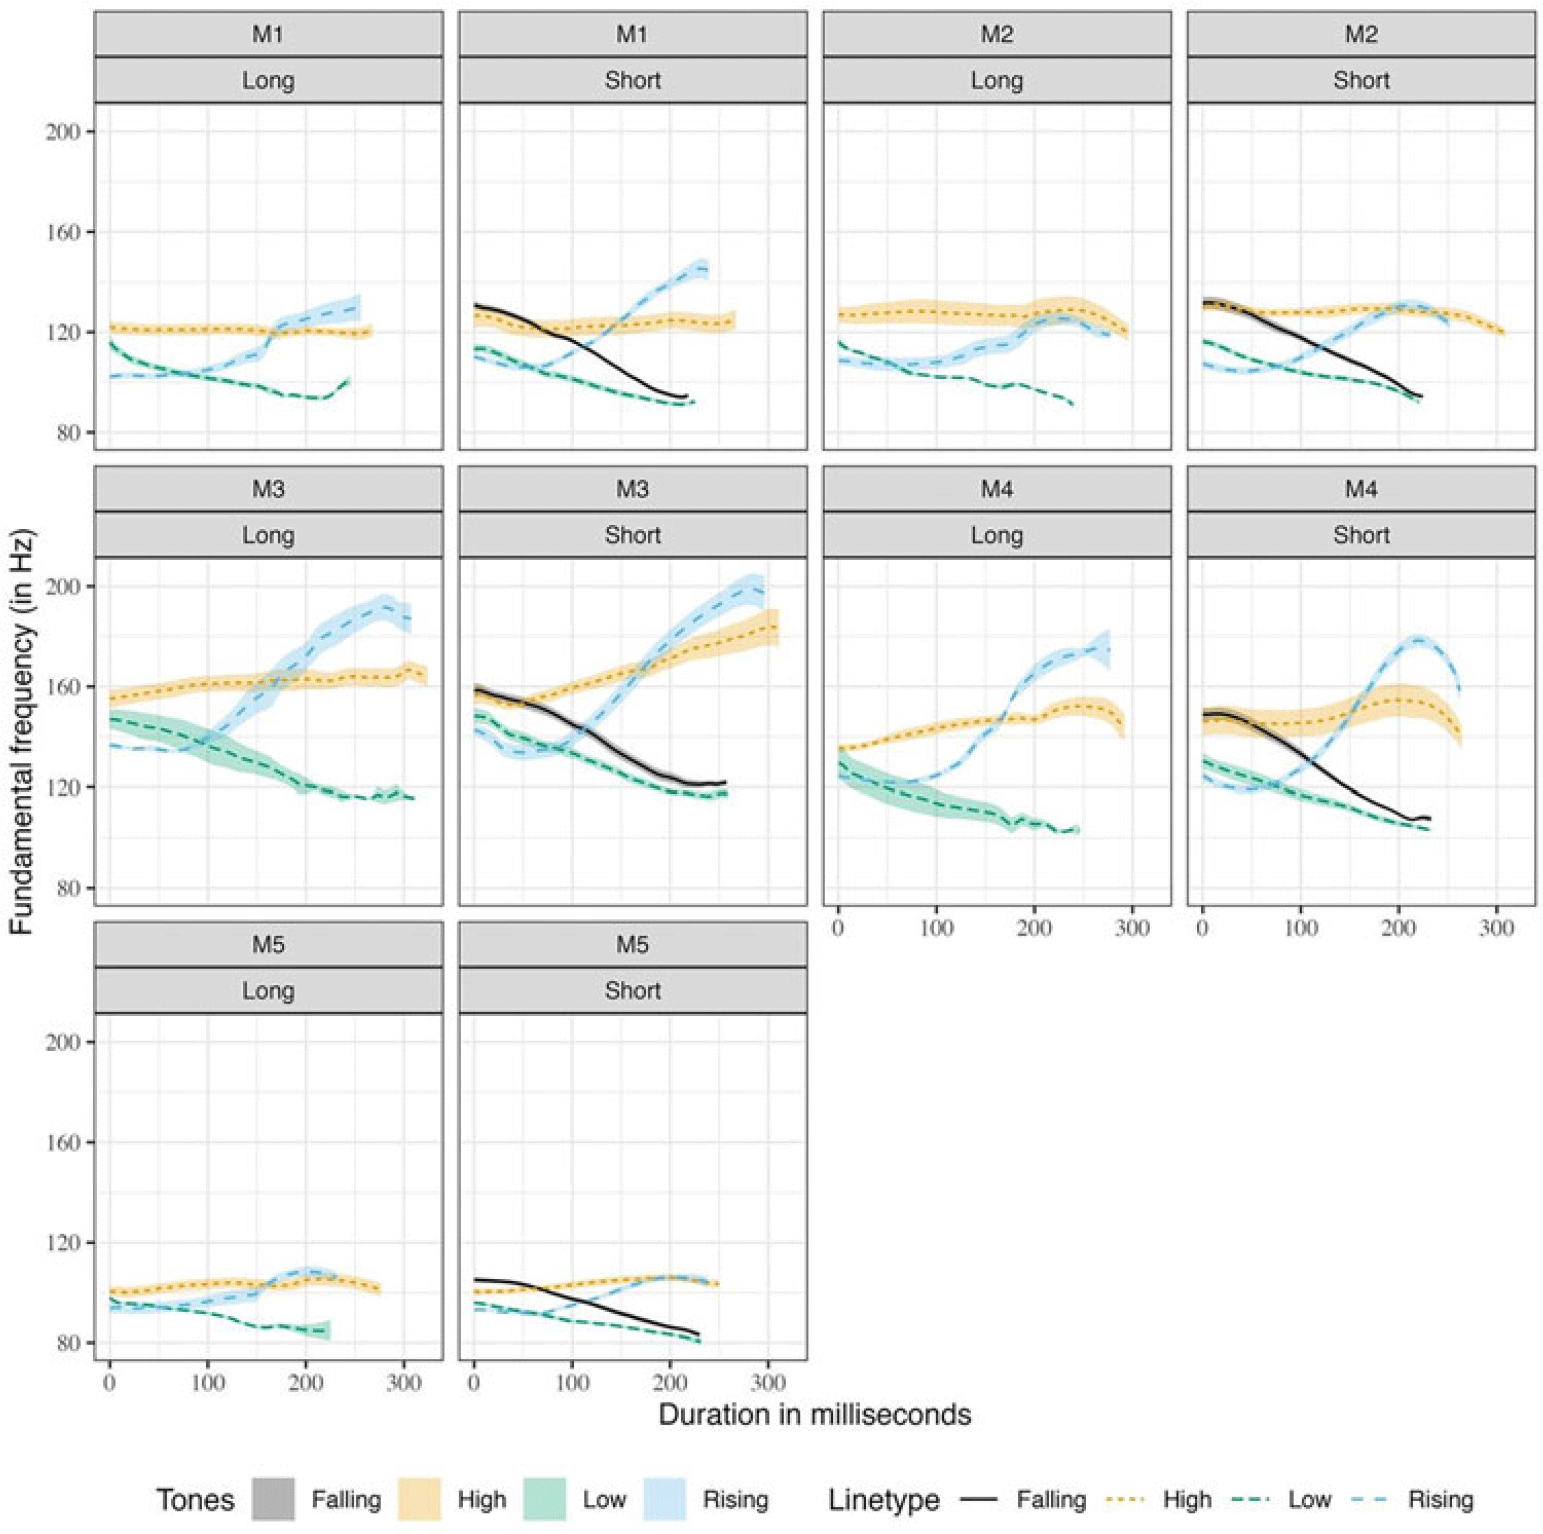
Figure B11 Long description
The image contains twelve line graphs arranged in a grid, each representing the fundamental frequency in Hertz over duration in milliseconds for different tones and conditions. The graphs are grouped by four different conditions labeled as M1, M2, M3, M4, and M5, with each condition further divided into long and short durations. Each graph shows four lines representing different tones: falling, high, low, and rising, with corresponding colors and line types. The x-axis represents duration in milliseconds, ranging from 0 to 300, while the y-axis represents fundamental frequency in Hertz, ranging from 80 to 200. The lines indicate the mean and standard error of raw f0 contours for tones produced in isolation by male speakers. The graphs illustrate how the fundamental frequency varies over time for each tone and condition. All values are approximated.
Reconstructed f0 contours with average duration from DCT coefficients of Mizo tones.
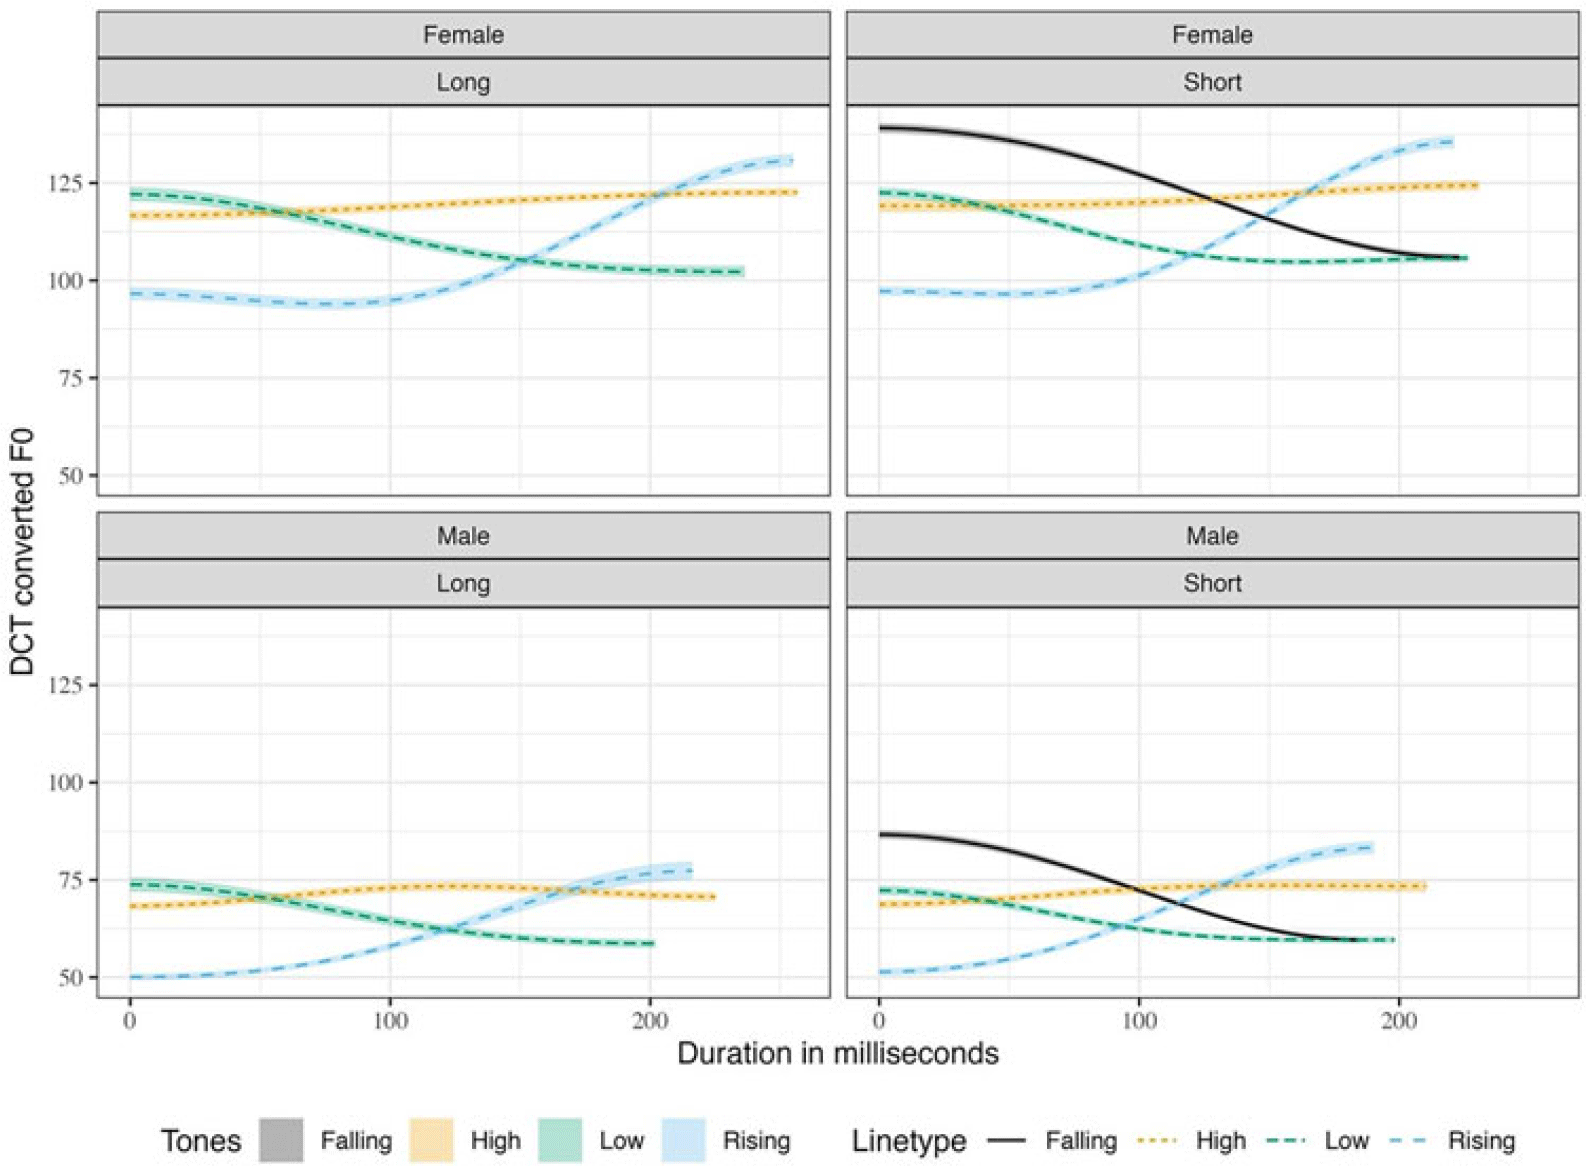
Figure B12 Long description
The image contains four line graphs that illustrate the DCT converted F0 values over duration in milliseconds for male and female speakers with long and short tones. The graphs are divided into four quadrants: Female Long, Female Short, Male Long, and Male Short. Each graph features multiple lines representing different tones: Falling, High, Low, and Rising. The x-axis represents the duration in milliseconds, ranging from 0 to 200, while the y-axis represents the DCT converted F0 values, ranging from 50 to 125. The lines are color-coded and styled differently to distinguish between the tones. In the Female Long graph, the lines show varying trends, with some increasing and others decreasing over time. The Female Short graph displays similar patterns but with different slopes and intersections. The Male Long and Male Short graphs follow the same structure, showing distinct trends for each tone type. The lines intersect at various points, indicating differences in F0 values over time for each tone and gender combination. All values are approximated.
Tone f0 contours with average duration produced in isolation by female speakers, reconstructed using DCT coefficients.
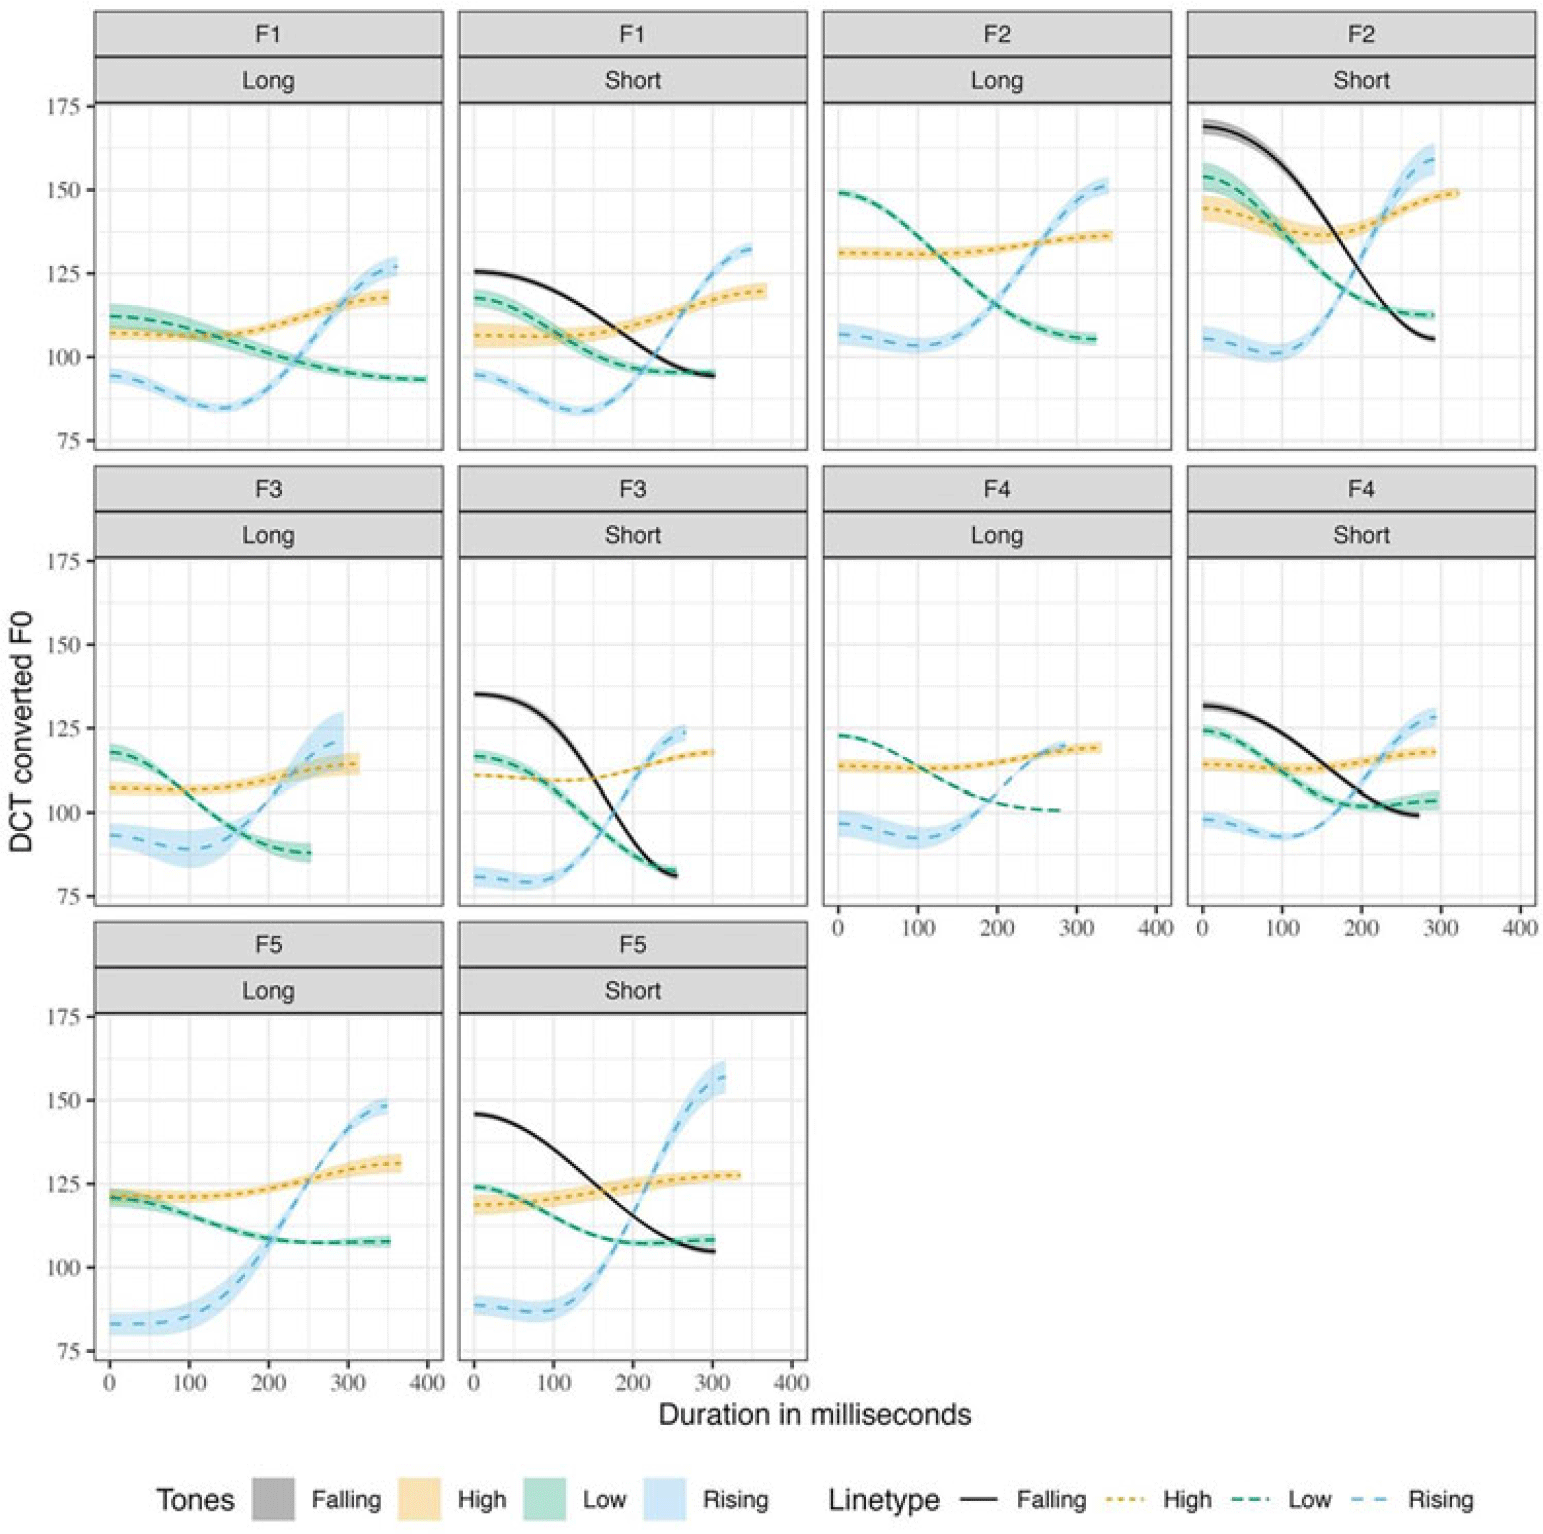
Figure B13 Long description
The image contains twelve line graphs arranged in a grid, each representing tone F0 contours with average duration produced in isolation by female speakers, reconstructed using DCT coefficients. The graphs are organized into four rows and three columns, each labeled with different tone categories (F1, F2, F3, F4, F5) and duration types (Long, Short). The x-axis represents duration in milliseconds, ranging from 0 to 400 milliseconds, while the y-axis represents DCT converted F0 values, ranging from 75 to 175. Each graph shows different tone types: Falling, High, Low, and Rising, distinguished by different line types and colors. The Falling tone is represented by a solid black line, the High tone by a dashed yellow line, the Low tone by a dashed green line, and the Rising tone by a dashed blue line. The graphs illustrate the variations in F0 contours across different tones and durations. All values are approximated.
Tone f0 contours with average duration produced in isolation by male speakers, reconstructed using DCT coefficients.
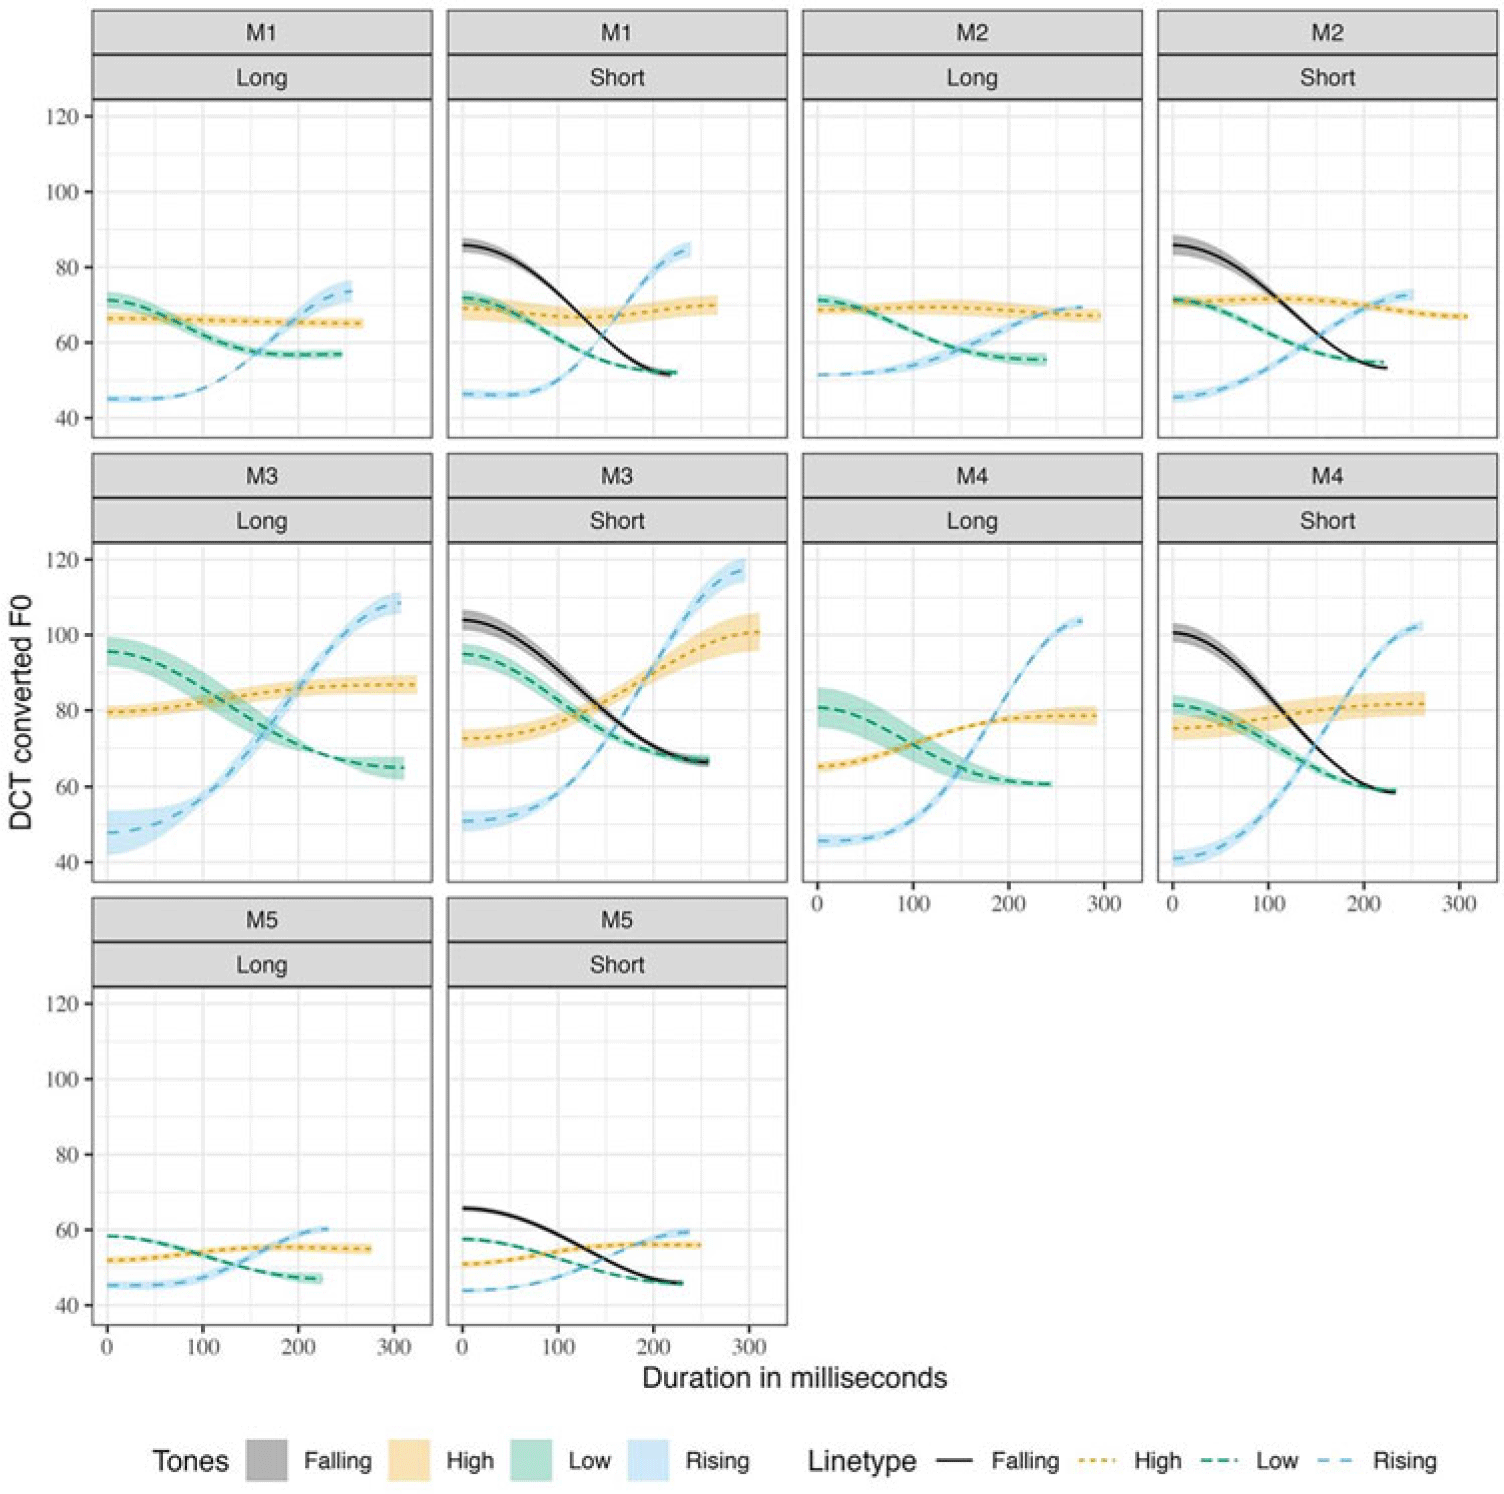
Figure B14 Long description
The image contains twelve line graphs arranged in a grid of five rows and three columns. Each graph represents tone F0 contours with average duration produced in isolation by male speakers, reconstructed using DCT coefficients. The graphs are labeled as M1, M2, M3, M4, and M5, with each label appearing twice, once for long duration and once for short duration. The x-axis of each graph represents duration in milliseconds, ranging from 0 to 300 milliseconds. The y-axis represents DCT converted F0, ranging from 40 to 120. Each graph contains multiple lines representing different tones: falling, high, low, and rising. The lines are color-coded and labeled accordingly. The falling tone is represented by a black line, the high tone by a yellow dashed line, the low tone by a green dashed line, and the rising tone by a blue dashed line. The graphs show the interaction between different tones and their durations, illustrating how the F0 contours vary over time for each tone type.
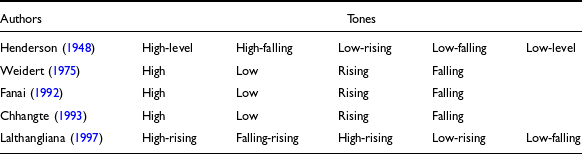
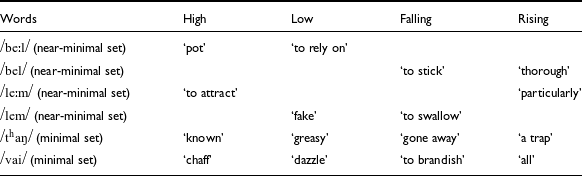

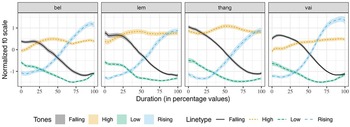
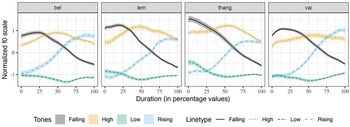
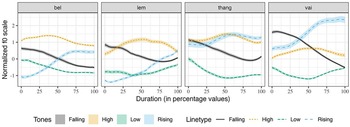
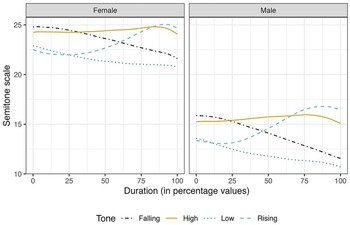
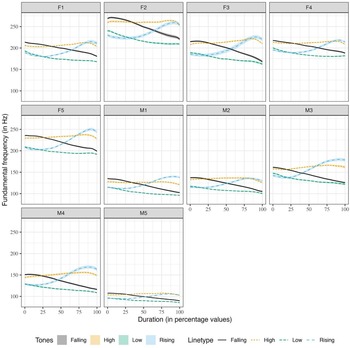

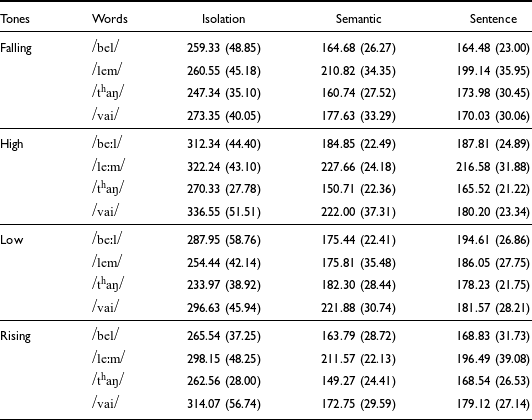
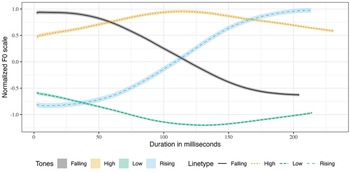
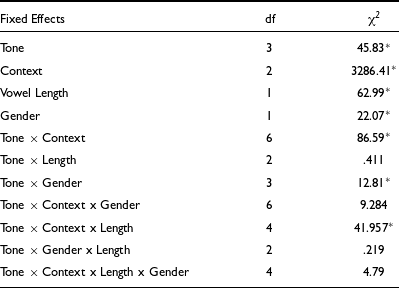
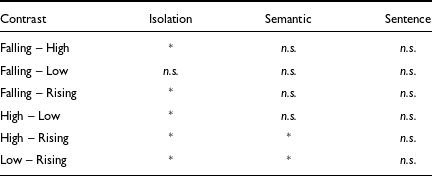
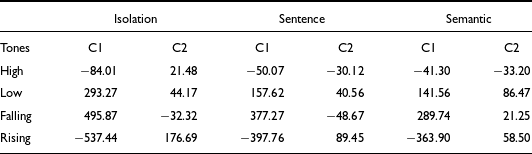

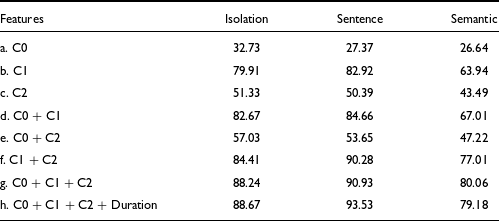
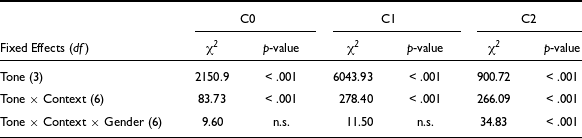
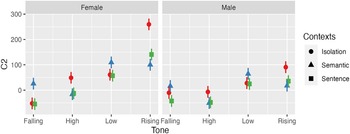

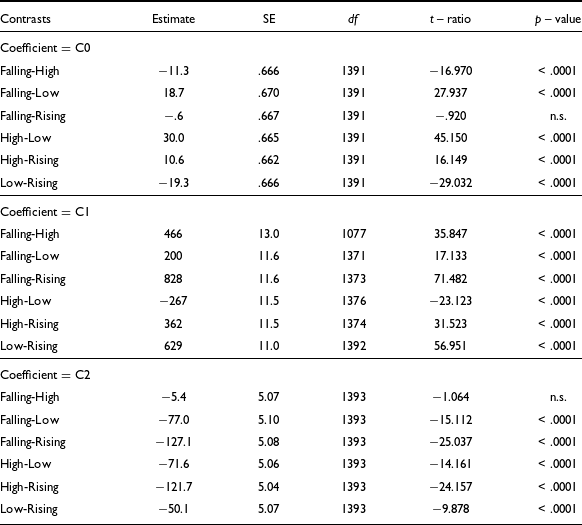
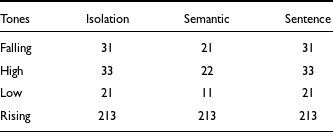
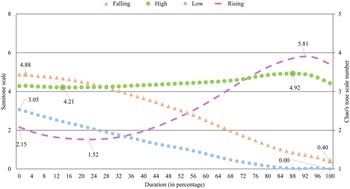
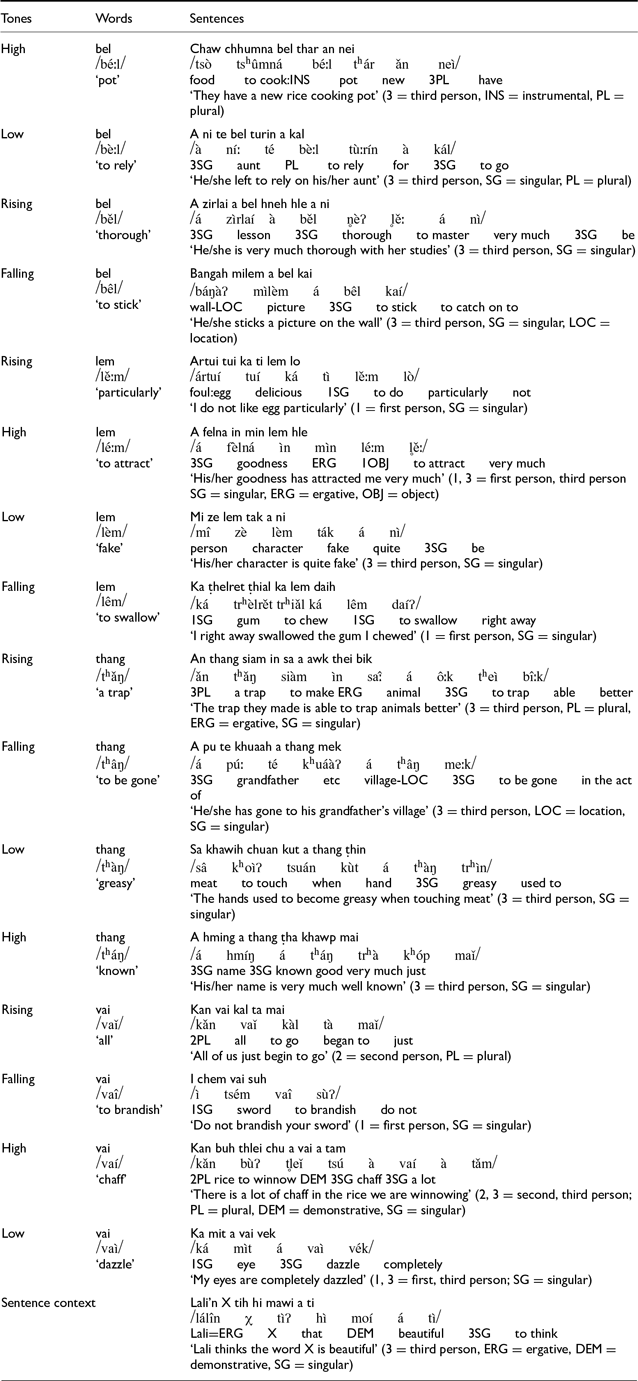
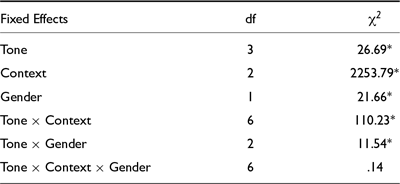
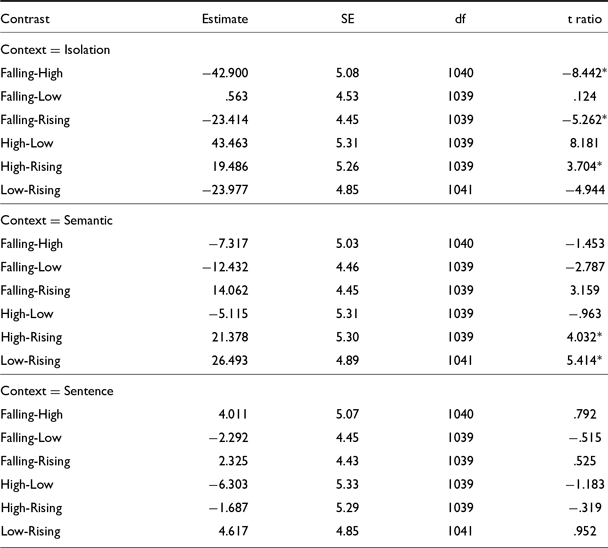
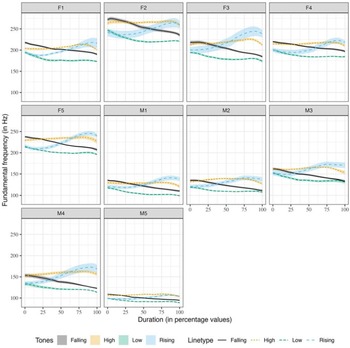
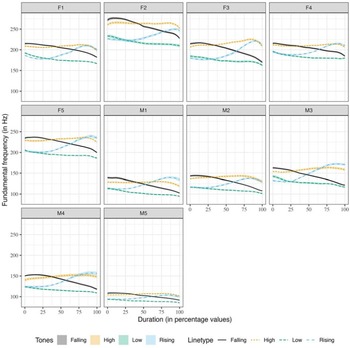
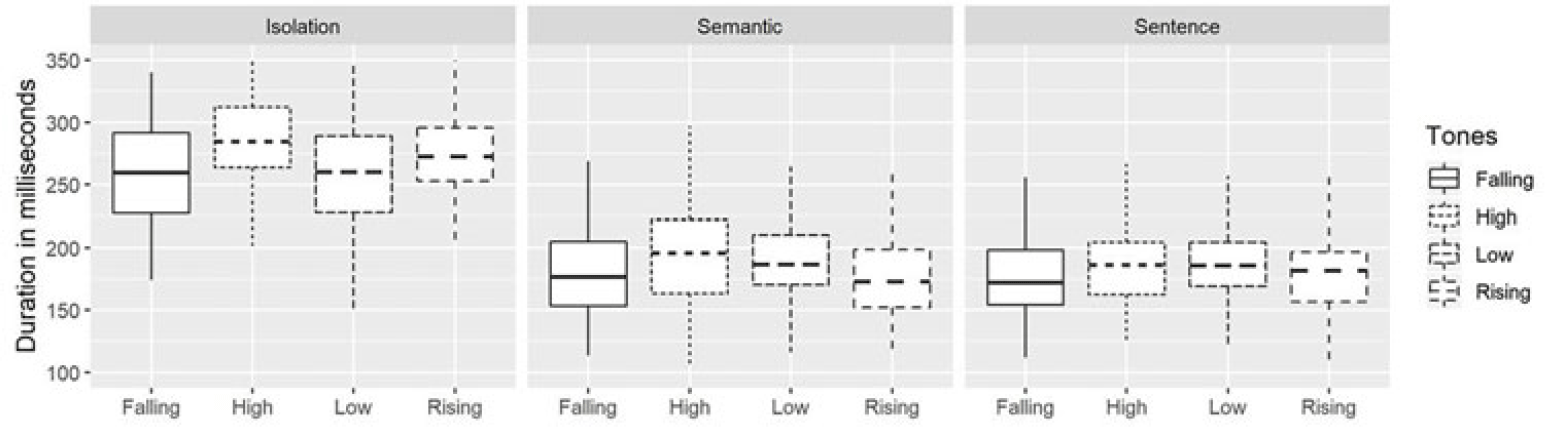
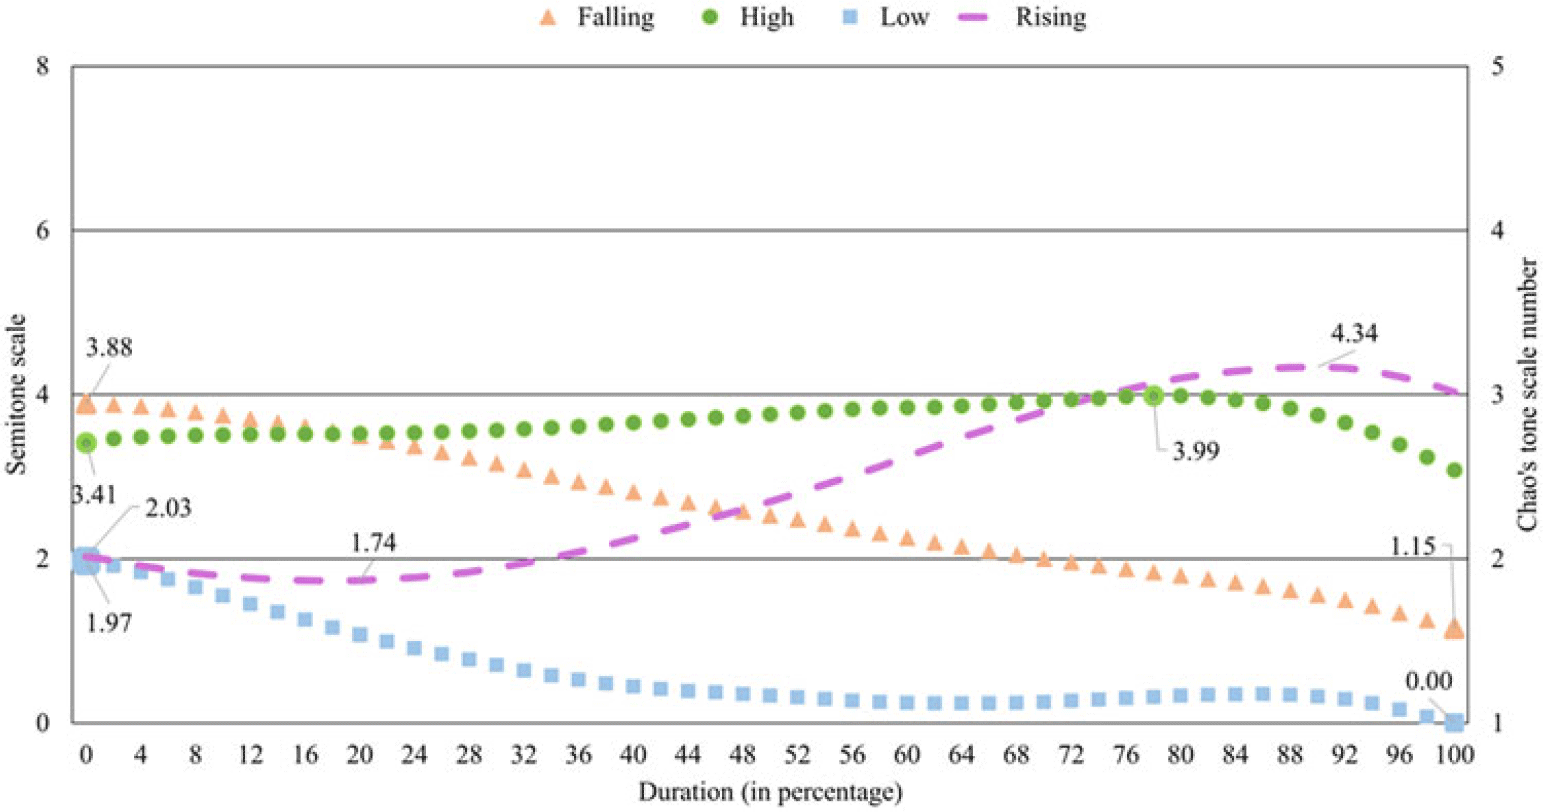
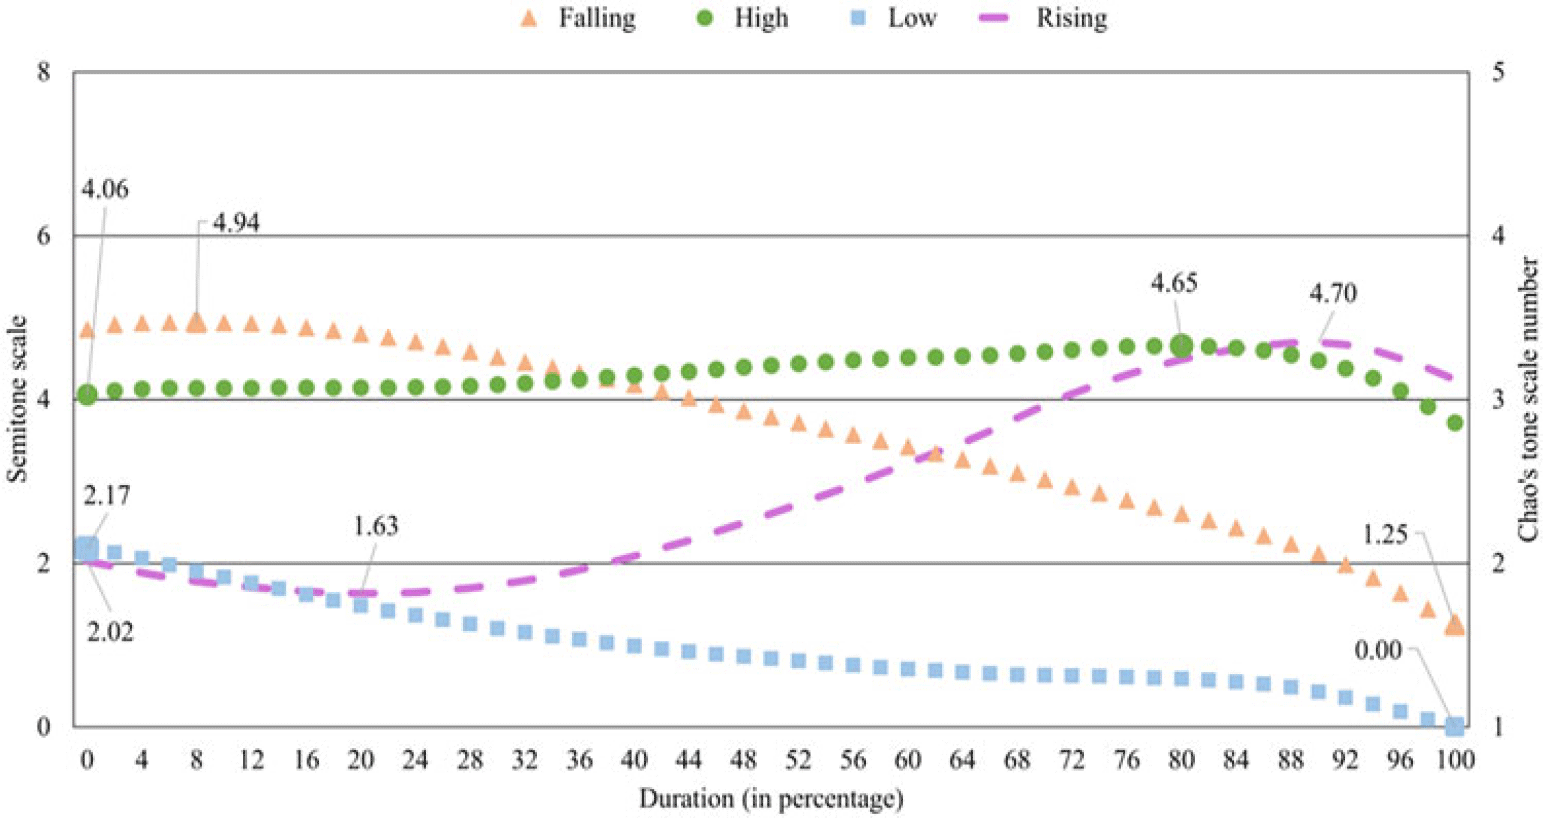
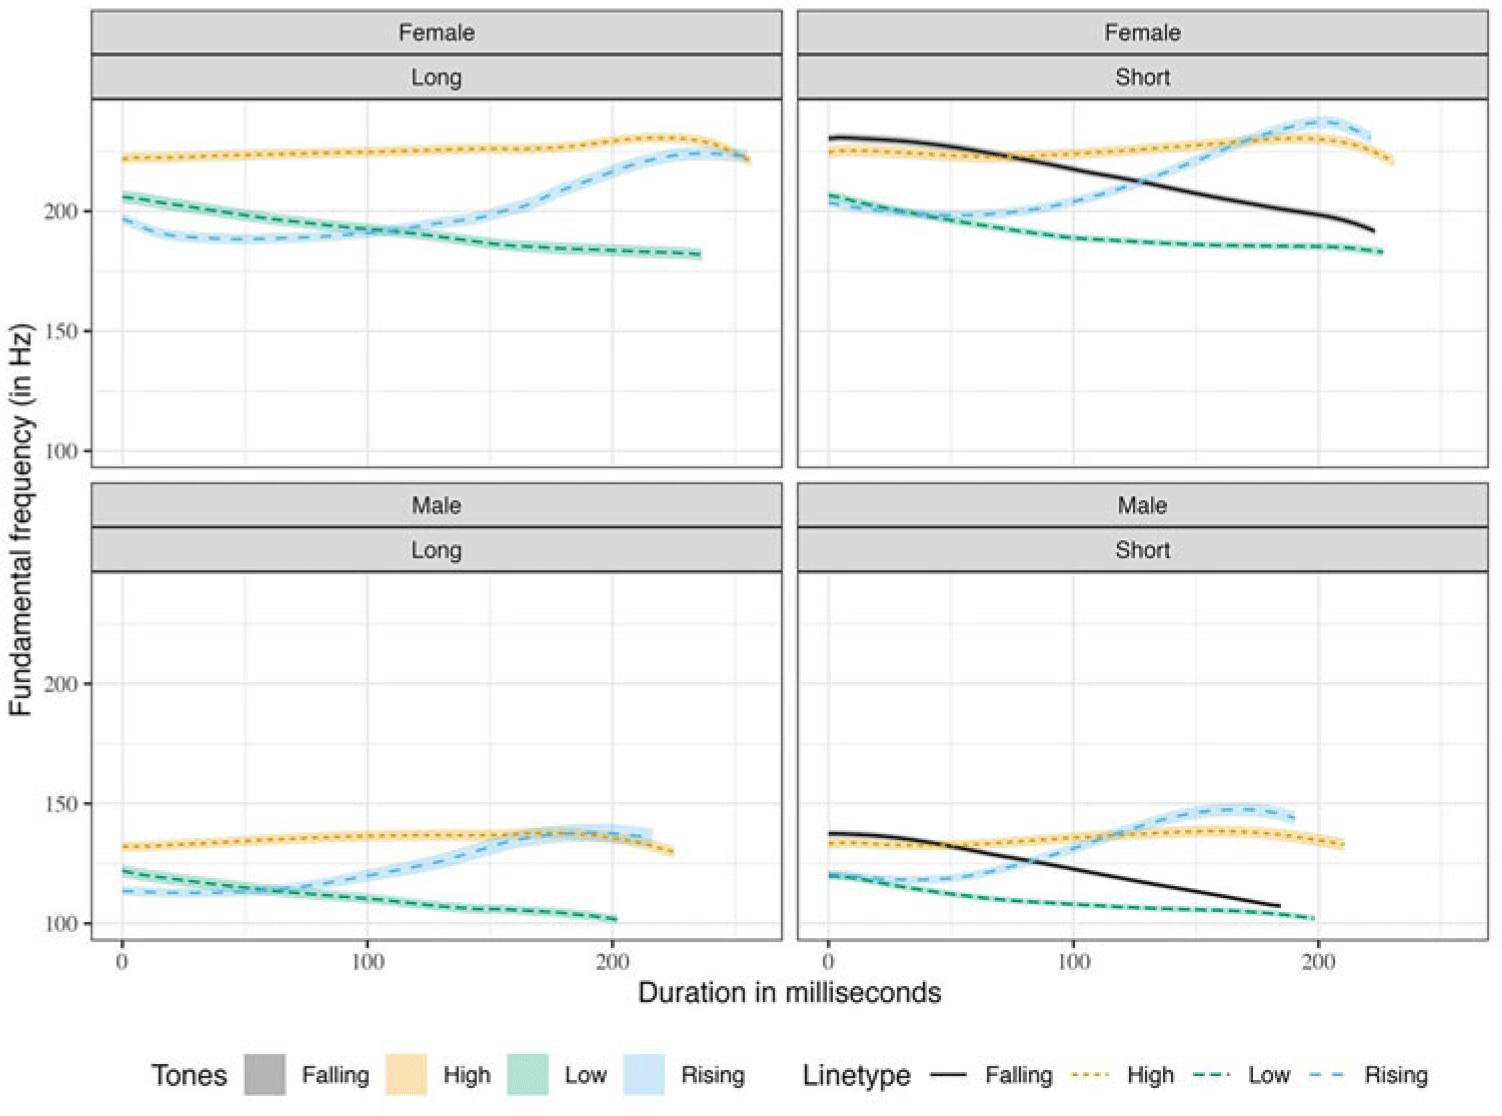
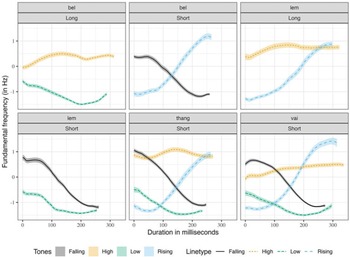
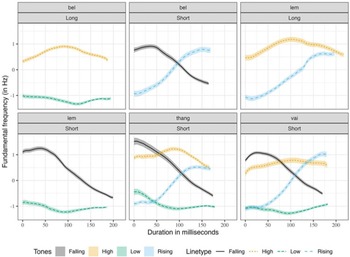

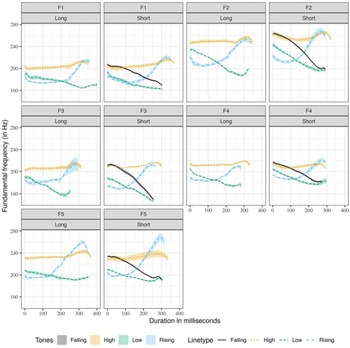
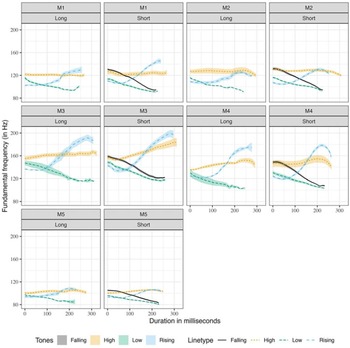

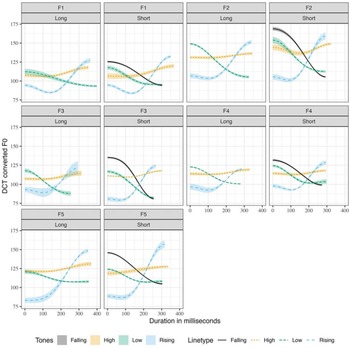
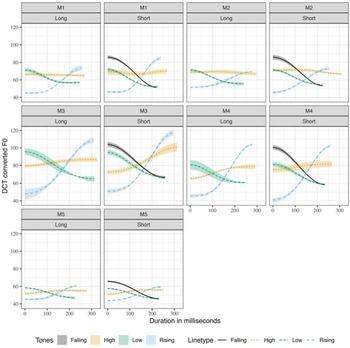

 Open access

