


1. Introduction
To achieve a high triple product for fusion ignition, both high temperature and high density are strongly pursued in present and future fusion devices. In the plasma regime for fusion energy, temperature gradient and/or density gradient will be large enough to excite electromagnetic instability (Ganesh et al. Reference Ganesh2005). Especially, the first threshold of the pressure gradient becomes much smaller in the case of weak magnetic shear, and it enables destabilisation of electromagnetic modes with a low toroidal mode number (Hirose & Elia Reference Hirose and Elia1996). Thus, electromagnetic instability driven in the core plasma has become a major concern. The Alfvénic ion temperature gradient (AITG) mode, one of the typical electromagnetic modes, was firstly predicted in theory (Zonca et al. Reference Zonca1997). When the ion compression effect couples to a shear Alfvén wave in a plasma with a finite $\boldsymbol{\nabla }T_i$
effect where,
$\boldsymbol{\nabla }T_i$
effect where, $T_i$
is the ion temperature, the AITG mode induced by kinetic wave particle interactions with thermal ions may become unstable with a very low threshold
$T_i$
is the ion temperature, the AITG mode induced by kinetic wave particle interactions with thermal ions may become unstable with a very low threshold $\beta _{AITG}\leq 0.4-0.5\beta _{crit}$
(Zonca et al. Reference Zonca1999). Here,
$\beta _{AITG}\leq 0.4-0.5\beta _{crit}$
(Zonca et al. Reference Zonca1999). Here, $\beta _{crit}$
refers to the marginal stability boundary of ideal magnetohydrodynamic ballooning modes. It can also be excited in the plasma with a condition of
$\beta _{crit}$
refers to the marginal stability boundary of ideal magnetohydrodynamic ballooning modes. It can also be excited in the plasma with a condition of $\Omega _{*pi}\sim q\sqrt {7/4+\tau }$
, and is usually regarded as a branch connecting the kinetic ballooning mode (KBM, the diamagnetic effect is dominant,
$\Omega _{*pi}\sim q\sqrt {7/4+\tau }$
, and is usually regarded as a branch connecting the kinetic ballooning mode (KBM, the diamagnetic effect is dominant, $\Omega _{*pi}\gg q\sqrt {7/4+\tau }$
) and beta induced Alfvén eigenmode (BAE, the ion compression effect is dominant,
$\Omega _{*pi}\gg q\sqrt {7/4+\tau }$
) and beta induced Alfvén eigenmode (BAE, the ion compression effect is dominant, $\Omega _{*pi}\ll q\sqrt {7/4+\tau }$
) (Zonca et al. Reference Zonca1996). Here,
$\Omega _{*pi}\ll q\sqrt {7/4+\tau }$
) (Zonca et al. Reference Zonca1996). Here, $q$
is the safety factor and
$q$
is the safety factor and $\tau =T_e/T_i$
. It was reported that the stability of AITG modes has a strong and complex dependence on multiple effects, including magnetic shear, pressure gradient, trapped electrons, Shafranov shift as well as the parallel ion current (Hirose et al. Reference Hirose1995; Hirose & Elia Reference Hirose and Elia1996; Falchtto et al. Reference Falchtto2003; Moradi et al. Reference Moradi2014). A theoretical framework for the AITG mode had been well developed (Chen & Zonca Reference Chen and Zonca2016), but due to the absence and limitation of core diagnostics, experimental evidence for the core-localised electromagnetic modes is rather limited. It was firstly experimentally validated in HL-2A plasma with peaked density profiles and weak magnetic shear (Chen et al. Reference Chen and Zonca2016). Subsequently, the AITG modes were also observed in high ion temperature and high-beta plasmas (Chen et al. Reference Chen2018a
; Du et al. Reference Du2021). Only a small amount of experimental evidence for the AITG modes has so far been presented, but they were found to cause minor disruption and expected to affect thermal electron transport, which will become a major concern in the future burning plasma with alpha particle heating (Kiptily et al. Reference Kiptily2023). Besides, the AITG modes may also be unstable in a magnetically confined plasma with reactor-relevant parameters and play an important role in the formation and evolution of internal/external transport barriers. As the first plasma of ITER gets closer, a systematic understanding for the electromagnetic instability via the combination of theory and experiment becomes more and more urgent. To better understand the AITG modes in the laboratory frame, a series of experiments have been designed on the HL-2A tokamak. The paper is organised as follows: experimental set-up can be found in § 2, destabilisation of AITG modes and effects of electron cyclotron resonance heating (ECRH) are shown in § 3, theoretical analyses based on the famous framework of the general fishbone-like dispersion relation (GFLDR) are presented in § 4 and a summary is given in the final section.
$\tau =T_e/T_i$
. It was reported that the stability of AITG modes has a strong and complex dependence on multiple effects, including magnetic shear, pressure gradient, trapped electrons, Shafranov shift as well as the parallel ion current (Hirose et al. Reference Hirose1995; Hirose & Elia Reference Hirose and Elia1996; Falchtto et al. Reference Falchtto2003; Moradi et al. Reference Moradi2014). A theoretical framework for the AITG mode had been well developed (Chen & Zonca Reference Chen and Zonca2016), but due to the absence and limitation of core diagnostics, experimental evidence for the core-localised electromagnetic modes is rather limited. It was firstly experimentally validated in HL-2A plasma with peaked density profiles and weak magnetic shear (Chen et al. Reference Chen and Zonca2016). Subsequently, the AITG modes were also observed in high ion temperature and high-beta plasmas (Chen et al. Reference Chen2018a
; Du et al. Reference Du2021). Only a small amount of experimental evidence for the AITG modes has so far been presented, but they were found to cause minor disruption and expected to affect thermal electron transport, which will become a major concern in the future burning plasma with alpha particle heating (Kiptily et al. Reference Kiptily2023). Besides, the AITG modes may also be unstable in a magnetically confined plasma with reactor-relevant parameters and play an important role in the formation and evolution of internal/external transport barriers. As the first plasma of ITER gets closer, a systematic understanding for the electromagnetic instability via the combination of theory and experiment becomes more and more urgent. To better understand the AITG modes in the laboratory frame, a series of experiments have been designed on the HL-2A tokamak. The paper is organised as follows: experimental set-up can be found in § 2, destabilisation of AITG modes and effects of electron cyclotron resonance heating (ECRH) are shown in § 3, theoretical analyses based on the famous framework of the general fishbone-like dispersion relation (GFLDR) are presented in § 4 and a summary is given in the final section.
2. Experimental set-up
The experiment is performed on HL-2A tokamak developed for scientific research related to advanced tokamak physical experiments, technical and engineering issues of ITER or fusion reactors. To achieve its scientific goals, the HL-2A tokamak with a major/minor radius of $R_0/a=1.65\,\text{m}/0.4\,\text{m}$
is equipped with neutral beam injection (NBI) and ECRH/electron cyclotron current drive (ECCD) systems and lower hybrid wave (LHW) systems. The NBI system consists of two tangentially injected beamlines and can achieve a maximum port-through power of
$R_0/a=1.65\,\text{m}/0.4\,\text{m}$
is equipped with neutral beam injection (NBI) and ECRH/electron cyclotron current drive (ECCD) systems and lower hybrid wave (LHW) systems. The NBI system consists of two tangentially injected beamlines and can achieve a maximum port-through power of $3\,\text{MW}$
. Only one beamline is available in this experiment. The ECRH/ECCD system operates with a frequency of
$3\,\text{MW}$
. Only one beamline is available in this experiment. The ECRH/ECCD system operates with a frequency of $f_{EC}=68\,\text{GHz}$
and is effective for both electron heating and current drive. The maximum power reaches
$f_{EC}=68\,\text{GHz}$
and is effective for both electron heating and current drive. The maximum power reaches $P_{EC}=4\,\text{MW}$
and the deposition location (
$P_{EC}=4\,\text{MW}$
and the deposition location ( $\rho _{EC}$
) is decided by a detail magnetic field (
$\rho _{EC}$
) is decided by a detail magnetic field ( $B_t$
), i.e.
$B_t$
), i.e. $\rho _{EC}={R_0}/{a}(({56B_t}/{f_{EC}})-1)$
. The LHW system works at a frequency of 3.7 GHz and provides an effective method for current drive. All the three heating systems are used in experiments. Meanwhile, a series of advanced diagnostics is developed on HL-2A tokamak. A 32-channel charge exchange recombination spectroscopy (Wei et al. Reference Wei2014) and a 64-channel electron cyclotron emission (ECE) radiometer (Yang et al. Reference Yang2019) are utilised for ion and electron temperature measurement, respectively. The laser interferometer and frequency modulated continuous wave reflectometer (Yang et al. Reference Yang2021) are used to monitor evolution of the electron density. Besides, a microwave interferometer, Mirnov probe system and soft X-ray array are also available. Figure 1 presents layouts of the microwave interferometer, Mirnov probe system and soft X-ray array. The microwave interferometer launches a probing wave on the high field side and can achieve density fluctuation measurements at four different locations of
$\rho _{EC}={R_0}/{a}(({56B_t}/{f_{EC}})-1)$
. The LHW system works at a frequency of 3.7 GHz and provides an effective method for current drive. All the three heating systems are used in experiments. Meanwhile, a series of advanced diagnostics is developed on HL-2A tokamak. A 32-channel charge exchange recombination spectroscopy (Wei et al. Reference Wei2014) and a 64-channel electron cyclotron emission (ECE) radiometer (Yang et al. Reference Yang2019) are utilised for ion and electron temperature measurement, respectively. The laser interferometer and frequency modulated continuous wave reflectometer (Yang et al. Reference Yang2021) are used to monitor evolution of the electron density. Besides, a microwave interferometer, Mirnov probe system and soft X-ray array are also available. Figure 1 presents layouts of the microwave interferometer, Mirnov probe system and soft X-ray array. The microwave interferometer launches a probing wave on the high field side and can achieve density fluctuation measurements at four different locations of $r=5, 11, 18$
and
$r=5, 11, 18$
and $24\,\text{cm}$
(Shi et al. Reference Shi2021); here, ‘r’ is the distance from a certain chord to the magnetic axis. The Mirnov probe system has both poloidal and toroidal components. The former consists of 18 probes (11 probes on the low field side and another 7 probes on the high field side), while the latter is made up of 10 probes in total. Those magnetic probes will be used to measure toroidal/poloidal mode numbers via a phase comparison method. A soft X-ray array for bremsstrahlung measurement has 20 detectors and covers a wide region ranging from
$24\,\text{cm}$
(Shi et al. Reference Shi2021); here, ‘r’ is the distance from a certain chord to the magnetic axis. The Mirnov probe system has both poloidal and toroidal components. The former consists of 18 probes (11 probes on the low field side and another 7 probes on the high field side), while the latter is made up of 10 probes in total. Those magnetic probes will be used to measure toroidal/poloidal mode numbers via a phase comparison method. A soft X-ray array for bremsstrahlung measurement has 20 detectors and covers a wide region ranging from $r=-33\,\text{}$
to
$r=-33\,\text{}$
to $r=+33\,\text{cm}$
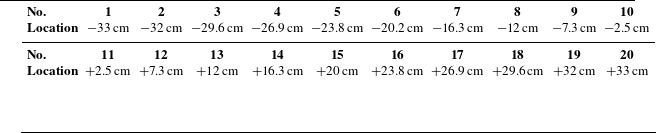
. The signs ‘−’ and ‘+’ represent special locations on the high field side and low field side, respectively. More information for the location of the 20-channel soft X-ray array is given in table 1.
$r=+33\,\text{cm}$
. The signs ‘−’ and ‘+’ represent special locations on the high field side and low field side, respectively. More information for the location of the 20-channel soft X-ray array is given in table 1.
Layouts of the 4-channel microwave interferometer (black lines), 18-channel poloidal Mirnov probe (black dots) and 20-channel soft X-ray array (colourful solid and dotted lines). The red circle represents a predominantly circular cross-section of plasma on HL-2A tokamak.

Locations of the 20-channel soft X-ray array on HL-2A tokamak.

Temporal evolution of (a) plasma current, (b) magnetic field, (c) line-averaged electron density, (d) plasma stored energy, (e) power of ECRH, (f) power of NBI, (g) electron temperature at magnetic axis, (h) ratio of electron and ion temperatures at the ITB foot, (i) maximum ion temperature gradient, (j) rotation frequencies and (k) ion temperature for the 26 006 (black) and 27 527 (red) discharges, which are distinguished by the subscripts of ‘1’ and ‘2’ in panel (g-k).

3. Destabilisation of AITG modes on HL-2A
It was reported that the AITG mode can be driven unstable in both ohmic and NBI heated plasma on the HL-2A tokamak (Chen et al. Reference Chen and Zonca2016, Reference Chen2018a ). In this section, more detailed results for AITG modes in plasma with an internal transport barrier (ITB) and weak magnetic shear will be presented. It mainly consists of two parts, i.e. the experimental characteristic of AITG modes and the effects of ECRH on the interesting electromagnetic instability.
Spectrograms during the 26 006 (left column) and 27 527 (right column) discharges. Those spectrograms are measured by (a–c) microwave interferometer, (e–g) soft X-ray array (d) and (h) the Mirnov probe in midplane. The blue curves in (a) and (e) are the waveforms of ECRH. The black curves in (a) and (e) are the BAE frequency given by $f_{BAE}={1}/{2\pi }\sqrt {7/4+T_e/T_i}\sqrt {2T_i/m_i}$
where
$f_{BAE}={1}/{2\pi }\sqrt {7/4+T_e/T_i}\sqrt {2T_i/m_i}$
where $m_i$
is the ion mass and those in (d) and (h) are a third of toroidal Alfven eigenmode (TAE) frequency of
$m_i$
is the ion mass and those in (d) and (h) are a third of toroidal Alfven eigenmode (TAE) frequency of $f_{TAE}=V_A/4\pi qR_0$
, with
$f_{TAE}=V_A/4\pi qR_0$
, with $B_t=1.34T$
,
$B_t=1.34T$
, $n_e=1.0\times 10^{19}m^{-3}$
and
$n_e=1.0\times 10^{19}m^{-3}$
and $q=1.5$
. Rotation frequency has not been included in
$q=1.5$
. Rotation frequency has not been included in $f_{BAE}$
and
$f_{BAE}$
and $({1}/{3})f_{TAE}$
.
$({1}/{3})f_{TAE}$
.

3.1. Experimental characteristic of AITG modes
The experiments for AITG modes are performed in the divertor configuration. Figure 2 shows the basic parameters during two typical discharges. Plasma current $I_p$
, toroidal magnetic field
$I_p$
, toroidal magnetic field $B_t$
, line-averaged electron density
$B_t$
, line-averaged electron density $n_e$
, stored energy
$n_e$
, stored energy $W_E$
and injected power of the ECRH and NBI are given in the first six panels. The ECRH is turned on at 700 ms and last for 100 ms for the 27 527 discharge. It is injected into the plasma at 500 ms and turned off at 900 ms in the other experiment. To ensure the same deposition locations of ECRH,
$W_E$
and injected power of the ECRH and NBI are given in the first six panels. The ECRH is turned on at 700 ms and last for 100 ms for the 27 527 discharge. It is injected into the plasma at 500 ms and turned off at 900 ms in the other experiment. To ensure the same deposition locations of ECRH, $B_t$
is set as 1.34 T. Different injected powers of NBI are available for the two discharges, but the beam energy is kept fixed as 45 keV. The electron temperature
$B_t$
is set as 1.34 T. Different injected powers of NBI are available for the two discharges, but the beam energy is kept fixed as 45 keV. The electron temperature $T_e$
, ratio of electron and ion temperatures (
$T_e$
, ratio of electron and ion temperatures ( $\tau =T_e/T_i$
) in the ITB foot, maximum ion temperature gradient (
$\tau =T_e/T_i$
) in the ITB foot, maximum ion temperature gradient ( $|\boldsymbol{\nabla }T_i|$
), rotation frequency (
$|\boldsymbol{\nabla }T_i|$
), rotation frequency ( $f_{rot}$
) and ion temperature (
$f_{rot}$
) and ion temperature ( $T_i$
) are plotted at figure 2(g–k), where the subscripts of ‘1’ and ‘2’ represent data from the 26 006 and 27 527 discharges, respectively. It should be noted that, when ECRH is injected into the plasma, drops in
$T_i$
) are plotted at figure 2(g–k), where the subscripts of ‘1’ and ‘2’ represent data from the 26 006 and 27 527 discharges, respectively. It should be noted that, when ECRH is injected into the plasma, drops in $T_i$
and
$T_i$
and $n_e$
, moderating the growth of
$n_e$
, moderating the growth of $T_e$
, appear in the core region during the 27 527 discharge. But a different tendency can be observed when radio-frequency (RF) wave is turned off during the 26 006 discharge. In other words, ECRH is responsible for an increase of
$T_e$
, appear in the core region during the 27 527 discharge. But a different tendency can be observed when radio-frequency (RF) wave is turned off during the 26 006 discharge. In other words, ECRH is responsible for an increase of $\tau =T_e/T_i$
in figure 2. Note that, to modulate the experimental mode frequency, the supersonic molecular beam injection is also used for the 26 006 discharge. Spectrograms obtained from the microwave interferometer, soft X-ray array and Mirnov coil are given in figure 3. Different responses are found on the three diagnostics due to different sensitivities and installation locations. There are two kinds of instabilities during simultaneous injection of NBI and ECRH. The lower frequency (
$\tau =T_e/T_i$
in figure 2. Note that, to modulate the experimental mode frequency, the supersonic molecular beam injection is also used for the 26 006 discharge. Spectrograms obtained from the microwave interferometer, soft X-ray array and Mirnov coil are given in figure 3. Different responses are found on the three diagnostics due to different sensitivities and installation locations. There are two kinds of instabilities during simultaneous injection of NBI and ECRH. The lower frequency ( ${\leq}50\,\text{kHz}$
) one is a long-lived mode or fishbone mode and its second harmonic, the other one with a higher frequency is electromagnetic and is located in the core region. First of all, the high-frequency mode can be measured by the Mirnov probe and microwave interferometer. The former reveals a magnetic perturbation while the latter presents a density fluctuation, which is proportional to the electrostatic perturbation. It is worth noting that the mode has a larger amplitude on the low field side than the high field side. These results mean that the modes are electromagnetic and have a typical ballooning mode structure. Then, different responses of electromagnetic instability at different channels of the microwave interferometer and soft X-ray array enable determination of mode location. In the 26 006 discharge, six modes with a toroidal mode number of
${\leq}50\,\text{kHz}$
) one is a long-lived mode or fishbone mode and its second harmonic, the other one with a higher frequency is electromagnetic and is located in the core region. First of all, the high-frequency mode can be measured by the Mirnov probe and microwave interferometer. The former reveals a magnetic perturbation while the latter presents a density fluctuation, which is proportional to the electrostatic perturbation. It is worth noting that the mode has a larger amplitude on the low field side than the high field side. These results mean that the modes are electromagnetic and have a typical ballooning mode structure. Then, different responses of electromagnetic instability at different channels of the microwave interferometer and soft X-ray array enable determination of mode location. In the 26 006 discharge, six modes with a toroidal mode number of $n=+1\sim +6$
can be detected by the
$n=+1\sim +6$
can be detected by the $r=5\,\text{cm}$
channel on microwave diagnostics. Here, ‘
$r=5\,\text{cm}$
channel on microwave diagnostics. Here, ‘ $+$
’ indicates that those modes rotate in the ion diamagnetic drift direction. But fewer modes with weaker fluctuation level are measured by both the
$+$
’ indicates that those modes rotate in the ion diamagnetic drift direction. But fewer modes with weaker fluctuation level are measured by both the $r=11\,\text{}$
and
$r=11\,\text{}$
and $r=18\,\text{cm}$
channels. Such a result indicates a core location for the electromagnetic mode. Finally, differences in frequency and mode number between two adjacent high-frequency electromagnetic modes are comparable to the frequency and mode number of the fishbone or long-lived mode. The matching condition of nonlinear mode coupling is satisfied and it may indicate that mode–mode coupling plays an important role in the generation of multiple groups of electromagnetic modes (Chen et al. Reference Chen2014). During the 27 527 discharge, only the
$r=18\,\text{cm}$
channels. Such a result indicates a core location for the electromagnetic mode. Finally, differences in frequency and mode number between two adjacent high-frequency electromagnetic modes are comparable to the frequency and mode number of the fishbone or long-lived mode. The matching condition of nonlinear mode coupling is satisfied and it may indicate that mode–mode coupling plays an important role in the generation of multiple groups of electromagnetic modes (Chen et al. Reference Chen2014). During the 27 527 discharge, only the $n=+3$
mode can be detected by the two channels of the soft X-ray array at
$n=+3$
mode can be detected by the two channels of the soft X-ray array at $r=2.5 \,\text{}$
and
$r=2.5 \,\text{}$
and $r=7.3 \,\text{cm}$
, but not by other channels in the outer region, as shown in figure 3(e–g). So we can come to the conclusion that the mode is localised at the region near
$r=7.3 \,\text{cm}$
, but not by other channels in the outer region, as shown in figure 3(e–g). So we can come to the conclusion that the mode is localised at the region near $r\leq 7.3\,\text{cm}$
(
$r\leq 7.3\,\text{cm}$
( $\rho \leq 0.18$
). The experimental mode frequency ranges from
$\rho \leq 0.18$
). The experimental mode frequency ranges from $70\,\text{}$
to
$70\,\text{}$
to $200 \,\text{kHz}$
and is much lower than the TAE frequency given by
$200 \,\text{kHz}$
and is much lower than the TAE frequency given by $f_{TAE}=V_A/4\pi qR_0\simeq 450\,\text{kHz}$
with
$f_{TAE}=V_A/4\pi qR_0\simeq 450\,\text{kHz}$
with $B_t=1.34T$
,
$B_t=1.34T$
, $n_e=1.0\times 10^{19}\text{m}^{-3}$
and
$n_e=1.0\times 10^{19}\text{m}^{-3}$
and $q=1.5$
. So TAE can be excluded from the mode identification. Actually, the experimental mode frequency is comparable to the BAE frequency (
$q=1.5$
. So TAE can be excluded from the mode identification. Actually, the experimental mode frequency is comparable to the BAE frequency ( $f_{BAE}={1}/{2\pi }\sqrt {7/4+T_e/T_i}\sqrt {2T_i/m_i}$
) and the electromagnetic modes may belong to KBM/AITG/BAE. According to theoretical prediction (Zonca et al. Reference Zonca1996), it will be a KBM if the diamagnetic effect is dominant (
$f_{BAE}={1}/{2\pi }\sqrt {7/4+T_e/T_i}\sqrt {2T_i/m_i}$
) and the electromagnetic modes may belong to KBM/AITG/BAE. According to theoretical prediction (Zonca et al. Reference Zonca1996), it will be a KBM if the diamagnetic effect is dominant ( $\Omega _{*pi}\gg q\sqrt {7/4+\tau }$
), a BAE if the ion compression effect is dominant (
$\Omega _{*pi}\gg q\sqrt {7/4+\tau }$
), a BAE if the ion compression effect is dominant ( $\Omega _{*pi}\ll q\sqrt {7/4+\tau }$
) and a AITG mode if
$\Omega _{*pi}\ll q\sqrt {7/4+\tau }$
) and a AITG mode if $\Omega _{*pi}\sim q\sqrt {7/4+\tau }$
. Note that fishbone modes are completely suppressed when ECRH is turned on duing the 27 527 discharge, which may suggest the disappearance of the
$\Omega _{*pi}\sim q\sqrt {7/4+\tau }$
. Note that fishbone modes are completely suppressed when ECRH is turned on duing the 27 527 discharge, which may suggest the disappearance of the $q=1$
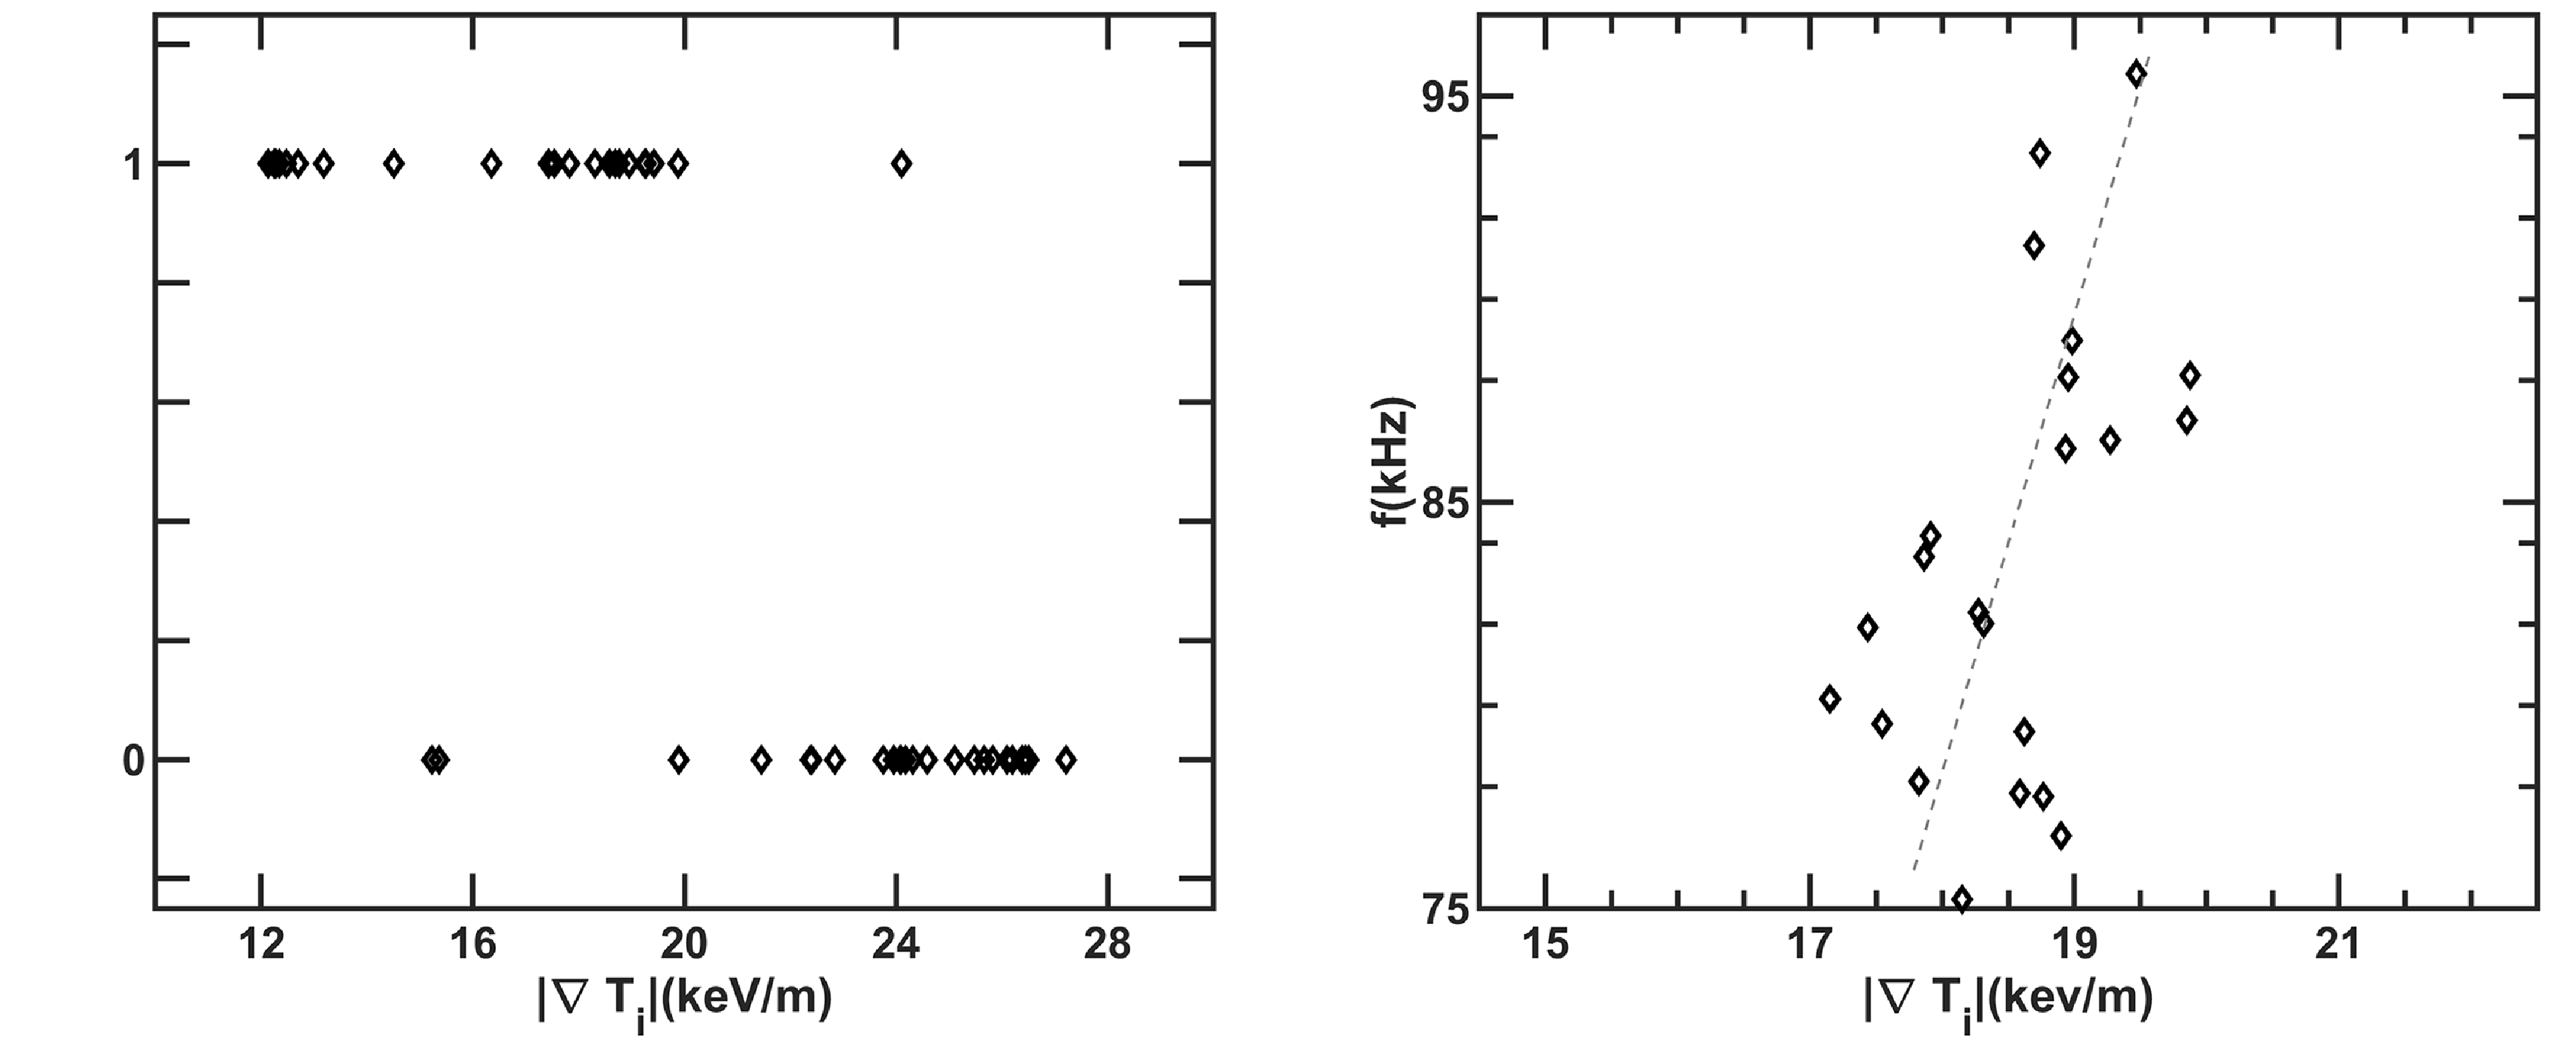
rational surface (Shi et al. Reference Shi2023). Statistical analysis for the mode excitation and experimental characteristic has been carried out. Figure 4 shows that dependence of mode excitation and experimental frequency on
$q=1$
rational surface (Shi et al. Reference Shi2023). Statistical analysis for the mode excitation and experimental characteristic has been carried out. Figure 4 shows that dependence of mode excitation and experimental frequency on $|\boldsymbol{\nabla }T_i|$
. Here, ‘0’ and ‘1’ represent stabilisation and destabilisation of modes. The modes would be unstable or stable in a wide range of
$|\boldsymbol{\nabla }T_i|$
. Here, ‘0’ and ‘1’ represent stabilisation and destabilisation of modes. The modes would be unstable or stable in a wide range of $|\boldsymbol{\nabla }T_i|=12{-}27\,{\rm keV\,m}^{-1}$
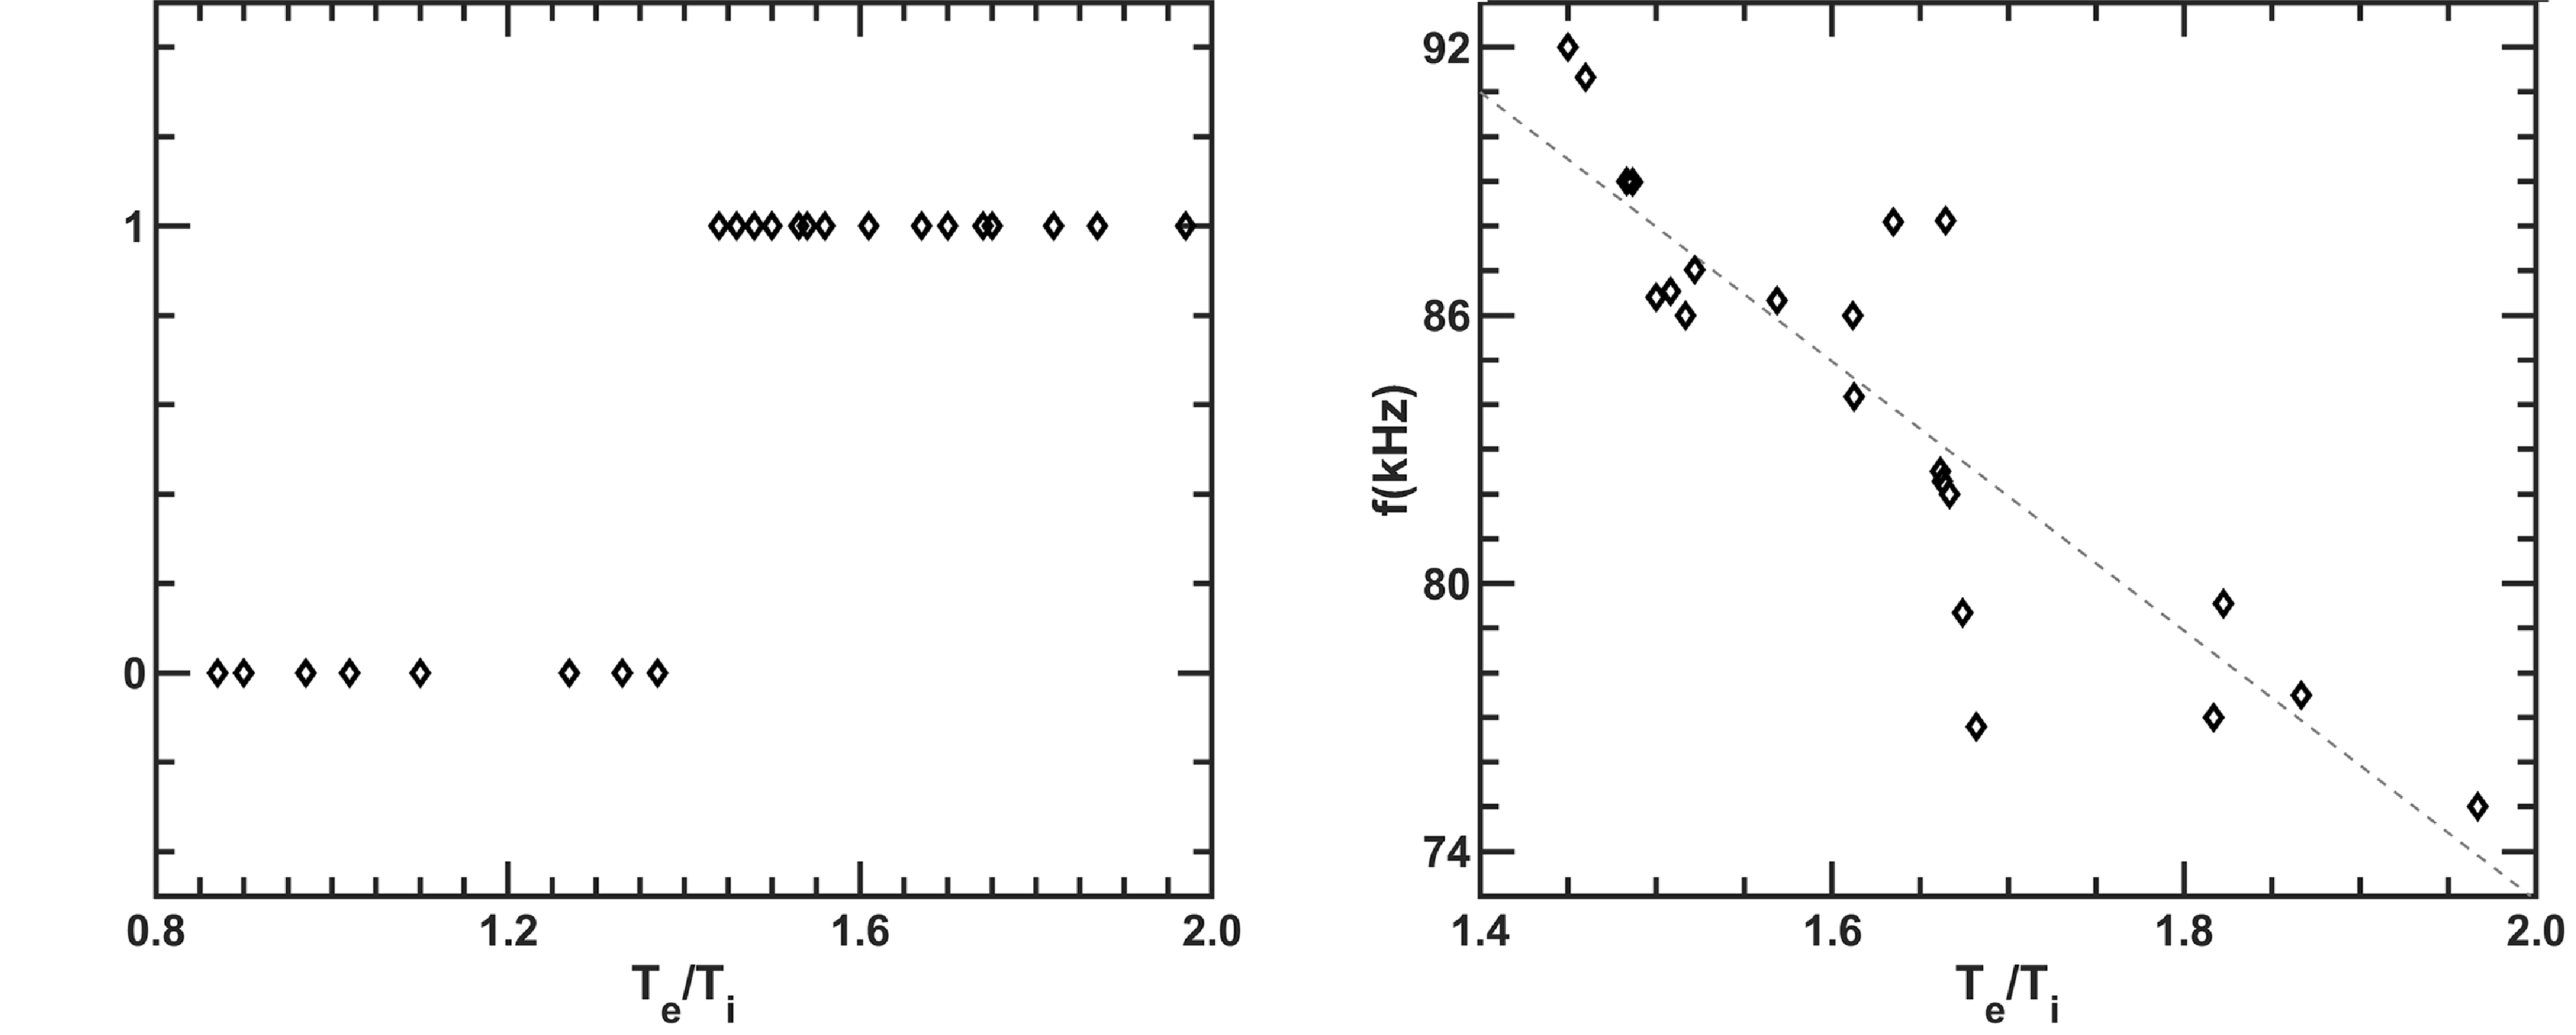
and the experimental frequency is in direct proportion to the ion temperature gradient. Figure 5 reveals the dependence of mode excitation and experimental frequency on
$|\boldsymbol{\nabla }T_i|=12{-}27\,{\rm keV\,m}^{-1}$
and the experimental frequency is in direct proportion to the ion temperature gradient. Figure 5 reveals the dependence of mode excitation and experimental frequency on $T_e/T_i$
. On the one hand, the electromagnetic modes will be stable (unstable) if
$T_e/T_i$
. On the one hand, the electromagnetic modes will be stable (unstable) if $T_e/T_i$
is smaller (larger) than 1.4, which indicates a
$T_e/T_i$
is smaller (larger) than 1.4, which indicates a $T_e/T_i$
threshold for the mode excitation. On the other hand, the experimental mode
$T_e/T_i$
threshold for the mode excitation. On the other hand, the experimental mode
Dependence of (left) mode excitation and (right) experimental frequency on $|\boldsymbol{\nabla }T_i|$
. The ‘0’ and ‘1’ represent stabilisation and destabilisation of modes and
$|\boldsymbol{\nabla }T_i|$
. The ‘0’ and ‘1’ represent stabilisation and destabilisation of modes and $|\boldsymbol{\nabla }T_i|$
is the maximum ion temperature gradient, in keV/m.
$|\boldsymbol{\nabla }T_i|$
is the maximum ion temperature gradient, in keV/m.

Dependence of (left) mode excitation and (right) experimental frequency on $T_e/T_i$
. The ‘0’ and ‘1’ represent stabilisation and destabilisation of modes.
$T_e/T_i$
. The ‘0’ and ‘1’ represent stabilisation and destabilisation of modes.

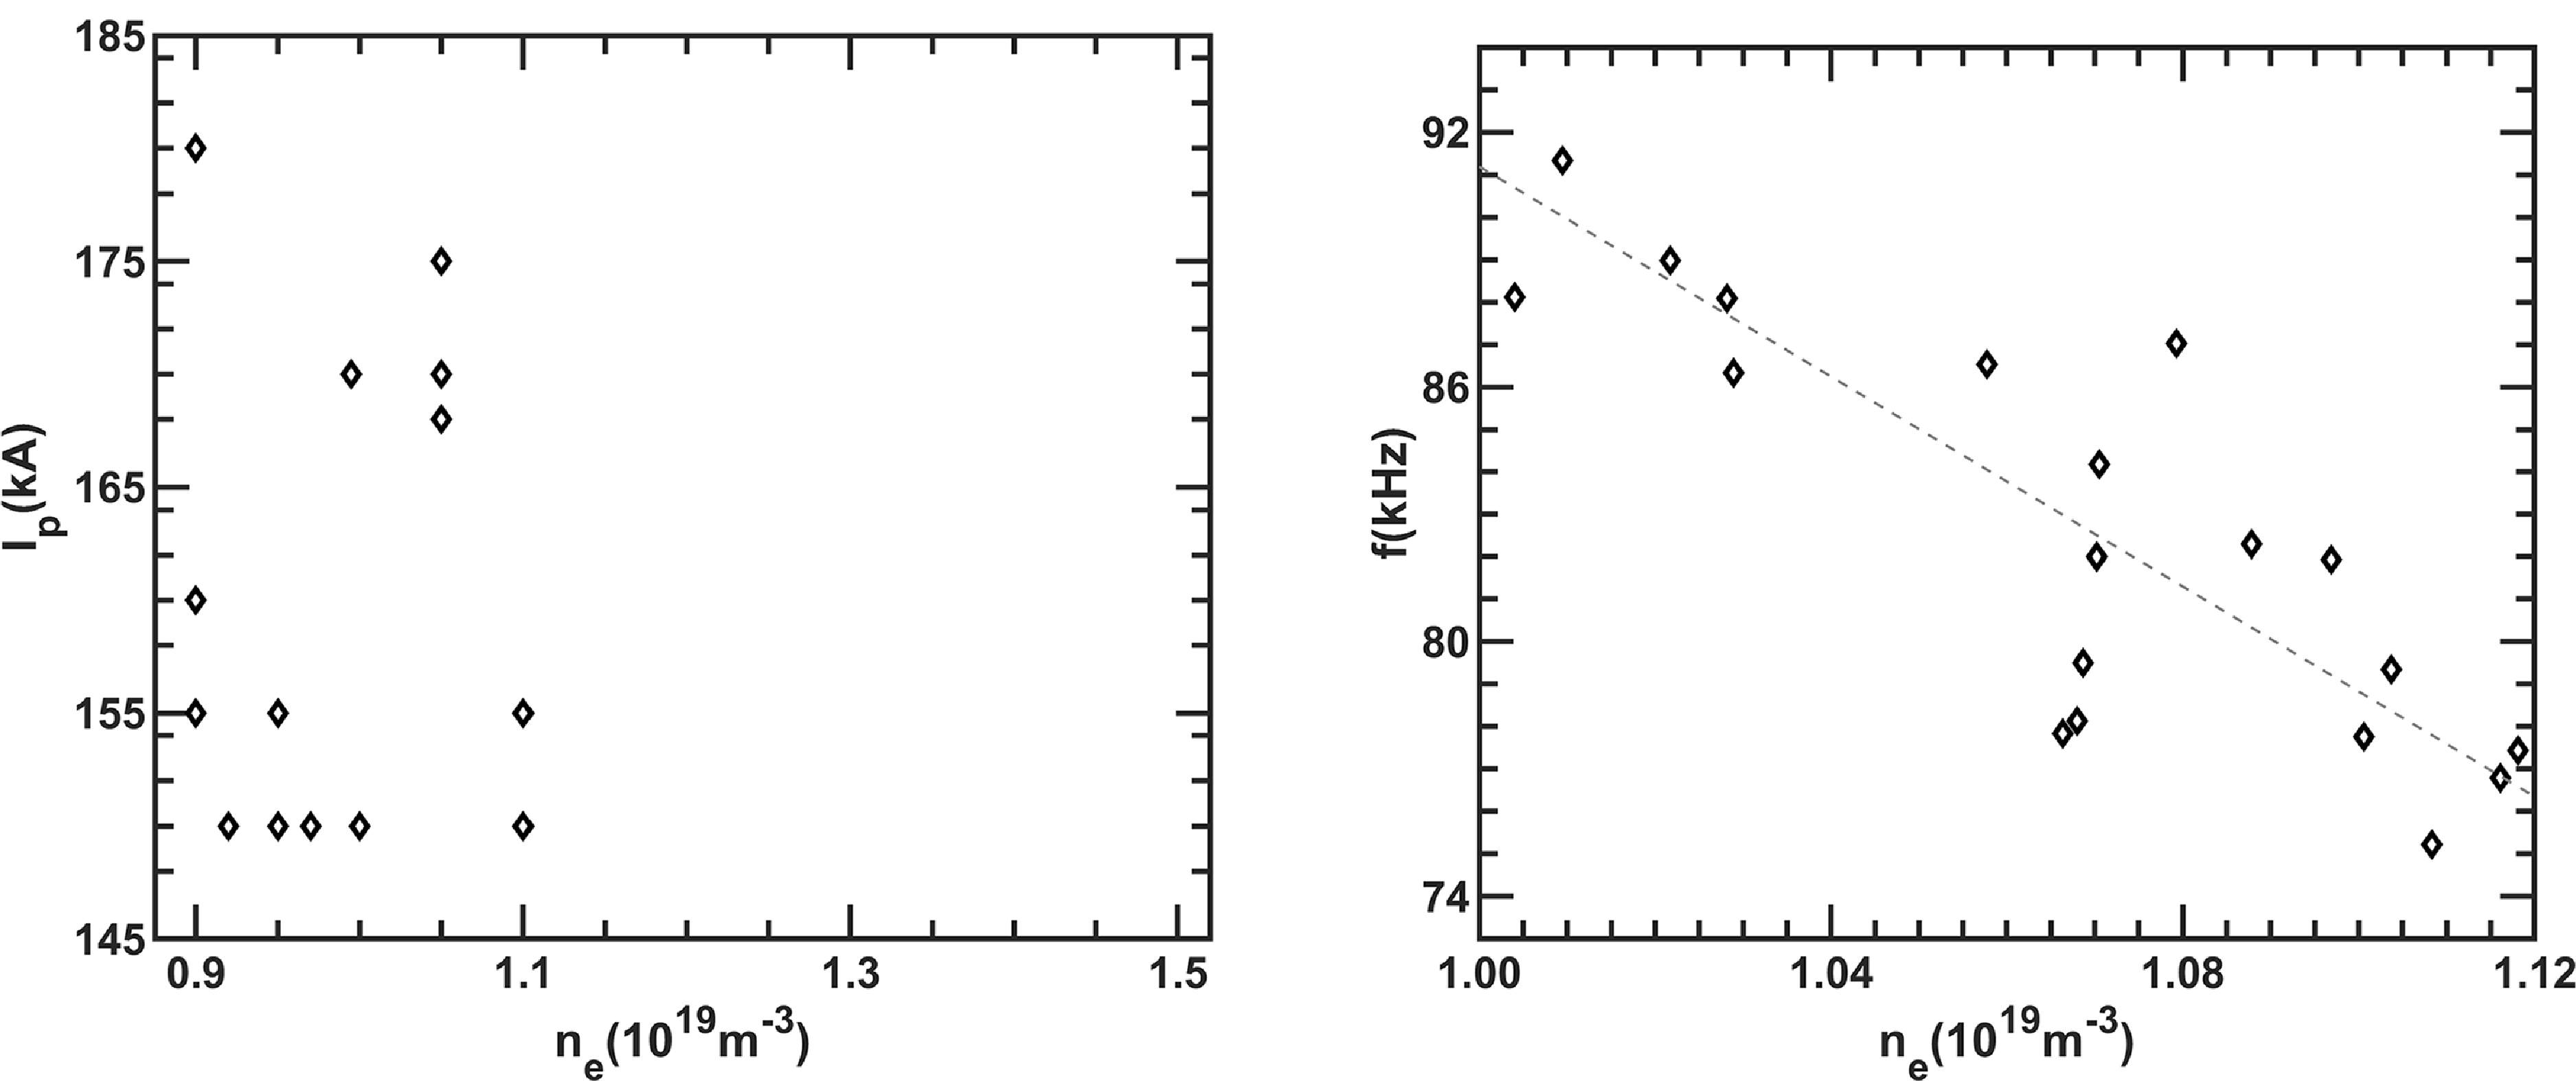
(Left) plasma current and electron density obtained from plasma with unstable modes, and (right) dependence of mode frequency on $n_e$
.
$n_e$
.

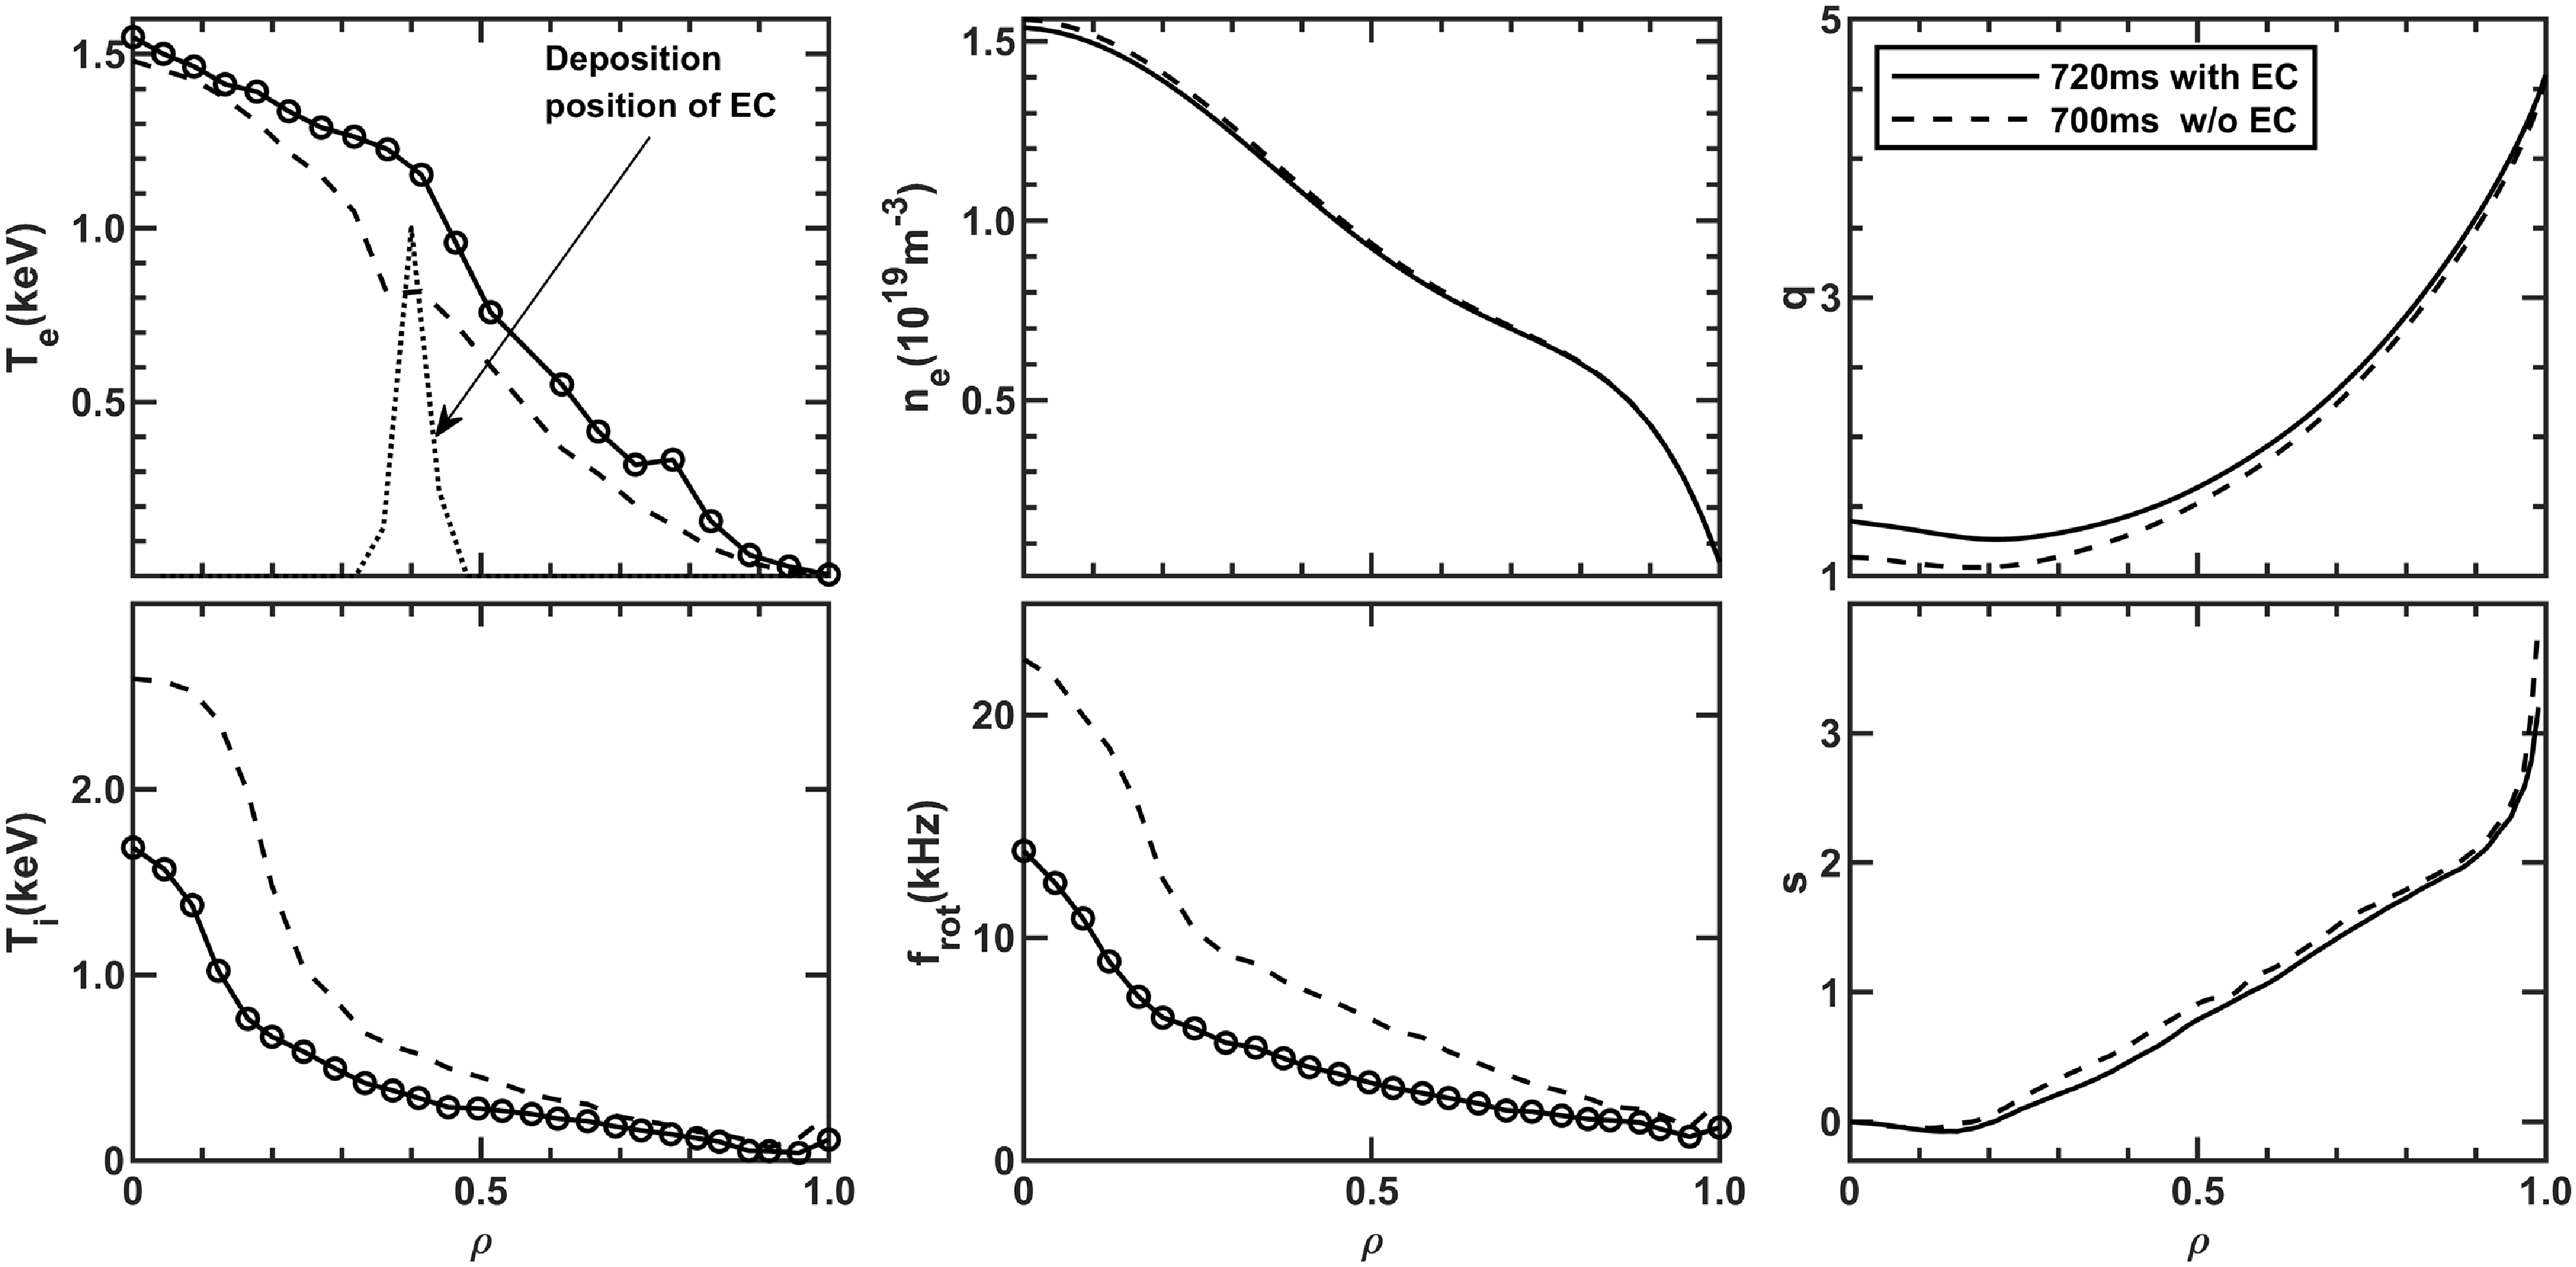
Radial profiles of electron temperature, electron density, safety factor $q$
, ion temperature, rotation frequency and magnetic shear
$q$
, ion temperature, rotation frequency and magnetic shear $s$
during the 27 527 discharge. The solid and dotted curves represent data from different moments at 700 ms (without ECRH) and 720 ms (with ECRH).
$s$
during the 27 527 discharge. The solid and dotted curves represent data from different moments at 700 ms (without ECRH) and 720 ms (with ECRH).

frequency declines gradually when $T_e/T_i$
changes form 1.4 to 2.0. Therefore, those modes should not be BAEs with mode frequency scaling with
$T_e/T_i$
changes form 1.4 to 2.0. Therefore, those modes should not be BAEs with mode frequency scaling with $\sqrt {T_e/T_i}$
. The line-averaged electron densities and plasma currents in HL-2A plasma with the electromagnetic modes are given in figure 6. The densities are always lower than
$\sqrt {T_e/T_i}$
. The line-averaged electron densities and plasma currents in HL-2A plasma with the electromagnetic modes are given in figure 6. The densities are always lower than $1.1\times 10^{19}\,\rm m^{-3}$
(corresponding to a Greenward fraction of
$1.1\times 10^{19}\,\rm m^{-3}$
(corresponding to a Greenward fraction of $f_{Gr}\leq 0.3$
) when those modes are excited. In other words, a low electron density is beneficial to the mode excitation. The evolution of the experimental frequency is also affected by the electron density. A drop in mode frequency is observed following an increase in
$f_{Gr}\leq 0.3$
) when those modes are excited. In other words, a low electron density is beneficial to the mode excitation. The evolution of the experimental frequency is also affected by the electron density. A drop in mode frequency is observed following an increase in $n_e$
. This experimental evidence suggests that the mode excitation and evolution strongly depend on
$n_e$
. This experimental evidence suggests that the mode excitation and evolution strongly depend on $|\boldsymbol{\nabla }T_i|$
,
$|\boldsymbol{\nabla }T_i|$
, $T_e/T_i$
as well as
$T_e/T_i$
as well as $n_e$
. So we can come to the conclusion that the electromagnetic modes belong to a kind of instability driven by thermal ions rather then energetic particles. The equilibrium profiles at 700 ms (without ECRH) and 720 ms (with ECRH) during the 27 527 discharge are shown as figure 7. Here, the
$n_e$
. So we can come to the conclusion that the electromagnetic modes belong to a kind of instability driven by thermal ions rather then energetic particles. The equilibrium profiles at 700 ms (without ECRH) and 720 ms (with ECRH) during the 27 527 discharge are shown as figure 7. Here, the $T_e$
profile consists of data from a ECE radiometer, the
$T_e$
profile consists of data from a ECE radiometer, the $n_e$
profile is obtained from a laser interferometer,
$n_e$
profile is obtained from a laser interferometer, $T_i$
and
$T_i$
and $f_{rot}$
are measured by a charge exchange recombination spectroscopy and the
$f_{rot}$
are measured by a charge exchange recombination spectroscopy and the $q$
profile is reconstructed by the ONETWO code based on the first four parameters. The
$q$
profile is reconstructed by the ONETWO code based on the first four parameters. The $n_e$
profiles do not change much at the two moments because the pump-out effect of ECRH is very weak and it causes only a small drop (no more than
$n_e$
profiles do not change much at the two moments because the pump-out effect of ECRH is very weak and it causes only a small drop (no more than $0.05\times 10^{19}\,\rm m^{-3}$
) in line-averaged density. A strong ITB is observed in the ion temperature at 700 ms. Great drops of
$0.05\times 10^{19}\,\rm m^{-3}$
) in line-averaged density. A strong ITB is observed in the ion temperature at 700 ms. Great drops of $T_i$
and
$T_i$
and $f_{rot}$
at the core region appear at 720 ms, and the strong ITB becomes weaker. Although the electron temperatures at the axis are comparable at the two moments, great changes in
$f_{rot}$
at the core region appear at 720 ms, and the strong ITB becomes weaker. Although the electron temperatures at the axis are comparable at the two moments, great changes in $T_e$
profiles are also found at the outer region because the off-axis heating mainly contributes to the increase of
$T_e$
profiles are also found at the outer region because the off-axis heating mainly contributes to the increase of $T_e$
at the region outside the deposition location of ECRH. The reconstructed
$T_e$
at the region outside the deposition location of ECRH. The reconstructed $q$
profiles are non-monotonic and the minimum safety factor
$q$
profiles are non-monotonic and the minimum safety factor $q_{min}$
is smaller (larger) than unity at 700 ms (720 ms). The increase of
$q_{min}$
is smaller (larger) than unity at 700 ms (720 ms). The increase of $q$
is mainly cause by the ECRH, which leads to a drop in pressure gradient by changing
$q$
is mainly cause by the ECRH, which leads to a drop in pressure gradient by changing $n_e$
,
$n_e$
, $T_e$
and
$T_e$
and $T_i$
, and then a declining current density. It should be noted that there are no reversed shear Alfvén eigenmodes (RSAE) in the 27 527 discharge with a reversed magnetic shear. This may because the fast ion drive does not exceed the inherent damping of RSAE. Due to the absence of diagnostics for plasma current measurement in the core region, an error in the safety factor profile is expected. It will only affect the mode frequency if there is an error in the value of
$T_i$
, and then a declining current density. It should be noted that there are no reversed shear Alfvén eigenmodes (RSAE) in the 27 527 discharge with a reversed magnetic shear. This may because the fast ion drive does not exceed the inherent damping of RSAE. Due to the absence of diagnostics for plasma current measurement in the core region, an error in the safety factor profile is expected. It will only affect the mode frequency if there is an error in the value of $q_{min}$
, but modifies the mode stability with a great error in the shape of the
$q_{min}$
, but modifies the mode stability with a great error in the shape of the $q$
-profile (Heidbrink et al. Reference Heidbrink2021). Figure 8 shows the evolution of electromagnetic modes in plasma with NBI, ECRH and LHW. Although an ITB is triggered and developed, no high-frequency electromagnetic modes are observed before the ECRH is turned on at 604 ms. These experimental phenomena suggest that electromagnetic modes are not linked to the formation of ITB, which may be triggered by changes of radial electric field shear and/or magnetic shear due to injection of a neutral beam (Ida et al. Reference Ida2018). Besides, the fishbone or long-lived modes may also contribute to the formation of ITB by generating zonal flow and causing
$q$
-profile (Heidbrink et al. Reference Heidbrink2021). Figure 8 shows the evolution of electromagnetic modes in plasma with NBI, ECRH and LHW. Although an ITB is triggered and developed, no high-frequency electromagnetic modes are observed before the ECRH is turned on at 604 ms. These experimental phenomena suggest that electromagnetic modes are not linked to the formation of ITB, which may be triggered by changes of radial electric field shear and/or magnetic shear due to injection of a neutral beam (Ida et al. Reference Ida2018). Besides, the fishbone or long-lived modes may also contribute to the formation of ITB by generating zonal flow and causing $E\times B$
shear exceeding the maximum growth rate of micro-scale turbulence (Liu et al. Reference Liu2020; Brochard et al. Reference Brochard2024; Garcia et al. Reference Garcia2024; Manini et al. Reference Manini2025). The electromagnetic modes appear at 604 ms and last for approximately 200 ms until the LHW system is turned on. Lower hybrid wave can not only degrade thermal ion confinement and lead to a great drop in
$E\times B$
shear exceeding the maximum growth rate of micro-scale turbulence (Liu et al. Reference Liu2020; Brochard et al. Reference Brochard2024; Garcia et al. Reference Garcia2024; Manini et al. Reference Manini2025). The electromagnetic modes appear at 604 ms and last for approximately 200 ms until the LHW system is turned on. Lower hybrid wave can not only degrade thermal ion confinement and lead to a great drop in $T_i$
and its gradient, but it also changes the plasma current and safety factor (Liang et al. Reference Liang2025). Therefore, the stability of electromagnetic modes may be closely related to changes of
$T_i$
and its gradient, but it also changes the plasma current and safety factor (Liang et al. Reference Liang2025). Therefore, the stability of electromagnetic modes may be closely related to changes of $T_i$
gradient and/or safety factor induced by LHW. Those electromagnetic modes are actually highly saturated in the experiment and thermal transport is possible (Xu et al. Reference Xu2023). It should be pointed out that those modes are driven unstable in the plasma with ECRH, and are always found to degrade ion energy confinement (Manini et al. Reference Manini2006). It is very difficult to make clear how the electromagnetic modes play a role in preventing the HL-2A plasma having a stronger ITB and achieving a higher ion temperature.
$T_i$
gradient and/or safety factor induced by LHW. Those electromagnetic modes are actually highly saturated in the experiment and thermal transport is possible (Xu et al. Reference Xu2023). It should be pointed out that those modes are driven unstable in the plasma with ECRH, and are always found to degrade ion energy confinement (Manini et al. Reference Manini2006). It is very difficult to make clear how the electromagnetic modes play a role in preventing the HL-2A plasma having a stronger ITB and achieving a higher ion temperature.
Electromagnetic modes in the ITB plasma: (a) spectrogram obtained from microwave interferometer, (b) ion temperature and (c) injected power of NBI, ECRH and LHW.

Spectrogram obtained from the $r=2.5$
channel on the soft X-ray array for six different discharges of (a) 27 210 with
$r=2.5$
channel on the soft X-ray array for six different discharges of (a) 27 210 with $B_t=1.22$
T and
$B_t=1.22$
T and $\rho _{EC}=0.02$
, (b) 27 526 with
$\rho _{EC}=0.02$
, (b) 27 526 with $B_t=1.31$
T and
$B_t=1.31$
T and $\rho _{EC}=0.32$
, (c) 27 529 with
$\rho _{EC}=0.32$
, (c) 27 529 with $B_t=1.34$
T and
$B_t=1.34$
T and $\rho _{EC}=0.427$
, (d) 27 529 with
$\rho _{EC}=0.427$
, (d) 27 529 with $B_t=1.36$
T and
$B_t=1.36$
T and $\rho _{EC}=0.6$
, (e) 27 531 with
$\rho _{EC}=0.6$
, (e) 27 531 with $B_t=1.4$
T and
$B_t=1.4$
T and $\rho _{EC}=0.63$
, (f) 27 532 with
$\rho _{EC}=0.63$
, (f) 27 532 with $B_t=1.41$
T and
$B_t=1.41$
T and $\rho _{EC}=0.66$
. The grey, blue, black and red curves are waveforms of
$\rho _{EC}=0.66$
. The grey, blue, black and red curves are waveforms of $I_p(kA)$
,
$I_p(kA)$
, $100\times n_e(10^{19}\text{m}^{-3})$
, power of ECRH and NBI, i.e.
$100\times n_e(10^{19}\text{m}^{-3})$
, power of ECRH and NBI, i.e. $P_{EC}(10\,\text{kW})$
and
$P_{EC}(10\,\text{kW})$
and $P_{NBI}(20\,\text{kW})$
.
$P_{NBI}(20\,\text{kW})$
.

Effect of ECRH on electromagnetic modes during 25 843 and 25 845 discharges: waveform of ECRH and density fluctuation obtained from a numerical filter with a frequency of (a) 80–90 kHz and (c) 90–100 kHz; spectrogram given by microwave interferometer are arranged in (b) and (d). Temporal evolution of $n_e$
and
$n_e$
and $T_i$
, waveform of gas puffing and ECRH are shown in second and fourth panels. Here,
$T_i$
, waveform of gas puffing and ECRH are shown in second and fourth panels. Here, $B_t=1.40\,\text{T}$
and
$B_t=1.40\,\text{T}$
and $P_{NBI}=0.6\,\text{MW}$
are given in the power modulation experiments. Note that, the filtering frequencies of (a) 80–90 kHz and (c) 90–100 kHz correspond to the experimental frequency of AITG modes with the largest amplitude in (b) and (d).
$P_{NBI}=0.6\,\text{MW}$
are given in the power modulation experiments. Note that, the filtering frequencies of (a) 80–90 kHz and (c) 90–100 kHz correspond to the experimental frequency of AITG modes with the largest amplitude in (b) and (d).

3.2. Effects of ECRH on AITG modes
The above evidence reveals that ECRH plays an important role in the excitation and evolution of electromagnetic modes. To further reveal the relationship between ECRH and the interesting modes, deposition locations of ECRH are changed by a $B_t$
scan while the ECRH power is fixed as 1000 kW. Other parameters are also keep unchanged during the
$B_t$
scan while the ECRH power is fixed as 1000 kW. Other parameters are also keep unchanged during the $B_t$
scan experiment. The plasma current is set as
$B_t$
scan experiment. The plasma current is set as $I_p\simeq 150\,\text{kA}$
, electron density remains as
$I_p\simeq 150\,\text{kA}$
, electron density remains as $n_e\simeq 1.0\times 10^{19}\,\text{m}^{-3}$
and the NBI system is operated with a power of
$n_e\simeq 1.0\times 10^{19}\,\text{m}^{-3}$
and the NBI system is operated with a power of $P_{NBI}\simeq 800{-}1100\,\text{kW}$
during
$P_{NBI}\simeq 800{-}1100\,\text{kW}$
during $t=500{-}1000\,\text{ms}$
. the corresponding results are given in figure 9. Interestingly, the electromagnetic instability is driven unstable only when ECRH and NBI are simultaneously injected into the plasma with
$t=500{-}1000\,\text{ms}$
. the corresponding results are given in figure 9. Interestingly, the electromagnetic instability is driven unstable only when ECRH and NBI are simultaneously injected into the plasma with $B_t\geq 1.34\,\text{T}$
(the deposition location of 68 GHz ECRH is approximately
$B_t\geq 1.34\,\text{T}$
(the deposition location of 68 GHz ECRH is approximately $\rho \leq 0.427$
). Decline in
$\rho \leq 0.427$
). Decline in $n_e$
and weak perturbation in
$n_e$
and weak perturbation in $I_p$
appear during injection of ECRH. The former is caused by the pump-out effect of RCEH while the latter may indicate a change of safety factor. However, accurate
$I_p$
appear during injection of ECRH. The former is caused by the pump-out effect of RCEH while the latter may indicate a change of safety factor. However, accurate $q$
profiles are unavailable due to a lack of the motional Stark effect diagnostic or interferometer polarimeter. A power modulation experiment is also designed to find out the ECRH power threshold for mode excitation, and the results are shown in figure 10. There are 4 gyrotrons during the experiment, where a gyrotron works with an unchanged power of 300 kW while other three operate with a period of 30 ms and a total power of 1200 kW. The power threshold is proved to be very low, since electromagnetic modes can be detected in the two case of
$q$
profiles are unavailable due to a lack of the motional Stark effect diagnostic or interferometer polarimeter. A power modulation experiment is also designed to find out the ECRH power threshold for mode excitation, and the results are shown in figure 10. There are 4 gyrotrons during the experiment, where a gyrotron works with an unchanged power of 300 kW while other three operate with a period of 30 ms and a total power of 1200 kW. The power threshold is proved to be very low, since electromagnetic modes can be detected in the two case of $P_{EC}=300\,\text{kW}$
and
$P_{EC}=300\,\text{kW}$
and $P_{EC}=1500\,\text{kW}$
. In the 25 843 discharge, the mode frequency of electromagnetic instability becomes higher accompanied with a drop of
$P_{EC}=1500\,\text{kW}$
. In the 25 843 discharge, the mode frequency of electromagnetic instability becomes higher accompanied with a drop of $T_i$
and an increase in
$T_i$
and an increase in $n_e$
induced by gap puffing and/or ECRH. Thus, those modes should be AITG modes rather than BAEs. More interestingly, the mitigation effect of ECRH on the AITG mode has been achieved in the experiment. Density fluctuation (
$n_e$
induced by gap puffing and/or ECRH. Thus, those modes should be AITG modes rather than BAEs. More interestingly, the mitigation effect of ECRH on the AITG mode has been achieved in the experiment. Density fluctuation ( $\delta n_e$
) induced by the electromagnetic instability becomes weaker (stronger) when the 1200 kW ECRH is turned on (turned off). Low level of
$\delta n_e$
) induced by the electromagnetic instability becomes weaker (stronger) when the 1200 kW ECRH is turned on (turned off). Low level of $\delta n_e$
is found without 1200 kW ECRH and an increase of
$\delta n_e$
is found without 1200 kW ECRH and an increase of $\delta n_e$
can also be observed during radio-frequency heating. It may suggest a complex stabilisation mechanism for the pressure gradient-driven AITG modes. In the 25 845 discharge, a transition from the long-lived mode to the fishbone mode occurs when the high-power RF wave is injected. Since positive and weak magnetic shears are favourable for the excitation of the long-lived mode but a reversed shear is more crucial for the fishbone modes (Chapman et al. Reference Chapman2010; Chen et al. Reference Chen2010, Reference Chen2018b
). So the mode transition may indicate a change in safety factor or magnetic shear. In other words, the ECRH may mitigate AITG modes by firstly changing the local
$\delta n_e$
can also be observed during radio-frequency heating. It may suggest a complex stabilisation mechanism for the pressure gradient-driven AITG modes. In the 25 845 discharge, a transition from the long-lived mode to the fishbone mode occurs when the high-power RF wave is injected. Since positive and weak magnetic shears are favourable for the excitation of the long-lived mode but a reversed shear is more crucial for the fishbone modes (Chapman et al. Reference Chapman2010; Chen et al. Reference Chen2010, Reference Chen2018b
). So the mode transition may indicate a change in safety factor or magnetic shear. In other words, the ECRH may mitigate AITG modes by firstly changing the local $T_e$
,
$T_e$
, $T_i$
,
$T_i$
, $n_e$
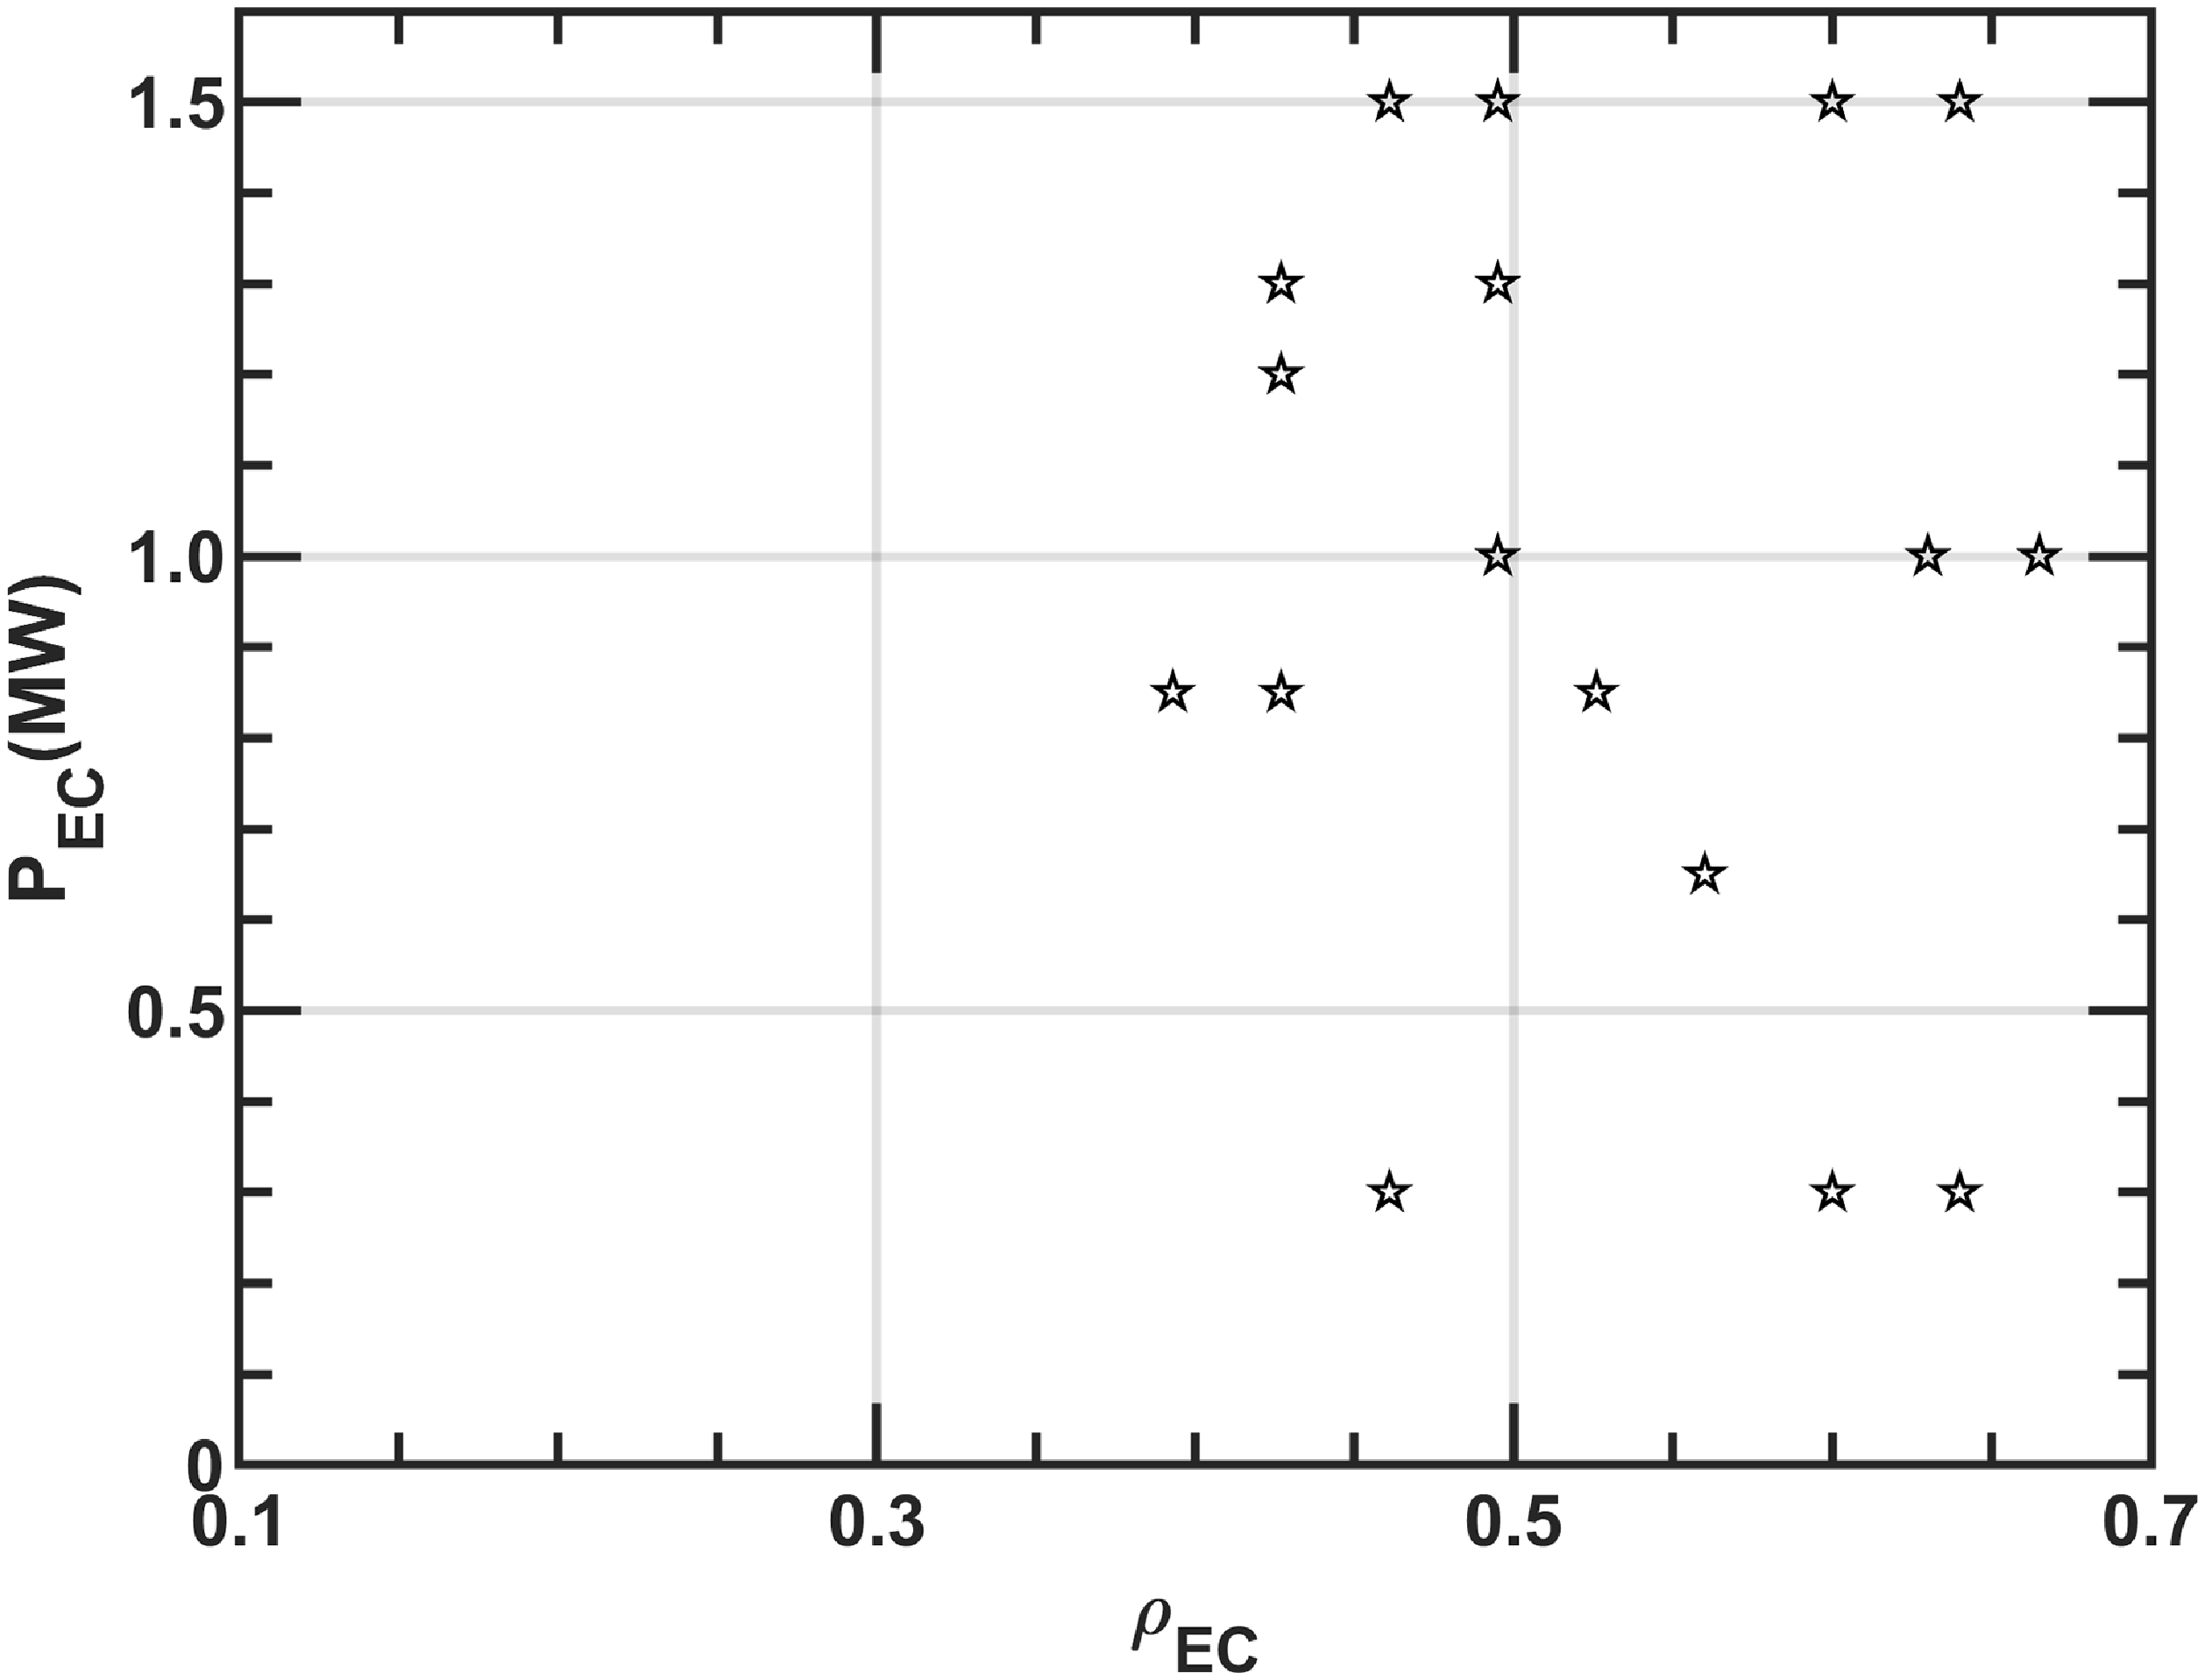
and plasma pressure, and then varying the safety factor or magnetic shear via the Grad–Shafranov equation, which describes a coupling of current density and plasma pressure (Shi et al. Reference Shi2023). Figure 11 presents the hearting power and deposition location of ECRH in the HL-2A discharges with electromagnetic modes. The interesting instability is unstable with
$n_e$
and plasma pressure, and then varying the safety factor or magnetic shear via the Grad–Shafranov equation, which describes a coupling of current density and plasma pressure (Shi et al. Reference Shi2023). Figure 11 presents the hearting power and deposition location of ECRH in the HL-2A discharges with electromagnetic modes. The interesting instability is unstable with $P_{EC}=0.3\,\text{MW}$
and it is also excited when
$P_{EC}=0.3\,\text{MW}$
and it is also excited when $P_{EC}$
is as high as 1.5 MW. However, no modes can be found in HL-2A plasma with a deposition location of ECRH in the region of
$P_{EC}$
is as high as 1.5 MW. However, no modes can be found in HL-2A plasma with a deposition location of ECRH in the region of $\rho _{EC}\leq 0.393$
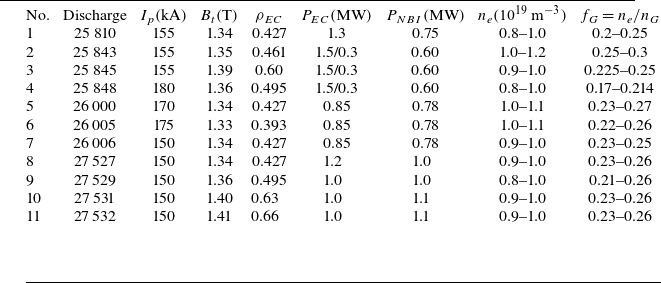
. The results suggest that the mode excitation is mainly regulated by an off-axis ECRH heating. As a summary of § 3, table 2 presents the experimental parameters during excitation of AITG modes. Simultaneous injection of off-axis ECRH and NBI and a low electron density are proved again to be needed for destabilisation of the electromagnetic instability.
$\rho _{EC}\leq 0.393$
. The results suggest that the mode excitation is mainly regulated by an off-axis ECRH heating. As a summary of § 3, table 2 presents the experimental parameters during excitation of AITG modes. Simultaneous injection of off-axis ECRH and NBI and a low electron density are proved again to be needed for destabilisation of the electromagnetic instability.
Power and deposition location of ECRH in the HL-2A discharges with the interesting electromagnetic modes. The data are obtained from multiple discharges.

Basic parameters during excitation of AITG modes.

4. Numerical analysis based on GFLDR
To explain the experimental phenomenon, theoretical analysis based on GFLDR has also been carried out with experimental inputs. For a local low-frequency shear Alfvén wave, the GFLDR can be written as (Zonca & Chen Reference Zonca and Chen2014a ,Reference Zonca and Chen b )
 \begin{equation} iS(\Lambda _n^2-k_{\parallel 0}^2q_{min}^2R_0^2)^{1/2}(1/n)^{1/2}[k_{\parallel 0}q_{min}R_0-i(\Lambda _n^2-k_{\parallel 0}^2q_{min}^2R_0^2)^{1/2}]^{1/2}=\delta W_{f}+\delta W_{k}. \end{equation}
Here, $k_{\parallel 0}=(nq_{min}-m)/q_{min}R_0$
,
$k_{\parallel 0}=(nq_{min}-m)/q_{min}R_0$
, $S=(r/q)[q^{\prime \prime }]^{1/2}$
and
$S=(r/q)[q^{\prime \prime }]^{1/2}$
and $q^{\prime \prime }$
is the second derivative of the safety factor and
$q^{\prime \prime }$
is the second derivative of the safety factor and $\delta W_{f}$
and
$\delta W_{f}$
and $\delta W_{k}$
are the fluid and kinetic contributions in the regular ideal region. The generalised inertia term
$\delta W_{k}$
are the fluid and kinetic contributions in the regular ideal region. The generalised inertia term $\varLambda _n$
, including both diamagnetic effects as well as kinetic effects, is given in Chavdarovski et al. (Reference Chavdarovski2009). Here, the kinetic effect specifically refers to the thermal ion compressibility, which arises from the dynamics of both well-passing and deeply trapped particles. For pressure gradient-driven instability, the term
$\varLambda _n$
, including both diamagnetic effects as well as kinetic effects, is given in Chavdarovski et al. (Reference Chavdarovski2009). Here, the kinetic effect specifically refers to the thermal ion compressibility, which arises from the dynamics of both well-passing and deeply trapped particles. For pressure gradient-driven instability, the term $\delta W_{k}$
can be negligible. In low-frequency limits (
$\delta W_{k}$
can be negligible. In low-frequency limits ( $0\lt \omega \lt \omega _{ti}$
),
$0\lt \omega \lt \omega _{ti}$
), $\delta W_{f}$
is described as (Ma et al. Reference Ma2022)
$\delta W_{f}$
is described as (Ma et al. Reference Ma2022)
 \begin{equation} \delta W_{nf}\simeq \frac {\pi }{4}\bigg(\frac {S^2k_{\parallel 0}q_{min}R_0}{n}-\frac {3}{2}\alpha ^2S\bigg|\frac {k_{\parallel 0}q_{min}R_0}{n}\bigg|^{1/2}+\frac {9}{32}\alpha ^4\bigg), \end{equation}
where $\alpha =-R_0q^2{\rm d}\beta /{\rm d}r$
and
$\alpha =-R_0q^2{\rm d}\beta /{\rm d}r$
and $\beta =\beta _i(1+T_e/T_i)$
.
$\beta =\beta _i(1+T_e/T_i)$
.
Dependence of mode frequency in laboratory frame ( $f_{lab}$
) and growth rate (
$f_{lab}$
) and growth rate ( $\gamma /2\pi$
) on
$\gamma /2\pi$
) on $\eta _i$
.
$\eta _i$
.

Dependence of mode frequency in laboratory frame ( $f_{lab}$
) and growth rate (
$f_{lab}$
) and growth rate ( $\gamma /2\pi$
) on
$\gamma /2\pi$
) on $T_e/T_i$
.
$T_e/T_i$
.

For local calculation at 720 ms during the 27 527 discharge, numerical inputs are evaluated at $\rho \simeq 0.161$
, where there is a minimum safety factor
$\rho \simeq 0.161$
, where there is a minimum safety factor $q_{min}$
and an ITB foot. The equilibrium profiles are shown in figure 7 and other detailed parameters are
$q_{min}$
and an ITB foot. The equilibrium profiles are shown in figure 7 and other detailed parameters are $(m, n)=(4, 3)$
,
$(m, n)=(4, 3)$
, $q_{min}=1.28$
,
$q_{min}=1.28$
, $R_0=1.658\,\text{m}$
,
$R_0=1.658\,\text{m}$
, $R=1.722\,\text{m}$
,
$R=1.722\,\text{m}$
, $s=-0.0017$
,
$s=-0.0017$
, $k_{\parallel 0}q_{min}R_0=-0.163$
,
$k_{\parallel 0}q_{min}R_0=-0.163$
, $k_\theta \rho _i=0.273$
,
$k_\theta \rho _i=0.273$
, $k_\theta \rho _e=0.0056$
,
$k_\theta \rho _e=0.0056$
, $\epsilon _i=0.304$
,
$\epsilon _i=0.304$
, $\beta _i=0.29\,\%$
,
$\beta _i=0.29\,\%$
, $\eta _i\equiv \boldsymbol{\nabla }\ln T_i/\boldsymbol{\nabla }\ln n_i=5.73$
,
$\eta _i\equiv \boldsymbol{\nabla }\ln T_i/\boldsymbol{\nabla }\ln n_i=5.73$
, $S=0.366$
and
$S=0.366$
and $\tau =1.52$
. Here,
$\tau =1.52$
. Here, $\rho _i$
and
$\rho _i$
and $\rho _e$
are the Larmor radii of ion and electrons, respectively. The ion transit frequency
$\rho _e$
are the Larmor radii of ion and electrons, respectively. The ion transit frequency $\omega _{ti}\equiv \sqrt {2T_i/m_i}/qR=3.417$
rad/s, the thermal ion diamagnetic drift frequency due to density gradient is
$\omega _{ti}\equiv \sqrt {2T_i/m_i}/qR=3.417$
rad/s, the thermal ion diamagnetic drift frequency due to density gradient is $\omega _{*ni}=0.596$
rad/s and
$\omega _{*ni}=0.596$
rad/s and $\omega _{*pi}=4.01$
rad/s. The value of
$\omega _{*pi}=4.01$
rad/s. The value of $\Omega _{*pi}=\omega _{*pi}/\omega _{ti}\simeq 1.17$
is comparable to
$\Omega _{*pi}=\omega _{*pi}/\omega _{ti}\simeq 1.17$
is comparable to $q\sqrt {7/4+\tau }\simeq 2.3$
. Besides,
$q\sqrt {7/4+\tau }\simeq 2.3$
. Besides, $\delta W_{f}$
is approximately
$\delta W_{f}$
is approximately $-0.0162$
. Thus, the AITG mode can be unstable for
$-0.0162$
. Thus, the AITG mode can be unstable for $\delta W_{f}\lt 0$
in the absence of energetic particles (Zonca et al. Reference Zonca1999). To examine the basic characteristics of pressure gradient-driven instability, a scan in
$\delta W_{f}\lt 0$
in the absence of energetic particles (Zonca et al. Reference Zonca1999). To examine the basic characteristics of pressure gradient-driven instability, a scan in $\eta _i$
is performed with fixed
$\eta _i$
is performed with fixed $S=0.366$
,
$S=0.366$
, $\tau =1.52$
and a local electron density of
$\tau =1.52$
and a local electron density of $n_e=1.4\times 10^{19}m^{-3}$
. Figure 12 reveals the dependence of mode frequency in the laboratory frame (
$n_e=1.4\times 10^{19}m^{-3}$
. Figure 12 reveals the dependence of mode frequency in the laboratory frame ( $f_{lab}$
) and growth rate (
$f_{lab}$
) and growth rate ( $\gamma /2\pi$
) on
$\gamma /2\pi$
) on $\eta _i$
. Beyond a critical threshold of
$\eta _i$
. Beyond a critical threshold of $\eta _i\geq 5.4$
, the growth rate becomes larger with an increase of
$\eta _i\geq 5.4$
, the growth rate becomes larger with an increase of $\eta _i$
, but the mode frequency remains almost fixed at
$\eta _i$
, but the mode frequency remains almost fixed at $91\,\text{kHz}$
, which agrees well with experimental frequency of
$91\,\text{kHz}$
, which agrees well with experimental frequency of $96\,\text{kHz}$
. Ion temperature is higher before the ECRH system is turned on, a larger
$96\,\text{kHz}$
. Ion temperature is higher before the ECRH system is turned on, a larger $T_i$
gradient or
$T_i$
gradient or $\eta _i$
is expected. But the AITG modes cannot be driven unstable. It may indicate that the excitations of AITG modes depend not only on
$\eta _i$
is expected. But the AITG modes cannot be driven unstable. It may indicate that the excitations of AITG modes depend not only on $\eta _i$
, but also on other parameters. Since both
$\eta _i$
, but also on other parameters. Since both $T_i$
and
$T_i$
and $T_e$
contribute to plasma pressure and are modified by ECRH, a scan of
$T_e$
contribute to plasma pressure and are modified by ECRH, a scan of $ T_e/T_i$
is needed. Here,
$ T_e/T_i$
is needed. Here, $S=0.336$
and
$S=0.336$
and $\eta _i=5.73$
,
$\eta _i=5.73$
, $T_e$
is fixed while
$T_e$
is fixed while $T_i$
changes in a moderate region. Interestingly, we also found a threshold of 1.28 in
$T_i$
changes in a moderate region. Interestingly, we also found a threshold of 1.28 in $T_e/T_i$
. When
$T_e/T_i$
. When $\tau$
exceeds this value, the AITG modes become more unstable, as shown in figure 13. The theoretical analysis provides a reasonable explanation for AITG mode excitation during the ECRH heating, which increases
$\tau$
exceeds this value, the AITG modes become more unstable, as shown in figure 13. The theoretical analysis provides a reasonable explanation for AITG mode excitation during the ECRH heating, which increases $T_e$
directly and causes a drop in
$T_e$
directly and causes a drop in $T_i$
. Note that
$T_i$
. Note that $T_e$
in the outer area increases more significantly in the case of off-axis heating. It may be one of the possible reasons for why AITG modes are usually excited in the plasma with an off-axis ECRH. Dependence of mode frequency in the laboratory frame and growth rate on
$T_e$
in the outer area increases more significantly in the case of off-axis heating. It may be one of the possible reasons for why AITG modes are usually excited in the plasma with an off-axis ECRH. Dependence of mode frequency in the laboratory frame and growth rate on $n_e$
is also given by the GFLDR calculation, as shown in figure 14. Both
$n_e$
is also given by the GFLDR calculation, as shown in figure 14. Both $f_{lab}$
and
$f_{lab}$
and $\gamma /2\pi$
become lower when
$\gamma /2\pi$
become lower when $n_e$
grows. It means that the AITG modes are more unstable in low density plasma. Furthermore, the frequency evolution given by theoretical calculation agrees well with experimental statistics in figure 6. As indicated in § 3, a change in safety factor or magnetic shear may also affect the mode stability. Since AITG modes have the same location as that of the minimum safety factor,
$n_e$
grows. It means that the AITG modes are more unstable in low density plasma. Furthermore, the frequency evolution given by theoretical calculation agrees well with experimental statistics in figure 6. As indicated in § 3, a change in safety factor or magnetic shear may also affect the mode stability. Since AITG modes have the same location as that of the minimum safety factor, $S$
, instead of
$S$
, instead of $s\simeq 0$
at one at the singular point, is used in the theoretical analysis. In the
$s\simeq 0$
at one at the singular point, is used in the theoretical analysis. In the $S$
scan case,
$S$
scan case, $\eta _i=5.73$
,
$\eta _i=5.73$
, $T_e/T_i=1.52$
,
$T_e/T_i=1.52$
, $n_e=1.4\times 10^{19}\,\text{m}^{-3}$
and the result is plotted in figure 15. Growth rate and frequency exhibit different features with an increase of
$n_e=1.4\times 10^{19}\,\text{m}^{-3}$
and the result is plotted in figure 15. Growth rate and frequency exhibit different features with an increase of $S$
. The former is directly proportional to
$S$
. The former is directly proportional to $S$
while the latter shows a completely different trend. The AITG modes become stable when
$S$
while the latter shows a completely different trend. The AITG modes become stable when $S$
reaches the critical value of 0.383. It may indicate that we can mitigate the AITG modes by active control of the safety profile in a future tokamak.
$S$
reaches the critical value of 0.383. It may indicate that we can mitigate the AITG modes by active control of the safety profile in a future tokamak.
Dependence of mode frequency in the laboratory frame ( $f_{lab}$
) and growth rate (
$f_{lab}$
) and growth rate ( $\gamma /2\pi$
) on
$\gamma /2\pi$
) on $n_e$
.
$n_e$
.

Dependence of mode frequency in the laboratory frame ( $f_{lab}$
) and growth rate (
$f_{lab}$
) and growth rate ( $\gamma /2\pi$
) on
$\gamma /2\pi$
) on $S$
.
$S$
.

5. Conclusion
Core-localised AITG modes are unstable in HL-2A plasma with simultaneous injection of NBI and off-axis ECRH. The ECRH is found to play an important role in the mode excitation and evolution by causing changes in $|\boldsymbol{\nabla }T_i|$
,
$|\boldsymbol{\nabla }T_i|$
, $T_e/T_i$
and
$T_e/T_i$
and $n_e$
. Further theoretical analysis based on GFLDR indicates that there are three thresholds of
$n_e$
. Further theoretical analysis based on GFLDR indicates that there are three thresholds of $\eta _i$
,
$\eta _i$
, $T_e/T_i$
and
$T_e/T_i$
and $S$
for the mode excitation. In our experiments, the NBI heats thermal ions and improves ion temperature, then results in
$S$
for the mode excitation. In our experiments, the NBI heats thermal ions and improves ion temperature, then results in $\eta _i$
exceeding the critical value of
$\eta _i$
exceeding the critical value of $\eta _{i,cri}\geq 5.4$
. The off-axis ECRH enhances AITG modes mainly by increasing
$\eta _{i,cri}\geq 5.4$
. The off-axis ECRH enhances AITG modes mainly by increasing $T_e$
and causing a drop in
$T_e$
and causing a drop in $T_i$
. Besides, the ECRH can also lead to a low density by the pump-out effect and drives the AITG modes. Last but not least, mitigation of AITG modes by ECRH is firstly achieved. But quantitative analysis for the underlying physical mechanism is quite difficult due to the complex effects of ECRH on plasma parameters and the limitation of diagnostics for current density measurement. More experiments should be proposed, especially for the effects of AITG modes on the plasma confinement. Besides, to quantitatively evaluate thermal transport by the AITG modes, gyrokinetic simulation should be carried out based on the experimental inputs in the future.
$T_i$
. Besides, the ECRH can also lead to a low density by the pump-out effect and drives the AITG modes. Last but not least, mitigation of AITG modes by ECRH is firstly achieved. But quantitative analysis for the underlying physical mechanism is quite difficult due to the complex effects of ECRH on plasma parameters and the limitation of diagnostics for current density measurement. More experiments should be proposed, especially for the effects of AITG modes on the plasma confinement. Besides, to quantitatively evaluate thermal transport by the AITG modes, gyrokinetic simulation should be carried out based on the experimental inputs in the future.
Acknowledgments
The authors would like to thank Professor L. Chen for his valuable suggestions and thank the HL-2A team for tokamak operations and technical assistances.
Editor Eleonora Viezzer thanks the referees for their advice in evaluating this article.
Funding
This work is supported by National Key R&D Program of China (Grants No. 2024YFE03050004), National Natural Science Foundation of China (Grants Nos. 12125502, 12375211, 12175053, 12261131622), Italian Ministry of Foreign Affairs (Grant No. CN23GR02), Sichuan Science and Technology Program (Grants No. 2024ZYD0187), Natural Science Foundation of Sichuan (Grant No. 2025NSFSC0064) and Innovation Program of Southwestern Institute of Physics (Grants No. 202301XWCX001).
Declaration of interests
The authors have no conflicts to disclose.


 Open access