

I. INTRODUCTION
In view of the increasing progress and development of three-dimensional (3D) scanning and rendering devices, acquisition and display of free viewpoint video (FVV) has become viable [Reference Alexiadis, Zarpalas and Daras1–Reference Schwarz4]. This type of visual data representation describes 3D scenes through geometry information (shape, size, position in 3D-space) and associated attributes (e.g. color, reflectance), plus any temporal changes. FVV can be displayed in head-mounted devices, unleashing a great potential for innovations in virtual, augmented, and mixed reality applications. Industrial partners and manufacturers have expressed relevant interest in extending technologies available in consumer market with the possibility to represent real-world scenarios in three dimensions. In this direction, high quality immersive information and communication systems (e.g. tele-presence), 3D sensing for smart cities, robotics, and autonomous driving, are just some of the possible developments that can be envisioned to dominate in the near future.
There are several alternatives of advanced content representations that could be employed in such application scenarios. Point cloud imaging is well-suited for richer simulations in real-time because of the relatively low complexity and high efficiency in capturing, encoding, and rendering of 3D models; a thorough summary of target applications can be found in a recent JPEG document “Use cases and requirements” [Reference Perry5]. Yet, the vast amount of information that is typically required to represent this type of contents indicates the necessity for efficient data representations and compression algorithms. Lossy compression solutions, although able to drastically reduce the amount of data and by extension the costs in processing, storage, and transmission, come at the expense of visual degradations. In order to address the trade-off between data size and visual quality or evaluate the efficiency of an encoding solution, quality assessment of decompressed contents is of paramount importance. In this context, visual quality can be assessed through either objective or subjective means. The former is performed by algorithms that provide predictions, while the latter, although costly and time-consuming, is widely accepted to unveil the ground-truth for the perceived quality of a degraded model.
In the field of quality assessment of point clouds, there are several studies reported in the literature [Reference Zhang, Huang, Zhu and Hwang6–Reference Meynet, Digne and Lavoué27]. However, previous efforts have been focused on evaluating a limited number of compression solutions (one or two), while even less have been devoted to the evaluation of the latest developments in standardization bodies. This paper aims at carrying a large-scale benchmarking of geometry and color compression algorithms as implemented in the current versions of the MPEG test models, namely, V-PCC (Video-based Point Cloud Compression [Reference Mammou28]) and G-PCC (Geometry-based Point Cloud Compression [Reference Mammou, Chou, Flynn and Krivokuća29]) codecs, using both objective and subjective quality assessment methodologies. Furthermore, different rate allocation schemes for geometry and texture encoding are analyzed and tested to draw conclusions on the best-performing approach in terms of perceived quality for a given bit rate. The results of such a comprehensive evaluation provide useful insights for future development, or improvements of existing compression solutions.
The contributions of this paper can be summarized as follows:
– Open source renderer developed using the Three.js libraryFootnote 1. The software supports visualization of point cloud contents with real-time interaction, which can be optionally recorded. The rendering parameters can be easily configured, while the source code can be adjusted and extended to host subjective tests under different evaluation protocols. The repository with an open-source implementation of the renderer is given in the following URL: https://github.com/mmspg/point-cloud-web-renderer.
– Benchmarking of the emerging MPEG point cloud compression test models, under test conditions that were dictated by the standardization body, using both subjective and objective quality assessment methodologies. Moreover, using human opinions as ground-truth, the study provides a reliable performance evaluation of existing objective metrics under a wide range of compression distortions.
– Analysis of best practices for rate allocation for geometry and texture encoding in point cloud compression. The results indicate the observers' preferences over impairments that are introduced by different encoding configurations, and might be used as roadmap for future improvements.
– Publicly available dataset of objective and subjective quality scores associated with widely popular point cloud contents of diverse characteristics degraded by state-of-the-art compression algorithms. This material can be used to train and benchmark new objective quality metrics. The dataset can be found in the following URL: https://mmspg.epfl.ch/downloads/quality-assessment-for-point-cloud-compression/.
The paper is structured as follows: Section II provides an overview of related work in point cloud quality assessment. In Section III, the framework behind the research that was carried out is presented and details about the developed point cloud renderer are provided. The test space and conditions, the content selection and preparation, and an outline of the codecs that were evaluated in this study are presented in Section IV. In Section V, the experiment that was conducted to benchmark the encoding solutions is described, and the results of both subjective and objective quality evaluation are reported. In Sections VII and VIII, different rate allocations of geometry and color information are compared in order to search for preferences and rejections for the different techniques and configurations under assessment. Finally the conclusions are presented in Section VIII.
II. RELATED WORK
Quality evaluation methodologies for 3D model representations were initially introduced and applied on polygonal meshes, which has been the prevailing form in the field of computer graphics. Subjective tests to obtain ground-truth data for visual quality of static geometry-only mesh models under simplification [Reference Watson, Friedman and McGaffey30–Reference Pan, Cheng and Basu32], noise addition [Reference Lavoué33] and smoothing [Reference Lavoué, Gelasca, Dupont, Baskurt and Ebrahimi34], watermarking [Reference Gelasca, Ebrahimi, Corsini and Barni35,Reference Corsini, Gelasca, Ebrahimi and Barni36], and position quantization [Reference Vás̆a and Rus37] artifacts have been conducted in the past. In a more recent study [Reference Guo, Vidal, Cheng, Basu, Baskurt and Lavoué38], the perceived quality of textured models subject to geometry and color degradations was assessed. Yet, the majority of the efforts on quality assessment has been devoted on the development of objective metrics, which can be classified as: (a) image-based, and (b) model-based predictors [Reference Lavoué and Mantiuk39]. Widely-used model-based algorithms rely on simple geometric projected errors (i.e. Hausdorff distance or Root-Mean-Squared error), dihedral angles [Reference Vás̆a and Rus37], curvature statistics [Reference Lavoué, Gelasca, Dupont, Baskurt and Ebrahimi34,Reference Torkhani, Wang and Chassery40] computed at multiple resolutions [Reference Lavoué41], Geometric Laplacian [Reference Karni and Gotsman42,Reference Sorkine, Cohen-Or and Toledo43], per-model roughness measurements [Reference Corsini, Gelasca, Ebrahimi and Barni36,Reference Wang, Torkhani and Montanvert44], or strain energy [Reference Bian, Hu and Martin45]. Image-based metrics on 3D meshes were introduced for perceptually-based tasks, such as mesh simplification [Reference Lindstrom and Turk46,Reference Qu and Meyer47]. However, only recently the performance of such metrics was benchmarked and compared to the model-based approaches in [Reference Lavoué, Larabi and Vás̆a48]. The reader can refer to [Reference Lavoué and Mantiuk39,Reference Bulbul, Capin, Lavoué and Preda49,Reference Corsini, Larabi, Lavoué, Petr̆ík, Vás̆a and Wang50] for excellent reviews of subjective and objective quality assessment methodologies on 3D mesh contents.
The rest of this section is focused on the state-of-the-art in point cloud quality assessment. In a first part, subjective evaluation studies are detailed and notable outcomes are presented, whilst in a second part, the working principles of current objective quality methodologies are described and their advantages and weaknesses are highlighted.
A) Subjective quality assessment
The first subjective evaluation study for point clouds reported in the literature was conducted by Zhang et al. [Reference Zhang, Huang, Zhu and Hwang6], in an effort to assess the visual quality of models at different geometric resolutions, and different levels of noise introduced in both geometry and color. For the former, several down-sampling factors were selected to increase sparsity, while for the latter, uniformly distributed noise was applied to the coordinates, or the color attributes of the reference models. In these experiments, raw point clouds were displayed in a flat screen that was installed on a desktop set-up. The results showed an almost linear relationship between the down-sampling factor and the visual quality ratings, while color distortions were found to be less severe when compared to geometric degradations.
Mekuria et al. [Reference Mekuria, Blom and Cesar7] proposed a 3D tele-immersive system in which the users were able to interact with naturalistic (dynamic point cloud) and synthetic (computer generated) models in a virtual scene. The subjects were able to navigate in the virtual environment through the use of the mouse cursor in a desktop setting. The proposed encoding solution that was employed to compress the naturalistic contents of the scene was assessed in this mixed reality application, among several other aspects of quality (e.g. level of immersiveness and realism).
In [Reference Mekuria, Laserre and Tulvan8], performance results of the codec presented in [Reference Mekuria, Blom and Cesar7] are reported, from a quality assessment campaign that was conducted in the framework of the Call for Proposals [9] issued by the MPEG committee. Both static and dynamic point cloud models were evaluated under several encoding categories, settings, and bit rates. A passive subjective inspection protocol was adopted, and animated image sequences of the models captured from predefined viewpoints were generated. The point clouds were rendered using cubes as primitive elements of fixed size across a model. This study aims at providing a performance benchmark for a well-established encoding solution and evaluation framework.
Javaheri et al. [Reference Javaheri, Brites, Pereira and Ascenso10] performed a quality assessment study of position denoising algorithms. Initially, impulse noise was added to the models to simulate outlier errors. After outlier removal, different levels of Gaussian noise were introduced to mimic sensor imprecisions. Then, two denoising algorithms, namely Tikhonov and total variation regularization, were evaluated. For rendering purposes, the screened Poisson surface reconstruction [Reference Kazhdan and Hoppe51] was employed. The resulting mesh models were captured by different viewpoints from a virtual camera, forming video sequences that were visualized by human subjects.
In [Reference Javaheri, Brites, Pereira and Ascenso11], the visual quality of colored point clouds under octree- and graph-based geometry encoding was evaluated, both subjectively and objectively. The color attributes of the models remained uncompressed to assess the impact of geometry-based degradations; that is, sparser content representations are obtained from the first, while blocking artifacts are perceived from the latter. Static models representing both objects and human figures were selected and assessed at three quality levels. Cubic geometric primitives of adaptive size based on local neighborhoods were employed for rendering purposes. A spiral camera path moving around a model (i.e. from a full view to a closer look) was defined to capture images from different perspectives. Animated sequences of the distorted and the corresponding reference models were generated and passively consumed by the subjects, sequentially. This is the first study with benchmarking results on more than one compression algorithms.
Alexiou et al. [Reference Alexiou and Ebrahimi12,Reference Alexiou and Ebrahimi13] proposed interactive variants of existing evaluation methodologies in a desktop set-up to assess the quality of geometry-only point cloud models. In both studies, Gaussian noise and octree-pruning was employed to simulate position errors from sensor inaccuracies and compression artifacts, respectively, to account for degradations of different nature. The models were simultaneously rendered as raw point clouds side-by-side, while human subjects were able to interact without timing constraints before grading the visual quality of the models. These were the first attempts dedicated to evaluate the prediction power of metrics existing at the time. In [Reference Alexiou, Upenik and Ebrahimi14], the same authors extended their efforts by proposing an augmented reality (AR) evaluation scenario using a head-mounted display. In the latter framework, the observers were able to interact with the virtual assets with 6 degrees-of-freedom by physical movements in the real-world. A rigorous statistical analysis between the two experiments [Reference Alexiou and Ebrahimi13,Reference Alexiou, Upenik and Ebrahimi14] is reported in [Reference Alexiou and Ebrahimi15], revealing different rating trends under the usage of different test equipment as a function of the degradation type under assessment. Moreover, influencing factors are identified and discussed. A dataset containing the stimuli and corresponding subjective scores from the aforementioned studies, has been recently releasedFootnote 2.
In [Reference Alexiou16] subjective evaluation experiments were conducted in five different test laboratories to assess the visual quality of colorless point clouds, enabling the screened Poisson surface reconstruction algorithm [Reference Kazhdan and Hoppe51] as a rendering methodology. The contents were degraded using octree-pruning, and the observers visualized the mesh models in a passive way. Although different 2D monitors were employed by the participating laboratories, the collected subjective scores were found to be strongly correlated. Moreover, statistical differences between the scores collected in this experiment and the subjective evaluation conducted in [Reference Alexiou and Ebrahimi13] indicated that different visual data representations of the same stimuli might lead to different conclusions. In [Reference Alexiou17], an identical experimental design was used, with human subjects consuming the reconstructed mesh models through various 3D display types/technologies (i.e. passive, active, and auto-stereoscopic), showing very high correlation and very similar rating trends with respect to previous efforts [Reference Alexiou16]. These results suggest that human judgments on such degraded models are not significantly affected by the display equipment.
In [Reference Torlig, Alexiou, Fonseca, de Queiroz and Ebrahimi18], the visual quality of voxelized colored point clouds was assessed in subjective experiments that were performed in two intercontinental laboratories. The voxelization of the contents was performed in real-time, and orthographic projections of both the reference and the distorted models were shown side-by-side to the subjects in an interactive platform that was developed and described. Point cloud models representing both inanimate objects and human figures were encoded after combining different geometry and color degradation levels using the codec described in [Reference Mekuria, Blom and Cesar7]. The results showed that subjects rate more severely degradations on human models. Moreover, using this encoder, marginal gains are observed with color improvements at low geometric resolutions, indicating that the visual quality is rather limited at high levels of sparsity. Finally, this is the first study conducting performance evaluation of projection-based metrics on point cloud models; that is, predictors based on 2D imaging algorithms applied on projected views of the models.
In [Reference Alexiou and Ebrahimi19], identically degraded models as in [Reference Torlig, Alexiou, Fonseca, de Queiroz and Ebrahimi18] were assessed using a different rendering scheme. In particular, the point clouds were rendered using cubes as primitive geometric shapes of adaptive sizes based on local neighborhoods. The models were assessed in an interactive renderer, with the user's behavior also recorded. The logged interactivity information was analyzed and used to identify important perspectives of the models under assessment based on the aggregated time of inspection across human subjects. This information was additionally used to weight views of the contents that were acquired for the computation of objective scores. The rating trends were found to be very similar to [Reference Torlig, Alexiou, Fonseca, de Queiroz and Ebrahimi18]. The performance of the projection-based metrics was improved by removing background color information, while further gains were reported by considering importance weights based on interactivity data.
In [Reference Cruz20], the results of a subjective evaluation campaign that was issued in the framework of the JPEG Pleno [Reference Ebrahimi, Foessel, Pereira and Schelkens52] activities are reported. Subjective experiments were conducted in three different laboratories in order to assess the visual quality of point cloud models under an octree- and a projection-based encoding scheme at three quality levels. A passive evaluation in conventional monitors was selected and different camera paths were defined to capture the models under assessment. The contents were rendered with fixed point size that was adjusted per stimulus. This is reported to be the first study aiming at defining test conditions for both small- and large-scale point clouds. The former class corresponds to objects that are normally consumed outer-wise, whereas the latter represents scenes which are typically consumed inner-wise. The results indicate that regular sparsity introduced by octree-based algorithms is preferred by human subjects with respect to missing structures that appeared in the encoded models due to occluded regions.
Zerman et al. [Reference Zerman, Gao, Ozcinar and Smolić21] conducted subjective evaluations with a volumetric video dataset that was acquired and releasedFootnote 3, using V-PCC. Two point cloud sequences were encoded at four quality levels of geometry and color, leading to a total of 32 video sequences, that were assessed in a passive way using two subjective evaluation methodologies; that is, a side-by-side assessment of the distorted model and a pair-wise comparison. The point clouds were rendered using primitive ellipsoidal elements (i.e. splats) of fixed size, determined heuristically to result in visualization of watertight models. The results showed that the visual quality was not significantly affected by geometric degradations, as long as the resolution of the represented model was sufficient to be adequately visualized. Moreover, in V-PCC, color impairments were found to be more annoying than geometric artifacts.
In [Reference Su, Duanmu, Liu, Liu and Wang22] a large scale evaluation study of 20 small-scale point cloud models was performed. The models were newly generated by the authors, and degraded using down-sampling, Gaussian noise and compression distortions from earlier implementations of the MPEG test models. In this experiment, each content was rendered as a raw point cloud. A virtual camera path circularly rotating around the horizontal and the vertical axis at a fixed radius was defined in order to capture snapshots of the models from different perspectives and generate video sequences. The distance between the camera and the models was selected so as to avoid perception of hollow regions, while preserving details. The generated videos were shown to human subjects in a side-by-side fashion, in order to evaluate the visual quality of the degraded stimuli. Comparison results for the MPEG test models based on subjective scores reveal better performance of V-PCC at low bit rates.
1) Discussion
Several experimental methodologies have been designed and tested in the subjective evaluation studies conducted so far. It is evident that the models' characteristics, the evaluation protocols, the rendering schemes, and the types of degradation under assessment are some of the main parameters that vary between the efforts. In Table 1, a categorization of existing experimental set-ups is attempted to provide an informative outline of the current approaches.
Experimental set-ups. Notice that single and double stand for the number of stimuli visualized to rate a model. Moreover, sim. and seq. denote simultaneous and sequential assessment, respectively. Finally, incl. zoom indicates varying camera distance to acquire views of the model.

B) Objective quality metrics
Objective quality assessment in point cloud representations is typically performed by full reference metrics, which can be distinguished in: (a) point-based, and (b) projection-based approaches [Reference Torlig, Alexiou, Fonseca, de Queiroz and Ebrahimi18], which is very similar to the classification of perceptual metrics for mesh contents [Reference Lavoué and Mantiuk39].
1) Point-based metrics
Current point-based approaches can assess either geometry- or color-only distortions. In the first category, the point-to-point metrics are based on Euclidean distances between pairs of associated points that belong to the reference and the content under assessment. An individual error value reflects the geometric displacement of a point from its reference position. The point-to-plane metrics [Reference Tian, Ochimizu, Feng, Cohen and Vetro24] are based on the projected error across the normal vector of an associated reference point. An error value indicates the deviation of a point from its linearly approximated reference surface. The plane-to-plane metrics [Reference Alexiou and Ebrahimi25] are based on the angular similarity of tangent planes corresponding to pairs of associated points. Each individual error measures the similarity of the linear local surface approximations of the two models. In the previous cases, a pair is defined for every point that belongs to the content under assessment, by identifying its nearest neighbor in the reference model. Most commonly, a total distortion measure is computed from the individual error values by applying the Mean Square Error (MSE), the Root-Mean-Square (RMS), or the Hausdorff distance. Moreover, for the point-to-point and point-to-plane metrics, the geometric Peak-Signal-to-Noise-Ratio (PSNR) [Reference Tian, Ochimizu, Feng, Cohen and Vetro26] is defined as the ratio of the maximum squared distance of nearest neighbors of the original content, potentially multiplied by a scalar, divided by the total squared error value, in order to account for differently scaled contents. The reader may refer to [Reference Alexiou and Ebrahimi23] for a benchmarking study of the aforementioned approaches. In the same category of geometry-only metrics falls a recent extension of the Mesh Structural Distortion Measure (MSDM), a well-known metric introduced for mesh models [Reference Lavoué, Gelasca, Dupont, Baskurt and Ebrahimi34,Reference Lavoué41], namely PC-MSDM [Reference Meynet, Digne and Lavoué27]. It is based on curvature statistics computed on local neighborhoods between associated pairs of points. The curvature at a point is computed after applying least-squares fitting of a quadric surface among its k nearest neighbors. Each associated pair is composed of a point that belongs to the distorted model and its projection on the fitted surface of the reference model. A total distortion measure is obtained using the Minkowski distance on the individual error values per local neighborhood. Finally, point-to-mesh metrics can be used for point cloud objective quality assessment, although considered sub-optimal due to the intermediate surface reconstruction step that naturally affects the computation of the scores. They are typically based on distances after projecting points of the content under assessment on the reconstructed reference model. However, these metrics will not be considered in this study.
The state-of-the-art point-based methods that assess the color of a distorted model are based on conventional formulas that are used in 2D content representations. In particular, the formulas are applied on pairs of associated points that belong to the content under assessment and the reference model. Note that, similarly to the geometry-only metrics, although the nearest neighbor in Euclidean space is selected to form pairs in existing implementations of the algorithms, the points association might be defined in a different manner (e.g. closest points in another space). The total color degradation value is based either on the color MSE, or the PSNR, computed in either the RGB or the YCbCr color spaces.
For both geometry and color degradations, the symmetric error is typically used. For PC-MSDM, it is defined as the average of the total error values computed after setting both the original and the distorted contents as reference. For the rest of the metrics, it is obtained as the maximum of the total error values.
2) Projection-based metrics
In the projection-based approaches, first used in [Reference de Queiroz and Chou53] for point cloud imaging, the rendered models are mapped onto planar surfaces, and conventional 2D imaging metrics are employed [Reference Torlig, Alexiou, Fonseca, de Queiroz and Ebrahimi18]. In some cases, the realization of a simple rendering technique might be part of an objective metric, such as voxelization at a manually-defined voxel depth, as described in [Reference de Queiroz, Torlig and Fonseca54] and implemented by respective softwareFootnote 4. In principle, though, the rendering methodology that is adopted to consume the models should be reproduced, in order to accurately reflect the views observed by the users. For this purpose, snapshots of the models are typically acquired from the software used for consumption. Independently of the rendering scheme, the number of viewpoints and the camera parameters (e.g. position, zoom, direction vector) can be set arbitrarily in order to capture the models. Naturally, it is desirable to cover the maximum external surface, thereby incorporating as much visual information as possible from the acquired views. Excluding pixels from the computations that do not belong to the effective part of the content (i.e. background color) has been found to improve the accuracy of the predicted quality [Reference Alexiou and Ebrahimi19]. Moreover, a total score is computed as an average, or a weighted average of the objective scores that correspond to the views. In the latter case, importance weights based on the time of inspection of human subjects were proved a viable alternative that can improve the performance of these metrics [Reference Alexiou and Ebrahimi19].
3) Discussion
The limitation of the point-based approach is that either geometry- or color-only artifacts can be assessed. In fact, there is no single formula that efficiently combines individual predictions for the two types of degradations by weighting, for instance, corresponding quality scores. In case the metrics are based on normal vectors or curvature values, which are not always provided, their performance also depends on the configuration of the algorithms that are used to obtain them. The advantage of this category of metrics, though, is that computations are performed based on explicit information that can be stored in any point cloud format. On the other hand, the majority of the projection-based objective quality metrics are able to capture geometry and color artifacts as introduced by the rendering scheme adopted in relevant applications. However, the limitation of this type of metrics is that they are view-dependent [Reference Lavoué, Larabi and Vás̆a48]; that is, the prediction of the visual quality of the model varies for a different set of selected views. Moreover, the performance of the objective metrics may vary based on the rendering scheme that is applied to acquire views of the displayed model. Thus, these metrics are also rendering-dependent.
In benchmarking studies conducted so far, it has been shown that quality metrics based on either projected views [Reference Torlig, Alexiou, Fonseca, de Queiroz and Ebrahimi18,Reference Alexiou and Ebrahimi19], or color information [Reference Cruz20,Reference Zerman, Gao, Ozcinar and Smolić21], provide better predictions of perceptual quality. However, the number of codecs under assessment was limited, thus raising questions about the generalizability of the findings.
III. RENDERER AND EVALUATION FRAMEWORK
An interactive renderer has been developed in a web application on top of the Three.js library. The software supports point cloud data stored in both PLY and PCD formats, which are displayed using square primitive elements (splats) of either fixed or adaptive sizes. The primitives are always perpendicular to the camera direction vector by default, thus, the rendering scheme is independent of any information other than the coordinates, the color, and the size of the points. Note that the latter type of information is not always provided by popular point cloud formats, thus, there is a necessity for additional metadata (see below).
To develop an interactive 3D rendering platform in Three.js, the following components are essential: a camera with trackball control, a virtual scene, and a renderer with an associated canvas. In our application, a virtual scene is initialized and a point cloud model is added. The background color of the scene can be customized. To capture the scene, an orthographic camera is employed, whose field of view is defined by setting the camera frustum. The users are able to control the camera position, zoom and direction through mouse movements, handling their viewpoint; thus, interactivity is enabled. A WebGLRenderer object is used to draw the current view of the model onto the canvas. The dimensions of the canvas can be manually specified. It is worth mentioning that the update rate of the trackball control and the canvas is handled by the requestAnimationFrame() method, ensuring fast response (i.e. 60 fps) in high-end devices.
After a point cloud has been loaded into the scene, it is centered and its shape is scaled according to the camera's frustum dimensions in order to be visualized in its entirety. To enable watertight surfaces, each point is represented by a square splat. Each splat is initially projected onto the canvas using the same number of pixels, which can be computed as a function of the canvas size and the geometric resolution of the model (e.g. 1024 for 10-bit voxel depth). After the initial mapping, the size of each splat is readjusted based on the corresponding point's size, the camera parameters and an optional scaling factor. In particular, in the absence of a relative field in the PLY and PCD file formats, metadata written in JSON is loaded per model, in order to obtain the size of each point as specified by the user. Provided an orthographic camera, the current zoom value is also considered; thus, the splat is increasing or decreasing depending on whether the model is visualized from a close or a far distance. Finally, an auxiliary scaling factor that can be manually tuned per model, is universally applied. This constant may be interpreted as a global compensating quantity to regulate the size of the splats depending on the sparsity of a model, for visually pleasing results.
To enable fixed splat size rendering, a single value is stored in the metadata, which is applied on each point of the model. In particular, this value is set as the default point size in the class material. To enable adaptive splat size rendering, a value per point is stored in the metadata, following the same order as the list of vertex entries that represent the model. For this rendering mode, a custom WebGL shader/fragment program was developed, allowing access to the attributes and adjustments of the size of each point individually. In particular, a new BufferGeometry object is initialized adding as attributes the points' position, color, and size; the former two can be directly retrieved from the content. A new Points object is then instantiated using the object's structure, as defined in BufferGeometry, and the object's material, as defined using the shader function.
Additional features of the developed software that can be optionally enabled consist of recording user's interactivity information and allowing taking screen-shots of the rendered models.
The main advantages of this renderer with respect to other alternatives are: (i) open source based on a well-established library for 3D models; the scene and viewing conditions can be configured while also additional features can be easily integrated, (ii) web-based, and, thus, interoperable across devices and operating systems; after proper adjustments, the renderer could be used even for crowd-sourcing experiments, and (iii) offers the possibility of adjusting the size of each point separately.
IV. TEST SPACE AND CONDITIONS
In this section, the selection and preparation of the assets that were employed in the experiments are detailed, followed by a brief description of the working principle of the encoding solutions that were evaluated.
A) Content selection and preparation
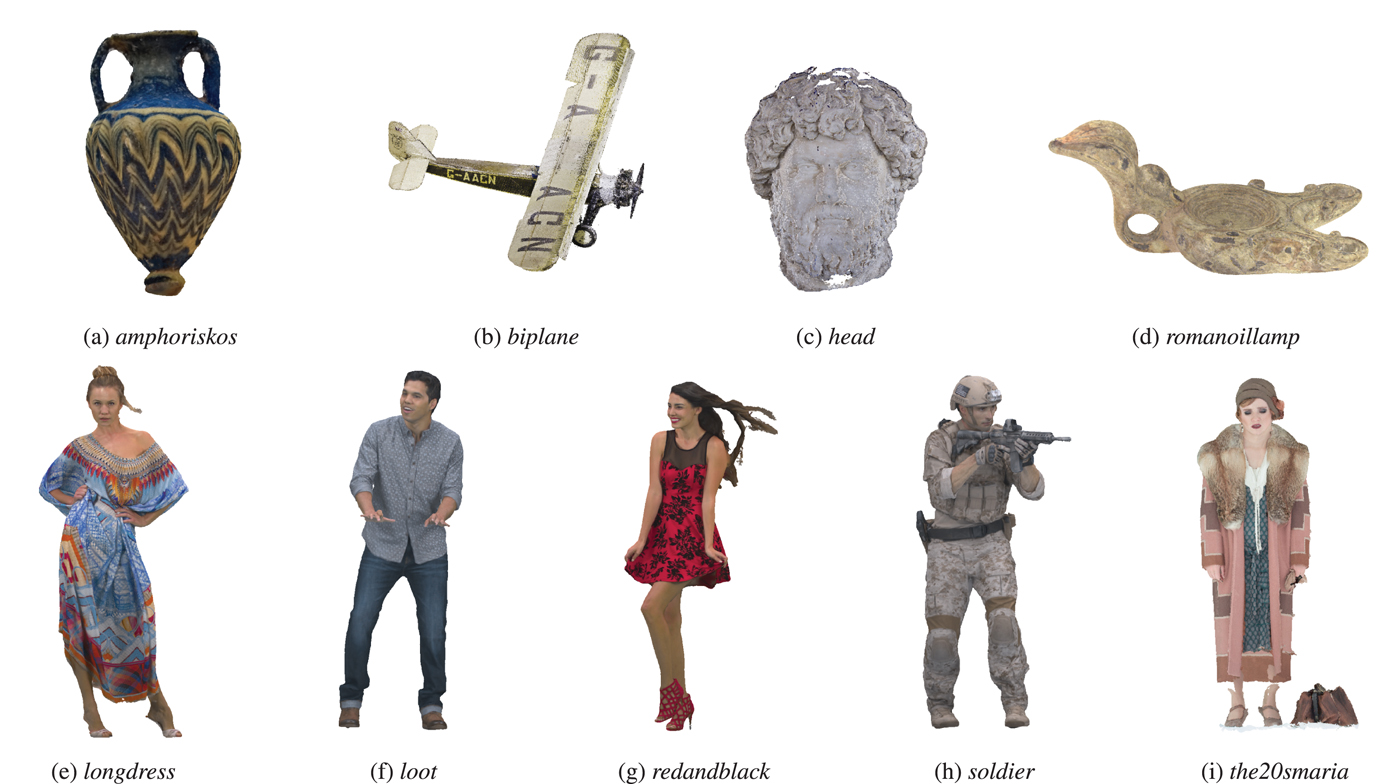
A total of nine static models are used in the experiments. The selected models denote a representative set of point clouds with diverse characteristics in terms of geometry and color details, with the majority of them being considered in recent activities of the JPEG and MPEG committees. The contents depict either human figures, or objects. The former set of point clouds consists of the longdress [Reference d'Eon, Harrison, Myers and Chou55] (longdress_vox10_1300), loot [Reference d'Eon, Harrison, Myers and Chou55] (loot_vox10_1200), redandblack [Reference d'Eon, Harrison, Myers and Chou55] (redandblack_vox10_1550), soldier [Reference d'Eon, Harrison, Myers and Chou55] (soldier_vox10_0690), and the20smaria [Reference Ebner56] (HHI_The20sMaria_Frame_00600) models, which were obtained from the MPEG repositoryFootnote 5. The latter set is composed by amphoriskos, biplane (1x1_Biplane_Combined_000), head (Head_00039), and romanoillamp. The first model was retrieved from the online platform SketchfabFootnote 6, the second and the last were selected from the JPEG repositoryFootnote 7, while head was recruited from the MPEG database.
Such point clouds are typically acquired when objects are scanned by sensors that provide either directly or indirectly a cloud of points with information representing their 3D shapes. Typical use cases involve applications in desktop computers, hand-held devices, or head-mounted displays, where the 3D models are consumed outer-wise. Representative poses of the reference contents are shown in Fig. 1, while related information is summarized in Table 2.
Reference point cloud models. The set of objects is presented in the first row, whilst the set of human figures is illustrated in the second row. (a) amphoriskos, (b) biplane, (c) head, (d) romanoillamp, (e) longdress, (f) loot, (g) redandblack, (h) soldier, (i) the20smaria.
Summary of content retrieval information, processing, and point specifications.
The selected codecs under assessment handle solely point clouds with integer coordinates. Thus, models that have not been provided as such in the selected databases were manually voxelized after eventual pre-processing. In particular, the contents amphoriskos and romanoillamp were initially pre-processed. For amphoriskos, the resolution of the original version is rather low; hence, to increase the quality of the model representation, the screened Poisson surface reconstruction algorithm [Reference Kazhdan and Hoppe51] was applied and a point cloud was generated by sampling the resulting mesh. The CloudCompare software was used with the default configurations of the algorithm and 1 sample per node, while the normal vectors that were initially associated to the coordinates of the original model were employed. From the reconstructed mesh, a target of 1 million points was set and obtained by randomly sampling a fixed number of samples on each triangle, resulting in an irregular point cloud. Regarding romanoillamp, the original model is essentially a polygonal mesh object. A point cloud version was produced by discarding any connectivity information and maintaining the original points' coordinates and color information.
In a next step, contents with non-integer coordinates are voxelized, that is, quantization of coordinates which leads to a regular geometry down-sampling; the color is obtained after sampling among the points that fall in each voxel to avoid texture smoothing, leading to more challenging encoding conditions. For our tests design, it was considered important to eliminate influencing factors related to the sparsity of the models that would affect the visual quality of the rendered models. For instance, visual impairments naturally arise by assigning larger splats on models with lower geometric resolutions, when visualization of watertight surfaces is required. At the same time, the size of the model, directly related to the number of points, should allow high responsiveness and fast interactivity in a rendering platform. To enable a comparable number of points for high-quality reference models while not making their usage cumbersome in our renderer, voxel grids of 10-bit depth are used for the contents amphoriskos, biplane, romanoillamp, and the20smaria, whereas a 9-bit depth grid is employed for head. It should be noted that, although a voxelized version of the latter model is provided in the MPEG repository, the number of output points is too large; thus, it was decided to use a smaller bit depth.
B) Codecs
In this work, the model degradations under study were derived from the application of lossy compression. The contents were encoded using the latest versions of the state-of-the-art compression techniques for point clouds at the time of this writing, namely version 5.1 of V-PCC [Reference Mammou28] and version 6.0-rc1 of G-PCC [Reference Mammou, Chou, Flynn and Krivokuća29]. The configuration of the encoders was set according to the guidelines detailed in the MPEG Common Test Conditions document [57].
1) Video-based point cloud compression
V-PCC, also known as TMC2 (Test Model Category 2), takes advantage of already deployed 2D video codecs to compress geometry and texture information of dynamic point clouds (or Category 2). V-PCC's framework depends on a Pre-processing module which converts the point cloud data into a set of different video sequences, as shown in Fig. 2.
V-PCC compression process. In (a), the original point cloud is decomposed into geometry video, texture video, and metadata. Both video contents are smoothed by Padding in (b) to allow for the best HEVC [Reference Bross, Han, Sullivan, Ohm and Wiegand58] performance. The compressed bitstreams (metadata, geometry video, and texture video) are packed into a single bitstream: the compressed point cloud.
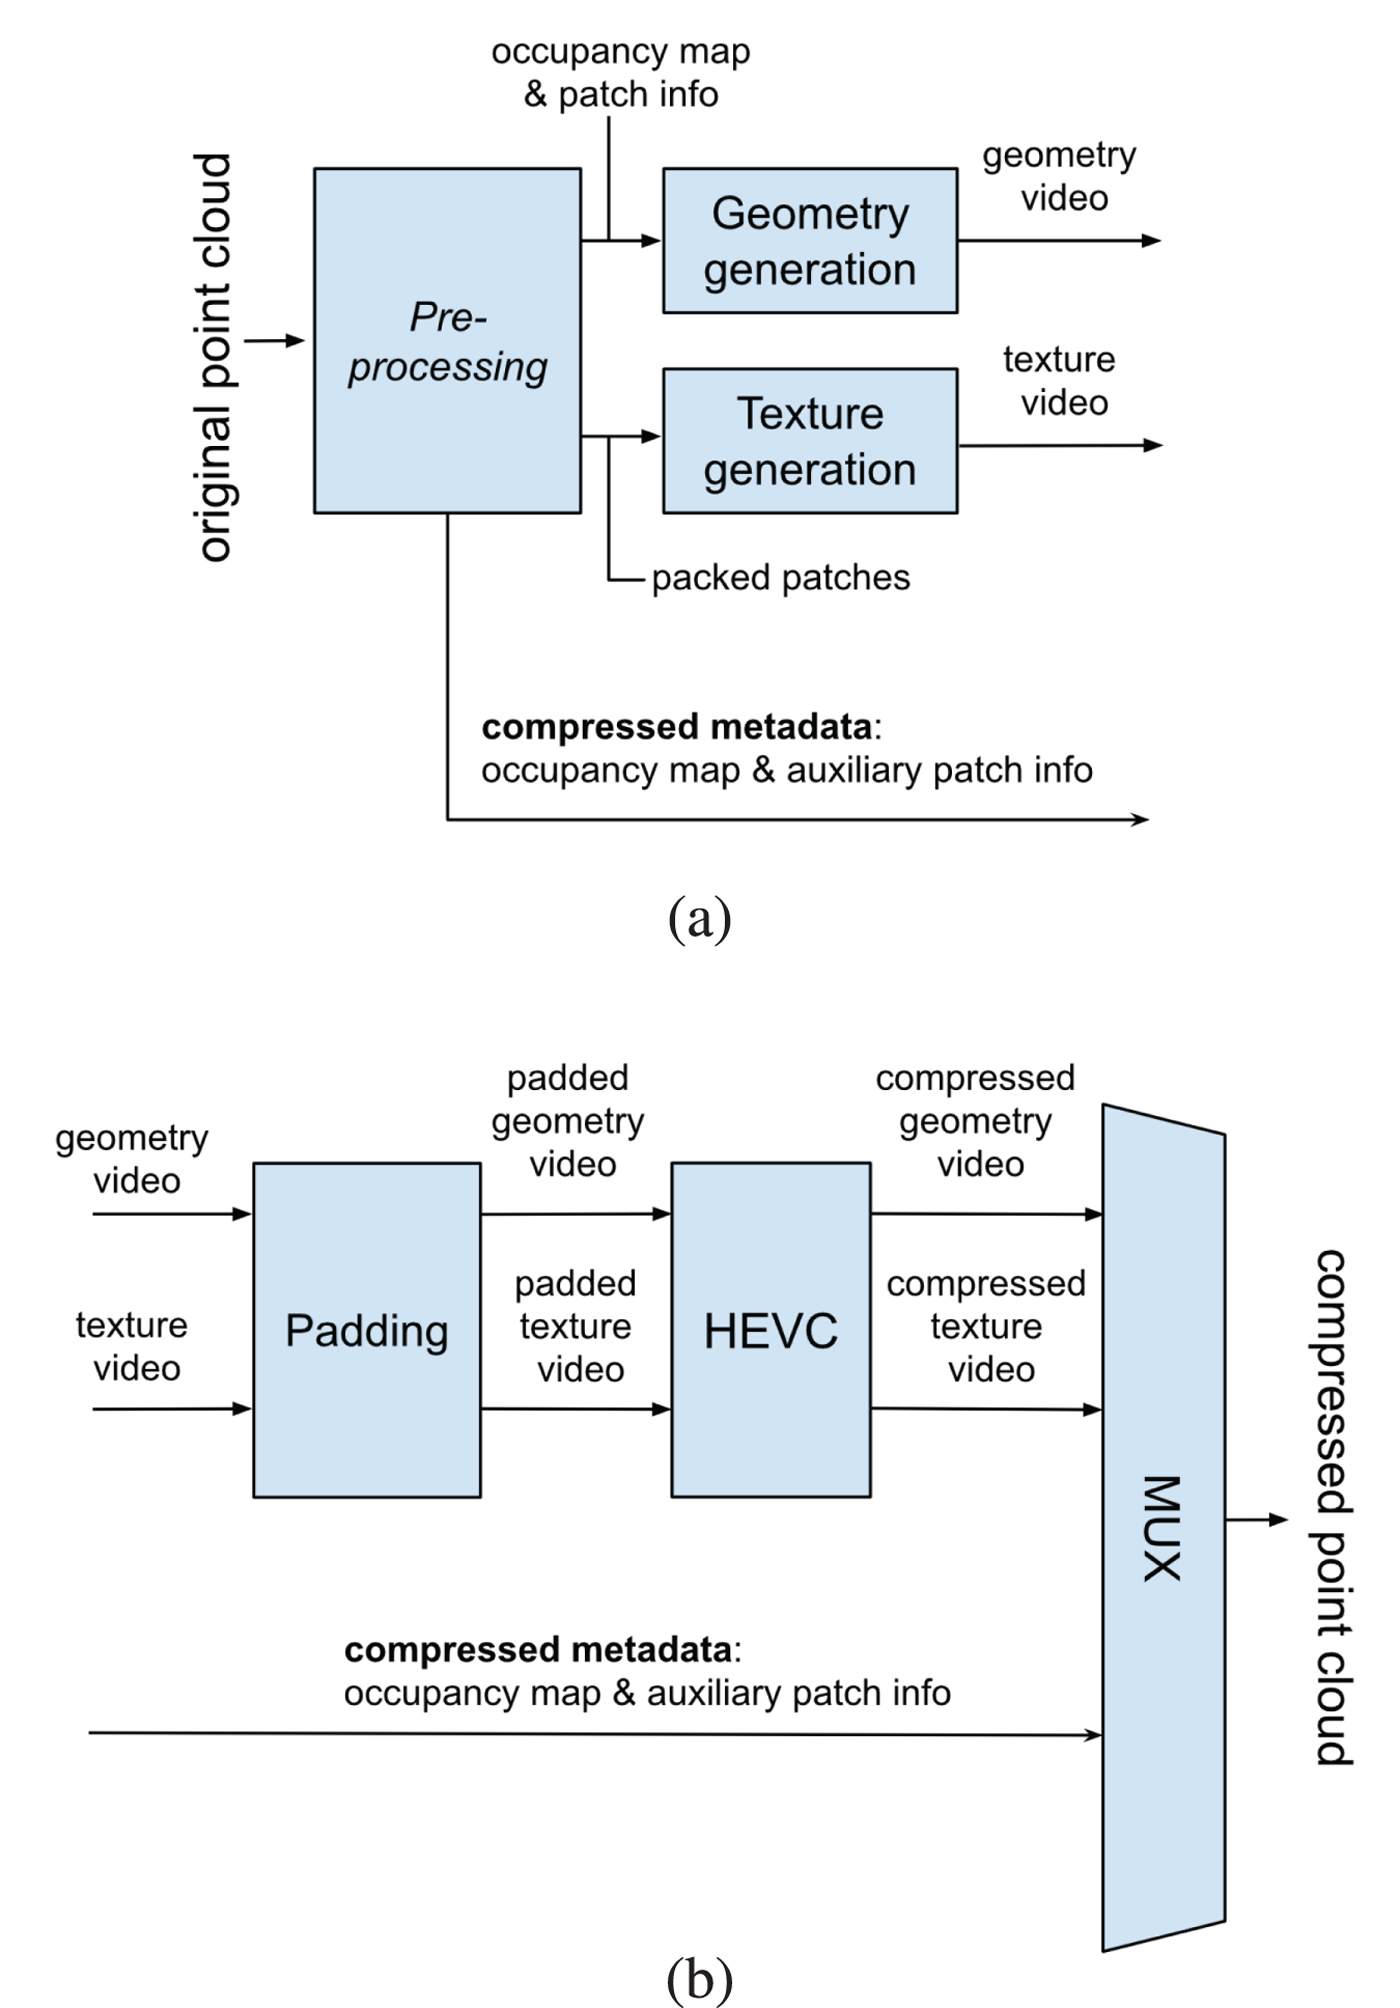
In essence, two video sequences, one for capturing the geometry information of the point cloud data (padded geometry video) and another for capturing the texture information (padded texture video), are generated and compressed using HEVC [Reference Bross, Han, Sullivan, Ohm and Wiegand58], the state-of-the-art 2D video codec. Additional metadata (occupancy map and auxiliary patch info) needed to interpret the two video sequences are also generated and compressed separately. The total amount of information is conveyed to the decoder in order to allow for the decoding of the compressed point cloud.
2) Geometry-based point cloud compression
G-PCC, also known as TMC13 (Test Model Categories 1 and 3), is a coding technology to compress Category 1 (static) and Category 3 (dynamically acquired) point clouds. Despite the fact that our work is focused on models that belong by default to Category 1, the contents under test are encoded using all the available set-up combinations to investigate the suitability and the performance of the entire space of the available options. Thus, configurations typically recommended for Category 3 contents are also employed. It is suitable, thus, to present an overview of the entire G-PCC framework.
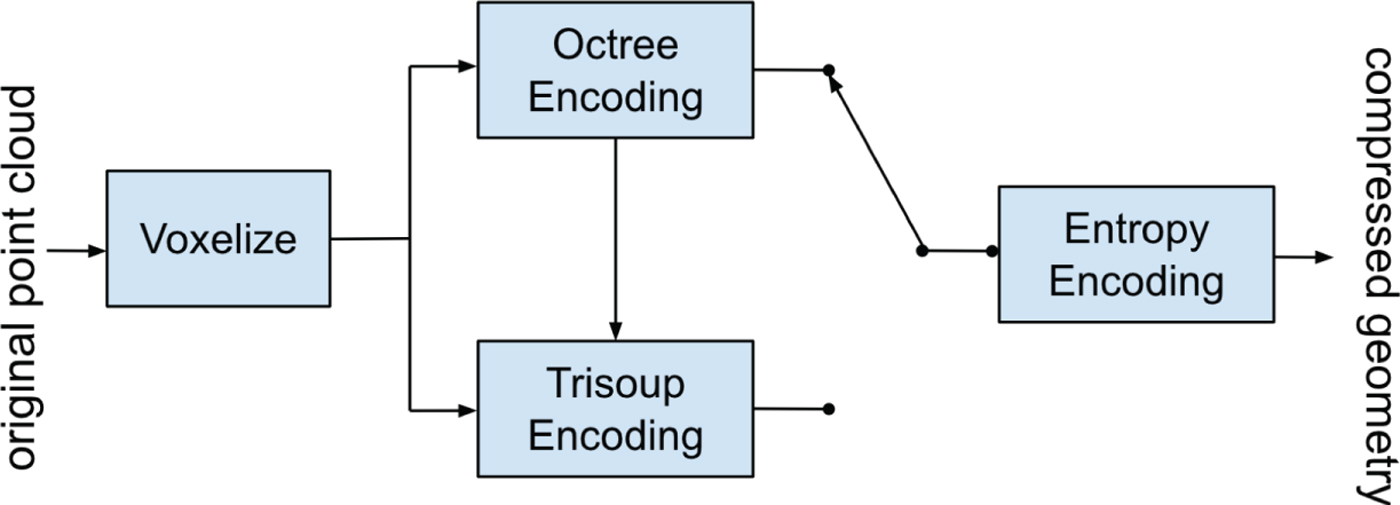
The basic approach consists in encoding the geometry information at first and, then, using the decoded geometry to encode the associated attributes. For Category 3 point clouds, the compressed geometry is typically represented as an octree [Reference Meagher59] (Octree Encoding module in Fig. 3) from the root all the way down to a leaf level of individual voxels. For Category 1 point clouds, the compressed geometry is typically represented by a pruned octree (i.e. an octree from the root down to a leaf level of blocks larger than voxels) plus a model that approximates the surface within each leaf of the pruned octree, provided by the TriSoup Encoding module. The approximation is built using a series of triangles (a triangle soup [Reference Schwarz4,Reference Pavez, Chou, de Queiroz and Ortega60]) and yields good results for a dense surface point cloud.
Overview of G-PCC geometry encoder. After voxelization, the geometry is encoded either by Octree or by TriSoup modules, which depends on Octree.
In order to meet rate or distortion targets, the geometry encoding modules can introduce losses in the geometry information in such a way that the list of 3D reconstructed points, or refined vertices, may differ from the source 3D-point list. Therefore, a re-coloring module is needed to provide attribute information to the refined coordinates after lossy geometry compression. This step is performed by extracting color values from the original (uncompressed) point cloud. In particular, G-PCC uses neighborhood information from the original model to infer the colors for the refined vertices. The output of the re-coloring module is a list of attributes (colors) corresponding to the refined vertices list. Figure 4 presents the G-PCC's color encoder which has as input the re-colored geometry.
Overview of G-PCC color attribute encoder. In the scope of this work, either RAHT or Lifting is used to encode contents under test.
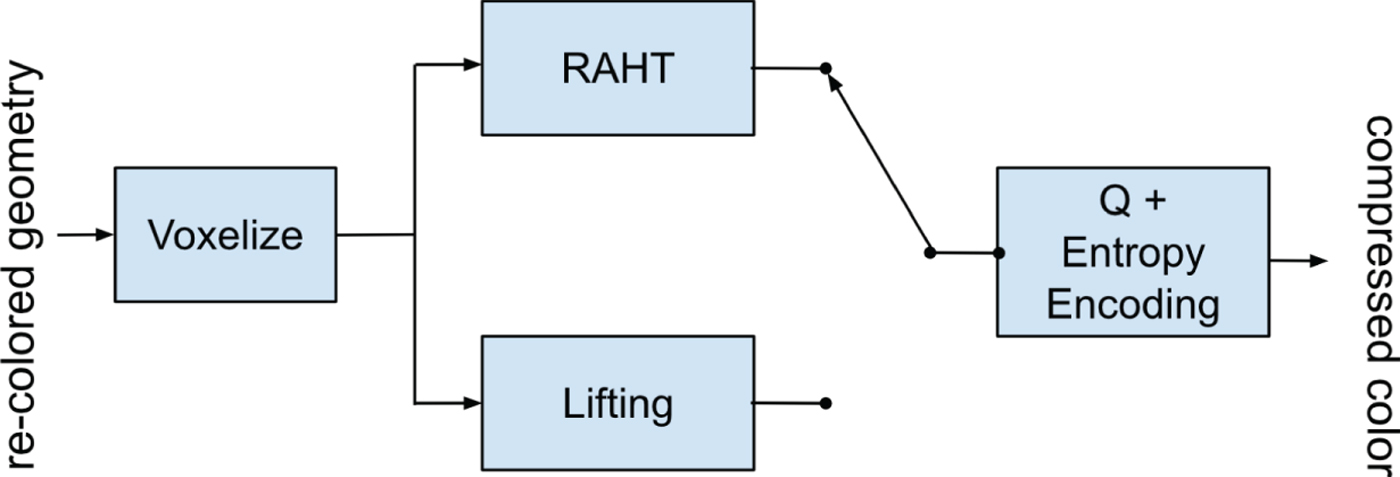
There are three attribute coding methods in G-PCC: Region Adaptive Hierarchical Transform (RAHT module in Fig. 4) coding [Reference de Queiroz and Chou61], interpolation-based hierarchical nearest-neighbor prediction (Predicting Transform), and interpolation-based hierarchical nearest-neighbor prediction with an update/lifting step (Lifting module). RAHT and Lifting are typically used for Category 1 data, while Predicting is typically used for Category 3 data. Since our work is focused on Category 1 contents, every combination of the two geometry encoding modules (Octree and TriSoup) in conjunction with the two attribute coding techniques (RAHT and Lifting) is employed.
V. EXPERIMENT 1: SUBJECTIVE AND OBJECTIVE BENCHMARKING OF MPEG TEST CONDITIONS
In the first experiment, the objective was to assess the emerging MPEG compression approaches for Category 1 contents, namely, V-PCC, and G-PCC with geometry encoding modules Octree and TriSoup combined with color encoding modules RAHT and Lifting, for a total of five encoding solutions. The codecs were assessed under test conditions and encoding configurations defined by the MPEG committee, in order to ensure fair evaluation and to have a preliminary understanding of the level of perceived distortion with respect to the achieved bit rate. In this section, the experiment design is described in details; the possibility of pooling results obtained in two different laboratory settings is discussed and analyzed, and the results of the subjective quality evaluation are presented. Furthermore, a benchmarking of the most popular objective metrics is demonstrated, followed by a discussion of the limitations of the test.
A) Experiment design
For this experiment, every model presented in Session IV.A is encoded using six degradation levels for the four combinations of the G-PCC encoders (from most degraded to least degraded: R1, R2, R3, R4, R5, R6). Moreover, five degradation levels for the V-PCC codec (from most degraded to least degraded: R1, R2, R3, R4, R5) were obtained, following the Common Test Conditions document released by the MPEG committee [57]. Using the V-PCC codec, the degradation levels were achieved by modifying the geometry and texture Quantization Parameter (QP). For both the G-PCC geometry encoders, the positionQuantizationScale parameter was configured to specify the maximum voxel depth of a compressed point cloud. To define the size of the block on which the triangular soup approximation is applied, the log2_trisoup_node_size was additionally adjusted. From now on, the first and the second parameters will be referred to as depth and level, respectively, in accordance with [Reference Schwarz4]. It is worth clarifying that, setting the level parameter to 0 reduces the TriSoup module to the Octree. For both the G-PCC color encoders, the color QP was adjusted per degradation level, accordingly. Finally, the parameters levelOfDetailCount and dist2 were set to 12 and 3, respectively, for every content, when using the Lifting module.
The subjective evaluation experiments took place in two laboratories across two different countries, namely, MMSPG at EPFL in Lausanne, Switzerland and LISA at UNB in Brasilia, Brazil. In both cases, a desktop set-up involving an Apple Cinema Display of 27-inches and $2560\times 1440$ resolution (Model A1316) calibrated with the ITU-R Recommendation BT.709-5 [62] color profile was installed. At EPFL, the experiments were conducted in a room that fulfills the ITU-R Recommendation BT.500-13 [63] for subjective evaluation of visual data representations. The room is equipped with neon lamps of 6500 K color temperature, while the color of the walls and the curtains is mid gray. The brightness of the screen was set to 120 cd/m2 with a D65 white point profile, while the lighting conditions were adjusted for ambient light of 15 lux, as was measured next to the screen, according to the ITU-R Recommendation BT.2022 [64]. At UNB, the test room was isolated, with no exterior light affecting the assessment. The wall color was white, and the lighting conditions involved a single ceiling luminary with aluminum louvers containing two fluorescent lamps of 4000 K color temperature.
The stimuli were displayed using the renderer presented and described in Section III. The resolution of the canvas was specified to 1024 × 1024 pixels, and a non-distracting mid-gray color was set as the background. The camera zoom parameter was limited in a reasonable range, allowing visualization of a model in a scale from 0.2 up to 5 times the initial size. Note that the initial view allows capturing of the highest dimension of the content in its entirety. This range was specified in order to avoid distortions from corner cases of close and remote viewpoints.
When it comes to splat-based rendering of point cloud data, there is an obvious trade-off between sharpness and impression of watertight models; that is, as the splat size is increasing, the perception of missing regions in the model becomes less likely, at the expense of blurriness. Given that, in principle, the density of points varies across a model, adjusting the splat size based on local resolutions can improve the visual quality. Thus, in this study, an adaptive point size approach was selected to render the models, similarly to [Reference Javaheri, Brites, Pereira and Ascenso11,Reference Alexiou and Ebrahimi19]. The splat size for every point p is set equal to the mean distance x of its 12 nearest neighbors, multiplied by a scaling factor that is determined per content. Following [Reference Alexiou and Ebrahimi19], to avoid the magnification of sparse regions, or isolated points that deviate from surfaces (e.g. acquisition errors), we assume that x is a random variable following a Gaussian distribution $N (\mu _{x}, \sigma _{x})$ , and every point p with mean outside of a specified range, is classified as an outlier. In our case, this range is defined by the global mean $\mu = \bar {\mu }_x$
 and standard deviation $\sigma = \bar {\sigma }_x$
 . For every point p, if $x \geq \mu + 3 \cdot \sigma$
 , or $x \leq \mu - 3 \cdot \sigma$
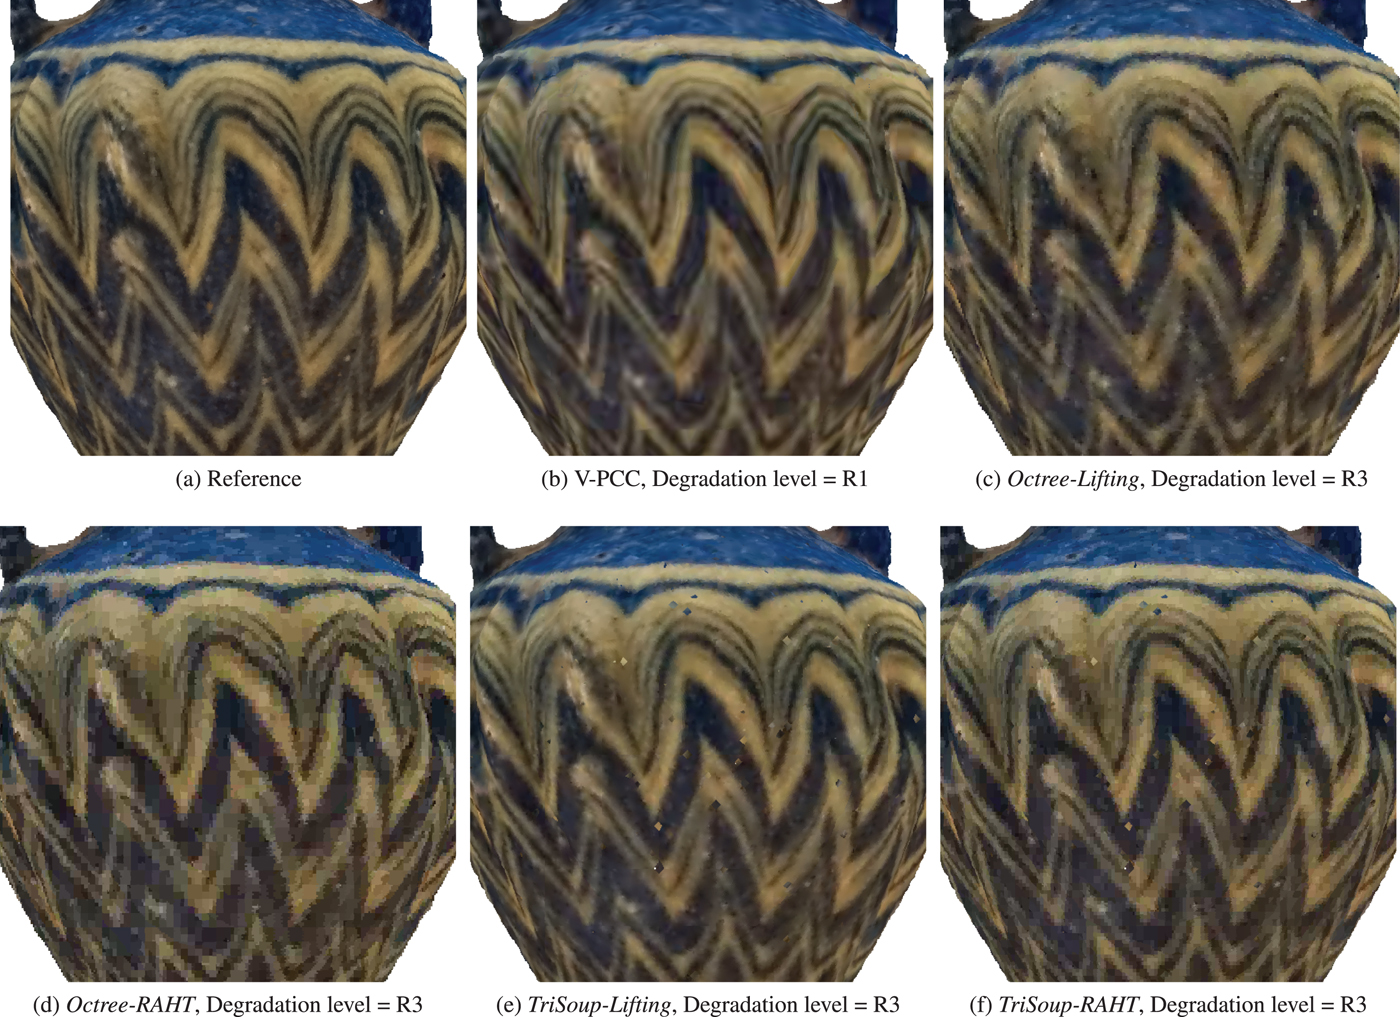
 , then p is considered as an outlier and x is set equally to the global mean μ, multiplied by the scaling factor. The scaling factor was selected after expert viewing, ensuring a good compromise between sharpness and perception of watertight surfaces for each reference content. In particular, a value of 1.45 was chosen for amphoriskos, 1.1 for biplane, 1.3 for romanoillamp, and 1.05 for the rest of the contents. Notice that the same scaling factor is applied for each variation of the content. In Fig. 5, the reference model amphoriskos along with encoded versions at a comparable visual quality are displayed using the developed renderer, to indicatively illustrate the nature of impairments that are introduced by every codec under assessment.
Illustration of artifacts occurred after encoding the content amphoriskos with the codecs under evaluation. To obtain comparable visual quality, different degradation levels are selected for V-PCC and G-PCC variants. (a) Reference. (b) V-PCC, Degradation level = R1. (c) Octree-Lifting, Degradation level = R3. (d) Octree-RAHT, Degradation level = R3. (e) TriSoup-Lifting, Degradation level = R3. (f) TriSoup-RAHT, Degradation level = R3.
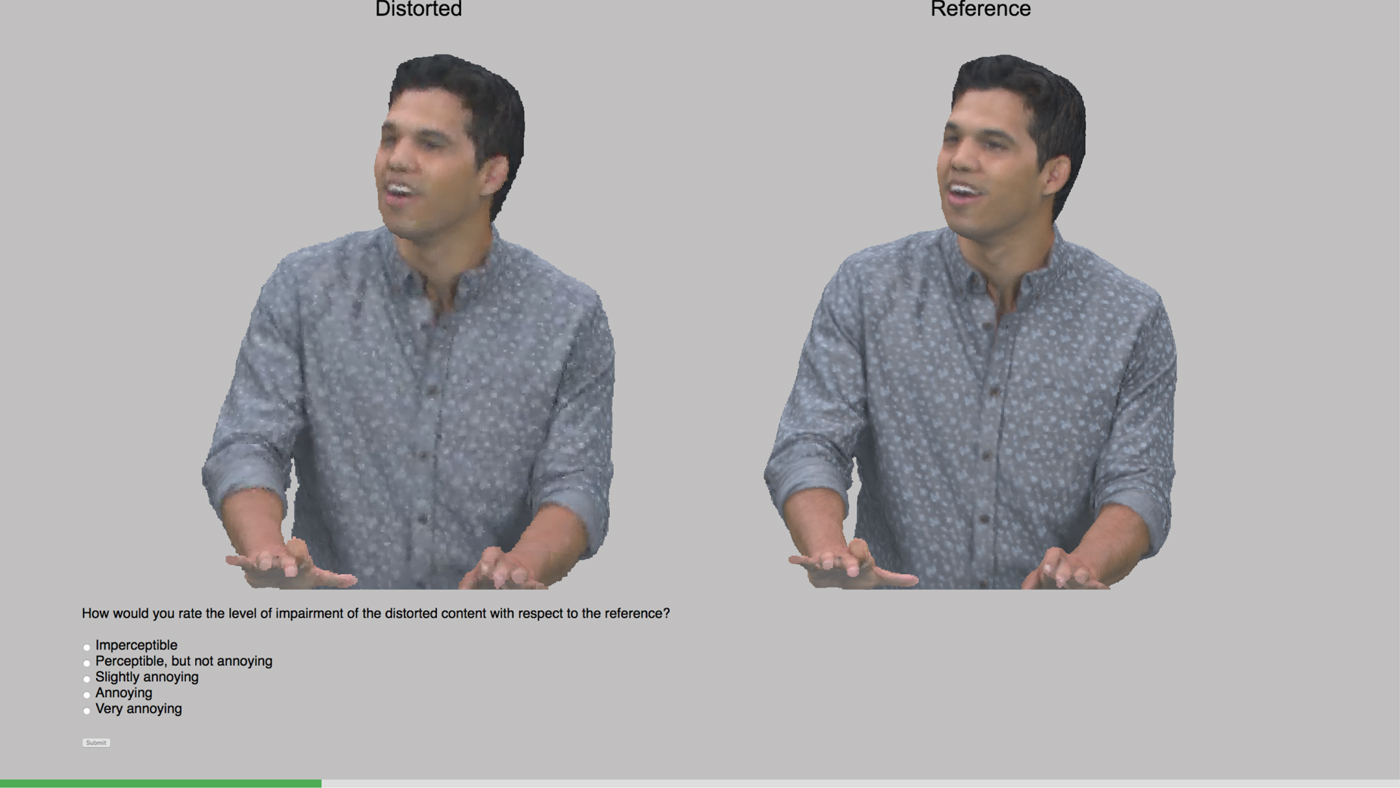
In this experiment, the simultaneous Double-Stimulus Impairment Scale (DSIS) with 5-grading scale was adopted (5: Imperceptible, 4: Perceptible, 3: Slightly annoying, 2: Annoying, 1: Very annoying). The reference and the distorted stimuli were clearly annotated and visualized side-by-side by the subjects. A division element with radio buttons was placed below the rendering canvases, enlisting the definitions of the selected grading scale among which the subjects had to choose. For the assessment of the visual quality of the models, an interactive evaluation protocol was adopted to simulate realistic consumption, allowing the participants to modify their viewpoint (i.e. rotation, translation, and zoom) at their preference. Notice that the interaction commands given by a subject were simultaneously applied on both stimuli (i.e. reference and distorted); thus, the same camera settings were always used in both models. A training session preceded the test, where the subjects got familiarized with the task, the evaluation protocol, and the grading scale by showing references of representative distortions using the redandblack content; thus, this model was excluded from the actual test. Identical instructions were given in both laboratories. At the beginning of each evaluation, a randomly selected view was presented to each subject at a fixed distance, ensuring entire model visualization. Following the ITU-R Recommendation BT.500-13 [63], the order of the stimuli was randomized and the same content was never displayed consecutively throughout the test, in order to avoid temporal references. In Fig. 6, an example of the evaluation platform is presented.
Illustration of the evaluation platform. Both reference and distorted models are presented side-by-side while being clearly remarked. Users' judgments can be submitted through the rating panel. The green bar at the bottom indicates the progress in the current batch.
In each session, eight contents and 29 degradations were assessed with a hidden reference and a dummy content for sanity check, leading to a total of 244 stimuli. Each session was equally divided in four batches. Each participant was asked to complete two batches of 61 contents, with a 10-min enforced break in between to avoid fatigue. A total of 40 subjects participated in the experiments at EPFL, involving 16 females and 24 males with an average of 23.4 years of age. Another 40 subjects were recruited at UNB, comprising of 14 females and 26 males, with an average of 24.3 years of age. Thus, 20 ratings per stimulus were obtained in each laboratory, for a total of 40 scores.
B) Data processing
1) Subjective quality evaluation
As a first step, the outlier detection algorithm described in the ITU-R Recommendation BT.500-13 [63] was issued separately for each laboratory, in order to exclude subjects whose ratings deviated drastically from the rest of the scores. As a result, no outliers were identified, thus, leading to 20 ratings per stimulus at each lab. Then, the Mean Opinion Score (MOS) was computed based on equation (1)

where N=20 represents the number of ratings at each laboratory k, with $k \in \{A, B\}$ ), while $m_{ij}$
 is the score of the stimulus j from a subject i. Moreover, for every stimulus, the $95\%$
 confidence interval (CI) of the estimated mean was computed assuming a Student's t-distribution, based on equation (2)

where $t(1-\alpha /2, N-1)$ is the t-value corresponding to a two-tailed Student's t-distribution with N−1 degrees of freedom and a significance level $\alpha = 0.05$
 , and $\sigma _j$
 is the standard deviation of the scores for stimulus j.
2) Inter-laboratory correlation
Based on the Recommendation ITU-T P.1401 [65], no fitting, linear, and cubic fitting functions were applied to the $\mbox {MOS}$ values obtained from the two sets collected from the participating laboratories. For this purpose, when the scores from set A are considered as the ground truth, the regression model is applied to the scores of set B before computing the performance indexes. In particular, let us assume the scores from set A as the ground truth, with the $\mbox {MOS}$
 of the stimulus i being denoted as $\mbox {MOS}_{i}^{A}$
 . $\mbox {MOS}_{i}^{B}$
 is used to indicate the $\mbox {MOS}$
 of the same stimulus as computed from set B. A predicted $\mbox {MOS}$
 for stimulus i, indicated as $\mbox {P(MOS}_{i}^{B})$
 , is estimated after issuing a regression model to each pair $[\mbox {MOS}_{j}^{A}, \mbox {MOS}_{j}^{B}]$
 , $\forall \ j \in \lbrace 1, 2, \ldots, N \rbrace$
 . Then, the Pearson linear correlation coefficient (PLCC), the Spearman rank order correlation coefficient (SROCC), the root-mean-square error (RMSE), and the outlier ratio based on standard error (OR) were computed between $\mbox {MOS}_{i}^{A}$
 and $\mbox {P(MOS}_{i}^{B})$
 , for linearity, monotonicity, accuracy, and consistency of the results, respectively. To calculate the OR, an outlier is defined based on the standard error.
To decide whether statistically distinguishable scores are obtained for the stimuli under assessment from the two test populations, the correct estimation (CE), under-estimation (UE), and over-estimation (OE) percentages are calculated, after a multiple comparison test at a $5\%$ significance level. Let us assume that the scores in set A are the ground truth. For every stimulus, the true difference $\mbox {MOS}_{i}^{B}$
 –$\mbox {MOS}_{i}^{A}$
 between the average ratings from every set is estimated with a $95\%$
 CI. If the CI contains 0, correct estimation is observed, indicating that the visual quality of stimulus i is rated statistically equivalently from both populations. If 0 is above, or below the CI, we conclude that the scores in set B under-estimate, or over-estimate the visual quality of model i, respectively. The same computations are repeated for every stimulus. After dividing the aggregated results with the total number of stimuli, the correct estimation, under-estimation, and over-estimation percentages are obtained.
Finally, to better understand whether the results from the two tests conducted in EPFL and UNB could be pooled together, the Standard deviation of Opinion Score (SOS) coefficient was computed for both tests [Reference Hoßfeld, Schatz and Egger66]. The SOS coefficient a parametrizes the relationship between MOS and the standard deviation associated with it through a square function, given in equation (3).

Close values of a denote similarity among the distribution of the scores, and can be used to determine whether pooling is advisable.
3) Objective quality evaluation
The visual quality of every stimulus is additionally evaluated using state-of-the-art objective quality metrics. For the computation of the point-to-point (p2point) and point-to-plane (p2plane) metrics, the software version 0.13.4 that is presented in [Reference Tian, Ochimizu, Feng, Cohen and Vetro67] is employed. The MSE and the Hausdorff distance are used to produce a single degradation value from the individual pairs of points. The geometric PSNR is also computed using the default factor of 3 in the numerator of the ratio, as implemented in the software. For the plane-to-plane (pl2plane) metric, the version 1.0 of the software released in [Reference Alexiou and Ebrahimi15] is employed. The RMS and MSE are used to compute a total angular similarity value. For the point-based metrics that assess color-only information, the original RGB values are converted to the YCbCr color space following the ITU-R Recommendation BT.709-6 [68]. The luma and the color channels are weighted based on equation (4), following [Reference Ohm, Sullivan, Schwarz, Tan and Wiegand69], before computing the color PSNR scores. Note that the same formulation is used to compute the color MSE scores.

For each aforementioned metric, the symmetric error is used. When available, normal vectors that are associated with a content were employed to compute metrics that require such information; that is, the models that belong to the MPEG repository excluding head, which was voxelized for our needs as indicated in Table 2. For the rest of the contents, normal estimation based on a plane-fitting regression algorithm was used [Reference Hoppe, DeRose, Duchamp, McDonald and Stuetzle70] with 12 nearest neighbors, as implemented in Point Cloud Library (PCL) [Reference Rusu and Cousins71].
For the projection-based approaches, captured views of the 3D models are generated using the proposed rendering technology on bitmaps of $1024\times 1024$ resolution. Note that the same canvas resolution was used to display the models during the subjective evaluations. The stimuli are captured from uniformly distributed positions that are lying on the surface of a surrounding view sphere. A small number of viewpoints might lead to omitting informative views of the model with high importance [Reference Alexiou and Ebrahimi19]. Thus, besides the default selection of $K = 6$
 [Reference Torlig, Alexiou, Fonseca, de Queiroz and Ebrahimi18], it was decided to form a second set of a higher number of views (K = 42) in order to eliminate the impact of different orientations that exhibit across the models and capture sufficient perspectives. The K = 6 points were defined by the positions of vertices of a surrounding octahedron, and the K = 42 points were defined by the coordinates of vertices after subdivision of a regular icosahedron, as proposed in [Reference Lavoué, Larabi and Vás̆a48]. In both cases, the points are lying on a view sphere of radius equal to the camera distance used to display the initial view to the subjects, with the default camera zoom value. Finally, the camera direction vector points towards the origin of the model, in the middle of the scene.
The projection-based objective scores are computed on images obtained from a reference and a corresponding distorted stimulus, acquired from the same camera position. The parts of the images that correspond to the background of the scene can be optionally excluded from the calculations. In this study, four different approaches were tested for the definition of the sets of pixels over which the 2D metrics are computed: (a) the whole captured image without removing any background information; a mid-gray color was set and used during subjective inspection, (b) the foreground of the projected reference, (c) the union, and (d) the intersection of the foregrounds of the projected reference and distorted models.
The PSNR, SSIM, MS-SSIM [Reference Wang, Simoncelli and Bovik72], and VIFp [Reference Sheikh and Bovik73] (i.e. in pixel domain) algorithms are applied on the captured views, as implemented by open-source MATLAB scriptsFootnote 8, which were modified accordingly for background information removal. Finally, a set of pooling algorithms (i.e. $l_{p}$ -norm, with $p \in \lbrace 1, 2, \infty \rbrace$
 ) was tested on the individual scores per view, to obtain a global distortion value.
4) Benchmarking of objective quality metrics
To evaluate how well an objective metric is able to predict the perceived quality of a model, subjective MOS are commonly set as the ground truth and compared to predicted $\mbox {MOS}$ values that correspond to objective scores obtained from this particular metric. Let us assume that the execution of an objective metric results in a Point cloud Quality Rating (PQR). In this study, a predicted $\mbox {MOS}$
 , denoted as $\mbox {P(MOS)}$
 , was estimated after regression analysis on each [PQR, MOS] pair. Based on the Recommendation ITU-T J.149 [74], a set of fitting functions was applied, namely, linear, monotonic polynomial of third order, and logistic, given by equations (5), (6), and (7), respectively.


where a, b, c, and d were determined using a least squares method, separately for each regression model. Then, following the Recommendation ITU-T P.1401 [65], the PLCC, the SROCC, the RMSE, and OR indexes were computed between $\mbox {MOS}$ and $\mbox {P(MOS)}$
 , to assess the performance of each objective quality metric.
C) Results
1) Inter-laboratory analysis
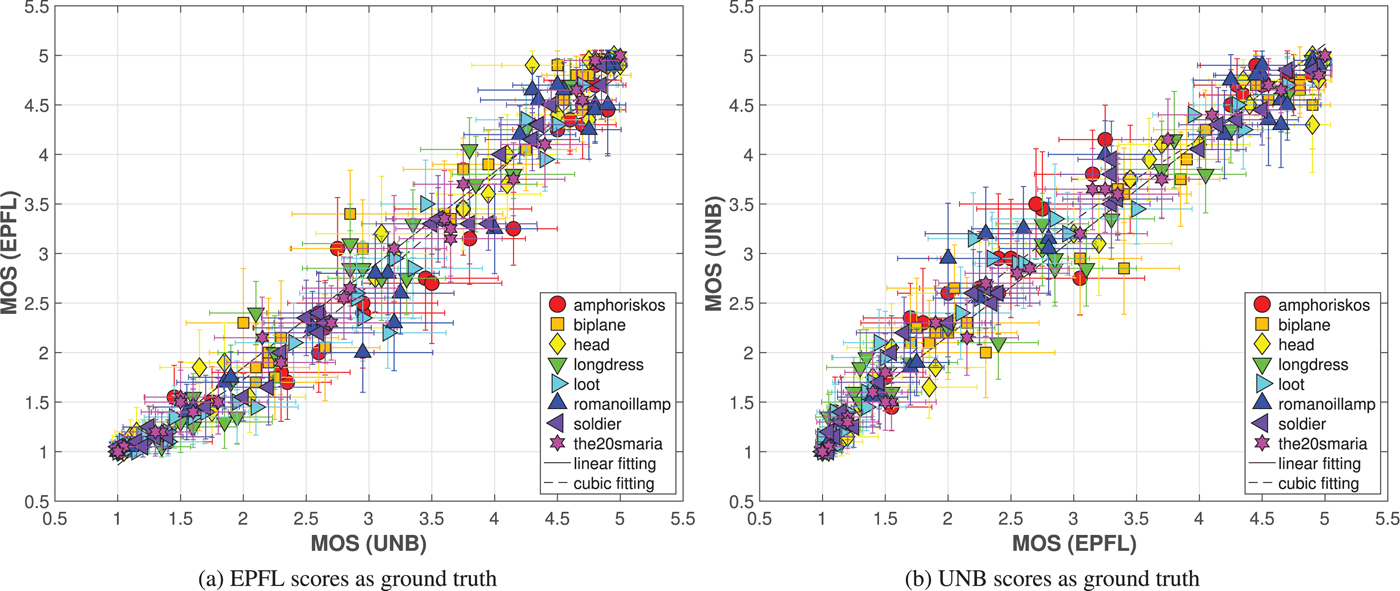
In Fig. 7, scatter plots indicating the relationship between the ratings of each stimulus from both laboratories are presented. The horizontal and vertical bars associated with every point depict the CIs of the scores that were collected in the university indicated by the corresponding label. In Table 3, the performance indexes from the correlation analysis that was conducted using the scores from both laboratories as ground truth are reported. As can be observed, the subjective scores are highly-correlated. The CIs obtained from the UNB scores are on average $8.25\%$ smaller with respect to the CIs from EPFL ratings, indicating lower score deviations in the former university. Although the linear fitting function achieves an angle of $44.62^{\circ }$
 , with an intercept of $-0.12$
 (using EPFL scores as ground truth), it is evident from the plots that for mid-range visual quality models, higher scores are observed in UNB. Thus, naturally, the usage of a cubic monotonic fitting function can capture this trend and leads to further improvements, especially when considering the RMSE index. The 100% correct estimation index signifies no statistical differences when comparing pairs of MOS from the two labs individually; however, the high CIs associated with each data point assist on obtaining such a result.
Scatter plots indicating correlation between subjective scores from the participating laboratories. (a) EPFL scores as ground truth. (b) UNB scores as ground truth.
Performance indexes depicting the correlation between subjective scores from the participating laboratories.

In Fig. 8 the SOS fitting for scores obtained at EPFL and UNB is illustrated, with respective $95\%$ confidence bounds. As shown in the plot, the values of a are very similar and lie within the confidence bound of the other, with an MSE of 0.0360 and 0.0355, respectively. When combining the results of both tests, we obtain $a = 0.2755$
 with an MSE of 0.0317.
MOS versus SOS fitting for scores obtained in EPFL and UNB, with relative SOS coefficient a. The shaded plot indicates the $95\%$ confidence bounds for both fittings.
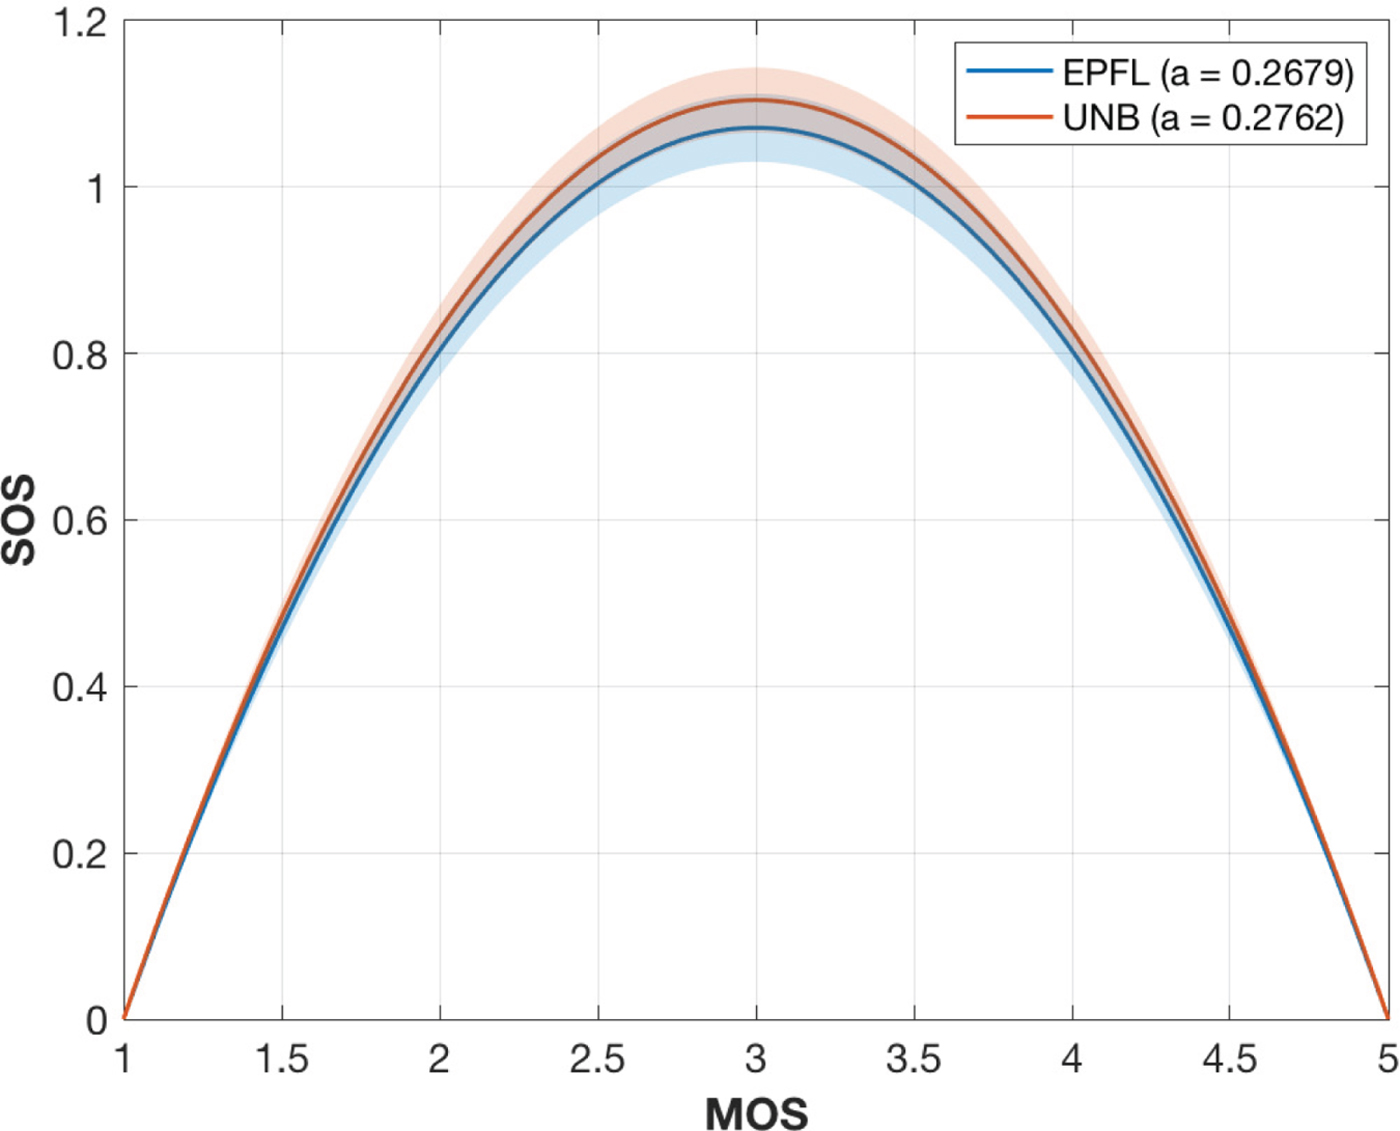
The high performance indexes values and the similar a coefficients suggest that the results from the two experiments are statistically equivalent and the scores can be safely pooled together. Thus, for the next steps of our analysis, the two sets are merged and the MOS as well as the CIs are computed on the combined set, assuming that each individual rating is coming from the same population.
2) Subjective quality evaluation
In Fig. 9, the MOS along with associated CIs are presented against bit rates achieved by each codec, per content. The bit rates are computed as the total number of bits of an encoded stimulus divided by the number of input points of its reference version. Our results show that for low bit rates, V-PCC outperforms the variants of G-PCC, which is in accordance with the findings of [Reference Su, Duanmu, Liu, Liu and Wang22], especially in the case of the cleaner set of point clouds that represents human figures. This trend is observed mainly due to the texture smoothing done through low-pass filtering, which leads to less annoying visual distortions with respect to the aggressive blockiness and blurriness that are introduced by the G-PCC color encoders at low bit rates. Another critical advantage is the ability of V-PCC to maintain, or even increase the number of output points while the quality is decreasing. In the case of more complex and rather noisy contents, such as biplane and head, no significant gains are observed. This is due to the high bit rate demands to capture the complex geometry of these models, and the less precise shape approximations by the set of planar patches that are employed.
MOS against degradation levels defined for each codec, grouped per content under evaluation. In the first row, the results for point clouds representing objects are provided, whereas in the second row, curves for the human figure contents are illustrated. (a) amphoriskos, (b) biplane, (c) head, (d) romanoillamp, (e) loot, (f) longdress, (g) soldier, (h) the20smaria.
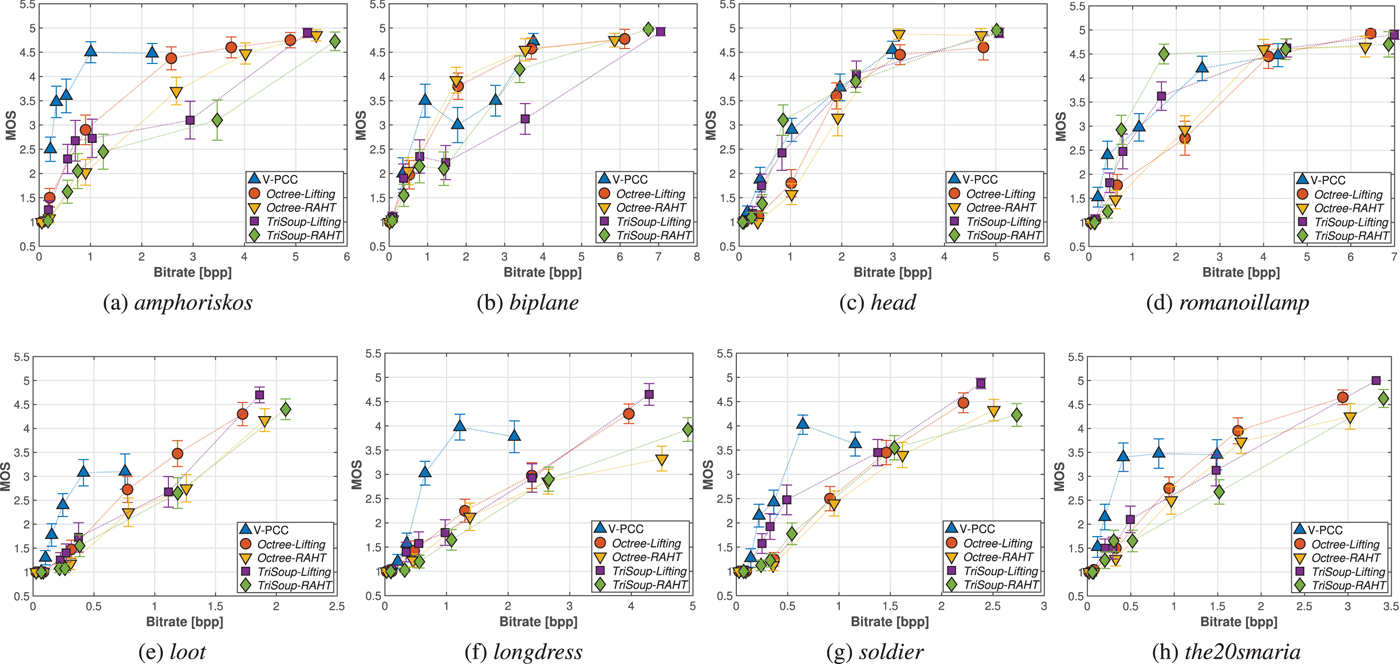
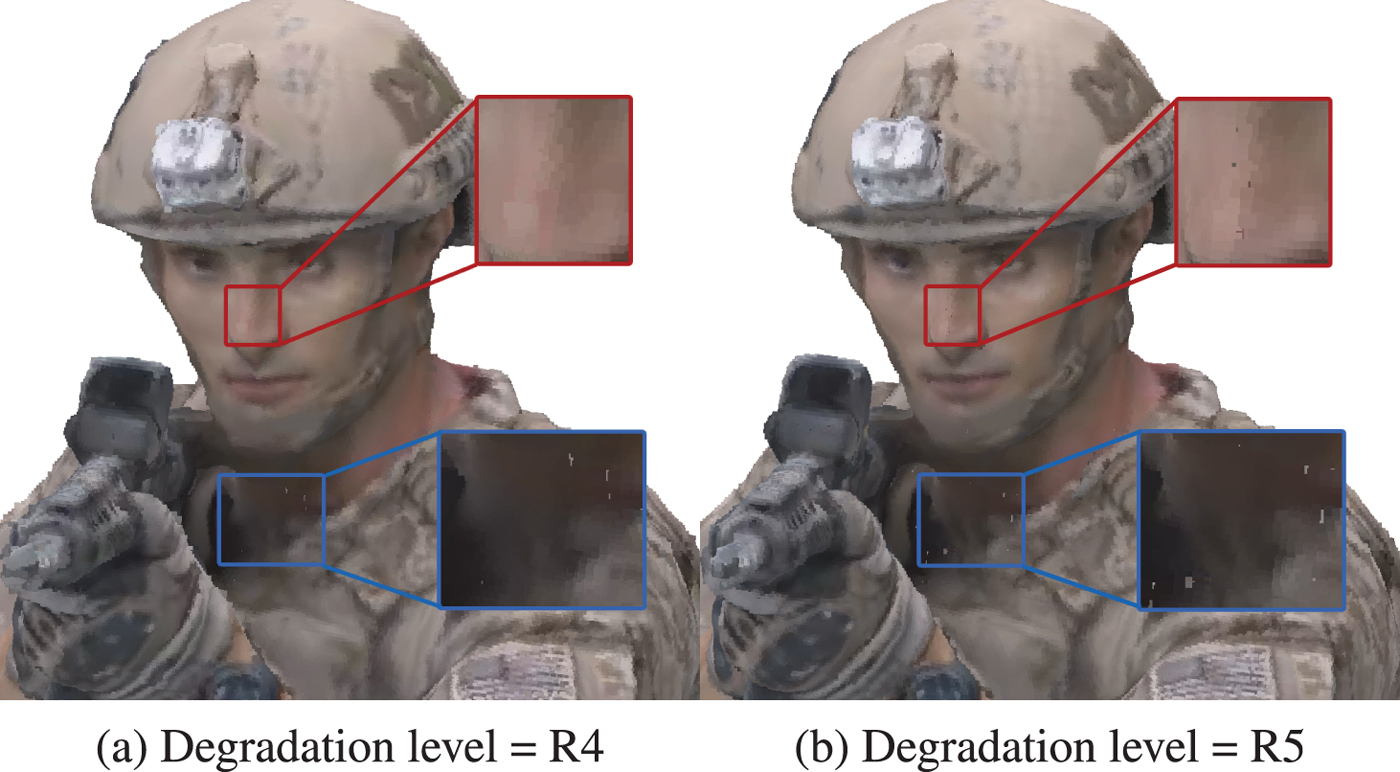
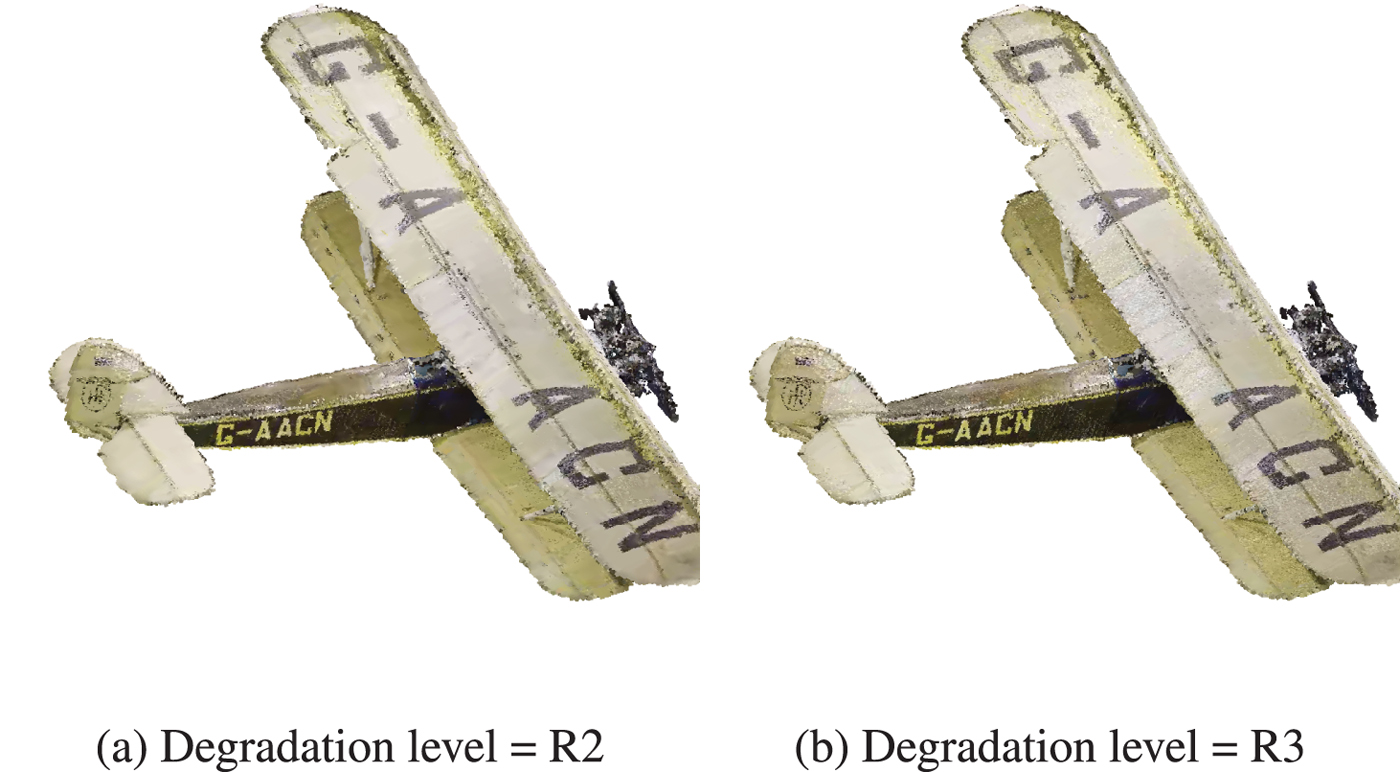
Although highly efficient at low bit rates, V-PCC does not achieve transparent, or close to transparent quality, at least for the tested degradation levels. In fact, a saturation, or even a drop in the ratings is noted for the human figures when reaching the lowest degradation. This is explained by the fact that subjects were able to perceive holes across the models, which comes as a result of point reduction. The latter is a side effect of the planar patch approximation that does not improve the geometrical accuracy. An exemplar case can be observed in Fig. 10 for the soldier model. Another noteworthy behavior is the drop of the visual quality for biplane, between the second and the third degradation level. This is observed because, while the geometric representation of both stimuli is equally coarse, in the first case the more drastic texture smoothing essentially reduces the amount of noise, leading to more visually pleasing results, as shown in Fig. 11.
Soldier encoded with V-PCC. Although the R4 degraded version is blurrier with respect to R5, missing points in the latter model were rated as more annoying (examples are highlighted in the figures). (a) Degradation level = R4. (b) Degradation level = R5.
Biplane encoded with V-PCC. The color smoothing resulting from the low-pass filtering in texture leads to less annoying artifacts for R2 with respect to R3. (a) Degradation level = R2. (b) Degradation level = R3.
Regarding the variants of the G-PCC geometry encoding modules, no decisions can be made on the efficiency of each approach, considering that different bit rates are in principle achieved. By fixing the bit rate and assuming that interpolated points provide a good approximation of the perceived quality, it seems that the performance of Octree is equivalent or better than the TriSoup, for the same color encoder. The Octree encoding module leads to sparser content representations with regular displacement, while the number of output points is increasing as the depth of the octree increases. The TriSoup geometry encoder leads to coarser triangular surface approximations, as the level is decreasing, without critically affecting the number of points. Missing regions in the form of triangles are typically introduced at higher degradation levels. Based on our results, despite the high number of output points when using the TriSoup module, it seems that the presence of holes is rated, at best, as equally annoying. Thus, this type of degradation does not bring any clear advantages over sparser, but regularly sampled content approximations resulting from the Octree.
Regarding the efficiency of the color encoding approaches supported by G-PCC, the Lifting color encoding module is found to be marginally better than the RAHT module. The latter encoder is based on 3D Haar transform and introduces artifacts in the form of blockiness, due to the quantization of the DC color component of voxels at lower levels which is used to predict the color of voxels at higher levels. The former encoder is based on the prediction of a voxel's color value based on neighborhood information, resulting in visual impairments in the form of blurriness. Supported by the fact that close bit rate values were achieved by the two modules, a one-tailed Welch's t-test is performed at $5\%$ significance value to gauge how many times one color encoding module is found to be statistically better than the other, for Octree and TriSoup geometry encoders separately. Results are summarized in Table 4, and show a slight preference for the Lifting module with respect to the RAHT module. In fact, in the Octree case, the Lifting model is either considered equivalent or better than the RAHT counterpart, the opposite being true only for the lowest degradation values R5 and R6 for one out of eight contents. In the TriSoup case, the number of contents for which the Lifting module is considered better than RAHT either surpasses or matches the number of contents for which the opposite is true. Thus, we can generalize that a slight preference for the Lifting encoding scheme can be observed with respect to the RAHT counterpart.
Results of the Welch's t-test performed on the scores associated with color encoding module Lifting and RAHT, for geometry encoder Octree and TriSoup and for every degradation level. The number indicates the ratio of contents for which the color encoding module of each row is significantly better than the module of each column.

3) Objective quality evaluation
In Table 5 the performance indexes of our benchmarking analysis are reported, for each tested regression model. Note that values close to 0 indicate no-linear for PLCC and no-monotonic relationship for SROCC, while values close to 1 or $-1$ indicate high positive or negative correlation, respectively. For the point-based approaches, the symmetric error is used. For the projection-based metrics, benchmarking results using the set of K = 42 views are presented, since the performance was found to be better with respect to the set of K = 6. Regarding the region over which the metrics are computed, the union of the projected foregrounds is adopted, since this approach was found to outperform the alternatives. It is noteworthy that clear performance drops are observed when using the entire image, especially for the metrics PSNR, SSIM, and MS-SSIM, suggesting that involving background pixels in the computations is not recommended. Regarding the pooling algorithms that were examined, minor differences were identified with slight improvements when using $l_{1}$
 -norm. In the end, a simple average was used across the individual views to obtain a global distortion score.
Performance indexes computed on the entire dataset. The best index across a metric is indicated with bold text, for each regression model.

According to the indexes of Table 5, the best-performing objective quality metric is found to be the point-to-plane using MSE, after applying a logistic regression model. However, despite the high values observed for linearity and monotonicity indexes, the low performance of accuracy and consistency indexes confirms that the predictions do not accurately reflect the human opinions. It is also worth noting that this metric is rather sensitive to the selection of the fitting function. To obtain an intuition about the performance, a scatter plot showing of the MOS against the corresponding objective scores is illustrated in Fig. 12(a), along with every fitting function. In Fig. 12(b), a closer view in the region of high-quality data-points is provided, confirming that no accurate predictions are obtained; for instance, in the corner case of romanoillamp, an objective score of 0.368 could correspond to subjective scores ranging from 1.225 up to 4.5 in a 5-grading scale.
Scatter plots of subjective against objective quality scores for the best-performing objective metric, among all regression models. (a) Performance across the entire range of objective scores. (b) Performance in a region of lower degradation levels.
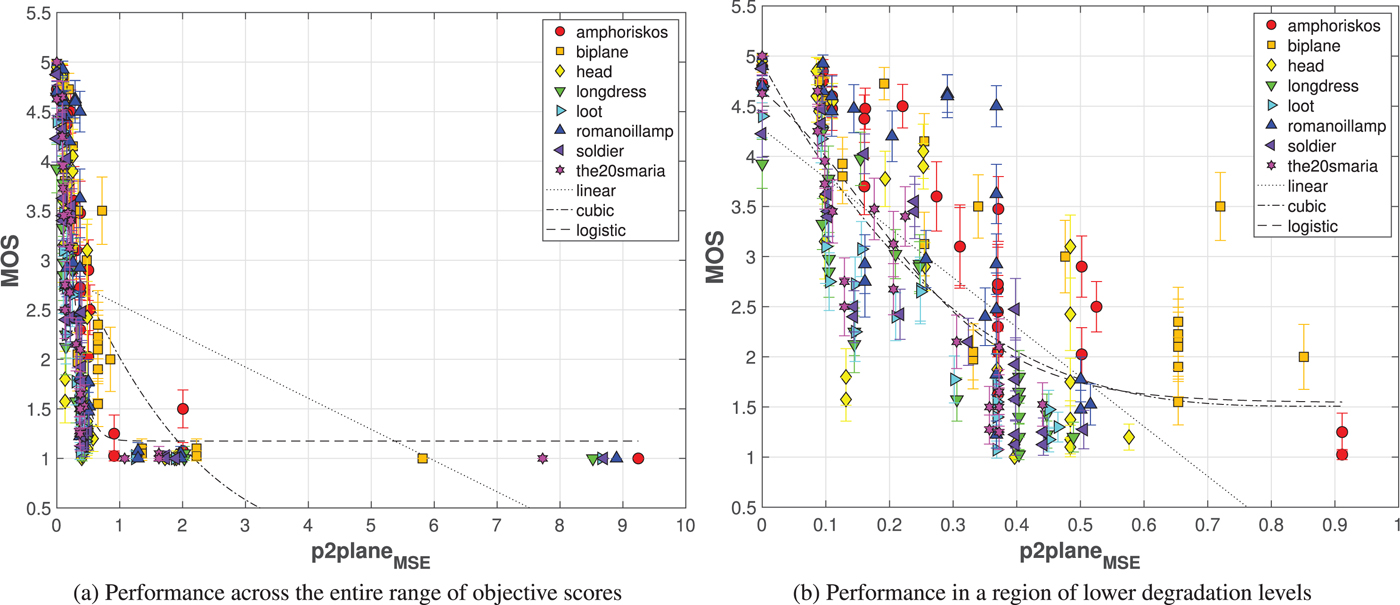
Figure 13 illustrates the performance of the point-to-plane metric using MSE with PSNR, and the projection-based VIFp, which attain the best performance in the majority of the tested regression models. The limitation of the former metric in capturing color degradations is evident, as contents encoded with the same geometry level, but different color quality levels, are being mapped to the same objective score, whereas they are rated differently in the subjective experiment. For the latter metric, although high correlation between subjective and objective scores is observed per model, its generalization capabilities are limited. In particular, it is obvious that different objective scores are obtained for different models whose visual quality is rated as equal by subjects. The main reason behind this limitation is due to the different levels and types of noise which are present in the reference point cloud representations. Typical acquisition artifacts lead to the presence of noisy geometric structures, missing regions, or color noise and, thus, in models of varying reference quality. Hence, compression artifacts have a different impact in each content, whereas typical projection-based metrics, although full-reference, are optimized for natural images and cannot capture well such distortions. The diversity of color and geometry characteristics of the selected dataset might explain why results are so varied.
Scatter plots of subjective against objective quality scores for the best-performing objective metric, for the majority of regression models. (a) Performance of the best point-based quality metric. (b) Performance of the best projection-based quality metric.
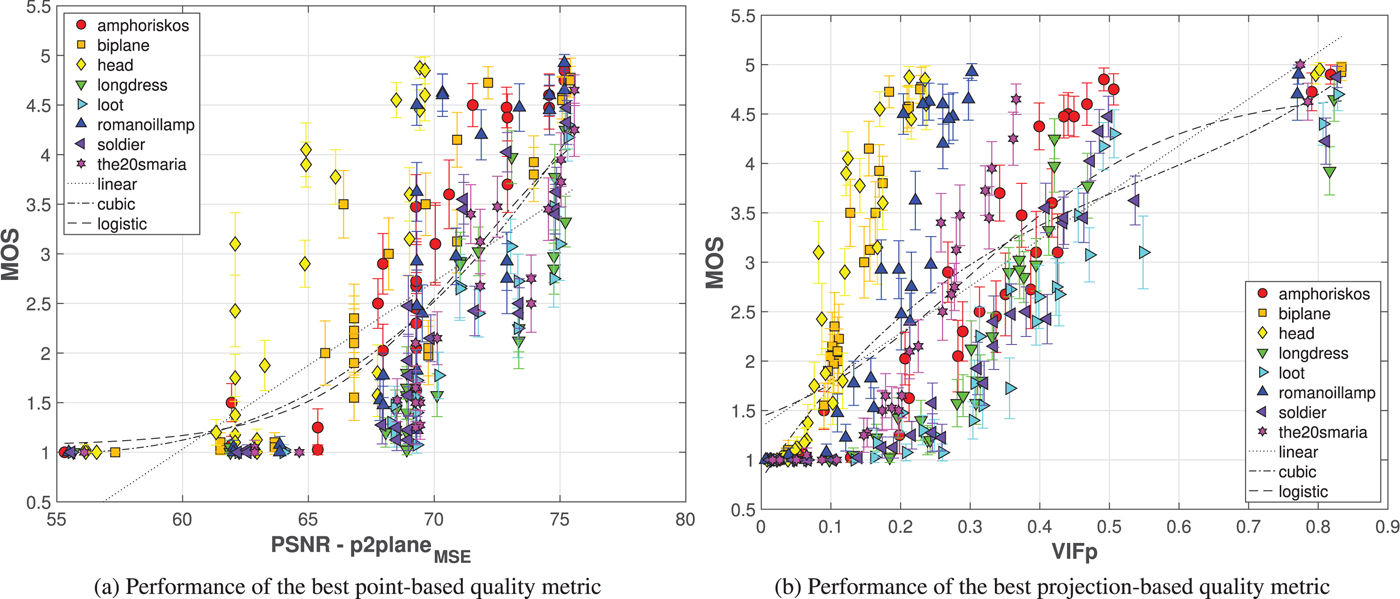
Objective scores from VIFp are markedly increased for models subject to color-only distortions that are obtained with TriSoup geometry codec for degradation level R6 (points on the top-right corner of the Fig. 13(b)). Notice that high scores were similarly given by subjects to contents under geometric losses; however, their visual quality was underrated by the metric. Specifically, in this example, it can be observed that high-quality models with MOS between 4.5 and 5, are mapped to a large span of VIFp values ranging from 0.17 to 0.833. This is an indication of the sensitivity of the projection-based metrics to rendering artifacts due to geometric alterations. This can be explained by the fact that different splat sizes are used depending on the geometric resolution of the model; thus, computations in a pixel-by-pixel basis (or small pixel neighborhoods) will naturally be affected by it, even when the impact on visual perception is minor.
Our benchmarking results indicate the need for more sophisticated solutions to ensure high performance in a diverse set of compression impairments and point cloud datasets. It should be noted that, although in previous studies [Reference Torlig, Alexiou, Fonseca, de Queiroz and Ebrahimi18,Reference Alexiou and Ebrahimi19] the projection-based metrics were found to excel with much better performance indexes, the correlation analysis was conducted per type of model; that is, after dividing the dataset to point clouds that represent objects and human figures. By following the same methodology, it is evident that the performance of every metric remarkably improves. Indicatively, benchmarking results of VIFp on the objects dataset leads to PLCC and SROCC of 0.810 and 0.832, respectively, while on the human figures dataset, the PLCC is 0.897 and the SROCC is 0.923 using the logistic regression model, which was found to be the best for this metric. Moreover, in previous efforts [Reference Torlig, Alexiou, Fonseca, de Queiroz and Ebrahimi18,Reference Alexiou and Ebrahimi19], although a wide range of content variations was derived by combining different levels of geometry and color degradation levels, the artifacts were still introduced by a single codec. In this study, compression artifacts from five different encoding solutions are evaluated within the same experiment, which is obviously a more challenging set-up.
4) Limitations
The experiment described in this section provides a subjective and objective evaluation of visual quality for point cloud contents under compression artifacts generated by the latest MPEG efforts on the matter. However, this study is not without its limitations.
To ensure a fair comparison, the MPEG Common Test Conditions were adopted in selecting the encoding parameters. However, the configurations stated in the document do not cover the range of possible distortions associated with point cloud compression. The fact that V-PCC fails to reach transparent quality is an illustration.
Moreover, for a given target bit rate, different combinations of geometry and color parameters could be tested, resulting in very different artifacts. The encoding configurations defined in the MPEG Common Test Conditions focus on degrading both geometry and color simultaneously. Although the obtained settings are suitable for comparison purposes of updated versions of the encoders, there is no other obvious reason why this should be enforced. Thus, it would be beneficial to test whether a different rate allocation could lead to better visual quality. In addition, reducing the quality of both color and geometry simultaneously does not allow to test the performance of the objective metrics on critical issues. For instance, it would be interesting to see how point-based metrics behave when the quality of the texture is degraded more, or less than the corresponding geometry; since in the applied configurations both are manipulated at the same time and with a uniform step, it is hard to gauge whether they are effective in capturing such distortions.
Furthermore, the selection of the encoding parameters leads to large variations in file size, and consequently on achieved bit rates. This makes comparing different encoding solutions particularly challenging, as they are not studied at the same conditions, while interpolated curves do not necessarily provide good approximations of the actual behaviour of the codecs.
Finally, the choice of parameters results in some configurations not being evaluated. For example, the best configurations for TriSoup (R6) corresponds to the Octree encoding module; conversely, the approximation level 1 is never tested. Several intermediate solutions, arising from a more varied approach in selecting both depth and level parameters, are not tested.
VI. EXPERIMENT 2: RATE ALLOCATION OF TRISOUP GEOMETRY ENCODING MODULE
Results from the first experiment showed that, while clear gains in compression efficiency could be seen when adopting V-PCC for point cloud encoding, drawing conclusions about the differences between Octree and TriSoup encoding in G-PCC is more challenging. In order to gain more insights on the impact of geometry encoding, a second experiment was conducted to determine whether particular types of geometry artifacts are preferred against others. For the comparison between the two geometry encoders, a pair comparison methodology with ternary voting system was selected due to its high discriminatory power.
A) Experiment design
Five contents were selected out of the eight tested in the first experiment, to reduce the length and cost of the subjective assessment, while maintaining a wide range of variety. In particular, two models representing objects (amphoriskos and biplane) and three models representing human figures (longdress, loot, and the20smaria) were chosen for the test. For each content, two target bit rates were selected after expert viewing, to model high and low levels of quality degradations. At every bit rate point, four geometry configurations of the G-PCC codec were evaluated. In particular, the highest depth value d that matched the targeted bit rate without employing surface approximation was selected (TriSoup level value l set to 0). This would represent the pure Octree encoding module, labeled with G0. Subsequently, combinations of d and l were selected such that the final encoded point cloud would meet the bit rate requirements, for $l = \{1, 2, 3\}$ . For l = 1 (configuration G1), that meant decreasing the value of d with respect to configuration G0, as the TriSoup configuration is expected to generate a higher number of points for level 1 with respect to the Octree. This is due to the fact that TriSoup creates a surface approximation of the occupied blocks, constrained to intersect each edge of the block at most once. For l = 1 (which signifies a block size of $2\times 2\times 2$
 voxels), this results in an increase in the amount of points for the decoded point cloud. For $l = 2, 3$
 , the number of points is decreasing by the progressively larger block sizes; thus, increasing values of d were chosen to match the bit rate (configurations G2 and G3). This procedure was followed for both high and low target bit rates, leading to 8 configurations per content, for a total of 40 stimuli. For all configurations, the Lifting color module was used, as a slightly better performance was shown in the previous test with respect to RAHT. The color QP was always set to 4 to ensure no color degradations, which could have an effect on the rating. A summary of the encoding parameters and achieved bit rate for each content can be found in Table 6.
Selected encoding parameters of G-PCC for experiment 2, for high and low target bit rates. The depth parameter indicates the resolution of the Octree structure, whereas the level parameter indicates the TriSoup approximation.

ITU-T Recommendations advise employing a pair comparison approach when stimuli are nearly equal in quality [75]. In order to avoid forced choices in case of imperceptible differences among the two stimuli, a ternary voting system was adopted. Each subject was presented a pair of point cloud stimuli, displayed in a side-by-side manner, and was asked to declare which of the two models they preferred, with the option of no preference. The comparisons were only performed between the same content and within the same target bit rate, for a total of 60 pairs to be assessed. Particular care was given to avoid displaying the same content consecutively, while the order of the stimuli was randomized per subject.
The test was performed in UNB. The same room, and identical configurations for the rendering software and model visualization, as described in Section V.A, were used for this experiment. One training example was shown to the subjects to help them familiarize with the testbed and the task at hand; two identical stimuli with high quality that were not part of the test were used for the purpose. Additionally, one dummy content was added at the beginning of the test to ease participants into the task, and the associated scores were discarded. A total number of 25 subjects participated, involving 13 males and 12 females, with an average of 25 years of age.
B) Data processing
Outlier detection was performed on the data according to [Reference Lee, Goldmann and Ebrahimi76]. One outlier was found, and the scores associated with it were subsequently discarded.
For each pair under assessment, the winning frequency $w_{ij}$ of stimulus i against stimulus j was computed, along with the ties $t_{ij}$
 . In order to obtain the preference probabilities, the winning and tie frequencies were divided by the total number of subjects after outlier detection.
The normalized MOS scores on a 0–100 scale were obtained from the winning frequencies by applying the Bradley–Terry–Luce model, according to the Recommendation ITU-T J.149 [74].
C) Results
Figures 14 and 15 depict the preference and tie probabilities for each pair of configurations i and j under test, for each content, for high and low target bit rates, respectively.
Preference and tie probabilities for each pair of configurations under test in experiment 2, for the high bit rate case. The color blue (yellow) of the bar indicates the probability of the configuration on the left (right) side being preferred over the one on the right (left) side. The orange bar indicates the tie probability. (a) amphoriskos. (b) biplane. (c) longdress. (d) loot. (e) the20smaria.
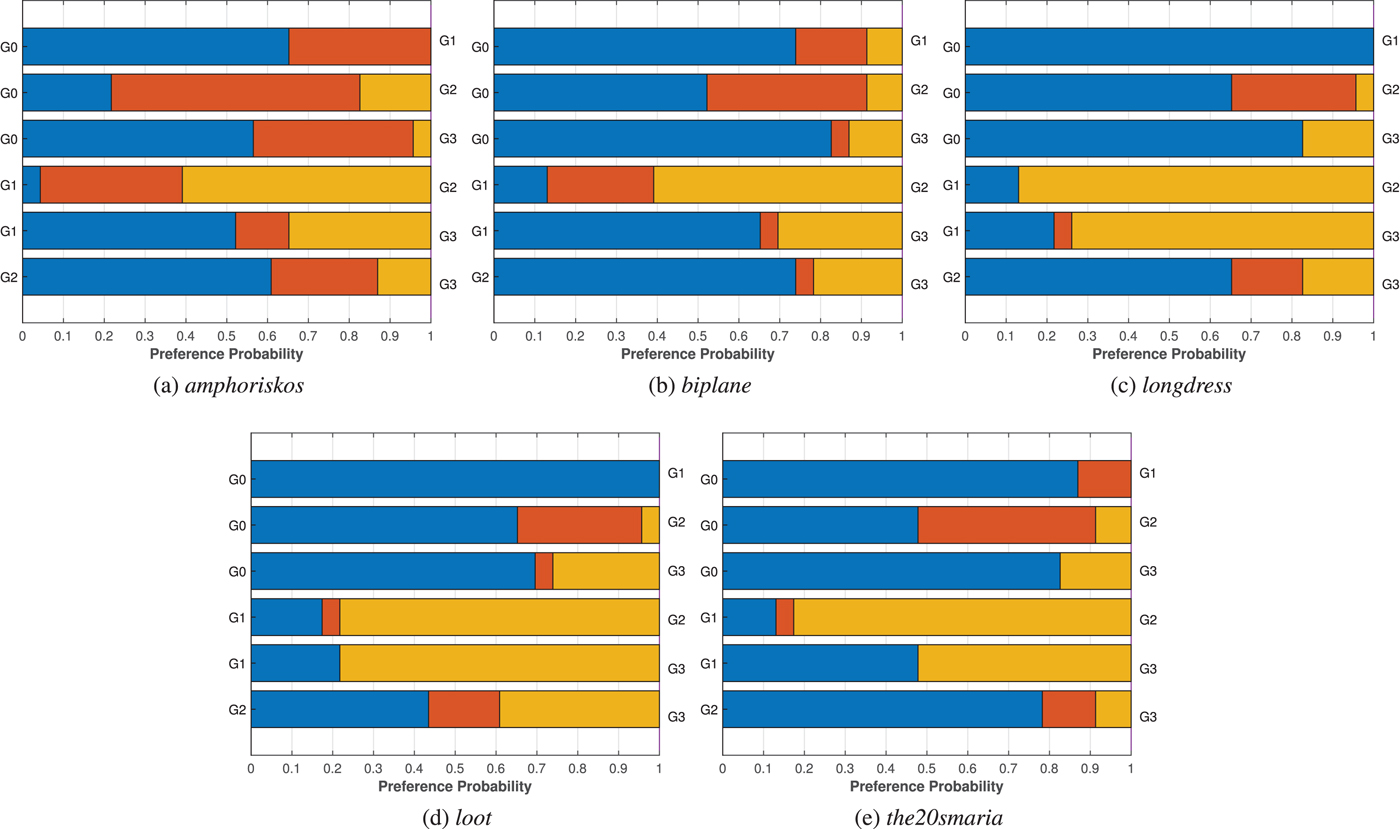
Preference and tie probabilities for each pair of configurations under test in experiment 2, for the low bit rate case. The color blue (yellow) of the bar indicates the probability of the configuration on the left (right) side being preferred over the one on the right (left) side. The orange bar indicates the tie probability. (a) amphoriskos. (b) biplane. (c) longdress. (d) loot. (e) the20smaria.
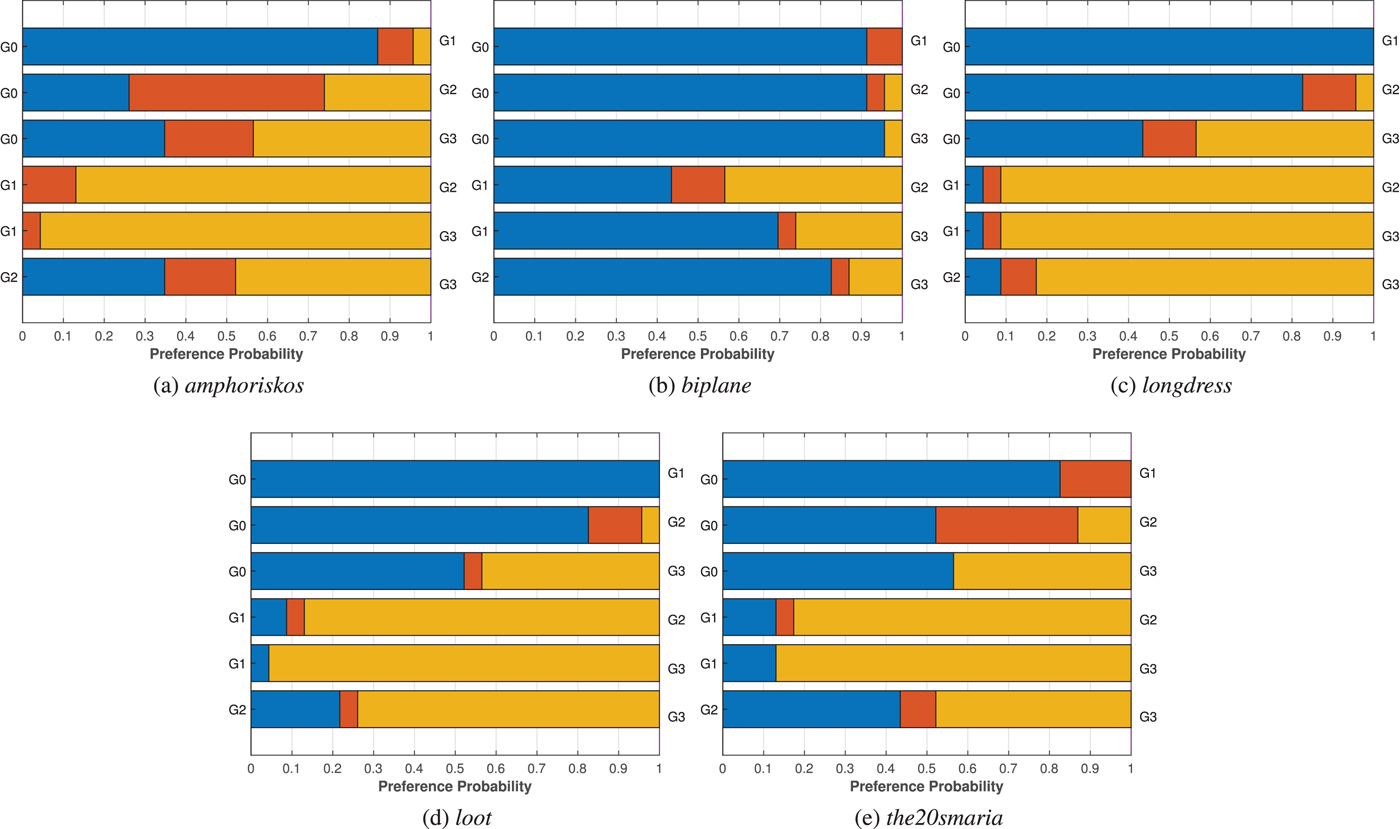
Results show that the pure Octree configuration G0 is clearly the preferred approach. This conclusion can be drawn from the preference probabilities, which indicate that it is likely for the Octree to be rated as either equal or better in perceived quality with respect to all the other configurations, for both low and high bit rates. The sole exception in this trend is the comparison of G0 with G3 for amphoriskos, at low bit rate, for which the latter configuration is preferred more frequently. In fact, when discarding the ties in the computation of the winning frequencies, configuration G0 is considered as worse than one of the other configurations in only $8.70\%$ and $15.65\%$
 for high and low bit rates, respectively. Ties account for $16\%$
 of the total number of ratings assigned to G0.
Conversely, configuration G1 seems to yield the worst performance, as it is considered better than other configurations in only $14\%$ of the cases, and is rated as worse in $77.10\%$
 of the cases ($71.30\%$
 and $88.70\%$
 for high and low bit rates, respectively). In comparison, configuration G2 is rated as worse in $36.09\%$
 of the cases, and configuration G3 in $48.99\%$
 of the cases, while ties account for $18.26\%$
 and $8.12\%$
 , respectively.
Considering the high bit rate case, besides configuration G0, which is likely to be either preferred or considered equal to all other configurations, G2 is the second-best configuration, as it is rated as better than configurations G1 and G3 in the majority of the cases, and is considered nearly equal to configuration G3 for content loot. It is worth mentioning that it is also considered nearly equivalent in quality with configuration G0 for content amphoriskos. Finally, configuration G3 is rated as yielding better results with respect to configuration G1 for point clouds representing human figures, whereas for object models, it is rated as worse than G1. However, it is universally considered worse than configuration G0 and G2, with the aforementioned exception of content loot.
For the low bit rate case, G0 is confirmed as the approach yielding the best results, as it is always outperforming G1 and is rated to be either better or equivalent to configurations G2 and G3. Configuration G1 is outperformed by all the other configurations, with the notable exception of content biplane, for which it is considered equivalent with respect to configuration G2, and for which it outperforms configuration G3. The outlier behavior of this content can be explained by the presence of noise in its reference version, which has an impact on the perception of geometry degradation. Between configurations G2 and G3, the latter is preferred, as it achieves either equivalent or better quality with respect to the former. Thus, it appears that a better depth resolution was preferred for low bit rates, even if it came at the cost of a coarser surface approximation, at least when comparing TriSoup levels 2 and 3.
Figure 16 depicts the normalized MOS obtained from the winning frequencies, along with the respective CIs, as averaged across the contents. The blue bar represents the scores associated to the high bit rate, whereas the orange bar represents the scores associated to the low bit rate. Results clearly show the superiority of the Octree configuration with respect to the TriSoup ones; moreover, they confirm that configuration G1 seems to yield the worst performance in terms of visual quality. For high bit rate, configuration G2 is preferred with respect to configuration G3, whereas for low bit rate, the opposite was found to be true.
Normalized MOS and relative CIs obtained from the winning frequencies gathered in experiment 2, for each configuration, averaged across the contents, separately for high and low target bit rates.
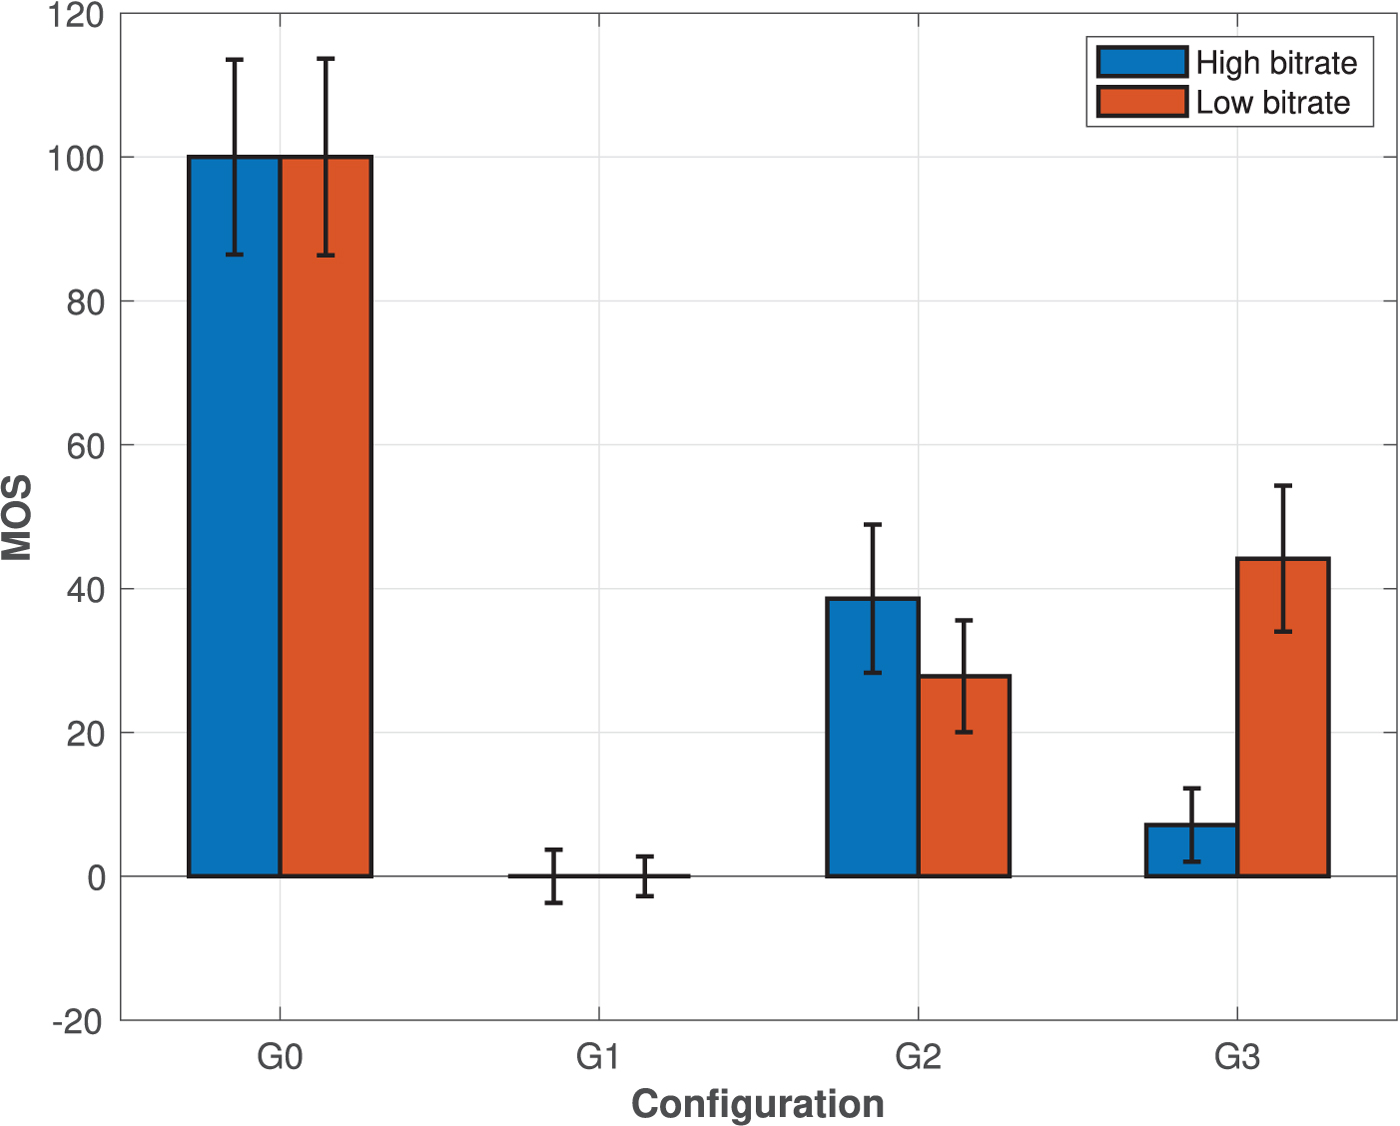
Results of the subjective experiment show that the surface approximation generated by the TriSoup module is rarely considered as superior than the regular Octree structure. This is especially true when the surface approximation is done at level l = 1, which, for the same bit rate, demands a lower depth precision with respect to the Octree module. Increasing the depth precision by applying a coarser surface approximation (l = 2, 3) yields better results within the TriSoup module; however, the quality is still considered worse than what obtained at a lower depth precision by the Octree module.
VII. EXPERIMENT 3: RATE ALLOCATION FOR GEOMETRY AND COLOR ENCODING MODULES
One of the main limitations of the first experiment can be pinpointed to its inability to analyze geometry and color degradations separately, or to identify the impact of different levels of impairment on the visual quality due to the simultaneous quality reduction in both texture and geometry. However, since several configurations of the geometry and texture encoding modules could lead to the same target bit rate, it is not a given that choosing a medium level of degradation for both modules will lend the best possible results in terms of perceived quality. For instance, discarding some geometry information to be able to increase the quality of the texture encoding, or the opposite, could lead to more visually pleasing outcomes. Thus, it is critical to assess whether between the geometry and texture encoders and within a target bit rate, which bit allocation is most efficient and visually pleasant.
In order to test which combination of color and geometry encoding parameters would lead to the best results in terms of visual quality, a third experiment was conducted. For this purpose, as for the second experiment, a pair comparison methodology with ternary voting system was selected.
A) Experiment design
The same contents that were selected for the second experiment were also used in this test. For each content, two target bit rates were chosen based on the results of experiment 1, to model medium-high and medium-low levels of quality degradation in terms of both geometry and color. The Octree geometry in combination with the Lifting color encoding modules were adopted as the individually preferred alternatives from the previous experimentation. For contents amphoriskos and biplane, bit rate R3 was selected for the low target bit rate and R4 was selected for the high target bit rate, whereas for contents longdress, loot and the20smaria bit rates R4 and R5 were selected as low and high target bit rate, respectively. Those encoded contents would form configuration B0. For every rate, the geometry and color quantization parameters were modified such that the same target bit rate would be achieved. This is performed by either decreasing the parameter depth, which would allow allocation of more bits to the texture encoder (configuration B1), or by increasing the depth in the geometry encoder, which would lead in quality reduction of the texture encoder to match the target bit rate (configuration B2). This way, the configuration of preference can be obtained in a rate allocation problem.
A summary of the encoding parameters and achieved bit rates per content is reported in Table 7. We remind the readers that higher levels of QP correspond to a coarser color encoding, whereas lower levels of depth represent a decrease in geometry precision.
Selected encoding parameters of G-PCC for experiment 3, for high and low target bit rates. The depth parameter indicates the resolution of the Octree structure, whereas the QP parameter indicates the quantization parameter for the Lifting encoding module.

The same methodology described in Section VI was employed in this experiment. This test was performed at EPFL, and the same room and rendering conditions described in Section VI.A were used for the experiment. One training example was shown to the subjects to help them familiarize with the testbed and the task at hand; two identical contents with high quality that were excluded from the test were used for the purpose. Additionally, one dummy content was added at the beginning of the test to ease participants into the task, and the associated scores were discarded. The same guidelines were followed for the order and presentation of the stimuli under assessment. A total number of 25 subjects participated, involving 17 males and eight females, with an average of 29.13 years of age.
B) Data processing
Outlier detection was performed on the data according to [Reference Lee, Goldmann and Ebrahimi76]. No outlier was detected among the subjects. The same data processing as described in Section VI.B was adopted to obtain the preference and tie probabilities.
C) Results
Figures 17 and 18 present the preference and tie probabilities for each pair of configurations i and j under test, for each content, for high and low target bit rates, respectively. Results show that, depending on the content and its target bit rate, different rate allocation for geometry and color can be preferred. For the high bit rate case, configuration B2 seems to yield better results than its counterparts for contents longdress, loot, and the20smaria (albeit marginally, for the latter, when compared to B0); for contents biplane, it outperforms configuration B1, but not B0, while for content amphoriskos, it is outperformed by both configurations. For all contents, B0 seems to be slightly preferred or considered equal to configuration B1, indicating a general trend that favors better geometry accuracy than color fidelity.
Preference and tie probabilities for each pair of configurations under test in experiment 3, for the high bit rate case. The color blue (yellow) of the bar indicates the probability of the configuration on the left (right) side being preferred over the one on the right (left) side. The orange bar indicates the tie probability. (a) amphoriskos. (b) biplane. (c) longdress. (d) loot. (e) the20smaria.
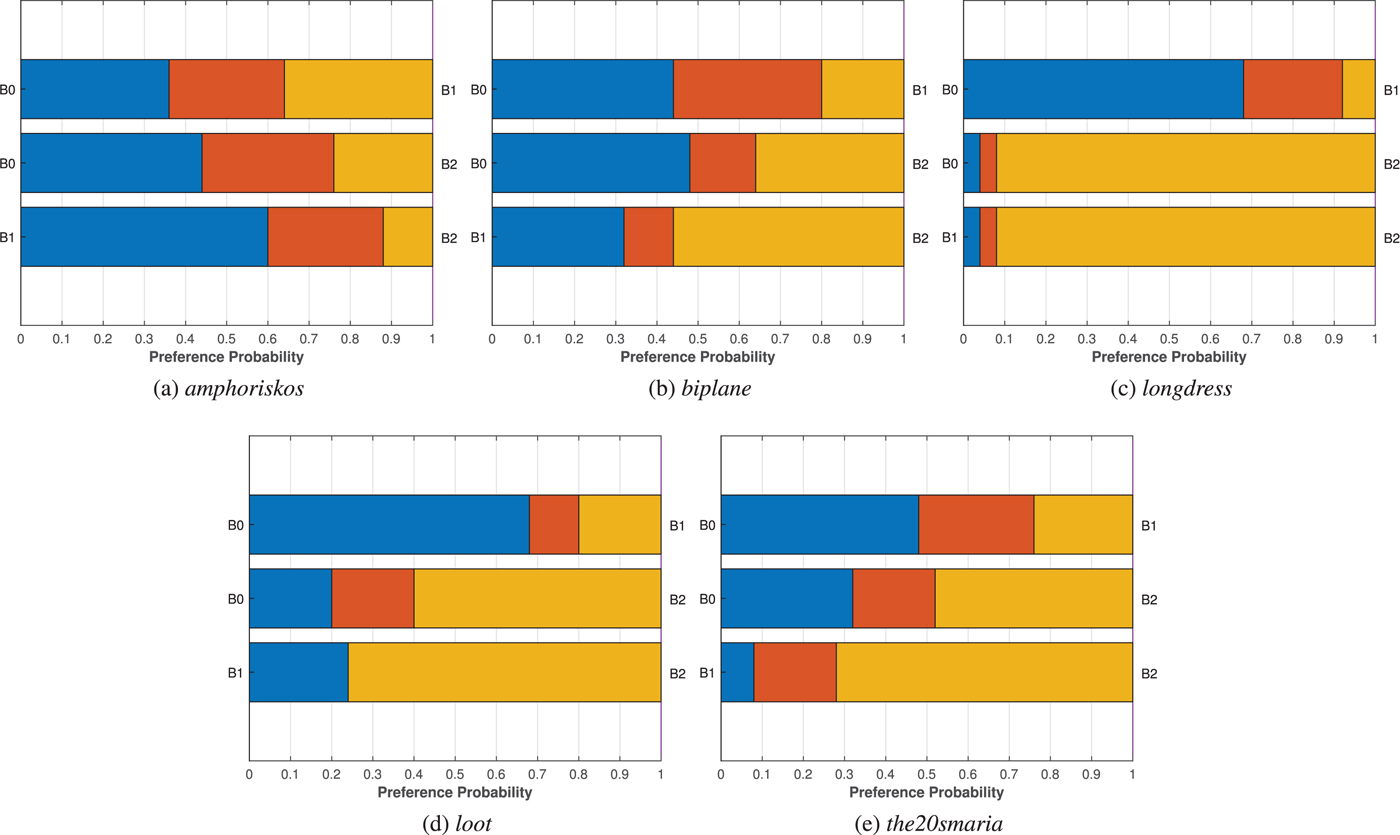
Preference and tie probabilities for each pair of configurations under test in experiment 3, for the low bit rate case. The color blue (yellow) of the bar indicates the probability of the configuration on the left (right) side being preferred over the one on the right (left) side. The orange bar indicates the tie probability. (a) amphoriskos. (b) biplane. (c) longdress. (d) loot. (e) the20smaria.
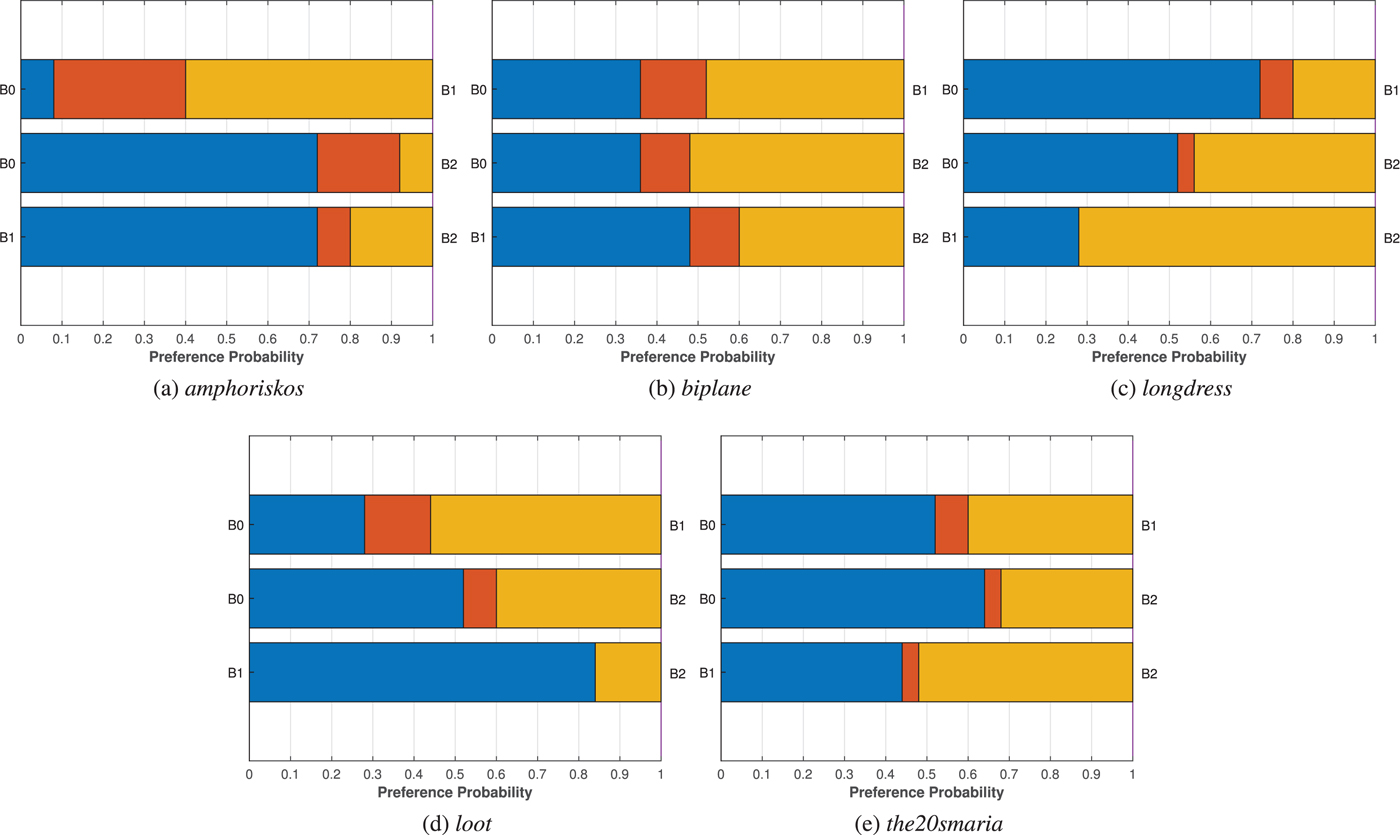
For low bit rates, results are more varied. For contents amphoriskos, biplane, and loot, B1 seems to be the winning configuration, as it is rated to be either better or equal than the other two configurations. This indicates that color fidelity is preferred over geometry resolution. For contents amphoriskos and loot, configuration B0 is the second-best rated, confirming this trend; however, for content biplane, B2 seems to be preferred with respect to B0. On the contrary, in the case of content longdress and the20smaria, B1 seems to be the least preferred solution, as both configurations B0 and B2 have a higher probability of being preferred with respect to B1. For both contents, B0 is considered as yielding a better visual quality with respect to B2, although marginally so for content longdress.
Figure 19 depicts the normalized MOS obtained from the winning frequencies using the BLT model. It can be observed that the relative CIs are quite large due to the differences in performance between different contents. The general trend indicates that for high bit rates, B2 is the best configuration, followed by B0, which points toward a preference for more level of details in geometry with respect to color. However, for low bit rates, B2 is the worst configuration, and B1 seems to be highly preferred. This suggests that for low bit rates, better color fidelity might be more important than geometrical accuracy.
Normalized MOS and relative CIs obtained from the winning frequencies gathered in experiment 3, for each configuration, averaged across the contents, separately for high and low target bit rates.
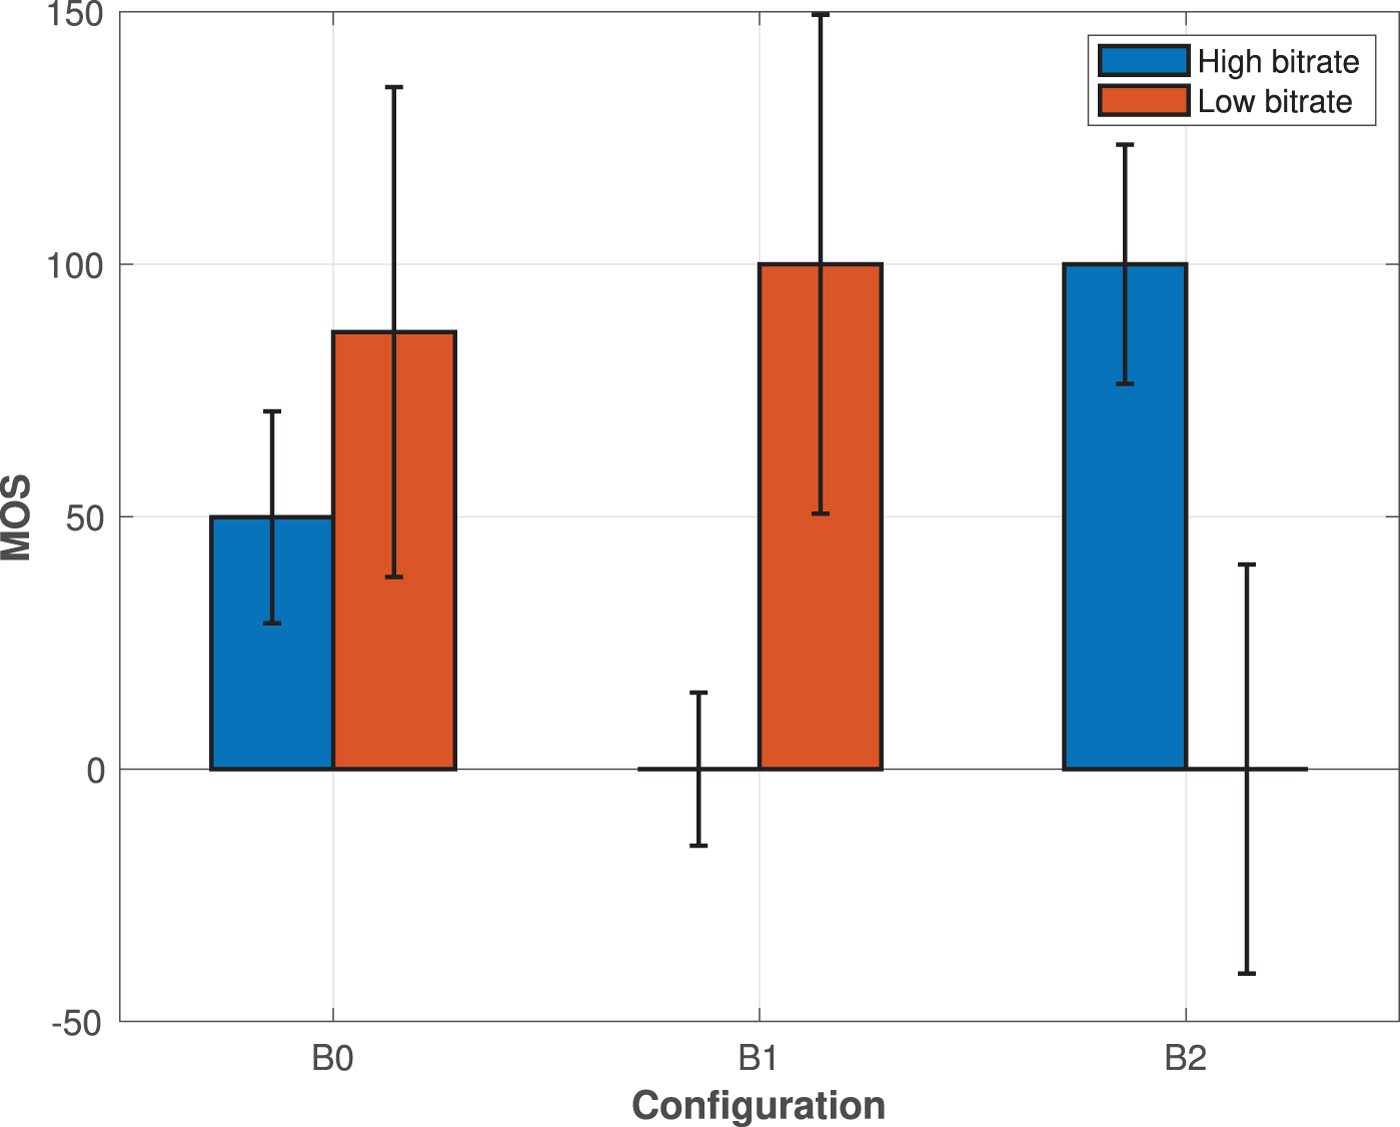
Results of the subjective experiment show that, depending on the targeted bit rate, different configurations of geometry and color could be preferred. In particular, for high bit rates, better geometry precision is preferred, whereas for low bit rates, color fidelity seems to be the most important parameter. Yet, any decision for a rate allocation problem should be done on a content basis, as results vary significantly among them.
VIII. CONCLUSIONS
In this study, a comprehensive quality assessment and analysis of the emerging MPEG point cloud codecs has been carried. For this purpose, an interactive renderer was developed, and configured for visualization of high-quality watertight models. Moreover, a diverse set of point cloud contents was selected and appropriately prepared. Our initial efforts were focused on visual quality evaluation of compressed models using encoding configurations specified by experts in the MPEG committee. In this context, state-of-the-art objective quality metrics were benchmarked, and their efficiency was rigorously analyzed, revealing the need for better solutions. This first experiment provided useful insights regarding the performance of the encoders and the types of degradation they introduce; yet, limitations were identified and described. Among them is the inability to draw solid conclusions about the efficiency of the G-PCC encoder. This could shed some light on the preference among the different visual artifacts introduced by the Octree and the TriSoup modules. Thus, a second experiment was conducted showing that human subjects prefer regular down-sampling over triangulated surface approximations, at both low and high bit rates. We have also addressed the restriction of the initial set of encoding configurations of downgrading both the geometry and color quantization parameters simultaneously, to investigate whether a better rate allocation scheme is possible. The results of the third experiment on this matter showed that, roughly, higher color quality is preferred at low bit rates, while higher geometry precision is favored at high bit rates, even though results may vary among different contents.
We believe that our experimentation efforts can provide useful insights and shape future approaches for efficient point cloud compression algorithms. To allow further analysis and to facilitate the procedure, both subjective and objective quality scores are made publicly available. The source code of the developed renderer is also released to provide an alternative solution for a point cloud viewer and an easily configured quality assessment testbed platform.
ACKNOWLEDGEMENTS
We thank Eric M. Torlig for support in the development of the renderer.
FINANCIAL SUPPORT
This work has been conducted in the framework of the Swiss National Foundation for Scientific Research project ‘Advanced Visual Representation and Coding in Augmented and Virtual Reality’ (E.A., FN 178854), and the framework of project Digital Eye: Deep Learning Video Quality Assessment Technology, funded by The Swiss Commission for Technology and Innovation (I.V., grant 27403.1 PFES-ES). This work was partially funded by CNPq under grant 301647/2018-6 and by Capes Foundation within the Ministry of Education from Brazil under grant 88882.384244/2019-01.
Evangelos Alexiou received his B.Sc degree from the Electronics and Engineering Department of the Technical University of Crete, Greece, in 2011, which was followed by a M.Sc. degree in the Department of Informatics and Telecommunications of the National and Kapodestrian University of Athens, Greece, in 2013. He served as a research assistant in the same university until 2015 under the guidance of Prof. Alexandros Eleftheriadis. Since July 2016 he is pursuing a Ph.D. degree in the Electrical Engineering Department of the Swiss Federal Institute of Technology in Lausanne (EPFL), Switzerland, under the supervision of Prof. Touradj Ebrahimi. His research interests include multimedia compression, transmission and quality assessment, with a current focus on point cloud compression and quality evaluation.
Irene Viola received her B.Sc. degree in Cinema and Media Engineering from the Polytechnic University of Turin, Italy, in 2013, which was followed by an M.Sc. degree in Computer Engineering from the Polytechnic University of Turin, Italy, in 2015. In April 2019, she obtained a Ph.D. degree in Electrical Engineering at the Swiss Federal Institute of Technology in Lausanne (EPFL), Switzerland. She is currently working as a postdoctoral researcher in the Centrum Wiskunde & Informatica (CWI) in Amsterdam, The Netherlands. Her research interest includes image and video compression and quality evaluation, with a focus on immersive media.
Tomás M. Borges studied Electrical Engineering in CPE Lyon, France and at the University of Brasília (UnB), Brazil, where he received his B.Sc. degree in 2014. Worked for 2.5 years as an electrical engineer at Tractebel Engineering where he was in the Electromechanical Projects area, and for another 3 years for the Health Ministry of Brazil to provide health infrastructure to the indigenous peoples in Brazil. In January 2019, he started a Masters degree at UnB in Image and Video Processing focused on point cloud compression and quality evaluation for augmented reality systems.
Tiago A. Fonseca received the Eng., M.Sc., and D.Sc. degrees from the Department of Electrical Engineering at Universidade de Brasília, Brazil, in 2006, 2008, and 2012, respectively. In 2009–2015, he was a technologist at CEPESC (GSI/PR). He is currently a Faculty Member at the Gama Engineering College of the Universidade de Brasília. His main research interests are in image processing, video processing, and scalable video coding.
Ricardo L. de Queiroz received the Ph.D. degree from The University of Texas at Arlington, in 1994. In 1990–1991, he was with the DSP research group at Universidade de Brasilia, as a research associate. He joined Xerox Corp. in 1994, where he was a member of the research staff until 2002. In 2000–2001 he was also an Adjunct Faculty at the Rochester Institute of Technology. He joined the Electrical Engineering Department at Universidade de Brasilia in 2003. In 2010, he became a Full (Titular) Professor at the Computer Science Department at Universidade de Brasilia. During 2015 he has been a Visiting Professor at the University of Washington, in Seattle. Dr. de Queiroz has published extensively in journals and conferences and contributed chapters to books as well. He also holds 46 issued patents. His research interests include image and video compression, point cloud compression, multirate signal processing, and color imaging. Dr. de Queiroz is a Fellow of IEEE and a member of the Brazilian Telecommunications Society.
Touradj Ebrahimi is currently a Professor at EPFL heading its Multimedia Signal Processing Group. He is also the Convener of JPEG Standardization Committee. He was also an Adjunct Professor with the Center of Quantifiable Quality of Service at the Norwegian University of Science and Technology (NTNU) from 2008 to 2012. His research interests include still, moving, and 3D image processing and coding, visual information security (rights protection, watermarking, authentication, data integrity, steganography), new media, and human computer interfaces (smart vision, brain computer interface). He is the author or the co-author of more than 200 research publications, and holds 14 patents.


 Open access