

Introduction
The greenland arctic shelf ice and climate experiment (greenice) was a 3 year european union project completed in may 2006. it sought to measure the changes in the structure and dynamics of sea ice that have occurred in a critical region of the arctic ocean as a result of variations in the arctic oscillation, and to examine whether these could be related to the long-term (>2000 year) record of variability in the same region retrieved from sediment cores. the field effort for the project was focused on the lincoln sea, north of ellesmere island, canada, with a drifting ice camp emplaced at 85˚ n, 65˚w on the southwestern slope of the lomonsov ridge. the camp formed the base for a series of ice-thickness measurements at various scales, as well as seabed gravity coring and seismic profiling operations. local ice-thickness measurements were done using traditional drilling techniques, with sledge-drawn and airborne electromagnetic induction systems providing thickness on 5 and 100 km scales, respectively, reported elsewhere in this volume (Reference Haas, Hendriks and DobleHaas and others, 2006). airborne swath laser profilometer flights extended measurements to a 500 km scale.
For the largest, basin-scale measurements, the project investigated a novel wave-based method which has the potential to measure the modal multi-year ice thickness along the whole wave propagation path, from the open ocean to the measurement site (Reference Nagurny, Korostelev and AbazaNagurny and others, 1994). the technique identifies the dominant frequency of the ubiquitous long-period ‘ice swell’, present throughout the arctic ocean (Reference HunkinsHunkins, 1962), and combines this with a secondary frequency, excited by remote collisions or high winds blowing across the ice. the technique offers the possibility of estimating the ice thickness without reference to hard-to-measure mechanical parameters, such as young’s modulus. the investigation thus required a reliable autonomous method of monitoring waves in the sea ice over at least an annual cycle, and of transmitting the time-series data to the laboratory for analysis.
The measurement of waves in sea ice formed an important component of the large drifting-floe field experiments in the 1970s and 1980s. groups involved in these studies used a wide variety of devices, most commonly wire strainmeters (Reference SquireSquire, 1978; v.a. squire and a.j. allan, unpublished information), adapted from earlier research on earth tides and glaciers. these employed a linear voltage differential transformer as a sensing element and could be made extremely sensitive, down to the level of 10–8 strain (s.c. moore and p. wadhams, unpublished information), though they were rather delicate. the ends of the strainmeter were fixed (usually frozen) into the ice and they were unwieldy and labour-intensive to install. attempts were made to address these shortcomings, incorporating three smaller strainmeters in a single ‘delta’ frame (Reference Duckworth and WestermannDuckworth and westermann, 1989) which required only three anchorage points instead of six. other practioners went ‘low-tech’, freezing wooden posts into the ice and using a stainless-steel rod as the sensing element during the arctic ice dynamics experiment (aidjex). mechanical re-zeroing mechanisms were introduced, either manual (s.c. moore and p. wadhams, unpublished information) or automatic (Reference Haskell and RobinsonHaskell and robinson, 1994).
Later measurements used highly sensitive accelerometers (seismographs, gravimeters) and tide gauges, though these were similarly delicate to transport, maintain and install. tiltmeters offered a less troublesome installation procedure, being simply placed onto a bare ice surface. the arctic internal waves experiment (aiwex) and coordinated eastern arctic experiment (cearex) used biaxial tiltmeters (Reference Czipott and PodneyCzipott and podney, 1989; Reference Menemenlis, Farmer and CzipottMenemenlis and others, 1995) which were sufficiently sensitive to measure the long-period waves of interest, though they had a limited dynamic range. the instruments were also rather sensitive to temperature effects, repeatedly going out of range with temperature fluctuations, sometimes at the expense of large gaps in the measurements (Reference Czipott and PodneyCzipott and podney, 1989). all these instruments were connected to an in situ recording device, variously analogue or digital tape, hard disk or paper roll, and required constant attention during the course of a manned experiment.
The greenice requirements called for a more sophisticated device, able to maintain its sensors in the desired range despite large secular changes, either real – from movement of the floe or box – or induced by the very large temperature variations encountered over an annual cycle. additionally, long data time series would need to be transmitted over a satellite link to the laboratory, since initial investigations suggested that data reduction by on-board calculation of wave spectra would not allow a robust evaluation of the method. the paper describes the development of such a device and its subsequent performance, together with deployment details.
Instrument Description
A pilot experiment north of svalbard in march 2003, staged from the alfred wegener institute’s ship Polarstern, demonstrated that tiltmeters could provide results that were at least as good as the more troublesome strainmeters (Reference DobleDoble, 2004). tiltmeters were therefore chosen as the sensing element, providing sufficient sensitivity while being the most robust and easy to deploy. applied geomechanics supplied orthogonal pairs of tiltmeters (agi 755 series, resolution 0.1 μrad, ±0.98 range), mounted in an aluminium block. the sensor block was then mounted in a very simple but effective self-levelling mechanism, consisting of two perpendicular, microprocessor-controlled stepper motors. these allowed the block to be driven through the full 360˚ in both x and y planes, with re-zeroing taking place once the secular signal approached 80% of the full-scale tilt. the general arrangement is shown in figure 1. the sensor was re-levelled prior to any measurement period and the total re-zeroing effort retained to track the orientation of the box. the block was factory-machined from its standard dimensions to a minimum size, in order to reduce the moving mass and hence required torque of the motors.
A computer-aided design (CAD) rendering of the self-levelling tiltmeter mechanism. Two stepper motors are clamped perpendicularly, with the tiltmeter block mounted to the second motor. The sensors can rotate through the full 360˚.

The low-earth-orbit iridium system provided a high-bandwidth, two-way connection to the devices. the buoys were initially configured to transmit around 70 min of tilt data (9216 samples at 2 hz), taking measurements every 12 hours. the sampling strategy was designed to provide enough samples to localize the spectral peaks with sufficient accuracy. the data were analyzed using a ‘welch’ scheme to give the smallest possible variance per data point (Reference Emery and ThomsonEmery and thomson, 1998). data were first bandpass-filtered to remove direct-current (d.c.) components and secular trends: tilt data have a ‘red noise’ character, i.e. increasing power with longer period. the filtered record was next divided into eight segments of 2048 samples each, overlapped by half their width (1024 samples). each segment was windowed to reduce leakage and preserve its statistical independence before performing a 2048-point fast fourier transform (fft). the eight ffts were then averaged together, to produce a single spectrum with 16 degrees of freedom. the resolution given by the 2048-point fft was 1.1×10⁻³ hz. the relative amplitude between orthogonal channels allows the direction of wave arrival to be determined with a 180˚ ambiguity.
Global positioning system (GPS) positions were determined every hour and packaged with the rest of the data. data were transmitted across a dial-up connection to a server within the laboratory and consisted of 30 kbyte files sent twice daily. in order to prevent the loss of data, the files were retained by the buoys in a rotating stack, allowing data to be re-sent should the initial attempt fail. this arrangement was very robust and resulted in <1% of messages being lost due to transmission problems, though problems with the receiving servers raised this to 4% loss overall. the two-way capability of the iridium system was also used to implement an alternative sampling strategy: discontinuing transmission of the tilt data once the water depth became too shallow to allow the propagation of the long-period (i.e. long-wavelength) waves. GPS positions, surface temperature and diagnostic data continued to be sent, though the interval between messages was increased to 1 week, minimizing ongoing iridium transmission charges.
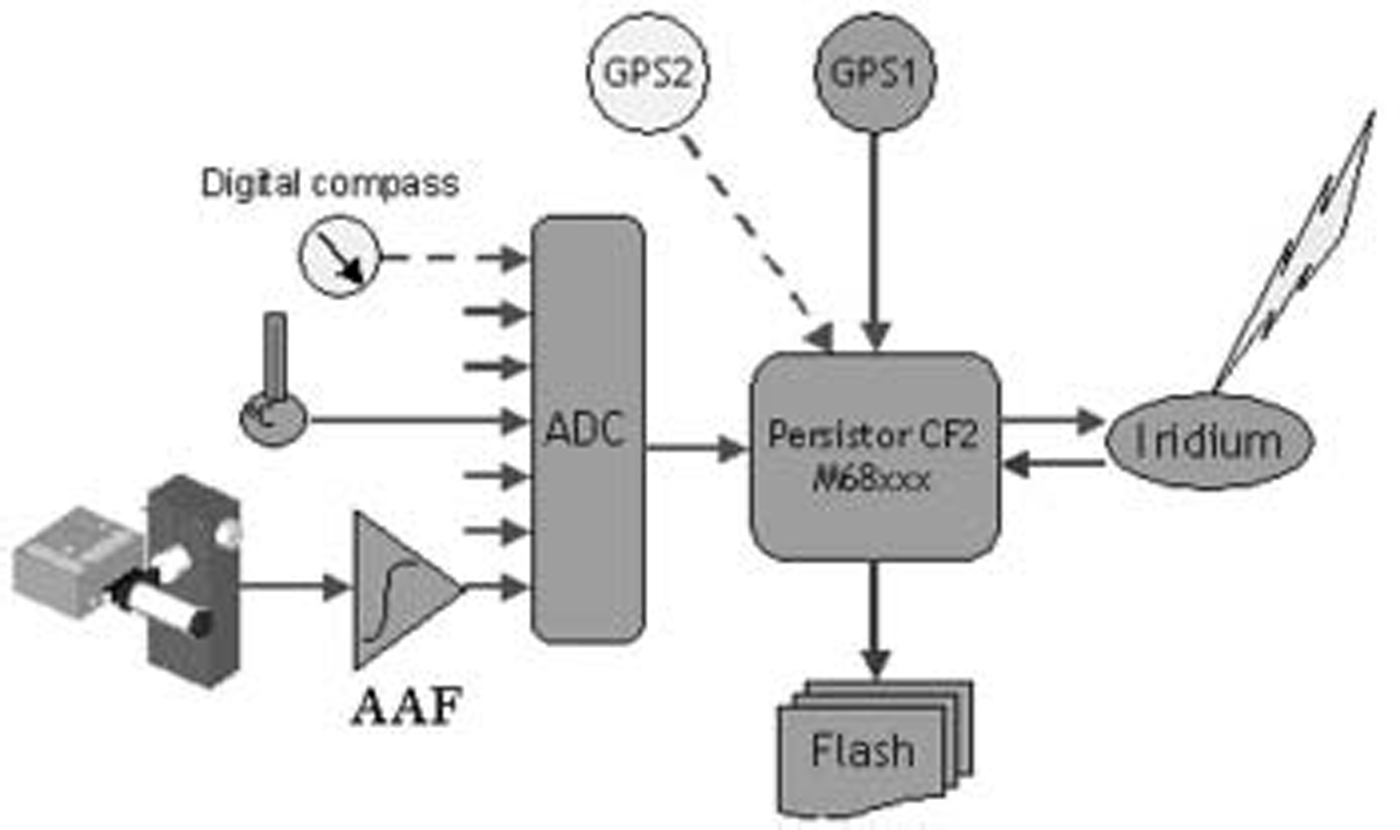
Since the experiment’s location, close to the magnetic pole, represented a challenge to conventional digital compasses, two GPS antennae were used to provide heading information, and hence the arrival direction of the waves. though more sophisticated three-axis compasses were available to overcome this problem, their prohibitive cost motivated the search for an alternative solution. tests at the laboratory suggested that position fixes derived from two antennae mounted 4 m apart would be sufficient to provide heading to an accuracy of 5˚. field tests suggested that the accuracy was of the order of 1˚. multiple fixes were taken over a period of 10 min and the median value of the derived heading transmitted. figure 2 shows a block diagram of the equipment.
Block diagram. The instrument is built around a Persistor CF2 microprocessor, with various inputs, as shown. The tiltmeter signal is passed through an anti-alias filter (AAF) before digitizing. Heading is derived from either a digital compass (if sufficiently far from the magnetic pole) or a second global positioning system (GPS) antenna, as shown. Data are either written to a Compact Flash card, or held in a buffer for transmission via the Iridium modem. The Iridium link is also used to remotely configure the unit when necessary.
The instruments were mounted in an aluminium box, approximately 1 m long, with the batteries surrounded by 5 cm of polyurethane insulation. a pvc sheet was foamed in above these to provide a dimensionally stable platform for the tilt sensors. care was taken to seal the enclosure against driving snow and melt-pond water. the iridium antenna, one GPS antenna and the solar panel were mounted on the lid of the box. the second GPS antenna was connected via a length of ip-68 conduit and mounted on a separate fibreglass pole, drilled into the ice surface 4 m distant. figure 3 shows the arrangement for one buoy deployed alongside the mess tent at the camp.
A tiltmeter buoy deployed onto the multi-year floe at the ice camp. The large square solar panel is clearly visible, as is the second GPS antenna mounted atop a separate pole, furthest from the camera. The Iridium (left) and GPS (right) antennae can be seen on the top of the box nearest the camera. The box is sitting on the hard ice surface beneath the snow.

The buoys were powered by a solar panel mounted on the top of the box, charging a small gel battery, during the light months. snow coverage of the panels did not appear to be significant, with the panels providing uninterrupted power during daylight hours. standard alkaline d-cell batteries powered the system through the dark winter (september– march). the batteries performed well, even at average winter temperatures of around –30˚c, with minima of –40˚c, and recovered quickly once temperatures began to rise in spring. figure 4 shows a typical plot of battery voltage and temperature for one buoy. also shown is the secular y-axis tilt (across the short axis of the box), indicating the onset and cessation of the melt season as the box settled into the ice floe and tilted up to 30˚ from the horizontal. despite this, the system maintained the high-resolution microradian measurements over the entire deployment.
Battery voltage (dotted line) and tilt-head temperature (˚C; solid line) for the northernmost buoy, from deployment in May 2004 until October 2005. The spikes in the battery voltage during daylight months indicate that the solar panel was providing the majority of the power. The end of effective insolation around the end of August 2004 is clearly shown, as is the return of the sun in June 2005. Also plotted (grey line marked X) is the secular tilt across the buoy (y axis), in angular degrees, which correlates rather well, changing as the buoy melted into the floe over summer and remaining constant during the winter.

Deployments
Buoys were assembled and their operation verified at the ice camp prior to being deployed at remote sites, at the limit of helicopter range in the expected up- and down-wave directions from the camp. the deployment locations and subsequent drift of the buoys are shown in figure 5. commercial argos-reporting buoys (metocean svpbs) were deployed alongside the three southernmost buoys as a contribution to the international arctic buoy programme (iabp), and these transmitted surface pressure and location to the weather-forecasting community via the global telecommunication system. deployment details are shown in table 1.
Buoy tracks from their deployment in May 2004 (large circle) until the beginning of October 2005. Positions at the beginning of every month are indicated with small circles. Numbers refer to the buoy IDs. Bathymetry is marked in metres, indicating the Greenland continental shelf and the Lomonosov Ridge, in the northeast. The buoys moved resolutely southwards, though investigation of previous satellite-derived vectors had suggested a predominantly zonal motion for the ice in the area.
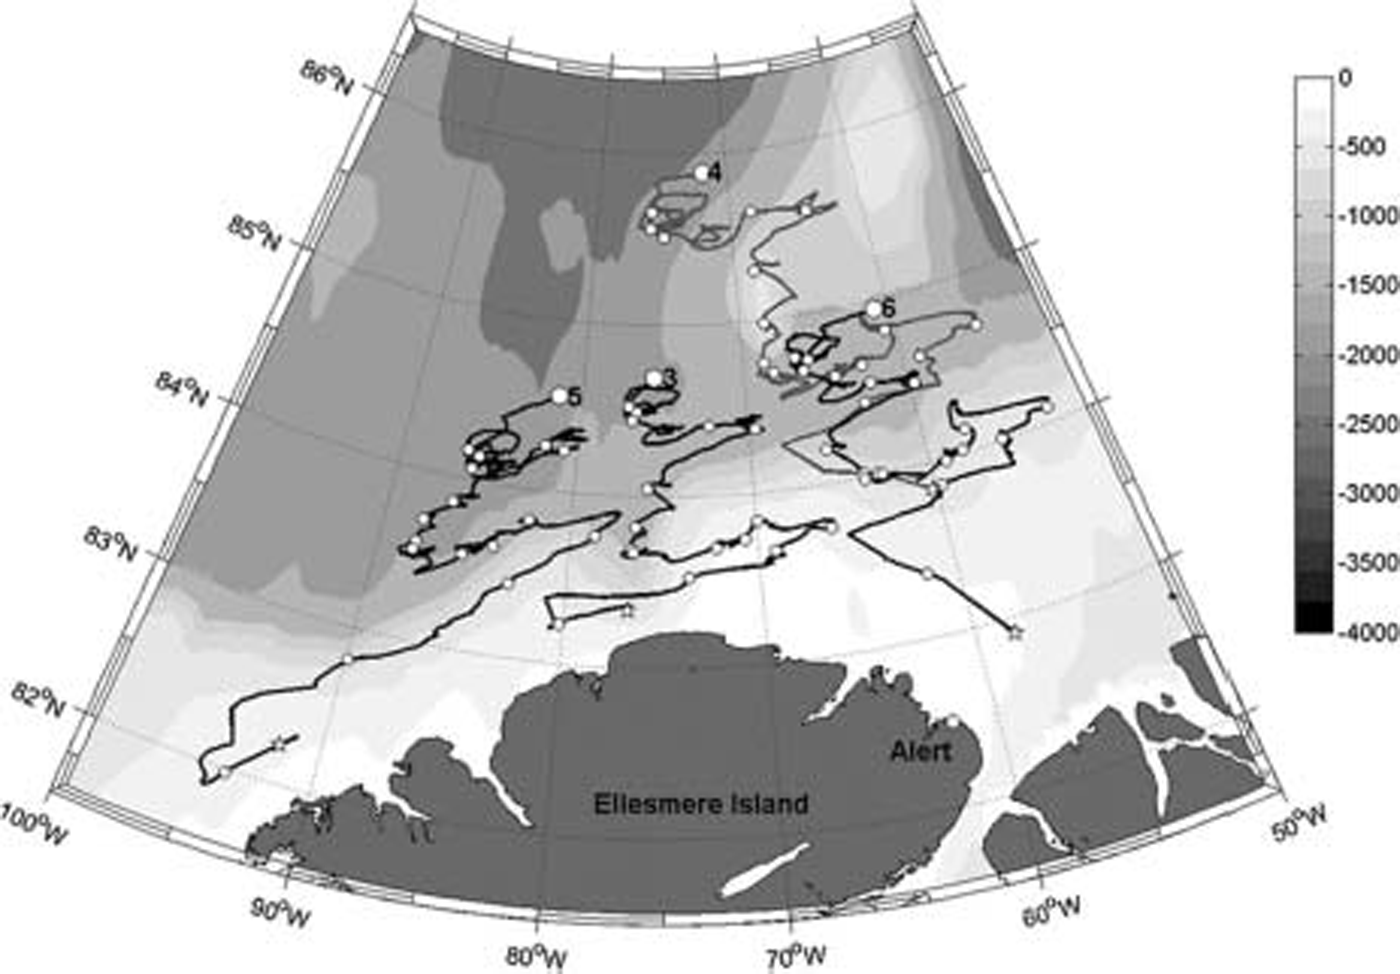
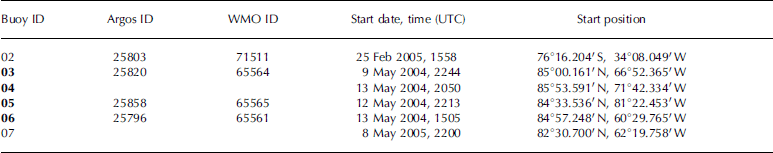
Details of the buoy deployments. Argos and World Meteorological Organization (WMO) IDs refer to MetOcean SVPB drifters placed alongside three of the tiltmeter buoys in support of the IABP. Bold IDs indicate the main Lincoln Sea array. Buoy 07 was deployed the following year to replace the failing buoy 06. Buoy 02 was deployed in the Weddell Sea, Antarctica. UTC: Universal Time Coordinated
The deployment position of buoy 03 marks the location of the camp when it was abandoned on 21 may, after 14 days occupation. the camp advected strongly westwards during occupation, but the buoys drifted predominantly southwards afterwards, with the three southern buoys crossing the continental shelf after 6–10 months. this contrasted to simulated drift calculations based on satellite-derived motion vectors, which had suggested a dominantly zonal character to the ice motion in the area. it had been hoped that the buoys would move west and enter the beaufort gyre, but the two easternmost buoys instead exited through nares strait, between greenland and ellesmere island. buoy 06 began to fail in march 2005 and was supplemented by an additional buoy (07), deployed nearby from a small field effort in may 2005. buoy 06 recovered completely shortly afterwards.
Two buoys were retained at the camp for the duration of the manned experiment, and these were run in continuous logging mode, writing files to a removable compact flash card for exchange and downloading. one buoy was deployed adjacent to the main tent (ice thickness 3.2 m) and monitored continuously over a serial link. the second buoy was moved around the local area, evaluating the wave field on different local ice thicknesses, such as the refrozen lead which formed the aircraft runway (thickness 1.2 m). the duration of the camp occupation was characterized by high-amplitude and very dynamic variations in tilt, as the ice field advected under the very strong winds (up to 40 knots (75 km h–1)). considerable ridging took place around the camp during this time, and the resulting chaotic tilt record made identification of the secondary frequencies rather challenging, though an ice swell period of around 31 s was discernible.
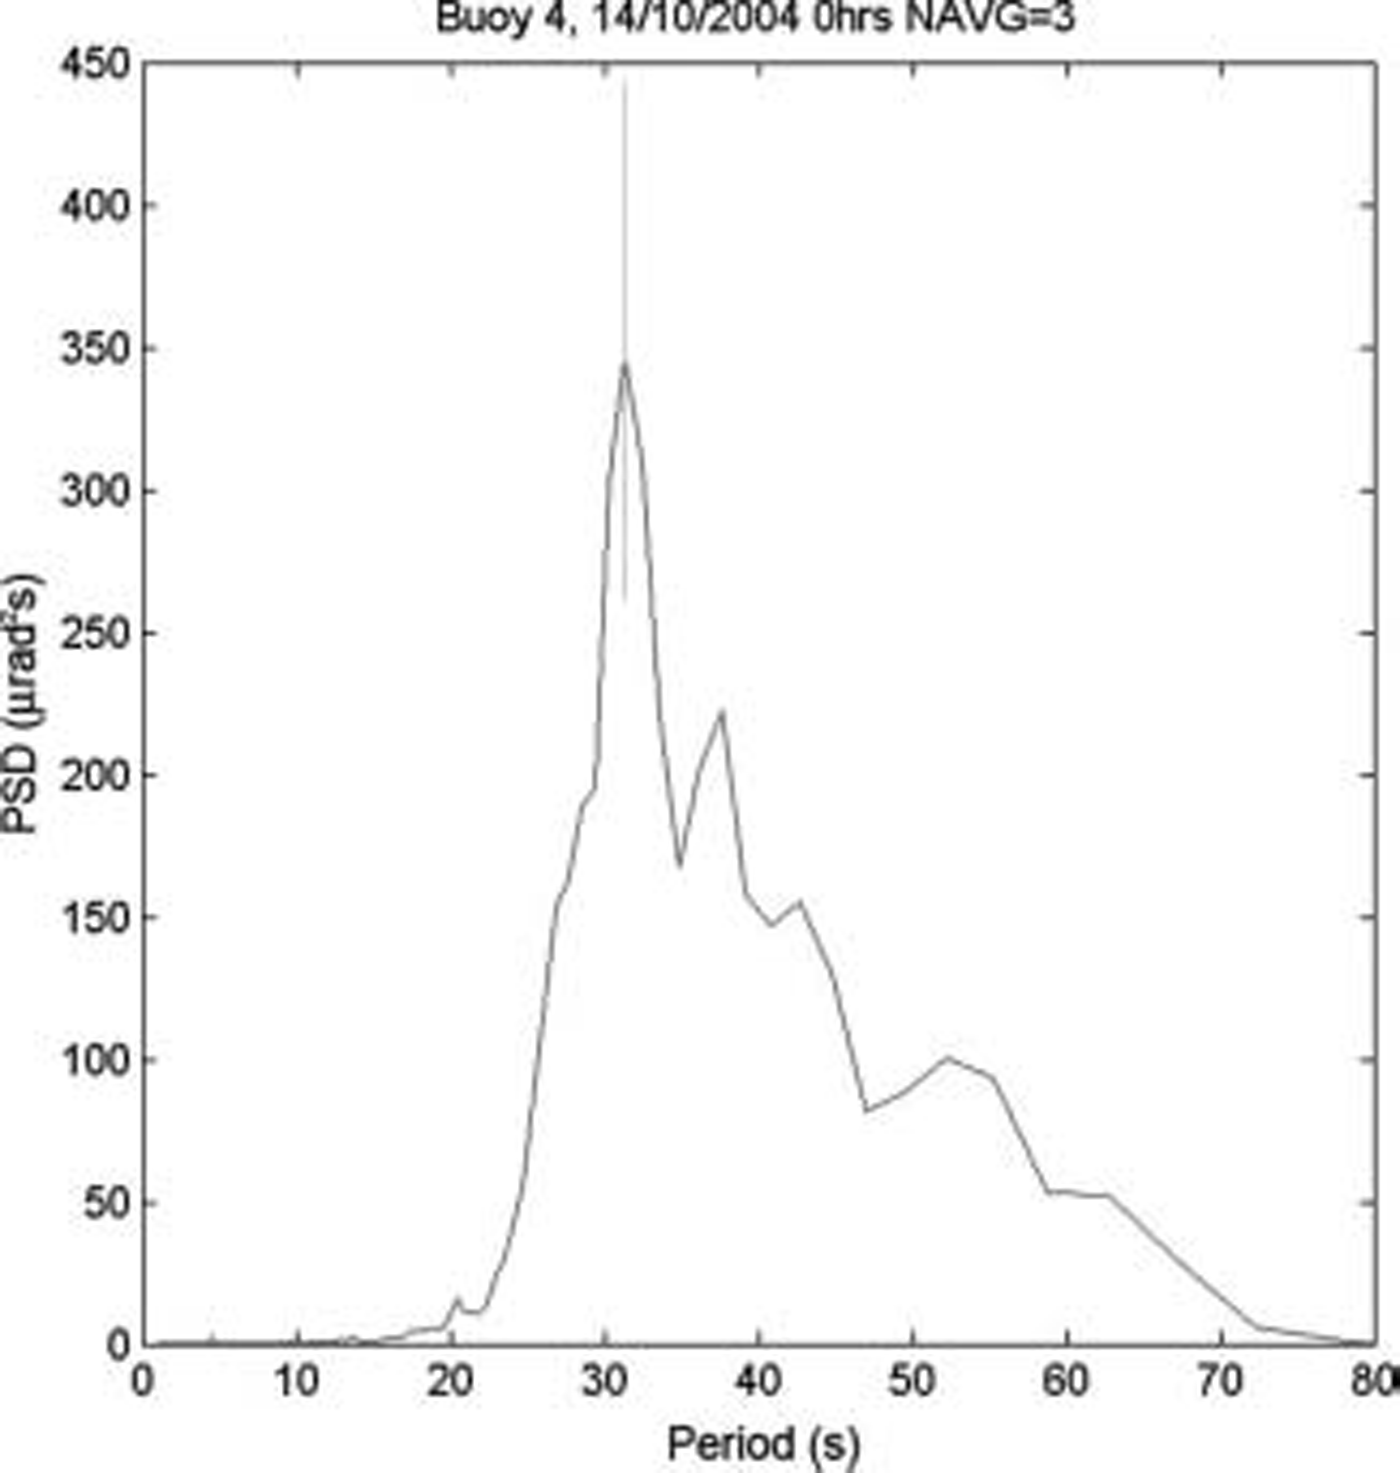
The camp buoy was switched to satellite mode just prior to camp abandonment, and all buoys functioned exceptionally well throughout their drifts. occasional problems were encountered by the buoys in sending messages, perhaps due to drifting snow covering the antenna. the long-period wave field showed considerable variation across an annual cycle, with the distinct ‘ice swell’ visible in the winter spectra, but largely absent during the summer (june–september). this may arise from a lack of storms in the open ocean to generate these long-period waves, or may reflect the inability of a less compact ice field to transmit the flexural-gravity waves necessary for propagation. figure 6 shows an example winter tilt spectrum, with an ice-swell peak again at 31 s. ice-swell arrival directions were almost exclusively from the fram strait region, consistent with the hypothesis that the long-period swell is a remnant open-ocean swell.
An example tilt spectrum, averaged from seven consecutive time series in October 2004. The 95% confidence interval is marked at the peak value. An ice swell of around 31 s period is clearly indicated. Data were filtered with a passband of 4–70 s prior to the FFT in order to remove d.c. components and secular trends from the time series. PSD: power spectral density.
Evaluation of the resonant wave-thickness results is still ongoing and will be presented in future papers. the dataset also allows other investigations of wave/ice interaction, however, such as an alternative method of ice-thickness determination proposed by Reference Menemenlis, Farmer and CzipottMenemenlis and others (1995). this applied the dispersion relation proposed by Reference Squire and AllanSquire and allan (1980) to determine thickness by examining the loss of high-frequency components. the role of more classical energy dissipation methods – creep and viscous losses – will also be evaluated as the buoys traverse the ice cover towards the open ocean. the buoys that passed through nares strait are currently giving good data in baffin bay. a unit was also deployed onto a deformed multi-year floe in the southern weddell sea, antarctica, (76˚ s, 34˚ w) in february 2005, and also characterized the wave field as it travelled north, before reaching the ice edge in late september 2005.
Conclusions
The buoys performed beyond all expectations and demonstrate that long-term wave measurements are feasible from unmanned installations. evaluation, development and validation of the wave-based thickness derivation is ongoing, but, if successfully demonstrated, it is hoped that these instruments will form the basis of an arctic ocean-wide thickness-monitoring network. the buoys have the potential to find wide application, not only in the field of sea-ice research, but also in wider geophysical investigations.
Acknowledgements
The project was funded by the fifth framework european union programme ‘greenland arctic shelf ice and climate experiment’ evk2-ct-2002-00156, coordinated by p. wadhams. the camp would not have been possible without the facilities and assistance provided at canadian forces station alert, particularly by j. milne, of the defence research department canada. we thank r. abbott of veco, her staff and the 109th new york air national guard for dealing so efficiently with our cargo. we also thank a. heiberg of the applied physics laboratory, university of washington, and t. quinn of veco for advice and assistance in planning the field experiment.


