





Introduction
Rice is cultivated in nearly 10,000 ha on organic soils (Histosols) in the Everglades Agricultural Area (EAA) located on the southern edge of Lake Okeechobee in southern Florida (Bhadha et al. Reference Bhadha, Trotta, Cavazos and VanWeelden2024). Although these nutrient-rich soils support high rice production, ineffective weed management allows weed interference to significantly reduce rough rice yield and grain quality., Fall panicum is the most prevalent and problematic weed species of rice in the subtropical climate of southern Florida (Odero and VanWeelden Reference Odero and VanWeelden2018; Van Wychen Reference Van Wychen2023). The species is ubiquitous in EAA farms, where rice is commonly rotated with sugarcane (Saccharum spp. hybrids) and sweet corn (Zea mays var. saccharata). Fall panicum has been reported to be among the most common weeds in rice throughout southern United States (Smith Reference Smith1988). In Florida, fall panicum is also an important host for three species of rice stink bug (Oebalus spp.), which indirectly contributes to yield and quality losses (Cherry and Odero Reference Cherry and Odero2021).
Several biological and ecological traits contribute to the dominance of fall panicum in EAA cropping systems. These include prolific seed production (Govinthasamy and Cavers Reference Govinthasamy and Cavers1995; Vengris and Damon Reference Vengris and Damon1976), variable seed dormancy (Brecke and Duke Reference Brecke and Duke1980; Taylorson Reference Taylorson1980), the ability emerge from deeper burial depths, and gemination across a wide range of temperatures (Fausey and Renner Reference Fausey and Renner1997). In addition, tolerance to common management practices in the EAA dominated by gramineous (grass) crops have enabled fall panicum to maintain a persistent and replenishing seedbank. Fall panicum is a tall, high-tilling species that produces extensive foliage and numerous panicles (Vengris and Damon Reference Vengris and Damon1976), indicating its capacity to exploit available resources. Its height is minimally affected by reduced light intensity (Vengris and Damon Reference Vengris and Damon1976), indicating a competitive advantage under shading conditions typical in weed-crop interference. Because fall panicum emerges concurrently with rice in Florida and can grow up to 2 m tall (Bryson and DeFelice Reference Bryson and DeFelice2009), it is likely to be highly competitive with rice, which typically reaches heights of approximately 1.2 m (Hardke et al. Reference Hardke, Moldenhauer, Sha and Hardke2021). Plant height is a key determinant of light capture efficiency, with taller species exhibiting greater interception of available radiation (Swanton et al. Reference Swanton, Nkoa and Blackshaw2015).
Crop yield loss due to weed interference is strongly influenced by both weed density and the duration of competition (Swanton et al. Reference Swanton, Nkoa and Blackshaw2015). Season-long interference from fall panicum has resulted in significant yield losses in several crops. Interference from 86 fall panicum plants m−2 accounted for a 60% reduction in sucrose yield from sugarcane (Odero et al. Reference Odero, Duchrow and Havranek2016). Yields of corn (Zea mays L.) were reduced by 48% to 74% as a result of season-long interference from natural fall panicum populations (Kern et al. Reference Kern, Meggitt and Penner1975), whereas soybean [Glycine max (L.) Merr.] yield was reduced by 15% when fall panicum density was as low as 7 plants m−1 of row (Ambrose and Coble Reference Ambrose and Coble1975). These research findings demonstrate that fall panicum interference can cause severe yield losses even in tall- stature crops such as sugarcane, which can exceed 4 m in height (Sandhu et al. Reference Sandhu, Singh, Gilbert, Odero and VanWeelden2019). Yield reductions have also been reported in low-statute crops; for example, peanut (Arachis hypogaea L.) yield was reduced 69% when 16 fall panicum plants 4.9 m−1 of row were recorded (York and Coble Reference York and Coble1977).
Rice is particularly susceptible to weed interference. For example, season-long interference from barnyardgrass [Echinochloa crus-galli (L.) P. Beauv.], hemp sesbania [Sesbania exaltata (Raf.) Cory], and northern jointvetch [Aeschynomene virginica (L.) B.S.P.] accounted for rice yield reductions of 79%, 19%, and 17%, respectively, when rice was in shade during the grain filling stage (Smith Reference Smith1968). Red rice (O. sativa L.) infestations of 25 and 51 plants m−2 reduced rice yield by 60% and 70%, respectively, with taller biotypes causing greater yield losses than shorter ones (Estorninos et al. Reference Estorninos, Gealy, Gbur, Talbert and McClelland2005). When bearded sprangletop [Leptochloa fusca (Lam.) Gray] density ranged from 50 to 108 plants m−2 rice yield was reduced by 36% to 50% (Carey et al. Reference Carey, Smith and Talbert1994; Smith Reference Smith1983). Additional yield losses have been attributed to spreading dayflower (Commelina diffusa Burm. f.) and Texasweed [Caperonia palustris (L.) St.-Hil.], further underscoring rice vulnerability to weed competition (Smith Reference Smith1984; Godara et al. Reference Godara, Williams, Webster, Griffin and Geaghan2012).
Despite the documented competitive ability of fall panicum in several cropping systems, information on its interference effects on rice, particularly under Florida’s organic soil production conditions, is limited. Therefore, we conducted experiments to determine the effect of season-long fall panicum density on rough rice yield in drill-seeded rice grown on organic soils in south Florida.
Materials and Methods
Field experiments were conducted in 2021 and 2022 near Belle Glade, Florida, in drill-seeded rice fields with histories of fall panicum infestation. Studies were conducted at the Glades Farm (26.7239°N, 80.5302°W) in 2021 and at the Gilmore Farm (26.5750°N, 80.4545°W) in 2021 and 2022. Fields were in a sugarcane-rice rotation. Soils at both sites were Dania muck (Euic, hyperthermic, shallow Lithic Haplosaprists) with 75% organic matter, pH 6.6, at Glades Farm and 79% organic matter, pH 6.8, at Gilmore Farm. Fields were plowed, disked, and leveled prior to planting. The rice cultivar Diamond was drill-seeded at a seeding rate of 95 kg ha−1 with 15-cm row spacing on February 22, 2021 (Glades Farm) and March 9, 2021 (Gilmore Farm). In 2022, Diamond rice was drill-seeded at Gilmore Farm on March 11 using the same seeding rate and row spacing. Fields were rolled after planting to improve seed to soil contact. Fertilizer was applied at planting based on soil test recommendations. Rice emergence occurred approximately 2 wk after planting. Prior to permanent flooding, broadleaf weeds and sedges were controlled with carfentrazone-ethyl (Aim EC herbicide; FMC Corporation, Philadelphia, PA) at 28 g ha−1 and halosulfuron-methyl (Sandrea; Gowan, Yuma, AZ) at 53 g ha−1. Herbicides were applied using a CO2-pressurized backpack sprayer delivering 187 L ha−1 at 276 kPa using TeeJet XR8002VS nozzle tips (Spraying Systems Co., Glendale Heights, IL). Grass weeds other than fall panicum were removed by hand throughout the season. Permanent flooding of approximately 10 cm depth was established at the 4-leaf stage of rice (fall panicum was at the 4- to 6-leaf stage) and maintained until 3 wk before harvest.
An additive density-yield loss interference design was used in which rice density was maintained across all plots at commercial levels, while fall panicum density was not imposed but occurred naturally within the study area (Cousens Reference Cousens1981). The study was designed to quantify season-long density-yield loss relationships rather than to evaluate different durations of competition. Because fall panicum density represented a naturally occurring gradient rather than a fixed treatment structure, inference was based on observed density levels. Plots served as experimental units and were arranged in four spatial blocks within each site-year to account for field heterogeneity. Blocking was used solely to reduce background variability because no density treatments were assigned.
Within each site-year, 28 plots (3 m wide by 6 m long) were established after rice emergence and arranged in four spatial blocks. Each block included one plot maintained as a fall panicum–free control. Fall panicum density in each plot was measured by counting plants in two permanently marked 1-m2 quadrats at flooding. In control plots, fall panicum seedlings were removed by hand immediately after emergence and throughout the season to maintain weed-free conditions. In all plots, nontarget weeds were removed by hand throughout the season to have fall panicum as the primary source of interference. Fall panicum that were present in all site-years reflected the naturalized regional population typical of the EAA. Accordingly, variation in infestation intensity across site-years was modeled as a continuous density covariate rather than treated as discrete treatment effects.
Rough rice yield and a thousand-grain weight were recorded at maturity. Grain moisture was measured prior to harvest using a moisture tester (SW08120; John Deere, Moline, IL). Rice was hand-harvested from the two 1-m2 marked quadrats in each plot on July 13, 2021 (Glades Farm), July 20, 2021 (Gilmore Farm), and July 1, 2022 (Gilmore Farm). Harvested panicles were threshed using a portable small-bundle thresher (Small Bundle Thresher, Seedburo Equipment Company, Chicago, IL), and rough rice yield was recorded and corrected to 13% moisture. Thousand-grain weight was determined by randomly subsampling threshed grain from each plot, counting grains with an automatic seed counter, and weighing the sample. Although additional yield components such as tiller number, panicle length, plant height, and grain quality were not measured, final rough rice yield is the standard integrative endpoint for density-yield loss modeling and reflects the cumulative effects of competition on component processes relevant to production decisions (Cousens Reference Cousens1985). Thousand-grain weight was included as a complementary yield component.
All analyses were conducted using R software (v. 4.5.2; R Core Team 2025). Because natural fall panicum densities varied among site-years and the objective was to characterize an overall density-yield loss relationship under representative production conditions, data were pooled across site-years to estimate a single biologically interpretable relationship between density (plants per square meter, m−2) and yield loss (%). Pooling increased the range of observed densities, thereby improving the stability of nonlinear parameter estimation. The suitability of pooling was evaluated by examining residuals and visually assessing stratified plots by site-year and by block nested within site-year; no systematic heterogeneity in the model was detected. Consequently, results are presented as pooled analyses. The relationship between fall panicum density (plants m−2) and rice yield loss (%) relative to the weed-free control was modeled using the rectangular hyperbola model (Cousens Reference Cousens1985): ${Y_L} = Id/\left[ {1 + \left( {Id/A} \right)} \right]$
where Y L is the percent rough rice yield loss relative to the weed-free yield, d is the fall panicum density (plants m−2), I is the initial slope (percent yield loss per unit density as d approaches zero), and A is the asymptote (percent yield loss as d approaches infinity). Model parameters were estimated using nonlinear least squares with the nlsLM function of the minpack.lm package (Elzhov et al. Reference Elzhov, Mullen, Spiess and Bolker2023). Model adequacy was evaluated using residual diagnostic plots. Goodness of fit was quantified using the root mean square error (RMSE): ${\rm{RMSE}} = \sqrt {{1 \over n}} \sum\limits_{i = 1}^n {{{\left( {Yi - \hat Yi} \right)}^2}} $
where Y i and Ⓨ i are observed and predicted yield loss values, respectively. Because yield loss estimates expressed relative to the weed-free control are sensitive to error in control yield, the rectangular hyperbola model was also fitted using absolute yield to estimate weed-free yield (Cousens Reference Cousens1985): $Y = {Y_{wf}}\left\{ {1 - Id/100\left[ {1 + \left( {Id/A} \right)} \right]} \right\}$
where Y is the rough rice yield (in kilograms per hectare, kg ha−1); Y wf is the estimated weed-free yield; and d, I, and A are the same as previously defined in the rectangular hyperbola model. To address potential overestimation of the asymptote (A > 100%), constrained models with A fixed at 100% were compared with unconstrained models. Model comparisons were conducted using an extra sum-of-squares F-test based on residual sum of squares and residual degrees of freedom, with significance evaluated at α = 0.05.
The association between thousand-grain weight and fall panicum density was evaluated using the Pearson product-moment correlation using the cor.test function of R software. Thousand-grain weight response to fall panicum was modeled using a linear regression with the lm function of R: $Y = A + Bd$
where Y is the thousand-grain rough rice weight (in grams, g), d is the fall panicum density (plants m−2), A is the estimated thousand-grain weight at d = 0, and B is the slope. Predicted values from the fitted nonlinear and linear models were plotted across the observed density range, with observed data overlaid using the ggplot2 package (Wickham Reference Wickham2016). For the linear regression model, 95% confidence intervals were displayed.
Results and Discussion
Rice emergence occurred approximately 14 d after seeding in all site-years. Fall panicum emerged primarily at the same time as rice, with only a few plants emerging slightly earlier or later. Naturally occurring fall panicum densities varied both within and among site-years, ranging from 1 to 49 plants m−2 across plots, thereby providing a continuous gradient for evaluating season-long interference effects. These natural infestations provided the empirical basis for quantifying rice yield response to fall panicum under representative production conditions, consistent with the additive interference design rather than imposed density treatments. Rough rice yield in the absence of fall panicum interference was estimated to be 6,818 kg ha−1.
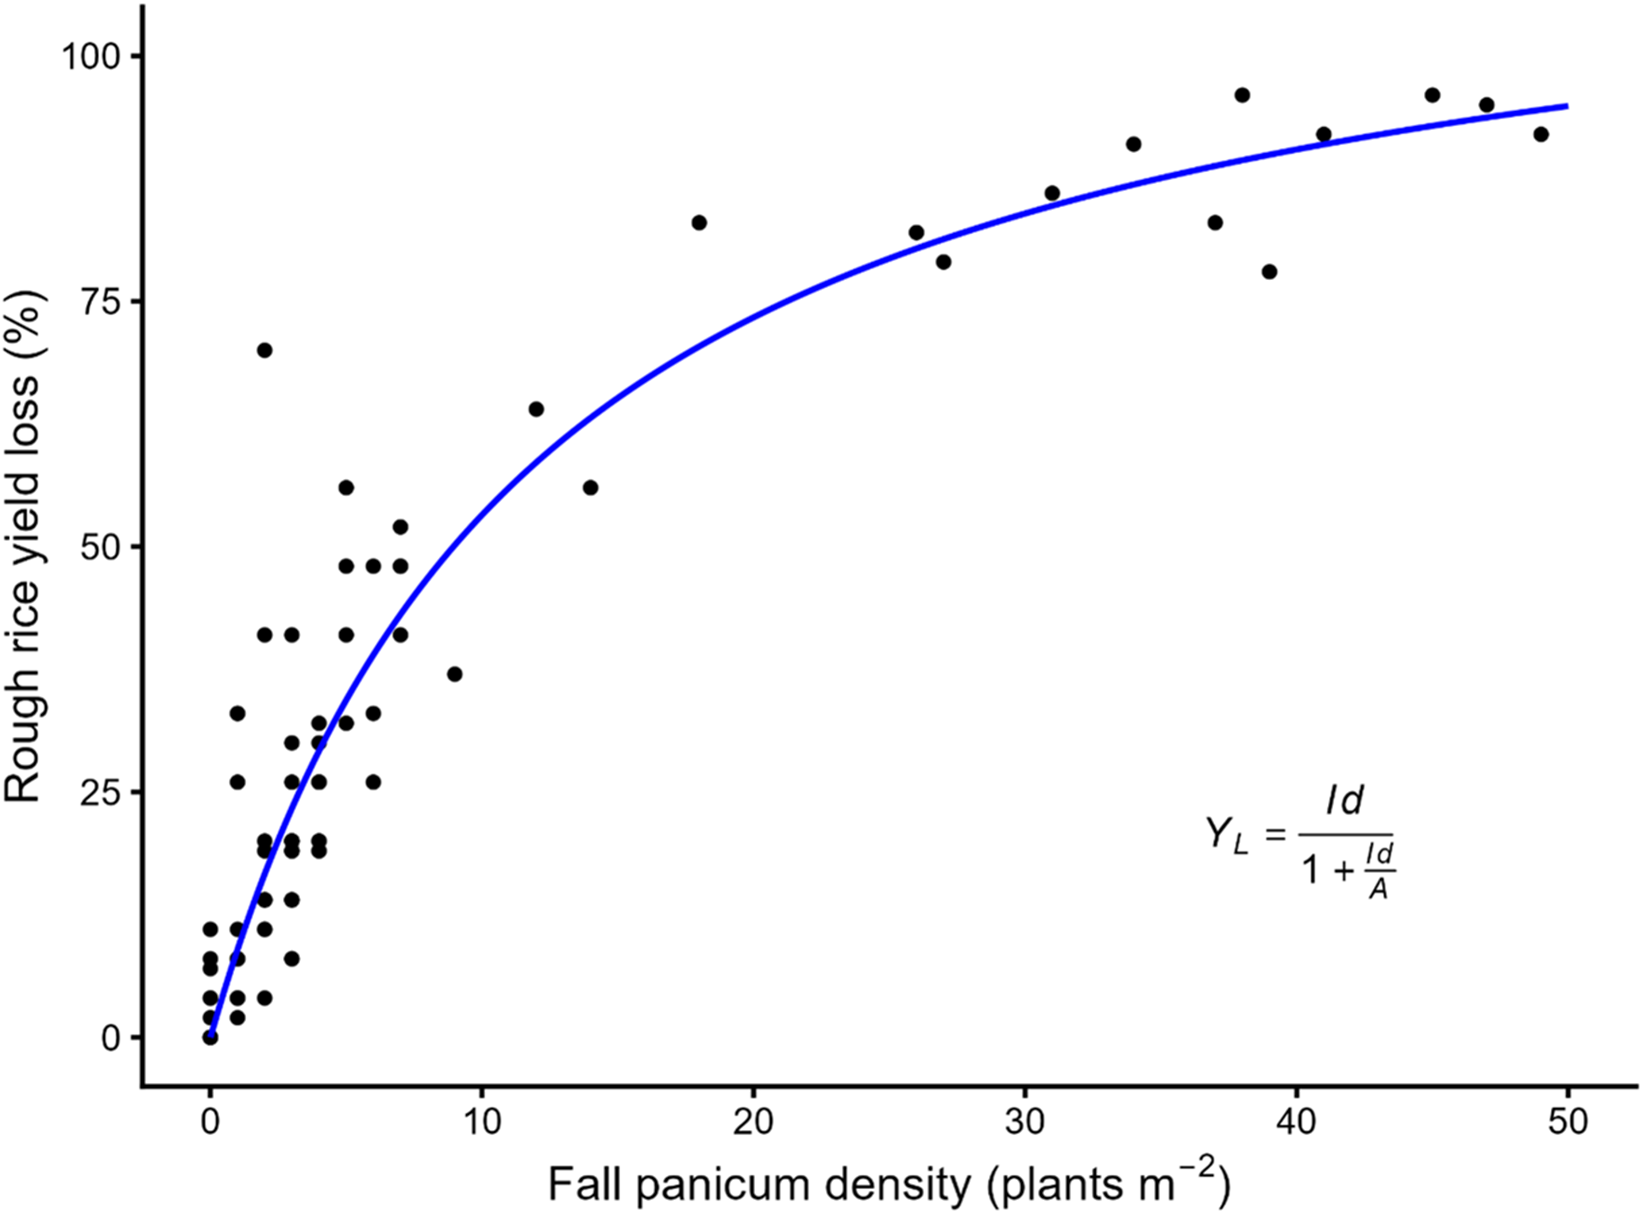
Season-long interference of fall panicum negatively affected rough rice yield. The rectangular hyperbola model adequately described the relationship between fall panicum density and percent yield loss relative to the weed-free control (Figure 1). Residual diagnostics indicated no systematic deviations from model assumptions, with model fit supported by a RMSE of 10.33. The initial slope parameter (I) was estimated to be 9.7%, indicating that even very low fall panicum densities produced measurable reductions in rice yield. This result demonstrates the high competitive ability of fall panicum during early rice development and shows that yield losses can occur at densities that typically occur in commercial production fields. Similar responses at low weed densities have been reported for other aggressive weed species in rice and reflect strong interspecific competition during early growth stages (Estorninos et al. Reference Estorninos, Gealy, Gbur, Talbert and McClelland2005; Godara et al. Reference Godara, Williams, Webster, Griffin and Geaghan2012; Smith Reference Smith1968).
Rough rice yield loss (%) as a function of fall panicum density across pooled site-years. The relationship is described by the rectangular hyperbola model (Cousens Reference Cousens1985), where Y L is the percent yield loss relative to the weed-free yield, d is the fall panicum density (plants m−2), I is the initial slope (percent yield loss per unit density as d approaches zero), and A is the asymptote (percent yield loss as d approaches infinity). Parameter estimates (± SE): I = 9.70 (0.79) and A = 117.96 (6.91); RMSE = 10.33.

Figure 1. Long description
A scatter plot showing rough rice yield loss percentage as a function of fall panicum density with a blue regression line. The x-axis represents fall panicum density in plants per square meter, ranging from 0 to 50. The y-axis represents rough rice yield loss percentage, ranging from 0 to 100. The plot includes several data points, each represented by a black dot. The blue line represents the rectangular hyperbola model fit to the data. The relationship is described by the model where YL is the percent yield loss relative to the weed-free yield, d is the fall panicum density, I is the initial slope, and A is the asymptote. Parameter estimates include I equals 9.70 and A equals 117.96. The plot shows an increasing trend in yield loss as fall panicum density increases. All values are approximated.
The asymptote parameter (A) was estimated to be 118%. Although yield loss cannot exceed 100%, overestimation of A is a well-recognized characteristic of the rectangular hyperbola when the observed weed densities do not extend into the upper asymptotic region of the response curve (Cousens Reference Cousens1985). In this study, fall panicum densities reached a maximum of 49 plants m−2; therefore, the elevated A value should be interpreted as indicating that yield loss approaches 100% at very high fall panicum densities rather than as a precise quantitative estimate. Similar behavior of the asymptote parameter has been reported in other crop-weed interference studies with restricted density ranges (Baziramakenga and Leroux Reference Baziramakenga and Leroux1998; Odero et al. Reference Odero, Mesbah, Miller and Kniss2010). This anomaly can be overcome by constraining parameter A to 100% (Odero et al. Reference Odero, Mesbah, Miller and Kniss2010). However, in the present study, constraining A to 100% resulted in confounding parameter I, as indicated by a significant F test (P = 0.0051) comparing constrained and unconstrained models. Previous studies have shown that constraining A may influence estimation of I and produce a poorer overall model fit than an unconstrained model (O’Donovan Reference O’Donovan1991; Streibig et al. Reference Streibig, Combellack, Prichard and Richardson1989). Consequently, unconstrained models are recommended when weed density ranges are limited (Baziramakenga and Leroux Reference Baziramakenga and Leroux1998), and results from the unconstrained model are presented in this study. Within the observed density range of 1 to 49 plants m−2, rough rice yield loss was estimated to increase from approximately 9% to 95%, respectively, with 50% yield loss occurring at an estimated density of 9 plants m−2.
The ratio of I/A provides an index of intraspecific competition among fall panicum plants (Cousens Reference Cousens1985). In this study, the relatively small I/A ratio resulting from a large asymptotic yield loss (A) compared with the initial slope (I) indicates weak intraspecific competition within fall panicum populations. This suggests that additional fall panicum plants continued to contribute to rice yield loss across a wide density range. In contrast, Kwon et al. (Reference Kwon, Smith and Talbert1991) reported that a yield reduction in rice at low red rice densities was greater than at higher densities because of stronger intraspecific competition among red rice plants.
The strong competitiveness of fall panicum with rice was likely associated with its rapid growth, tall stature, and ability to accumulate substantial biomass. In this production system, yield loss was likely driven primarily by light interception, although nutrient competition may also have contributed. Although light interception was not directly measured, fall panicum produced culms that extended above the rice canopy, conferring a competitive advantage for light capture over rice. Similar competitive dynamics have been reported for redstem (Ammannia spp.), which elongates and penetrates the rice canopy prior to the stage of maximum tillering, resulting in shading, and increased plant and tiller mortality (Caton et al. Reference Caton, Foin and Hill1997).
Several studies have reported rice yield loss from season-long weed interference. Season-long effects of non-gramineous weeds including hemp sesbania, northern jointvetch, redstem, spreading dayflower, and Texasweed at densities ranging from 5 to 100 plants m−2 have been reported to reduce rice yield by 17% to 70% (Caton et al. Reference Caton, Foin and Hill1997; Estorninos et al. Reference Estorninos, Gealy, Gbur, Talbert and McClelland2005; Godara et al. Reference Godara, Williams, Webster, Griffin and Geaghan2012; Smith Reference Smith1968, Reference Smith1984). In contrast, in this study, fall panicum caused severe yield losses, with reductions up to 95% estimated at a density of 49 fall panicum plants m−2. The estimate of maximum rice yield loss at very heavy fall panicum densities (parameter A > 100%) was higher than that reported for Texasweed (parameter A = 81%) (Godara et al. Reference Godara, Williams, Webster, Griffin and Geaghan2012), indicating that heavy fall panicum infestations have the potential to result in near total crop failure. Similarly, season-long interference from problematic gramineous weeds of rice, including bearded sprangletop, red rice, and barnyardgrass at densities of 51 to 538 plants m−2 reduced yield by 36% to 79% (Estorninos et al. Reference Estorninos, Gealy, Gbur, Talbert and McClelland2005; Smith Reference Smith1968, Reference Smith1983). Compared with these species, fall panicum exhibited substantially greater competitive ability, causing up to an estimated 95% yield loss at only 49 fall panicum plants m−2.
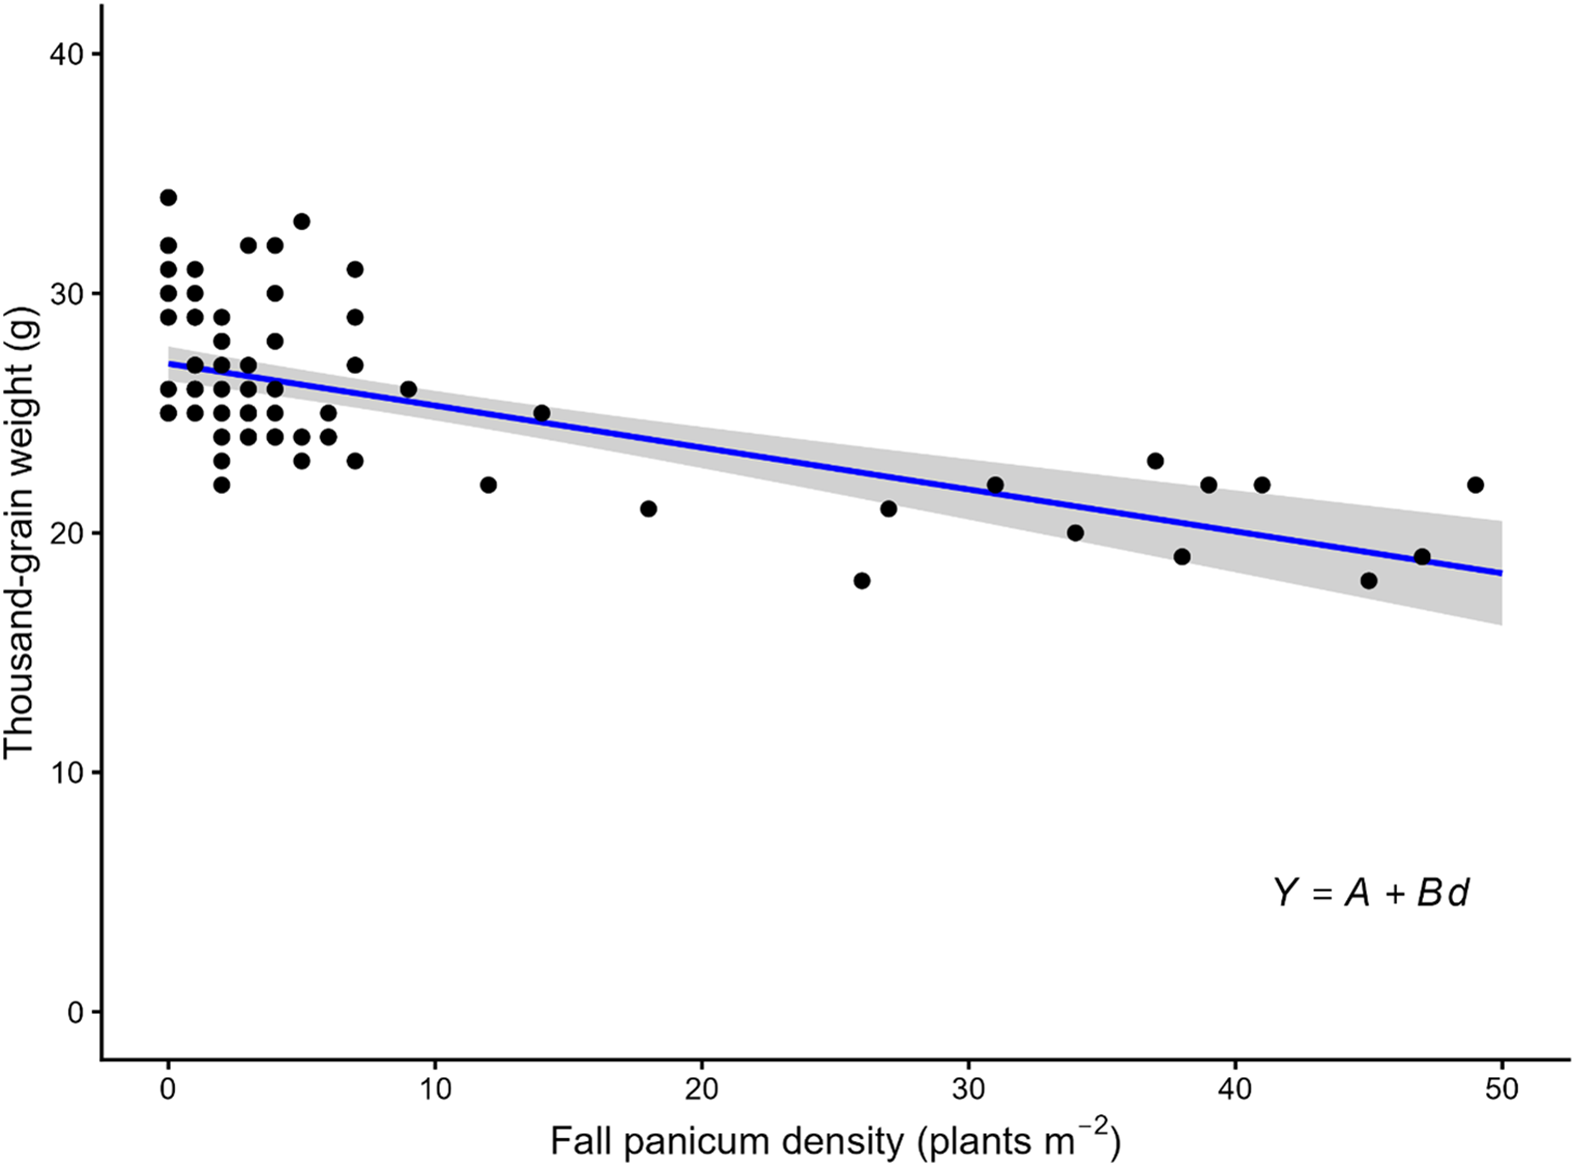
Thousand-grain rough rice weight was negatively correlated (r = −0.61, P < 0.0001) with fall panicum density. The linear model explained 38% of the variation in thousand-grain weight (R 2 = 0.38), indicating that fall panicum density reduced grain weight (Figure 2). Based on the regression slope (parameter B), one fall panicum plant per square meter reduced thousand-grain weight by 0.18 g. In contrast, season-long Texasweed interference did not affect thousand-grain weight (Godara et al. Reference Godara, Williams, Webster, Griffin and Geaghan2012). Because thousand-grain weight is an important determinant of rice grain yield and quality, these results indicate that heavy infestations of fall panicum are likely to negatively affect both rice yield and grain quality. Although individual yield components such as tiller number and panicle length were not measured, the reduction in thousand-grain weight indicates that fall panicum interference affected grain filling, which directly influences both final yield and marketable quality.
Thousand-grain weight of rough rice as a function of fall panicum density across site-years described by a linear regression model. In the model, Y is the thousand-grain rough rice weight (g), d is the fall panicum density (plants m−2), A is the estimated thousand-grain weight at d = 0, and B is the slope. Parameter estimates (± SE) were A = 27.06 (0.36) and B = −0.18 (0.02). R 2 was 0.38. The solid line represents the fitted linear regression, and the shaded region indicates the 95% confidence interval for the mean predicted response.

Figure 2. Long description
A scatter plot illustrates the relationship between fall panicum density and thousand-grain weight of rough rice. The x-axis represents fall panicum density in plants per square meter, ranging from 0 to 50. The y-axis represents thousand-grain weight in grams, ranging from 0 to 40. The plot contains several data points, each representing a specific measurement. A blue regression line with a shaded 95% confidence interval indicates a negative correlation between fall panicum density and thousand-grain weight. As fall panicum density increases, the thousand-grain weight of rough rice decreases. The regression line suggests a linear relationship, with the equation Y = A + Bd, where Y is the thousand-grain weight, d is the fall panicum density, A is the estimated thousand-grain weight at zero density, and B is the slope. The parameter estimates are A = 27.06 and B = -0.18, with an R-squared value of 0.38. All values are approximated.
Results from this study demonstrate that fall panicum is a competitive weed in Florida rice production systems on organic soils when not managed appropriately. Even low fall panicum densities resulted in measurable yield loss, while moderate to high infestations caused severe yield loss. Because fall panicum also serves as a bridge host for rice stink bugs in Florida (Cherry and Odero Reference Cherry and Odero2021), unmanaged infestations can exacerbate both weed and insect pest pressure. Although this study focused on season-long interference, the strong yield loss observed at low fall panicum densities underscores the importance of early-season management. Future research should evaluate interference duration, critical timing of fall panicum removal, and specific yield component responses to better clarify the mechanisms underlying fall panicum interference with rice. Integrating early season weed management with flooding and postemergence control strategies will be important to minimize yield loss and reduce fall panicum seedbank replenishment in subsequent cropping cycles.
Practical Implications
This study quantified season-long density-yield loss relationship between fall panicum and drill-seeded rice grown on organic soils in southern Florida. Even low fall panicum densities caused measurable yield reductions, and rice losses increased rapidly as fall panicum density increased. The steep initial slope of the yield-loss function indicates that even small infestations can become economically significant if not controlled in a timely and effective manner. Yield loss reached severe levels at the higher fall panicum densities observed in commercial EAA fields, and thousand-grain weight declined linearly with increasing density, indicating reduced grain filling under season-long interference. These results emphasize the need to prevent early season establishment of fall panicum through timely integrated management strategies to minimize rice yield loss and sustain productivity on organic soils.
Acknowledgements
We thank members of the Sugar Cane Growers Cooperative of Florida for their assistance with the project.
Funding
This project was funded by the Florida Rice Growers Inc. and supported by the U.S. Department of Agriculture–National Institute of Food and Agriculture, Hatch project FLA-ERC-005755.
Competing Interests
The authors declare they have no competing interests.

 Open access

