


1. INTRODUCTION
In this article we explore the existence of a relationship between the presence of agglomeration economies and regional economic growth in Spain during the period 1870-1930. Studying the existence of complementarity between the spatial concentration of economic activity and growth allows us to revisit one of the long-standing debates in economics, that of the existence of a trade-off between equity and efficiency or, to put it in dynamic spatial terms, between territorial cohesion and growth. This has important implications for debates on economic policy today. Also, from the standpoint of economic history, it adds to our knowledge of the determining factors behind the increase in regional economic inequality in Spain during the early stages of the country’s development process.
A long tradition in the literature on economic development (Myrdal Reference Myrdal1957; Hirschman Reference Hirschman1958) has tended to highlight that, from a spatial perspective, economic growth has been characterised by the appearance of agglomerations in production (the formation of clusters, high-density areas and development hubs) or population (the emergence of large urban areas). Studies in economic history have also shown that the earliest stages of economic development processes have a marked local or regional component (Pollard Reference Pollard1981) and that there is a connection between the start of economic growth processes and the emergence of large-scale inequalities in the distribution of economic activity or population across the territory (Williamson Reference Williamson1965). Contributions on the subject from both fields have pointed to the possible existence of a causal relationship between the two elements. However, economic historians and development economists have based their arguments on the accumulation of new evidence without making it clear what theoretical framework they have used to give structure to their assessments.
In this respect, new developments originating from growth theory and economic geography since the 1990s have supplied an economic foundation for the existence of a positive relationship between the agglomeration of production and growth. Broadly speaking, they have provided arguments in support of the idea that the spatial proximity of producers and/or consumers favours growth insofar as it tends to strengthen it by allowing agglomeration economies to be used in the generation of knowledge through investment in R&D, in the training of human capital or in other economic activities such as industry and services (Martin and Ottaviano Reference Martin and Ottaviano1999; Fujita and Thisse Reference Fujita and Thisse2002; Baldwin and Martin Reference Baldwin and Martin2004). With the economic basis established, some papers have supplied the evidence needed to verify the hypothesis. Prominent in this line of research is the work done by Ciccone and Hall (Reference Ciccone and Hall1996) and Ciccone (Reference Ciccone2002) from a static perspective and Crozet and Koenig (Reference Crozet and Koenig2005), Brülhart and Sbergami (Reference Brülhart and Sbergami2009) and Gardiner et al. (Reference Gardiner, Martin and Tyler2011) from a dynamic view.
On the one hand, Ciccone and Hall (Reference Ciccone and Hall1996) present a theoretical framework that identifies an agglomeration effect linking the density of economic activity with inter-regional differences in labour productivity. The authors empirically analyse the presence of this kind of relationship in the case of the U.S. counties. In an ulterior analysis Ciccone (Reference Ciccone2002) proves the presence of a relationship between economies of agglomeration arising from density and industrial labour productivity for the regions of France, Germany, Italy, Spain and the United Kingdom in the 1980s. This literature has established the links between economic density and agglomeration effectsFootnote 1 .
Crozet and Koenig (Reference Crozet and Koenig2005), on the other hand, find a positive relationship between inequality in the distribution of economic activity across the territory and the growth of GDP per capita in a sample of European NUTS3 regions for the period 1980-2000. Brülhart and Sbergami (Reference Brülhart and Sbergami2009) carry out a Barro-style empirical analysis of the determinants of economic growth for a large sample of countries over the period 1960-1996. In their study, alongside the explanatory variables traditionally included in this type of exercise, they introduce different indicators for the spatial agglomeration of production and population. They subsequently repeat the same kind of exercise using a sample of European Union (EU) countries for which different indicators of agglomeration, based on data for population and economic activity by branch of activity and region (NUTS2), are constructed. Their results support the existence of a positive relationship between the presence of agglomeration economies and growth in the early stages of regional development processes. However, their work also indicates that once a certain level of income per capita is reached (which the authors put at around $10,000 in 2006), this relationship disappears or becomes negative. In this respect they point out that their empirical analysis provides evidence in support of the so-called «Williamson hypothesis» (Williamson Reference Williamson1965), according to which agglomeration will accompany growth in the early stages of economic development, characterised by the presence of high transport costs, but this relationship will become negative when these costs are reduced.
Gardiner et al. (Reference Gardiner, Martin and Tyler2011) questioned the results obtained by Brülhart and Sbergami (Reference Brülhart and Sbergami2009). They explore the relationship between agglomeration and growth in EU countries and obtain inconclusive results. In particular, they note that the existence of this relationship lacks robustness when different agglomeration measures are introduced and when the size of the territorial units considered is changed (NUTS1 or NUTS2). They therefore suggest that the results are those to be expected only when using a small enough territorial scale, such as NUTS3. They also point out that the limited period for which homogeneous information is available reduces the robustness of the results. Hence, the empirical literature still presents partial and basically inconclusive evidence regarding the existence of a relationship between the agglomeration of production and economic growth. Nevertheless, it is possible to identify some of the problems that need to be considered when it comes to suggesting how to move forward in the empirical analysis of this relationship.
In these circumstances, studying the case of Spain for the period 1870-1930 implies a dual contribution to the subject. From the standpoint of the empirical debate, exploring the presence of a relationship between agglomeration and regional growth in the early stages of the economic growth process in Spain allows us to overcome many of the limitations identified in previous empirical work. First of all it involves an economy that, because it was still in the early stages of economic development, was characterised by the presence of high transport costs (Herranz Reference Herranz2007; Prados de la Escosura and Rosés Reference Prados De La Escosura and Rosés2009). Also, all Spain’s regions are at income levels clearly below the thresholds that would mark a change of trend in the relationship between agglomeration and growth (Rosés et al. Reference Rosés, Martinez-Galarraga and Tirado2010). Within the framework of the industrialisation processes typical of the countries of central and southern Europe, economic growth in Spain over this period was led by advances in the industrial sector, in which various papers have shown the presence of agglomeration economies (Betrán Reference Betrán1999; Tirado et al. Reference Tirado, Paluzie and Pons2002; Martínez-Galarraga et al. Reference Martinez-Galarraga, Paluzie, Pons and Tirado2008). In addition, because this is a study based on regional data, it can be carried out using information involving territorial units that are sufficiently limited in size, that is, the Spanish NUTS3 areas (provinces), while minimising the role that might be played by institutional-type elements when it comes to impacting the growth dynamic of the various territories. Finally, the data set on which the study is based allows us to carry out a long-term analysis of the relationship between agglomeration and growth because we have homogeneous information for a period of 60 years that covers the first main stage of economic development in Spain.
On another level, it also contributes to the area of Spanish economic history. It is the first time that a paper has used estimates of provincial GDP for the second half of the 19th century, which complete the data set presented in Rosés et al. (Reference Rosés, Martinez-Galarraga and Tirado2010)Footnote 2 . The reconstruction of regional GDP estimates for Spain is in line with the international literature that has recently provided historical estimations for different countries. This would be the case, among others, of Britain (Crafts Reference Crafts2005; Geary and Stark Reference Geary and Stark2015), Italy (Felice Reference Felice2011), France (Combes et al. Reference Combes, Lafourcade, Thisse and Toutain2011), Portugal (Badia-Miró et al. Reference Badia-Miró, Guilera and Lains2011), Sweden (Henning et al. Reference Henning, Enflo and Andersson2011; Enflo and Rosés Reference Enflo and Rosés2015), Belgium (Buyst Reference Buyst2012) or Mexico (Aguilar-Retureta Reference Aguilar-Retureta2015).
As has been pointed out recently, the early stages of economic development in Spain took place alongside a strong increase in spatial inequality both as regards the location of industry across the territory (Paluzie et al. Reference Paluzie, Pons and Tirado2004) and levels of GDP per capita for the Spanish regions (Rosés et al. Reference Rosés, Martinez-Galarraga and Tirado2010). In the analysis of the causes of this increase in regional inequalities and its relation with the presence of agglomeration economies in the industrial sector, Martínez-Galarraga (Reference Martinez-Galarraga2012) has shown that the marked industrial specialisation of a small number of Spanish provinces came about, among other factors, due to their market size in the presence of economies of scale that acted as an agglomeration force. Besides, Martínez-Galarraga et al. (Reference Martinez-Galarraga, Paluzie, Pons and Tirado2008), following Ciccone and Hall (Reference Ciccone and Hall1996), have also shown the presence of a relationship between industrial regional employment density and labour productivity since the origins of industrialisation and modern growth in the second half of the 19th century.
Rosés et al. (Reference Rosés, Martinez-Galarraga and Tirado2010) and Martínez-Galarraga et al. (Reference Martinez-Galarraga, Tirado and González-Val2015) extend the analysis to the determinants of regional income inequality. Rosés et al. (Reference Rosés, Martinez-Galarraga and Tirado2010) shows that the Spanish regions that specialised in industrial production were those that achieved the highest levels of income during these years. Additionally, Martínez-Galarraga et al. (Reference Martinez-Galarraga, Tirado and González-Val2015) find a direct relationship between market potential and regional economic growth in the early decades of the 20th century. Bearing all this in mind, the present study allows us to analyse the hypothesis that seems to derive from these papers. Exploring whether the agglomeration of production, especially in the industrial sector, acted as an element to explain regional growth is key to understanding the upswing in regional economic inequality that characterised the Spanish economy in the period from the mid-19th century to the eve of the Civil War.
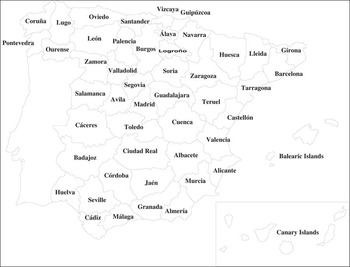
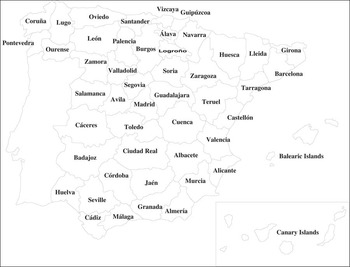
Following this introduction, the paper is divided into five sections. Section 2 presents descriptive evidence on the evolution of the concentration of economic activity and regional growth in Spain from 1860 to 1930. Section 3 presents the data set used to carry out the study, along with the descriptive evidence the data provide. Section 4 shows the empirical model on which the analysis is based. Section 5 presents and discusses the main results deriving from the statistical analysis. First of all we look at the relationship between agglomeration and provincial economic growth on an aggregate level. The analysis is then extended on the basis of a sectoral disaggregation, allowing us to explore the origins of the possible relationship between agglomeration and economic growth. Finally, section 6 summarises the main conclusions, links the results to those areas where new evidence contributes to knowledge on the subject and suggests some lines for future research. A provincial map and a detailed explanation of the methodology employed to estimate GDP values for 1870, 1880 and 1890 can be found in Appendices A and B. Appendix C shows the expansion of the railway network in Spain, 1855-1923.
2. SPATIAL INEQUALITY AND REGIONAL ECONOMIC GROWTH IN SPAIN, 1860-1930: DESCRIPTIVE EVIDENCE
The second half of the 19th century saw the beginnings of modern economic growth in Spain (Kuznets Reference Kuznets1955). During the early stages of economic development, the economy as a whole experienced what can be considered modest rates of growth. However, this trend would change after the First World War when both GDP and GDP per capita registered growth rates substantially higher than in previous periods (Table 1).
GROWTH OF REAL GDP, POPULATION AND GDP PER CAPITA, 1850-1929

Note: Annual average logarithmic rates.
Source: Prados de la Escosura (Reference Prados De La Escosura2008, p. 288).
The beginning of modern economic growth is associated with structural change and, more specifically, industrialisation. In this respect, various authors including Pollard (Reference Pollard1981) emphasise the regional nature of the industrialisation processes, given that industry throughout history has tended to develop in particular regions or specific locations within countries. Spain is a prime example of this historical evolution. Industry showed a higher degree of development mainly in the peripheral regions of Catalonia and the Basque Country. In the former, industrialisation, initially based on textiles, was already under way in the mid-19th century and had roots reaching back to the final decades of the 18th century. In the latter, where the process was driven by iron, steel and mining, there was an unprecedented boom in the last quarter of the 19th century. The arrival of industrialisation in a limited number of regions during the second half of the 19th century (Nadal Reference Nadal1987) and deindustrialisation in others, mainly located in the interior of the Iberian Peninsula (Sánchez-Albornoz Reference Sánchez-Albornoz1987), resulted in an increase in the spatial concentration of industry (Paluzie et al. Reference Paluzie, Pons and Tirado2004). This trend towards higher concentration is characteristic of the early stages of economic development in Spain and would continue until the eve of the Civil War, as can be seen in Table 2 Footnote 3 .
SPATIAL CONCENTRATION IN INDUSTRY, SPAIN 1856-1929 (NUTS3)

Source: Paluzie et al. (Reference Paluzie, Pons and Tirado2004).
So what elements would explain this increase in the spatial concentration of industry in Spain between the mid-19th century and the 1930s? Rosés (Reference Rosés2003), following Davis and Weinstein (Reference Davis and Weinstein1999, Reference Davis and Weinstein2003), argued that new modern manufacturing industries in the mid-19th century tended to be concentrated in regions in which home-market effects were greater. Tirado et al. (Reference Tirado, Paluzie and Pons2002), in line with Kim (Reference Kim1995), identified economies of scale and market size as the forces behind Spain’s industrial geography in the mid-19th century. By the end of the century, the explanatory power of these new economic geography (NEG) effects had increased in parallel with advances in the economic integration process. More recently, adopting the approach developed by Midelfart-Knarvik et al. (Reference Midelfart-Knarvik, Overman, Redding and Venables2002), Martinez-Galarraga (Reference Martinez-Galarraga2012) confirmed and extended the previous findings of Tirado et al. (Reference Tirado, Paluzie and Pons2002). As the domestic market became integrated and industrialisation progressed during the second half of the 19th century, NEG forces became the main determinant of Spain’s industrial map. In particular, although comparative advantage factors were a feature of the Spanish case, the scale effects suggested by Krugman (Reference Krugman1991), captured by the interaction between economies of scale and market potential, played a decisive role: up to the 1930s industries with increasing returns tended to be concentrated in provinces with better access to demand.
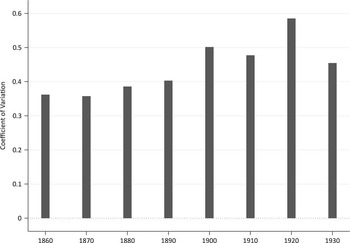
From the standpoint of the evolution of regional inequality in terms of output per capita, Rosés et al. (Reference Rosés, Martinez-Galarraga and Tirado2010) have shown that regional inequality grew until 1900. As can be seen in Figure 1, the new evidence supplied for the second half of the 19th century shows that this increase was concentrated especially in the 1890s. From then on the trend was for these territorial disparities to remain, although the aftermath of the First World War was characterised by another increase in inequality.
REGIONAL INEQUALITY IN GDP PER CAPITA IN SPAIN, 1860-1930 (NUTS3 PROVINCES). Note: Population-weighted coefficient of variation for NUTS3 provinces. Sources: For 1860 and 1900-1930, see Rosés et al. (Reference Rosés, Martinez-Galarraga and Tirado2010); for 1870-1890, see text.
Rosés et al. (Reference Rosés, Martinez-Galarraga and Tirado2010) have explored the reasons that may lie behind this evolution of inequality. They carried out an analysis that makes it possible to differentiate between the elements most closely linked to regional specialisation, as suggested by traditional international trade theory (Heckscher-Ohlin), and the existence of differences in productivity between provinces, which would more likely be related to explanations typical of NEG. The results suggest that structural change, that is, differences in the timing and intensity of the arrival of industrialisation between regions, was responsible for the increase in inequality that came about in the second half of the 19th century. The growing differences in production structures, however, tended to become smaller in the early decades of the 20th century, when industrialisation spread to a greater number of provinces, especially during the inter-war years (Betrán Reference Betrán1999; Tirado and Martínez-Galarraga Reference Tirado and Martinez-Galarraga2008). In this period, differences in productivity were more important in explaining regional inequality. These differences would reflect that the impact of the forces of NEG became stronger over these years, and could have thus slowed down income convergence among the regions of Spain.
As a result of all this, the evidence available for Spain before the Civil War shows that there was a definite trend towards the spatial agglomeration of economic activity during the early stages of modern economic growth insofar as transport costs were falling, the domestic market was becoming integrated and industrial progress meant that the increasing returns associated with economies of scale had a greater presence. In parallel to the process of spatial concentration of industrial production, regional economic inequality was increasing sharply, at least until the start of the 20th century. So, did this presence of agglomeration economies have a positive or a negative effect on regional economic growth? What impact did it have on the evolution of regional disparities during this period? What elements might have hindered the regional convergence process after the start of the 20th century? Before we explore these questions, we need to quantify the agglomeration.
3. MEASURING SPATIAL AGGLOMERATION IN SPAIN, 1860-1930: MAIN INDICATORS
To find out about agglomeration in the Spanish provinces during the relevant period, we propose two approaches. First, we capture absolute agglomeration, as is common in the existing literature (Brülhart and Sbergami Reference Brülhart and Sbergami2009), with provincial urbanisation rates, defined as the percentage of the total population of each province who live in towns of over 5,000 inhabitants. The data used to construct this indicator come from Reher (Reference Reher1994), and the respective Population Censuses. Second, we aim to construct an indicator that proxies for agglomeration economies in production. For this, we provide two provincial indices. Both have been computed using data for gross value added (GVA) at factor cost and Employment (EMP)Footnote 4 .
Our first index, ϕ i , proxies for the presence of agglomeration economies at the aggregate level for each province i, and is constructed as follows:
 $$\phi ^{i} =\mathop{\sum}\nolimits_{r=3} {\left[ {\log \left( {{{{{GVA_{r}^{i} } \over {area^{i} }}} \over {{{GVA_{s}^{I} } \over {area^{I} }}}}} \right) \cdot \left( {{{GVA_{r}^{i} } \over {GVA_{S}^{i} }}} \right)} \right]} $$
where S represents the total GVA for each of the forty-nine provinces i (with I being the total for Spain); r represents each economic sector (agriculture, industry and services); and each province’s area is expressed in square kilometresFootnote 5 .
Additionally, we introduce an index for the presence of agglomeration economies at the sectoral level for each province i and each economic sector r (agriculture, industry and services). We denote this indicator $\Omega _{r}^{i} $
, and it can be expressed as
$\Omega _{r}^{i} $
, and it can be expressed as
 $$\Omega _{r}^{i} =\log \left( {{{{{GVA_{r}^{i} } \over {area^{i} }}} \over {{{GVA_{r}^{I} } \over {area^{I} }}}}} \right)$$
By construction, the second set of indices $(\phi ^{i} ;\,\Omega _{r}^{i} )$
measure relative provincial GVA per square kilometre and can thus be interpreted, in line with Ciccone and Hall (Reference Ciccone and Hall1996), as a measure of relative economic densityFootnote
6
. These indices have been normalised in the range [0,1].
$(\phi ^{i} ;\,\Omega _{r}^{i} )$
measure relative provincial GVA per square kilometre and can thus be interpreted, in line with Ciccone and Hall (Reference Ciccone and Hall1996), as a measure of relative economic densityFootnote
6
. These indices have been normalised in the range [0,1].
These measures thus capture different aspects linked to the presence of agglomeration economies in production. The urbanisation rate, on the other hand, is an absolute and population-related measure of agglomeration. Although we employ both in the empirical analysis, our measures
 $$(\phi ^{i} ;\,{\rm \Omega }_{r}^{i} )$$
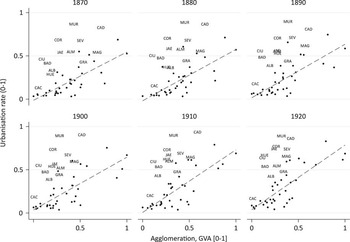
allow us to consider aspects of agglomeration that are directly connected to the concentration of economic activity. Figure 2 shows the relationship between these two indicators. There is a positive correlation between them that increases and approaches the diagonal when the southern provinces of Spain are excluded. This, in turn, illustrates that urbanisation rates and the presence of agglomeration economies in production do not necessarily go hand-in-hand.
$$(\phi ^{i} ;\,{\rm \Omega }_{r}^{i} )$$
allow us to consider aspects of agglomeration that are directly connected to the concentration of economic activity. Figure 2 shows the relationship between these two indicators. There is a positive correlation between them that increases and approaches the diagonal when the southern provinces of Spain are excluded. This, in turn, illustrates that urbanisation rates and the presence of agglomeration economies in production do not necessarily go hand-in-hand.
URBANISATION AND AGGLOMERATION ECONOMIES IN AGGREGATE PRODUCTION (ϕ i ) IN SPAIN BY YEAR, 1870-1930 (NUTS3 PROVINCES, GROSS VALUE ADDED (GVA)). Notes: Dots illustrate the Canary Islands, the Balearic Islands and the northern provinces. The southern provinces (Almería, Cádiz, Córdoba, Granada, Huelva, Jaén, Málaga, Sevilla, Badajoz, Cáceres, Murcia, Albacete and Ciudad Real) are shown using a three-digit code. Source: See text.
Now that our indicators have been presented, an initial approximation can be made of the relationship between agglomeration economies and GDP per capita in each of the six time intervals selected. Indeed, Figure 3 shows that since 1870 those provinces in which, in terms of our GVA indicator, agglomeration economies were greater also registered higher levels of GDP per capita throughout the period.
GDP PER CAPITA AND AGGLOMERATION ECONOMIES IN AGGREGATE PRODUCTION (ϕ i ) IN SPAIN BY YEAR, 1870-1930 (NUTS3 PROVINCES, GROSS VALUE ADDED (GVA)). Source: See text.

As for the analysis of the relationship between the presence of agglomeration economies, or economic density, and the growth of GDP per capita at province level during the period studied, this can be done by carrying out a visual examination of Figures 4 to 6. To begin with, our indicator ϕ
i
in 1870, the 1st year of the study, can be seen in Figure 4. The group of provinces with the greatest economic density, headed by Madrid and Barcelona, are mainly to be found along the eastern Mediterranean coast, in the Ebro valley, the north of the peninsula and in eastern Andalusia. With the exception of eastern Andalusia and some north-western provinces, Figure 5 shows that it is these same areas in which the provinces that registered the highest growth rates between 1870 and 1930 are concentrated. Thus the maps point to the existence of a positive relationship between greater agglomeration of economic activity and subsequent economic growth. A similar relationship is observed when analysing agglomeration economies in industry
 $$({\rm \Omega }_{r}^{i} )$$
and provincial GDP per capita growth (Figure 6). This would indicate that the evolution of the industrial sector could be behind the observed relationship between agglomeration economies and growth, and thus deserves further examination. However, this initial exploration simply shows us an apparent relationship between the variables studied. The next section explores this relationship in greater detail and with greater rigour within the analytical framework linked to the literature on economic growth.
$$({\rm \Omega }_{r}^{i} )$$
and provincial GDP per capita growth (Figure 6). This would indicate that the evolution of the industrial sector could be behind the observed relationship between agglomeration economies and growth, and thus deserves further examination. However, this initial exploration simply shows us an apparent relationship between the variables studied. The next section explores this relationship in greater detail and with greater rigour within the analytical framework linked to the literature on economic growth.
AGGLOMERATION ECONOMIES IN AGGREGATE PRODUCTION (ϕ i ) IN SPAIN, 1870 (GROSS VALUE ADDED).
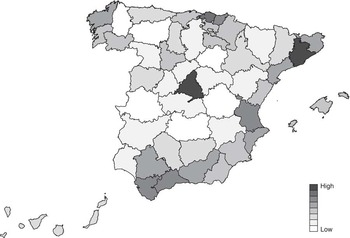
ANNUAL GROWTH RATE (PER CENT) OF GDP PER CAPITA IN SPAIN, 1870-1930.

AGGLOMERATION ECONOMIES IN INDUSTRIAL PRODUCTION
 $${\rm (\Omega }_{r}^{i} )$$
IN SPAIN, 1870 (GROSS VALUE ADDED). Sources: Rosés et al. (Reference Rosés, Martinez-Galarraga and Tirado2010) and text.
$${\rm (\Omega }_{r}^{i} )$$
IN SPAIN, 1870 (GROSS VALUE ADDED). Sources: Rosés et al. (Reference Rosés, Martinez-Galarraga and Tirado2010) and text.

4. EMPIRICAL MODEL
Following Brülhart and Sbergami (Reference Brülhart and Sbergami2009), we set out to empirically evaluate the relationship between the presence of agglomeration economies and economic growth across Spanish provinces (NUTS3) for the period 1870-1930. As Brülhart and Sbergami (Reference Brülhart and Sbergami2009) prudently pointed out, choosing an empirical growth model is far from being trivial. We therefore propose a simple regression model based on the existing literature (Barro and Sala-i-Martin Reference Barro and Sala-i-Martin1991; Sala-i-Martin et al. Reference Sala-i-Martin, Doppelhofer and Miller2004):
 $$g_{{i,p}} =\alpha y_{{i,t{\minus}T}} {\plus}\beta A_{{i,t{\minus}T}} {\plus}\gamma {\rm Z}_{{i,t{\minus}T}} {\plus}\mu _{i} {\plus}v_{t} {\plus}{\varepsilon}_{{i,p}} $$
The dependent variable encapsulates the average annual growth rate of GDP per capita for province i over decade p, that is (t,t−T), where t and T stand for the year and length of period (T=10). This has been calculated as
 $$g_{{i,p}} =(y_{{i,t}} {\minus}y_{{i,t{\minus}T}} )/T$$
where y
i,t
is the log of GDP per capita for province i in year t. Therefore, y
i,t−T
is the log of the initial value of GDP per capita or «catch-up» term. A
i,t−T
captures the presence of agglomeration economies, our variable of interest, in province i at the start of each decade, while Z is a vector of control variables, also measured at the start of each decade. As mentioned earlier, we provide distinct proxies for agglomeration economies. First, we use
 $$(\phi ^{i} {\rm ;}\,{\rm \Omega }_{r}^{r} )$$
for agglomeration economies in production (GVA, EMP). Then, urbanisation rates as a proxy for absolute agglomeration (Henderson Reference Henderson2003; Brülhart and Sbergami Reference Brülhart and Sbergami2009).
$$(\phi ^{i} {\rm ;}\,{\rm \Omega }_{r}^{r} )$$
for agglomeration economies in production (GVA, EMP). Then, urbanisation rates as a proxy for absolute agglomeration (Henderson Reference Henderson2003; Brülhart and Sbergami Reference Brülhart and Sbergami2009).
The set of control variables includes the literacy rate as a proxy for human capital stock and the log of the stock of infrastructures as a proxy for the regional stock of public capitalFootnote 7 . The spatial distribution of literacy in Spain showed an increasing polarisation over the period considered (Núñez Reference Núñez1992). In 1860, literacy rates were higher in the area going from Madrid, through Castile-Leon and northern Spain. By 1900, there was a marked division of the country between the north and the south in terms of education. The only exceptions were Galicia in the north-west and south-western Andalusia. In 1930, the transition to universal literacy was almost completed in the north, and the south had started to close the gap with the northern provinces although illiteracy was still an important issue on the eve of the Spanish Civil War (half of the provinces had literacy rates between 50 per cent and 70 per cent).
In addition, the evolution of infrastructures is marked by the construction of the railway network, which was especially intense in the second half of the 19th century. In the first stage, between 1855 and 1866, the railway connected the main economic centres. In this period, the length of the network grew from 440 to 5,076 km. In the second stage, spanning from 1873 to 1896, the railway reached other areas of the country (Herranz Reference Herranz2005). By 1901, all provincial capitals had been connected to the networkFootnote 8 .
In addition, the share of mining (as a percentage of GDP) aims to control for regional differences in natural resources (Rosés et al. Reference Rosés, Martinez-Galarraga and Tirado2010 and Appendix B). Spain has traditionally been well endowed with mineral resources. Mining experienced a boost in the late 1900s as a result of greater international demand. Major reserves of iron ore were located in the provinces of Vizcaya and Santander in the north, and in Málaga in the south; lead ore mines existed in southern Spain (Murcia, Jaén, Almería, Córdoba, Granada, Badajoz and Ciudad Real); copper was abundant in the south (Huelva); mercury was extracted in Almadén (Ciudad Real); and finally, coal was mainly concentrated in the north (Asturias and León) and in some southern provinces (Ciudad Real and Córdoba)Footnote 9 .
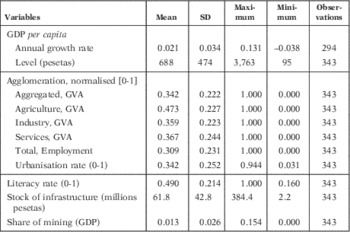
These variables are included to control for other relevant factors that positively affect the process of regional economic growth. Although our selection is limited, we have attempted to reduce the potential omission of variables with our set of controls. This limitation to our selection results from a potential problem of instrument proliferation when using the generalised methods of moments (GMM) estimator, as we explain below. Table 3 shows the descriptive statistics of our main variables. Finally, μ i , v t and ε i,p represent a province-specific effect, a time-specific effect and a well-behaved error term, respectively. Generally speaking, our chosen specification states that economic growth depends on the initial level of income, agglomeration and a set of control variables.
DESCRIPTIVE STATISTICS
Note: GVA: gross value added.
To estimate the relationship between agglomeration and economic growth, we begin with a pooled ordinary least squares (OLS) regression. However, estimating a dynamic panel data model with a pooled OLS regression ignores the province-specific effects (μ i =0) and the potential endogeneity problem related to our main explanatory variables. The panel regression allows us to control for omitted province-specific time-invariant effects, and thus μ i ≠0. Furthermore, these omitted variables might possibly be correlated with our main variable of interest, agglomeration, and cause economic growth. If this were the case, the strict exogeneity assumption would be violated and therefore our estimate β could be biased. To solve the potential endogeneity problem, we adopt a panel regression using decades or 10-year intervals. The difficulty of finding appropriate valid external instruments for our panel regression recommends the use of the system GMM estimator, proposed by Arellano and Bover (Reference Arellano and Bover1995) and further developed by Blundell and Bond (Reference Blundell and Bond1998, Reference Blundell and Bond2000)Footnote 10 .
The system GMM estimator combines equations in first differences and levels, both of which are estimated simultaneously. Given our specification, all time-dependent variables are assumed to be potentially endogenous. Hence, first differences are instrumented with lagged levels and levels with lagged first differences. There is therefore no need for us to find external instruments for our explanatory variables. Nevertheless, the generation of numerous instruments in system GMM, as Roodman (Reference Roodman2009a) claims, could become a major concern by overfitting the endogenous variables. Given our panel, a maximum of two lags has been imposed to lessen the potential problem of instrument proliferation. We report the Hansen J tests for the joint validity of the instruments and have estimated the system GMM estimator with the xtabond2 package for Stata 13 developed by Roodman (Reference Roodman2009b)Footnote 11 .
5. RESULTS: AGGLOMERATION AND ECONOMIC GROWTH IN SPAIN, 1870-1930
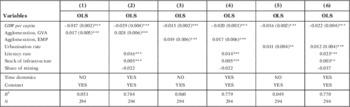
Table 4 reports the pooled OLS results. Our sample contains 294 observations corresponding to the forty-nine Spanish provinces (NUTS3) over six decades. Columns (2) and (4) show our chosen specification with two proxies for agglomeration: GVA and EMP. The pooled OLS regression performs well (R 2>0.77). The coefficients of our main explanatory variables are highly significant and reasonably stable. The prior hypotheses are empirically supported. Conditional convergence (α<0) is also supported, while agglomeration (β>0) appears to have a positive effect on economic growth. The coefficient of our proxy for agglomeration of GVA (0.028) is greater than that for EMP (0.017), and so is the R 2. This will be a recurring feature. Our proxy for agglomeration of GVA will therefore be our preferred one. Finally, the set of control variables is statistically significant and positively related to economic growth, except for share of mining. Although these preliminary results are encouraging, we need to exercise caution because a pooled OLS regression ignores province-specific effects (μ i =0) and the potential endogeneity related to agglomeration, our main variable of interest.
AGGLOMERATION AND GDP PER CAPITA GROWTH IN SPAIN, 1870-1930 (ORDINARY LEAST SQUARES (OLS))
Notes: GVA: gross value added, EMP: employment.
Dependent variable: annual growth rate of GDP per capita; independent variables are lagged; all variables are in logarithmic scale except for rates/shares (0-1).
Statistically significant at *10%, **5%, ***1% levels.
Our two proxies (ϕ i ) do not fully capture the presence of agglomeration economies in province i and year t. We thus need to test our preliminary results. To this end we estimate our preferred specification with urbanisation rates as a proxy for absolute agglomeration. Columns (5) and (6) in Table 4 show the pooled OLS regression with urbanisation rates. Once again, the presence of agglomeration economies, measured with urbanisation, has a positive and statistically significant effect on regional economic growth. However, our indices (ϕ i ) for GVA and employment seem to perform slightly better. In this regard, proxies reflecting economic activity appear to be a more appropriate measure of agglomeration than population-related ones.
To overcome the potential endogeneity problem associated with agglomeration we use the system GMM estimator. This approach takes into account the omission of province-specific time-invariant effects (μ i ≠0) that could be correlated with agglomeration, thereby biasing our estimate β. The panel includes forty-nine Spanish provinces (NUTS3) over six decades, 1870-1930. As stated earlier, all time-dependent variables will be treated as potentially endogenous. To mitigate the potential problem of instrument proliferation, and given the small size of our panel, we have instrumented GDP per capita and agglomeration economies with a maximum of two lags. The remainder of the time-dependent variables are instrumented with just one lag. Table 5 reports our main results. Columns (1), (3) and (5) show the one-step estimation, while columns (2), (4) and (6) illustrate the two-step estimation. We report both estimation procedures to shed further light on our resultsFootnote 12 .
AGGLOMERATION AND GDP PER CAPITA GROWTH IN SPAIN, 1870-1930 (SYSTEM GENERALISED METHODS OF MOMENTS)

Notes: GVA: gross value added, EMP: employment.
Dependent variable: annual growth rate of GDP per capita; independent variables are lagged; all variables are in logarithmic scale except for rates/shares (0-1).
Statistically significant at *10%, **5%, ***1% levels.
The results are in line with those reported above. The relationship between agglomeration economies and regional economic growth is empirically supported. The β coefficients are positive and statistically significant when our measure of agglomeration (GVA) is used. Moreover, these estimate values are similar to the ones presented in Table 4. Second, we also find strong support for the prior probability of conditional convergence (α<0). The estimated values fall between 2 per cent and 3 per cent, which is in line with the existing literature on regional convergence (Barro and Sala-i-Martin Reference Barro and Sala-i-Martin1991). Third, the set of control variables performs well. Literacy is highly significant and has a positive effect on economic growth, while the stock of infrastructures also has a positive impact, although now it does not appear to be statistically significant. Finally, the share of mining remains statistically insignificant.
As Table 5 illustrates, the system GMM estimation performs reasonably well given our small panel and strong restrictions. To test for the joint validity of the instruments, we use the Hansen J test (Hansen Reference Hansen1982)Footnote 13 . We also report the second-order autocorrelation tests. The P-values of the Hansen J test could certainly be disheartening. However, it is important to remember that although our panel contains just 294 observations, even if we restrict ourselves to a maximum of two lags we generate up to sixty-four instruments. This would explain the unsatisfactory P-values in the Hansen J test. The weakness of the Hansen test should not, therefore, discourage this empirical approach. The difficulty in finding appropriate external instruments for the potentially endogenous variables such as agglomeration led us to adopt the system GMM estimator. Hence, in spite of the small panel, the system GMM estimation strengthens our previous findings, which found a strong relationship between agglomeration economies and regional economic growth in Spain during the early stages of industrialisation.
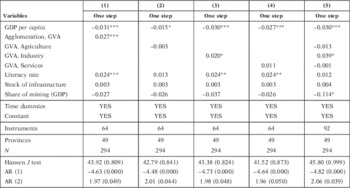
Finally, we disaggregate our measure of agglomeration (GVA) by activity (agriculture, industry and services). Table 6 reports the main results using the one-step system GMM estimatorFootnote 14 . Column (1) shows our baseline dynamic panel data model. Columns (2), (3) and (4) illustrate our chosen specification with a proxy for agglomeration economies (GVA) by economic activity. Column (5) presents the results of the inclusion of the three different proxies. On the whole, we found a stable empirical model. Once again conditional convergence (α<0) is supported, with the estimates ranging from 1.5 per cent to 3.1 per cent. This is in line with the existing literature on regional convergence. Literacy and the stock of infrastructures have a positive impact, though the latter is statistically insignificant as in Table 5. As regards our main variable of interest, only the presence of «industrial» agglomeration (GVA) is statistically significant. This supports our prior hypothesis. These findings can also be seen in column (5), where our three proxies for agglomeration are included. To conclude, the existence of a positive relationship between agglomeration economies and economic growth across Spanish provinces (NUTS3) for the period 1870-1930 emerges as our main finding. This relationship seems robust and closely related to the presence of agglomeration economies in industry.
SECTORAL AGGLOMERATION AND GDP PER CAPITA GROWTH IN SPAIN, 1870-1930 (SYSTEM GENERALISED METHODS OF MOMENTS)
Notes: GVA: gross value added.
Dependent variable: annual growth rate of GDP per capita; independent variables are lagged; all variables are in logarithmic scale except for rates/shares (0-1).
Statistically significant at *10%, **5%, ***1% levels.
6. CONCLUSIONS
This article has explored the existence of a relationship between the presence of agglomeration economies and regional economic growth in Spain. Following the methodology proposed by Brülhart and Sbergami (Reference Brülhart and Sbergami2009), we have carried out an analysis of regional convergence in Spain between 1870 and 1930, a period in which the Spanish economy underwent the early stages of its development process. Along with control variables characteristic of this literature such as initial provisions for cumulative factors like human capital and infrastructures, the study has considered the explanatory potential of different indicators for the agglomeration of population and production. For this exercise, we have used a data set that includes estimates of regional GDP per capita in Spain for 1870, 1880 and 1890 for the first time.
The results indicate that regional growth in Spain during these years followed a path of conditional convergence in which initial differences in the provision of human capital played a particularly important role, enabling us to understand the different growth trajectories of the different Spanish regions. In addition, and in connection with the central aspect of this study, the results support the existence of a positive, robust relationship between the presence of agglomeration economies (especially in the industrial activity) and their subsequent growth trajectories.
Therefore, we provide evidence in support of a trade-off between inequality in the spatial distribution of economic activity and economic growth. This, in turn, goes in line with Brülhart and Sbergami (Reference Brülhart and Sbergami2009). Our study, however, avoids some of the limitations identified in the literature. Spain, during the period 1860-1930, was in the early stages of modern economic growth. Like other European economies of the period, this economy was driven by industrialisation, which in the context of the second half of the 19th century and first third of the 20th century, was characterised by the generation of agglomeration economies. Also, the historical period explored in the case of Spain corresponds with the construction of the railway network, which brought about a rapid reduction in transport costs, an element that would favour the presence of agglomeration economies typical of industrial activities. Finally, the data set used to carry out the study was comprised of information involving relatively small territorial units in which, these being regions belonging to the same state, institutional differences appear to be less important when it comes to explaining the different growth trajectories.
From the standpoint of Spanish economic history, the exercise provides a relevant contribution as it is one of the first to discuss the reasons for regional growth in Spain during the early stages of the country’s economic development using an analytical framework typical of the empirical literature on economic growth. The new evidence shows that the increase in regional economic inequality between 1870 and 1930 was due to two central elements. On the one hand, it is related to the unequal initial provisions of cumulative production factors such as human capital, while on the other the exercise shows that the original economic differences between territories could also have increased due to the direct relationship existing between the initial levels of agglomeration of production and the subsequent rates of growth. Therefore, the evidence presented indicates that, in line with the explanations supplied by NEG, the presence of agglomeration economies in some production processes, especially industrial ones, in a context of market integration brought about the start of a cumulative causation process that increased regional economic inequality in Spain during the second half of the 19th century and hindered its reduction during the first third of the 20th century.
SUPPLEMENTARY MATERIAL
To view supplementary material/s for this article, please visit http://dx.doi.org/10.1017/S0212610915000300
APPENDIX B: SPAIN’S PROVINCIAL GDP 1870-1890
The methodology proposed by Geary and Stark (Reference Geary and Stark2002) for the estimation of regional output is based on two variables: employment and productivity. To begin with, the total GDP of the Spanish economy would be the sum of its parts, or provincial GDPs:
 $$Y_{{{\rm ESP}}} =\mathop{\sum}\nolimits_{{i}} Y_{i} } $$
where Y i represents GDP for province i, and is defined as follows:
 $$Y_{i} =\mathop{\sum}\nolimits_{{j}} y_{{ij}} L_{{ij}} } $$
where y ij stands for the average added value per worker in each province i, in sector j, whereas L ij represents the number of workers in each province and sector. As, there are no direct measures of y ij , it is proxied by taking the Spanish sectoral output per worker y j , assuming that provincial labour productivity in each sector is reflected by its wage relative to the Spanish average (w ij /w j ). Under these assumptions, the provincial GDP will be given by the following expression:
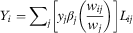 $$Y_{i} =\mathop {\sum}\nolimits_{{j} } \left[ {y_{j} \beta _{j} \left( {{{w_{{ij}} } \over {w_{j} }}} \right)} \right]L_{{ij}} $$
where w ij is the wage paid in province i in sector j, w j the Spanish wage in each sector j and β j a scalar that preserves the relative province differences but scales the absolute values so that the provincial total for each sector adds up to the Spanish total. This model of indirect estimation, based on wage incomes, allows an estimation of GDP by province at factor cost, in current pesetas. The estimation has been undertaken for five economic sectors (agriculture, mining, manufacturing, construction and services)Footnote 15 . Yet, depending on the available statistical information, in some sectors we did not have to resort to the Geary-Stark methodology.
Agriculture
As in Rosés et al. (Reference Rosés, Martinez-Galarraga and Tirado2010) for 1860, we have adopted a modified version of the Geary-Stark methodology. First, we take provincial agrarian wages and the male agrarian active population. Some concerns nonetheless arise. From the statistical information available it is difficult to disentangle the size of the female workforce in agriculture and the yearly number of working days, as well as its variation over provinces. Hence, we rely on the direct estimation of agrarian production by province in 1910 (Rosés et al. Reference Rosés, Martinez-Galarraga and Tirado2010 based on Simpson Reference Simpson1994 and Grupo de Estudios de Historia Rural Reference Gollin1991) and divide it by the agrarian GVA obtained using the Geary-Stark indirect estimation. The resulting scalar is used to correct our initial figures, thus assuming that the relative female workforce and the yearly days worked in each province remained constant for 1870-1890. Then, we scaled the values obtained so that the provincial total agrarian GVA adds up to the Spanish totals offered by Prados de la Escosura (Reference Prados De La Escosura2003). Wages come from Bringas (Reference Bringas2000)Footnote 16 and the male agrarian population is compiled from the Population Censuses of 1877 and 1887, respectively. Given the absence of information for 1870, the provincial agrarian GVA for that year has been computed interpolating the results for 1860 and 1880.
Mining
For the mining sector, a direct estimation is undertaken. The provincial mining production comes from the Spanish Mining Statistics (Estadística Minera de España) for the years 1870, 1880 and 1890. Then, we use the provincial values obtained to distribute Spain’s mining GVA at factor cost (Prados de la Escosura Reference Prados De La Escosura2003).
Manufacturing and Public Utilities
For this sector, we estimate the provincial value added taking a production function with constant returns to scale where the output is obtained from two production factors: labour and capital. Hence, the estimation is based both on wage income (Geary and Stark Reference Geary and Stark2002) and capital income (following the refinement suggested by Crafts Reference Crafts2005). The manufacturing GVA
 $$(GVA_{{it}}^{{MFG}} )$$
can be thus expressed as
$$(GVA_{{it}}^{{MFG}} )$$
can be thus expressed as
 $$GVA_{{it}}^{{MFG}} =\alpha _{{it}} (\omega _{{it}} {\times}L_{{it}} ){\plus}(1{\minus}\alpha _{{it}} )(r_{{it}} {\times}K_{{it}} )$$
with α it being the share of the wage income in manufacturing GVA in region i at time t, ω it the wage, L it the active population, r it captures the returns to capital in manufacturing, whereas K it stands for the capital stock. For the Spanish case, there is information available for each of the components of equation [A4], except for r it . For this reason, we had to assume perfect capital mobility.
For the wage income we take the manufacturing employment in each province from the Population Censuses of 1877 and 1887. Given the absence of wage data for these years we make an interpolation using the wages available for 1860 and 1900 (Rosés et al. Reference Rosés, Martinez-Galarraga and Tirado2010 based on Madrazo Reference Madrazo1984 and Sánchez-Alonso Reference Sánchez-Alonso1995). The provincial capital income is obtained from a fiscal source, the Estadística Administrativa de la Contribución Industrial y de Comercio (EACI) for the years 1878-1879 and 1890. This manufacturing tax, established in 1845, consisted of a fixed rate over the main means of production in use, and varied for each type of machinery and branch, and therefore it is particularly appropriate to capture the provincial capital stock. The addition of the Basque Country and Navarre absent from this fiscal source is based on the data provided in Parejo (Reference Parejo2001). This author used the available historical indices of production to estimate the contribution of these regions to the Spanish industry in 1850 and 1900. Given that industry in the Basque Country took off in the last decades of the 19th century, we make a geometric interpolation using Parejo (Reference Parejo2001) data to capture this trend. Then, the regional information for the Basque Country is divided using the active population in manufacturing by province in the Population Censuses of 1877 and 1887.
In order to calculate the factor shares in equation [A4], we combine the data from two sources. First, the proportions in labour and capital used in nine manufacturing sectors at the Spanish level are obtained from the first available Input-Output Table in 1958Footnote 17 . Second, the provincial structure for these comes from the EACIFootnote 18 . With this information, specific factor shares for each province and for each benchmark were constructedFootnote 19 . The provincial share of manufacturing in 1870 is obtained as an average of that of 1860 and 1880 and then re-scaled to the total GVA in manufacturing and public utilities in Spain according to the figures provided by Prados de la Escosura (Reference Prados De La Escosura2003).
Construction
In Spain’s GVA series offered by Prados de la Escosura (Reference Prados De La Escosura2003), the construction sector includes both residential construction and public works. Spain’s GVA for residential construction is distributed using the provincial urbanisation rates, calculated as the share of the population living in cities over 5,000 inhabitants (Reher Reference Reher1994). The urbanisation rates for 1870 are obtained interpolating the information contained in the Population Censuses of 1860 and 1877. Public works’ GVA is distributed on the basis of the provincial stock of infrastructures provided by Herranz (Reference Herranz2008) for 1870, 1880 and 1890.
Services
For Spain, Prados de la Escosura (Reference Prados De La Escosura2003) offers information of the GVA in services disaggregated in eleven categories: transport, communications, trade, banking and insurance, housing, public administration, education, health services, hotels and restaurants, domestic services and professions. On the basis of this disaggregation, we compiled the data on the active population from the Population Censuses and then assigned to each category, according to the skills and productivity levels of the workforce, different wages. This methodology is therefore slightly different to that applied by Geary and Stark (Reference Geary and Stark2002). In particular, agrarian wages were used for domestic service; an unweighted average of agrarian and industry urban wages (unskilled and skilled) for transport and communications; an unweighted average of industry urban unskilled and skilled wages for commerce, hotels and restaurants; and, finally, urban skilled wages for the remaining branches. Wages were drawn from the sources previously mentioned in other economic sectors and from Rosés and Sánchez-Alonso (Reference Rosés and Sánchez-Alonso2004). For 1870, the provincial values are obtained as an average of 1860 and 1880.
APPENDIX C
THE EXPANSION OF THE RAILWAY NETWORK IN SPAIN, 1855-1923. Source: Cordero and Menéndez (Reference Cordero and Menéndez1978).