




Income inequality is rising in many parts of the world and has become “a defining characteristic of the world system” (Milanović Reference Milanović2016). Inequality has important implications for both economic development and political engagement. High levels of inequality impede economic growth and potentially lead to underdevelopment (Berg et al. Reference Berg, Ostry and Zettelmeyer2012; Bénabou Reference Bénabou1996). Inequality also creates grievances and undermines regime legitimacy because people’s trust in government and political institutions tends to decrease as income inequality rises (Uslaner and Brown Reference Uslaner and Brown2005).
As far as the relationship between income inequality and political engagement or participation is concerned, existing research has reached different conclusions. Some studies contend that high inequality is not conducive to social stability, regardless of the political system (Przeworski et al. Reference Przeworski, Cheibub, Neto and Alvarez1996). Schoene and Allaway (Reference Schoene and Allaway2019) argue that inequality increases protest activity by introducing additional grievances into society as living standards erode. For example, income inequality increases the probability of social protests in Indian villages (Couttenier et al. Reference Couttenier, Laurent-Lucchetti and Vandewalle2023). However, other studies suggest that high inequality depresses the political participation of the poor because of their lack of resources and confidence in influencing policies (Goodin and Dryzek Reference Goodin and Dryzek1980; Gaventa Reference Gaventa1980; McCarthy and Zald Reference McCarthy and Zald1977). Still, other studies do not find a significant relationship between inequality and political engagement due to the presence of intervening variables that may mediate the effect of the former on the latter (Balme and Chabanet Reference Balme and Chabanet2008).
This study focuses on one of these intervening factors, namely, individuals’ attribution of the causes of inequality or low income. Given that individuals may attribute low income to structural or personal factors, their intention to participate in political action is likely to vary. This study examines the effect of inequality attribution through the case of Hong Kong, which is well-known for its high inequality. Our survey of approximately 3,700 Hong Kong residents in 2021 shows that those people who attributed low income to structural or external factors (e.g., social injustice) were more likely to participate in collective action, including both peaceful protests or demonstrations and disruptive actions, while those who attributed low income to personal factors (e.g., incompetence or failure to work hard) were less likely to participate. This attribution effect is stronger on individuals’ intention to participate in violent actions than on their intention to participate in peaceful protests.
Existing research on the relationship between inequality and political participation stresses three factors: relative power, conflict, and resources (Stockemer Reference Stockemer2017). These three factors lead to different conclusions about the relationship between inequality and political participation. Goodin and Dryzek (Reference Goodin and Dryzek1980) contend that rich individuals enjoy advantages over poor ones and are able to exert a dominant influence on policy issues; in this way, inequality contributes to the political engagement of the rich instead of the poor. In contrast, other studies suggest that inequality motivates the poor to participate in distributive politics that serve their interests (Nollert Reference Nollert, Jenkins and Klandermans1995; Oliver Reference Oliver2001). However, “while grievances were ubiquitous, most people did not participate” (Grasso et al. Reference Grasso, Yoxon, Karampampas and Temple2019, 6; Klandermans et al. Reference Klandermans, Van der Toorn and Van Stekelenburg2008) because the poor generally lack confidence in influencing policies. Poor people may not perceive the usefulness of their political participation, thereby choosing to remain passive or silent (Gaventa Reference Gaventa1980, 9–13; Pateman Reference Pateman1971).
This study contributes to the understanding of the relationship between inequality and political participation by showing the effect of perceived causes of inequality. Some studies suggest that lower economic status per se or objective measurements of inequality, like the Gini Coefficient, are not always accurate predictors of people’s behavior or political engagement (Gimpelson and Treisman Reference Gimpelson and Treisman2018; Loveless Reference Loveless2013). Others point out that the perception of inequality or perceived inequality, rather than the actual level of inequality, affects people’s political actions (Tang and Kwong Reference Tang and Kwong2025; Lei Reference Lei2020; Gimpelson and Treisman Reference Gimpelson and Treisman2018; Whyte Reference Whyte2016). Our study further suggests that the perceived causes of inequality affect people’s political participation.
As individuals may attribute inequality or low income to multiple factors, their intention to take action and the target to blame are not always straightforward. The lack of action among poorer people is particularly true when external mobilization efforts are absent. Mobilization involves issue framing, which not only identifies the target to blame but also justifies the action to be taken (Benford and Snow Reference Benford and Snow2000). In other words, individuals’ behavior may not be determined by their group membership or actual economic status but by their blame attribution (Kern et al. Reference Kern, Marien and Hooghe2015; Schlozman et al. Reference Schlozman, Verba and Brady2012; Sahar Reference Sahar2014).
The rest of this study is organized as follows. The next section discusses the literature on the relationship between inequality and political participation and individuals’ attribution of inequality or low income. The article then introduces the case of Hong Kong and presents the survey data about people’s attribution of low income in the city. The subsequent sections conduct a statistical analysis of the relationship between individuals’ attribution of low income and their participation in peaceful protests and violent actions. The article ends with a discussion of the implications of the findings.
Inequality attribution and political participation
Inequality carries important implications for political participation in society by reflecting the resources available to various social groups (Verba et al. Reference Verba, Schlozman and Brady1995), the relative power of these groups (Goodin and Dryzek Reference Goodin and Dryzek1980), and the conflicts among them (Meltzer and Richard Reference Meltzer and Richard1981). While group power and conflicts are likely to affect the political participation of different social groups, the relationship between inequality and political engagement is not straightforward because a low-income status can encourage or reduce the political engagement of social groups with different economic statuses.
Some research suggests that inequality contributes to political participation, including protests (Nollert Reference Nollert, Jenkins and Klandermans1995; Couttenier et al. Reference Couttenier, Laurent-Lucchetti and Vandewalle2023; Oliver Reference Oliver2001; Guimond and Dambrun Reference Guimond and Dambrun2002; Schmitt et al., Reference Schmitt, Maes and Widaman2010; Walker and Mann Reference Walker and Mann1987; Grant and Brown Reference Grant and Brown1995). This relationship can be attributed to group competition or conflict. Highly unequal societies tend to face a zero-sum game because high inequality corresponds to more conflicting policy preferences among various groups, which could fuel disagreements. For example, lower-income groups may participate in redistributive politics to improve their welfare (Meltzer and Richard Reference Meltzer and Richard1981; Mahler Reference Mahler2002). Inequality also contributes to collective action by creating grievances that can translate into action (Schoene and Allaway Reference Schoene and Allaway2019; Zhou and Jin Reference Zhou and Jin2018).
Another line of psychological research suggests a positive relationship between inequality and political action by highlighting the effect of “relative deprivation” (Runciman Reference Runciman1966; Gurr Reference Gurr1970; Buechler Reference Buechler2004). These studies contend that groups experiencing collective relative deprivation endorse the collective social protest option more strongly than the status quo option (Grant and Brown Reference Grant and Brown1995). Fraternalistic deprivation (i.e., the perceived gap between ingroup and outgroup attainment) also motivates participation in social protests (Walker and Mann Reference Walker and Mann1987).
However, other studies have produced opposite findings; that is, inequality undermines people’s motivation for political participation, including elections and non-violent protests (Solt Reference Solt2008; Reference Solt2010; Reference Solt2015; Dahl Reference Dahl2006, 85–86). Dubrow and colleagues (Reference Dubrow, Slomczynski and Tomescu-Dubrow2008) argue that the greater the income inequality in old and new democracies, the lower the proportion of political protesters. In highly unequal societies, the rich tend to have more political resources and clout to prevail in conflicting issues when competing against the poor (Goodin and Dryzek Reference Goodin and Dryzek1980; Schattschneider Reference Schattschneider1960). Alternatively, they can prevent issues concerning low-income groups from being publicly debated (Bachrach and Baratz Reference Bachrach and Baratz1970; Bartels Reference Bartels2016; Hacker and Pierson Reference Hacker and Pierson2010). By contrast, when low-income groups feel powerless in influencing policies, they tend to retreat into silence (Luke Reference Lukes2005, 27) or even support the system (Jost et al., Reference Jost, Pelham, Sheldon and Sullivan2003; Sengupta et al., Reference Sengupta, Milojev, Barlow and Sibley2015). Thus, inequality discourages political engagement among low-income groups while stimulating the engagement of the rich (e.g., Ansolabehere et al. Reference Ansolabehere, de Figueiredo and Snyder2003).
Existing research also finds that grievances arising from perceived inequality may also motivate people to participate in collective action (Lei Reference Lei2020; Gimpelson and Treisman Reference Gimpelson and Treisman2018). During the 2019 social movement in Hong Kong, for example, individuals who perceived themselves as belonging to a lower class tended to be frustrated by a lack of social mobility and equality. These negative perceptions contributed to concerns about the activities of Mainland Chinese individuals and the use of public resources. Consequently, these economic grievances were associated with support for the 2019 movement (Tang and Kwong Reference Tang and Kwong2025).
Other studies do not find a significant relationship between inequality and political action (Dalton et al. Reference Dalton, VanSickle and Weldon2010; Spilerman Reference Spilerman1970; Jo and Choi Reference Jo and Choi2019; Horn Reference Horn2011; Stockemer and Parent Reference Stockemer and Parent2014; Stockemer and Scruggs Reference Stockemer and Scruggs2012). Balme and Chabanet (Reference Balme and Chabanet2008) show that inequality has no significant relationship with protest, while Dalton et al. (Reference Dalton, VanSickle and Weldon2010) find no correlation between these two factors. Alternatively, there is no significant association between income inequality and peaceful protest, but income inequality is positively associated with violent political actions and negatively associated with voting (Wong Reference Wong2022). In other words, people’s political action can be influenced by factors other than the actual inequality.
Studies that suggest a positive or negative relationship between inequality and political action often operate under the assumption of a zero-sum game between the rich and the poor that drives their conflicting interests. Specifically, this zero-sum game can instigate or repress the political participation of the poor due to their lopsided power relations with the rich. When the rich exercise their political clout to exclude certain issues from the public agenda or to suppress the voice of the poor, the latter lack confidence in and opportunities for political engagement (Lukes Reference Lukes2005; Goodin and Dryzek Reference Goodin and Dryzek1980). When the poor do act, they are often driven by a desire to compete against other groups (Nollert Reference Nollert, Jenkins and Klandermans1995; Oliver Reference Oliver2001).
This zero-sum game is also based on another assumption: that members of different income groups are guided by their group conscience. Members of less wealthy groups believe that their problems stem from their disadvantaged positions compared to the rich. However, this assumption may not be accurate since the actual or perceived causes of low income vary among individuals (Andrews and Leigh Reference Andrews and Leigh2009; Corak Reference Corak2013; Kim et al. Reference Kim, Kim and Lee2023).
Individuals’ causal attribution of inequality serves as a mediating factor that affects the relationship between inequality and political participation (Shirazi and Biel Reference Shirazi and Biel2005; Cappelen et al. Reference Cappelen, Konow, Sørensen and Tungodden2013; Chavanne Reference Chavanne2016). A large body of literature has examined people’s perceived causes of low income or poverty (Heider Reference Heider1958; Weiner Reference Weiner1985; Smith and Stone Reference Smith and Stone1989), including structural or situational, fatalistic, and individualistic factors (Feagin Reference Feagin1982). Structural, situational, and external factors are associated with the government’s welfare and redistribution policies (Cozzarelli et al. Reference Cozzarelli, Wilkinson and Tagler2001; Robinson Reference Robinson2009; Saunders Reference Saunders2003), whereas fatalistic attribution concerns destiny and supra-individual factors that are beyond individuals’ or structural control. Those factors include bad luck, illness, and physical handicap (Feagin Reference Feagin1972; Oorschot and Halman Reference Oorschot and Halman2000).
Individualistic attribution contends that low income or poverty results from individual behaviors or decisions (Wilson Reference Wilson1996; Cozzarelli et al. Reference Cozzarelli, Wilkinson and Tagler2001). The causes of individuals’ poor financial standing include laziness, inability, lack of effort, lack of ambition, tendency to waste money, unstable family background, low intelligence, lack of self-control, deficient planning, and alcohol or drug addiction (Heiserman and Simpson Reference Heiserman and Simpson2017; Feather Reference Feather1974; Islam Reference Islam2005; Niemela Reference Niemela2008). Individualistic attribution is also related to fundamental attribution errors (Heider Reference Heider1944), social sampling (Runciman Reference Runciman1966; Dawtry et al. Reference Dawtry, Sutton and Sibley2015), and poverty culture (Gans Reference Gans1995; Katz Reference Katz1990; Piven and Cloward Reference Piven, Cloward, Block, Cloward, Ehrenreich and Piven1987; Kane Reference Kane1987). Fundamental attribution error refers to the underestimation of the contextual or situational factors that cause poverty and an overestimation of the influence of individuals’ dispositional factors (Heider Reference Heider1958; Ross Reference Ross and Berkowitz1977).
Situational factors are tied to people’s views about the government, whose policies shape the social environment, while fatalistic or individualistic attribution drives the poor to blame themselves for their situation. If individuals attribute their problems to the government, they tend to engage in political activism and direct their grievances toward the government (Weiner et al. Reference Weiner, Osborne and Rudolph2011; Jaime-Castillo Reference Jaime-Castillo2009; Kim et al. Reference Kim, Kim and Lee2023; Sahar Reference Sahar2014; Javeline Reference Javeline2003). Conversely, if individuals attribute their problems to themselves, they may lack the motivation to act, either because they internalize their powerlessness or because they lack justification for targeting the government or other groups (Feagin Reference Feagin1972; Oorschot and Halman Reference Oorschot and Halman2000; Ross Reference Ross and Berkowitz1977; Weiner et al. Reference Weiner, Osborne and Rudolph2011). Yet, in some circumstances, these individuals may still target the government when they believe that the government is morally responsible for addressing their problems.
In Hong Kong, which is known for having one of the highest income inequalities in the world, inequality is also believed to cause grievances among residents and drive their collective action (Shao Reference Shao2019; Toh Reference Toh2019). However, although Hong Kong has witnessed numerous demonstrations since 1997 (Lee and Chan Reference Lee and Chan2018; Ma and Cheng Reference Ma and Cheng2019; Lee Reference Lee2025), major demonstrations were not necessarily directly triggered by economic frustrations or income inequality (Chen et al. Reference Chen, Wu and Lin2023), but rather by political issues (Cai Reference Cai2021; Cheng and Yuen Reference Cheng and Yuen2025). Inequality is not irrelevant to individuals’ political action (Tang and Kwong Reference Tang and Kwong2025), but how people attribute income inequality also affects their propensity for political participation.
Attributing low income in Hong Kong
Law Chi-kwong (Reference Law2021), a former Secretary for Labor and Welfare of the Hong Kong government, acknowledged in 2018 that income inequality in Hong Kong was indisputably among the worst in the world. The Gini coefficient of Hong Kong has remained high over the years, starting from 0.43 in 1971, moving to 0.525 in 2001, and reaching its peak of 0.539 in 2016, and rebounding to 0.47 in 2023. When using income tax data, the Gini coefficient in 2016 was estimated at 0.608 (Piketty and Yang Reference Piketty and Yang2022; Wu and Chou Reference Wu and Chou2021), which is much higher than those reported in South Korea (0.31 in 2023), Japan (0.31 in 2023), Taiwan (0.28 in 2023), and Singapore (0.39 in 2023).
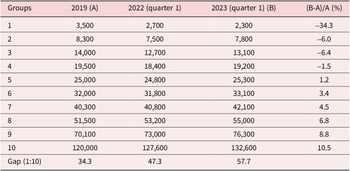
A closer look at the income distribution among Hong Kong households reveals significant inequality. In their 2023 poverty report on Hong Kong, Oxfam, a local non-government agency, reported that after the COVID-19 pandemic, the wealthiest 10 percent of households gained over 57.7 times more than the poorest 10 percent, thus increasing the income gap by 1.68 times compared with the pre-pandemic years (Table 1). Moreover, with the monthly median income reported in 2019 as the baseline, the poorest households earned 34.3 percent less (down to HK2,300 per month), while the richest households earned 10 percent more (i.e., HK132,000) (Oxfam 2023).
Household monthly median income by group in Hong Kong
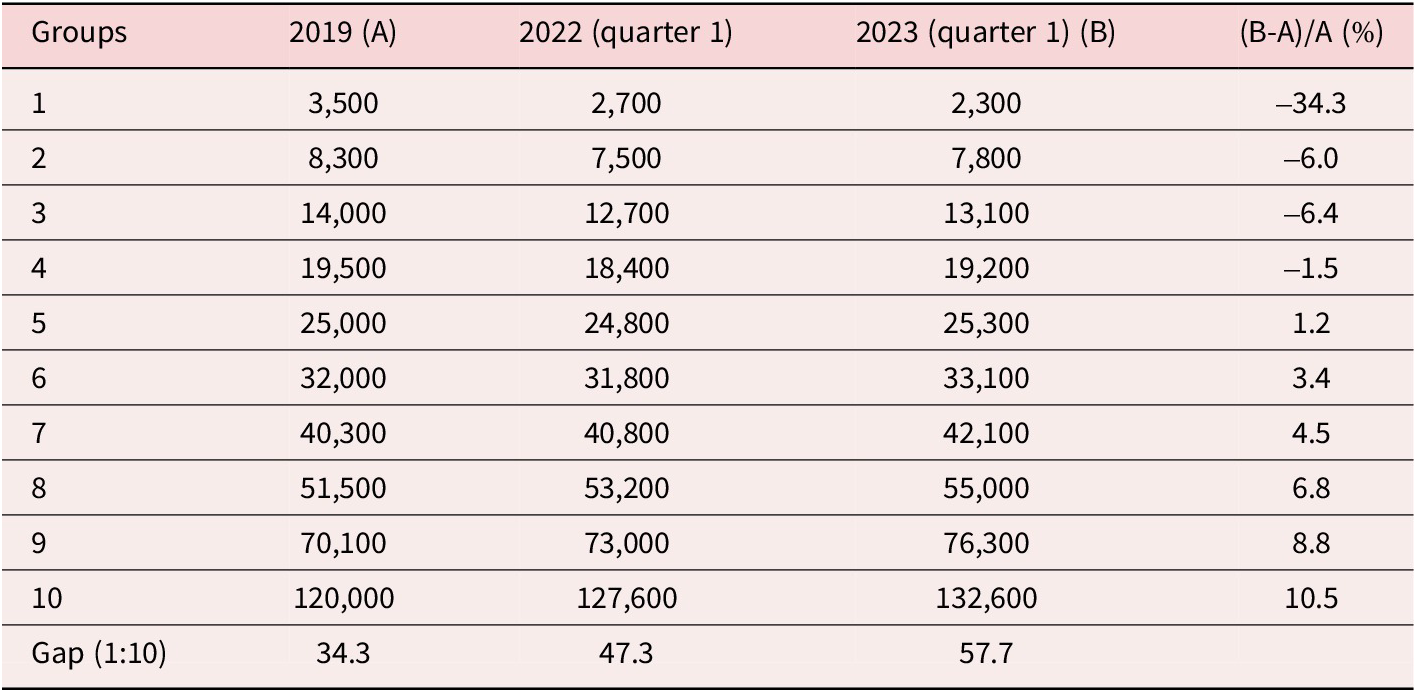
Table 1. Long description
The table consists of five columns: Groups, 2019 (A), 2022 (quarter 1), 2023 (quarter 1) (B), and the percentage change calculated as (B minus A) all over A (%).
* Group 1: 3,500 in 2019; 2,700 in 2022; 2,300 in 2023; change of minus 34.3%.
* Group 2: 8,300 in 2019; 7,500 in 2022; 7,800 in 2023; change of minus 6.0%.
* Group 3: 14,000 in 2019; 12,700 in 2022; 13,100 in 2023; change of minus 6.4%.
* Group 4: 19,500 in 2019; 18,400 in 2022; 19,200 in 2023; change of minus 1.5%.
* Group 5: 25,000 in 2019; 24,800 in 2022; 25,300 in 2023; change of 1.2%.
* Group 6: 32,000 in 2019; 31,800 in 2022; 33,100 in 2023; change of 3.4%.
* Group 7: 40,300 in 2019; 40,800 in 2022; 42,100 in 2023; change of 4.5%.
* Group 8: 51,500 in 2019; 53,200 in 2022; 55,000 in 2023; change of 6.8%.
* Group 9: 70,100 in 2019; 73,000 in 2022; 76,300 in 2023; change of 8.8%.
* Group 10: 120,000 in 2019; 127,600 in 2022; 132,600 in 2023; change of 10.5%.
The final row, Gap (1:10), shows the ratio between the highest and lowest groups: 34.3 in 2019, 47.3 in 2022, and 57.7 in 2023.
Data From: Oxfam 2023.
Apart from the significant income disparity reported by Oxfam, Hong Kong also has a high concentration of ultra-wealthy individuals with a net worth of over US$30 million, despite experiencing the largest year-on-year decline due to slow economic growth in 2022. This concentration exceeds those reported in New York, London, and Los Angeles (Altrata 2023). Due to the lack of comprehensive data on income, capital share, and wealth, and the increasing number of billionaire families in Hong Kong, the wealth and income assessment of the top 0.001 percent may still be underestimated (Piketty and Yang Reference Piketty and Yang2022).
As in other East Asian societies, there are structural factors that contribute to the high inequality in Hong Kong. Such factors include weak organized labor and the absence of societal corporatism, which have led to radical deregulation of the labor market and weak labor protection (Chu and Kong Reference Chu and Kong2024). Yet, structural or policy factors are not necessarily seen as the major cause of inequality or lower income by the people of Hong Kong (Wong et al. Reference Wong, Wan and Kenneth2009). Early studies have identified four perceived causes of poverty in Hong Kong: personal problems, exploitation, fate, and lack of opportunities. Attribution to personal problems has gradually weakened among adolescents compared to their parents during the 2000s (Shek Reference Shek2004). In a 1997 survey of 699 Hong Kong residents, among the 10 specified reasons, “social injustice” (23.2 percent), “laziness and lack of willpower” (22.2 percent), and “educational qualifications” (19.9 percent) emerged as the most important, while “lack of employment opportunities” (2.6 percent) and “lack of children’s support” (1.6 percent) were the least important (Leung Reference Leung1999).
A 2001 survey of 815 people listed 12 reasons for being poor in Hong Kong, and respondents were allowed to choose more than one reason. “The jobs they can find are low-paid jobs” (81.7 percent), “Their skills cannot keep up with social change” (62.2 percent), “The jobs they can find are all temporary jobs” (62 percent), and “Their educational level is low” (57.3 percent) were the most frequently chosen reasons, while “Their IQ is low” (16.2 percent), “Hong Kong society discriminates against them” (22.5 percent), and “They do not have ambition” (28.2 percent) were the least selected (Leung Reference Leung1999).
High income inequality is not conducive to social stability, especially when connected to high unemployment rates, poverty, and resentment arising from corruption (Castells Reference Castells2015). Research based on World Value Survey data reveals that people who are more dissatisfied with their lives and support post-materialist values are more likely to participate in radical actions, such as strikes and boycotts (Cheng et al. Reference Cheng, Chung and Cheng2023).
Recent research on the relationship between the political effect of perceived inequality and political participation in Hong Kong has also yielded varying findings. Hong Kong witnessed a series of social movements, including the Umbrella Movement in 2014 and the Anti-Extradition Bill Movement from 2019 to 2020 (Chung and Pun Reference Chung and Ngai2007; Wong Reference Wong2015; Ma Reference Ma2011; Augustin-Jean and Cheung Reference Augustin-Jean and Cheung2018; Tang and Kwong Reference Tang and Kwong2025). Some scholars have discovered that perceived inequality, unfairness, or unevenness contributes to political participation in, or support for, political movements such as the Umbrella Movement and the Anti-ELAB Movement (Wong Reference Wong2017; Zheng et al., Reference Zheng, Michael, Hsiao and Wong2020; Tang and Kwong Reference Tang and Kwong2025). Others contend that perceived inequality has no effect on political participation (Sing Reference Sing2020; Wu and Chang Reference Wu and Chang2019; Yang and Wu Reference Yang and Wu2024), and still others found that perceived unfairness, rather than perceived mobility, positively affected non-institutional political participation (Chen et al. Reference Chen, Wu and Lin2023; Tang and Kwong Reference Tang and Kwong2025).
The above survey studies significantly enhance the understanding of the relationship between (perceived) inequality and political participation in Hong Kong, but they have several limitations. First, these studies tend to examine the relationship between (perceived) inequality or fairness and political participation, as opposed to the relationship between the attribution of inequality and political participation. Second, the surveys used in these studies have relatively small sample sizes, while other studies are qualitative. Finally, although studies demonstrate that economic grievances and inequality might have set the stage for waves of social movements in Hong Kong (Chung and Pun Reference Chung and Ngai2007; Wong Reference Wong2015; Ma Reference Ma2011; Augustin-Jean and Cheung Reference Augustin-Jean and Cheung2018; Tang and Kwong Reference Tang and Kwong2025; Cheng and Yuen Reference Cheng and Yuen2025), these studies did not systematically examine the political consequences of people’s beliefs in the causes of their low income and the political implications.
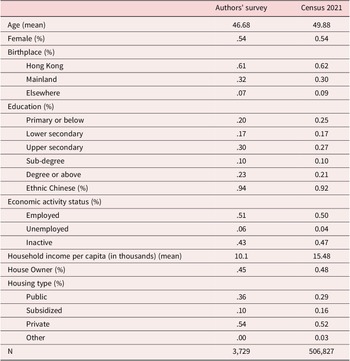
This current study is based on the Hong Kong Political Culture Survey conducted from May to September 2021. A probability sample was drawn from 72 randomly selected District Council Constituency Areas out of the total 452 Constituency Areas in Hong Kong. A team of interviewers was sent to each of the 72 districts, and one out of every 10 passersby in the district was chosen for a 30-minute face-to-face interview. The interviewee had to be 16 or older and had to have lived in that district for at least one year. A total of 3,744 residents were interviewed. We compared our survey with the 2021 Population Census of Hong Kong, and the comparison shows that our sample matches the census very well (see Table A1).
Following previous studies, we divided people’s attribution of low income into situational, personal, and fatalistic factors. The situational factor is “unfair society,” personal attributions include “incompetence” and “not working hard,” and the fatalistic factor is “bad luck.” The importance of each of these factors was then rated as unimportant, somewhat important, or very important.
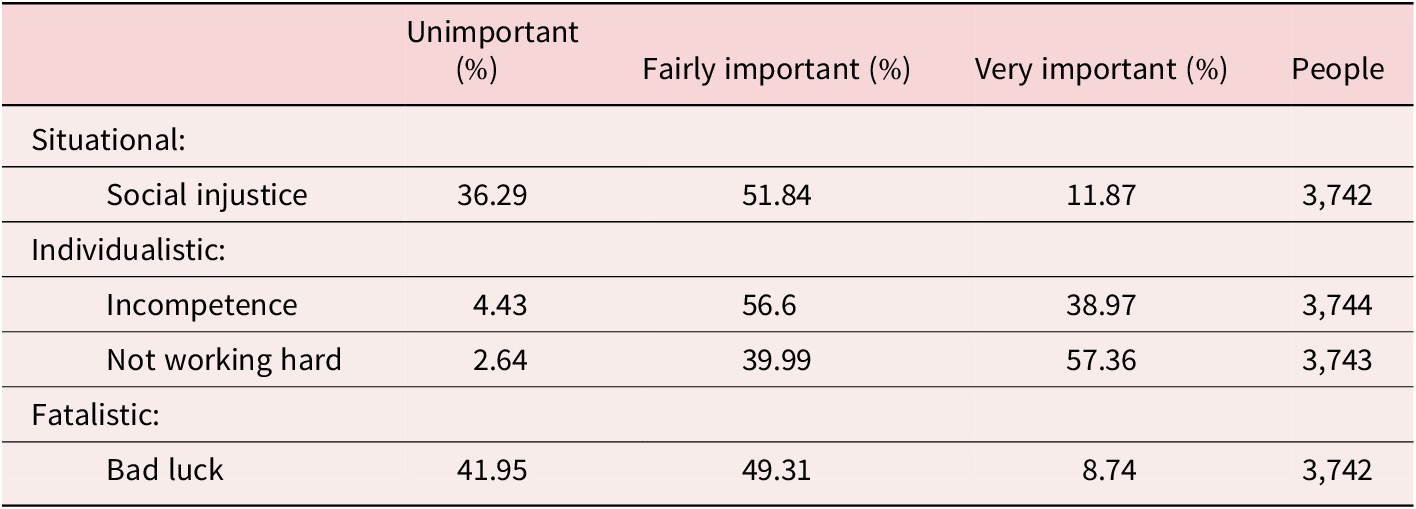
As shown in Table 2, many respondents perceived personal reasons as important. Among the 3,742 respondents, over 36 percent reported that “unfair society” was not important, while 63.7 percent reported that this factor was somewhat important or very important. Nearly 95.6 percent reported “incompetence” as important, while only 4.4 percent reported this factor as unimportant. Similarly, more than 97 percent reported “not working hard” as important, while only 2.6 percent reported this factor as unimportant. Approximately 58 percent reported “bad luck” as important, while nearly 42 percent reported this factor as unimportant.
Attribution of low income in Hong Kong
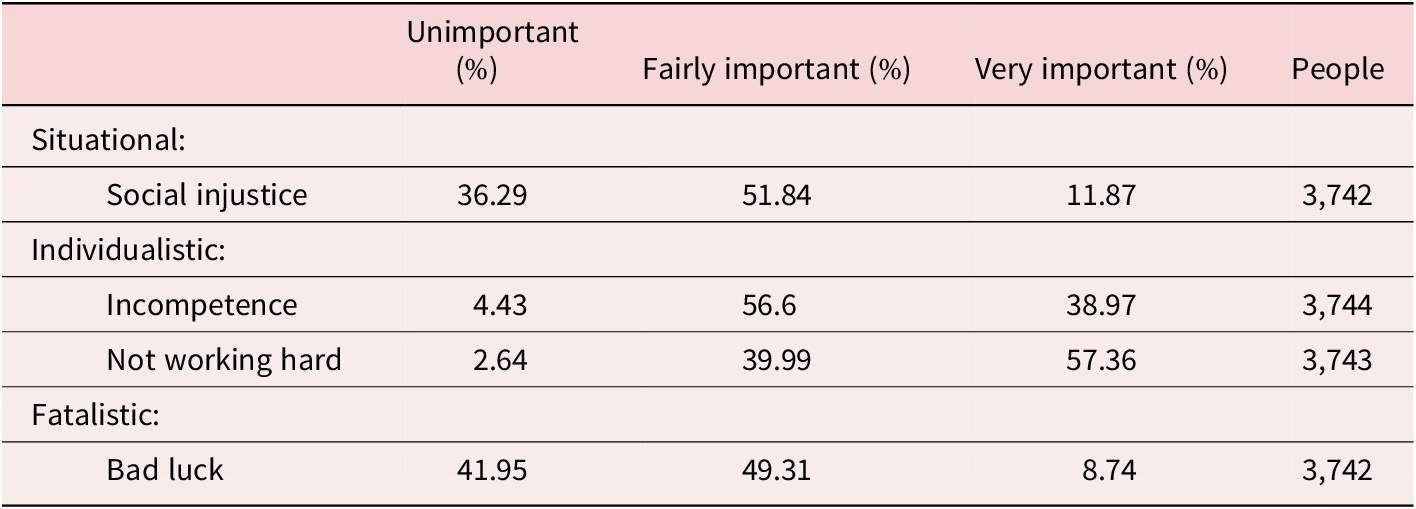
Table 2. Long description
The table presents survey data from the Hong Kong Political Culture Survey 2021, categorized by the importance of different factors in causing low income. The columns are Unimportant percent, Fairly important percent, Very important percent, and the number of People surveyed.
* Situational Attribution: For Social injustice, 36.29 percent rated it unimportant, 51.84 percent fairly important, and 11.87 percent very important, based on 3,742 people.
* Individualistic Attribution: For Incompetence, 4.43 percent rated it unimportant, 56.6 percent fairly important, and 38.97 percent very important, based on 3,744 people. For Not working hard, 2.64 percent rated it unimportant, 39.99 percent fairly important, and 57.36 percent very important, based on 3,743 people.
* Fatalistic Attribution: For Bad luck, 41.95 percent rated it unimportant, 49.31 percent fairly important, and 8.74 percent very important, based on 3,742 people.
A note indicates that respondents could provide more than one answer.
Note: Respondents can have more than one answer.
Data From: Hong Kong Political Culture Survey 2021.
People’s attribution of their low income is likely to affect their political participation. This study, therefore, hypothesizes that those individuals who attribute low income to situational factors are more likely to participate in political actions, including protests and disruptive actions, to influence policymaking. In contrast, those who attribute low income to personal reasons are less interested in these political events.
Empirical Analysis
This section examines whether people’s attribution of low income in Hong Kong affects their intention to participate in collective actions, such as demonstrations and violent actions. The survey includes questions about people’s reactions to their problems. One item reads, “If you are not satisfied with government policies (e.g., social welfare policies, police enforcement, and housing policies) or if some people are unfairly treated by the government, what action will you take?” This question is accompanied by two follow-up questions, “If the government is not responsive to your previous action, what action will you take?” The respondents were asked to choose among 10 political actions, including “participation in peaceful resistance, including demonstrations, signing petitions, and strikes” and “violent action.”
Participation in Peaceful Action
This section first examines the relationship between the attribution of low income and participation in peaceful collective action. The dependent variable in this analysis is a dummy variable that measures whether respondents indicated an intention to participate in peaceful protests. It is coded as 1 if the answer is “yes” and 0 if the answer is “no.”
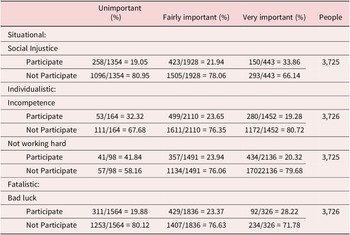
As presented in Table 3, about 22 percent of the respondents indicated an intention to participate in peaceful protests, with noticeable variation across categories. In the “Social Injustice” category, 33.9 percent of those who perceived this factor as very important intended to participate, compared to only 19.1 percent among those who rated it as unimportant. A similar pattern is observed in the “Bad Luck” category, with the percentages being 28.2 percent and 19.9 percent, respectively.
Percentage of respondents showing intention to participate in peaceful across groups in Hong Kong (column percentage)
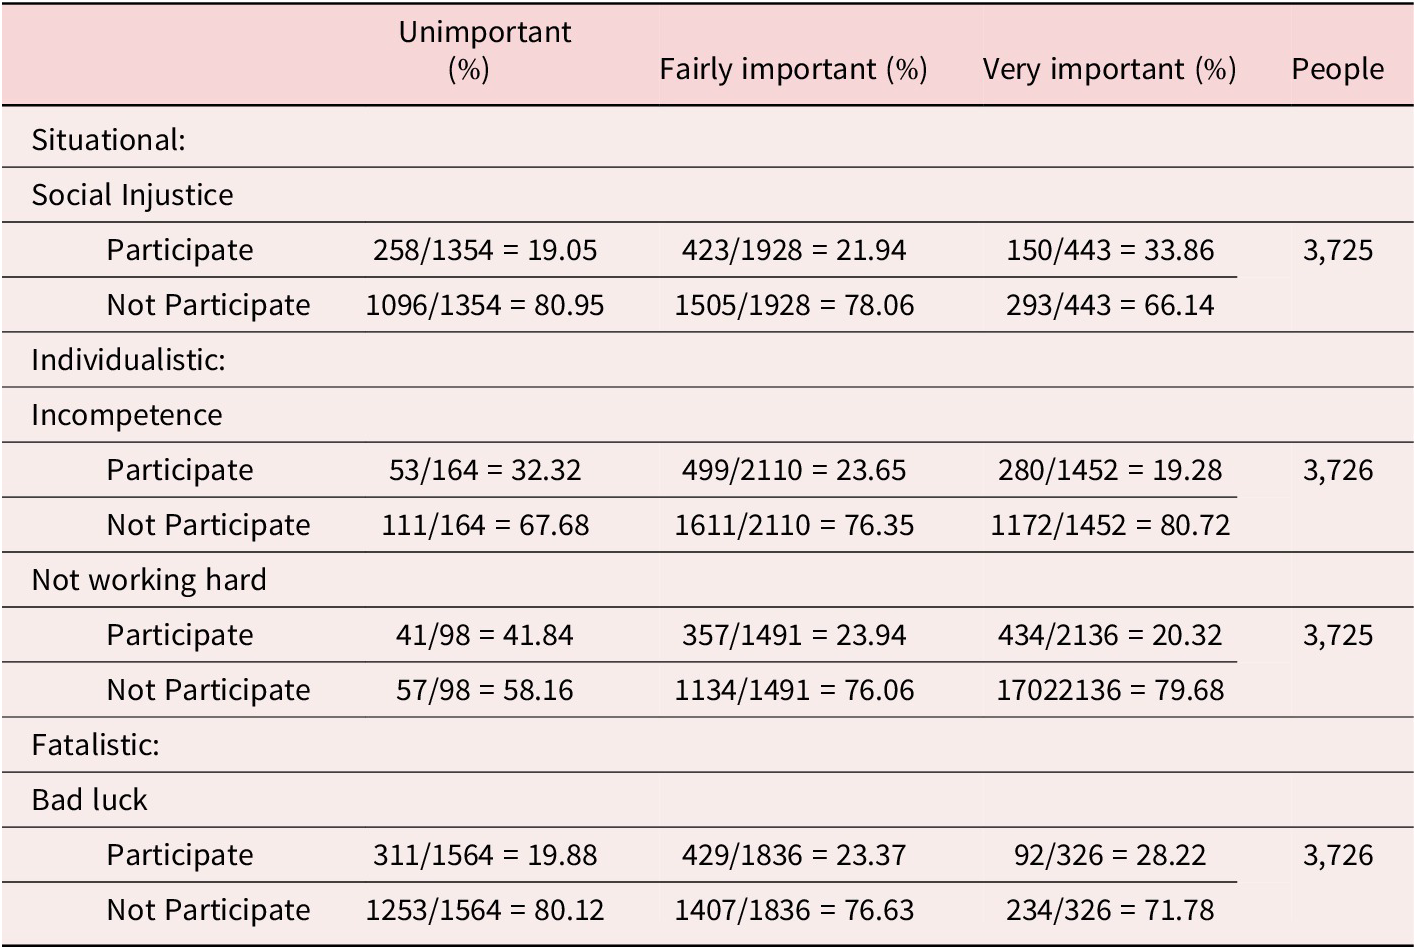
Table 3. Long description
The table is organized into three main categories of perceived causes of poverty.
1. Situational: Social Injustice.
Among those who view this as Unimportant, 19.05 percent participate and 80.95 percent do not.
Among those who view this as Fairly important, 21.94 percent participate and 78.06 percent do not.
Among those who view this as Very important, 33.86 percent participate and 66.14 percent do not.
Total people: 3,725.
2. Individualistic:
Sub-factor Incompetence:
Unimportant: 32.32 percent participate, 67.68 percent do not.
Fairly important: 23.65 percent participate, 76.35 percent do not.
Very important: 19.28 percent participate, 80.72 percent do not.
Total people: 3,726.
Sub-factor Not working hard:
Unimportant: 41.84 percent participate, 58.16 percent do not.
Fairly important: 23.94 percent participate, 76.06 percent do not.
Very important: 20.32 percent participate, 79.68 percent do not.
Total people: 3,725.
3. Fatalistic: Bad luck.
Unimportant: 19.88 percent participate, 80.12 percent do not.
Fairly important: 23.37 percent participate, 76.63 percent do not.
Very important: 28.22 percent participate, 71.78 percent do not.
Total people: 3,726.
Note: Respondents can have more than one answer. Source: Hong Kong Political Culture Survey 2021.
In contrast, when respondents attributed low income to individualistic factors, the intention to participate in peaceful protests decreased. In the “Incompetence” category, 32.3 percent of those viewing incompetence as unimportant expressed a willingness to participate in protests, compared to only 19.3 percent of those who considered it very important. A similar pattern is also found in the “Not Working Hard” category, where participation rates were 41.8 percent and 20.3 percent, respectively.
In our analysis, the explanatory variables include individuals’ four types of attribution of low income, namely, incompetence, not working hard, bad luck, and social injustice. Six control variables were also included in the analysis: household income, age, education, gender, marital status, and place of birth.
To examine the generational difference in income inequality attribution, the respondents were divided into four age groups: 16–24 years, 25–44 years, 45–64 years, and 65 years or older (i.e., the comparison group). Education was divided into primary or below (the comparison group), lower secondary, upper secondary, sub-degree, and degree or above. Gender was treated as a binary variable coded as 0 for males and 1 for females. Marital status was treated as a dummy variable, with married respondents coded as 1. Household income (in 10,000) was treated as a continuous variable that measures the respondents’ socioeconomic status or social class. Place of birth, a categorical variable, was divided into Hong Kong, Mainland China, and elsewhere.
As presented in Figure 1, the results show that different modes of attributing low income are associated to varying degrees with individuals’ intentions to participate in collective action. Specifically, those who attribute low income to incompetence or not working hard are less likely to participate in collective action, while those who attribute low income to social injustice or bad luck are more likely to participate. A possible reason for this finding is that “bad luck” is not entirely caused by individuals’ attributes or abilities but is rather shaped by their environment, which may be changed through action.
Coefficient plots from multilevel logistic regression predicting participation in protest.

Figure 1. Long description
The plot features a horizontal x-axis ranging from negative 2 to 2, with a vertical red reference line at 0. Black dots represent point estimates, and horizontal blue lines represent confidence intervals.
From top to bottom, the variables and their positions relative to the zero line are as follows.
* Incompetence: Negative estimate around negative 0.3.
* Not working hard: Negative estimate around negative 0.2.
* Bad Luck: Positive estimate around 0.2.
* Social Injustice: Positive estimate around 0.2.
* Age Group 16 to 24: Strong positive estimate around 1.6.
* Age Group 25 to 44: Positive estimate around 1.1.
* Age Group 45 to 64: Positive estimate around 0.5.
* Education Lower secondary: Negative estimate around negative 0.3.
* Education Upper secondary: Near zero estimate.
* Education Sub-degree: Positive estimate around 0.3.
* Education Degree or above: Positive estimate around 0.1.
* Gender Female: Negative estimate around negative 0.2.
* Marital status see m 31: Negative estimate around negative 0.4.
* Household income: Centered at 0.
* Place of Birth Mainland: Strong negative estimate around negative 0.8.
* Place of Birth Elsewhere: Negative estimate around negative 0.6.
Compared to the group aged 65 years or older, other age groups (16–24, 25–44, and 45–64 years) showed a greater tendency to participate in collective action. This result is unsurprising, considering that older individuals tend to be more risk-averse. Specifically, individuals aged 16–24 demonstrate the strongest intention to participate in collective action. The log-odds of participation increase by 1.56, 1.10, and 0.46 units for the 16–24, 25–44, and 45–64 age groups, respectively, compared to those aged 65 years or older. These trends indicate that the likelihood of participating in collective action decreases as a person ages.
Our survey did not include questions about the intergenerational transmission effect on political participation or parental influence on their children’s participation. For example, in the United States, the adult children of war resisters closely resembled their parents’ political views and activism (Rymond-Richmond Reference Rymond-Richmond2023). In Hong Kong, there is also a possibility that people aged 45–64 may influence younger generations (e.g., 16–24). Additionally, some individuals in the 25–44 and 45–64 age groups may have previously participated in social movements (Lee et al. Reference Lee, Lee and Sing2019, 13), making them more likely to engage in collective action in subsequent stages, especially when they feel threatened regarding their lifestyle or safety (Cheng and Yuen Reference Cheng and Yuen2025, 131).
Education does not appear to be associated with respondents’ propensity to participate in protests. Females and married individuals were also less likely to participate, given their heightened awareness of the risks involved. Cheng and Yuen (Reference Cheng and Yuen2025, 132) found that being female or having children did not affect Hong Kong people’s participation in the Anti-Extradition Movement. Other factors, such as perceived threats or community ties, could also influence participation (Cheng and Yuen Reference Cheng and Yuen2025; Zamponi Reference Zamponi2023).
Place of birth is negatively associated with individuals’ intention to participate in collective action. Compared with those born in Hong Kong, individuals born in Mainland China and elsewhere were less likely to participate, which may imply that the latter tend to accept the authority of the government.
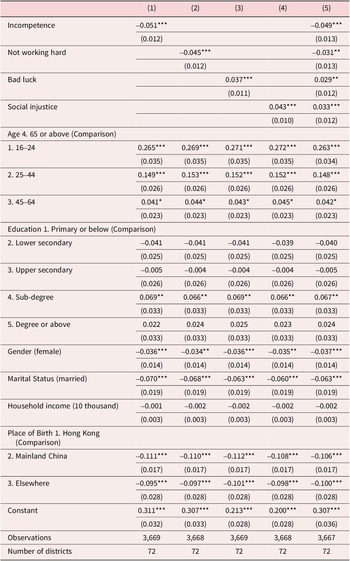
As a robustness check, we conducted an analysis using the number of times respondents indicated they would participate in collective action. The rationale behind using the number of actions is that increased political actions reflect a higher level of participation. The results of the multilevel linear regressions remain consistent, with the coefficient for the sub-degree level of education becoming statistically significant. Attributing low income to “incompetence” and “not working hard” is negatively associated with the intention to protest, while attributions of “bad luck” and “social injustice” are positively associated with the intention to choose protest (see Table A2).
Participation in Violent Action
This section examines whether the attribution of low income or inequality affects individuals’ propensity to participate in violent action. It is assumed that if individuals believe that inequality or low income is due to personal factors, they are less likely to engage in violent actions. As discussed earlier, those who attribute low income to individualistic factors tend to believe that individuals are responsible for their low income. In contrast, individuals may be more inclined to participate in protests or even violent actions when they attribute their low income or inequality to external societal or systemic factors (Napier et al. Reference Napier, Mandisodza, Andersen and Jost2006).
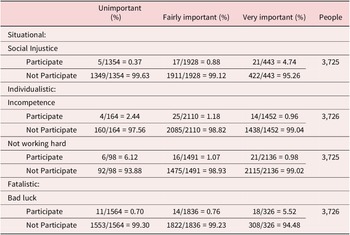
Violence is illegal in most societies because it directly harms people or damages property. Thus, violent actions carry severe risks and are unlikely to become an option for most people. As shown in Table 4, there is a consistently low intention to engage in violent actions across all groups, regardless of their attribution. This pattern corresponds with earlier studies suggesting a traditional inclination in Hong Kong towards moderate protests (Ku Reference Ku2007).
Percentage of respondents showing intention to participate in violent action across groups in Hong Kong (column percentage)
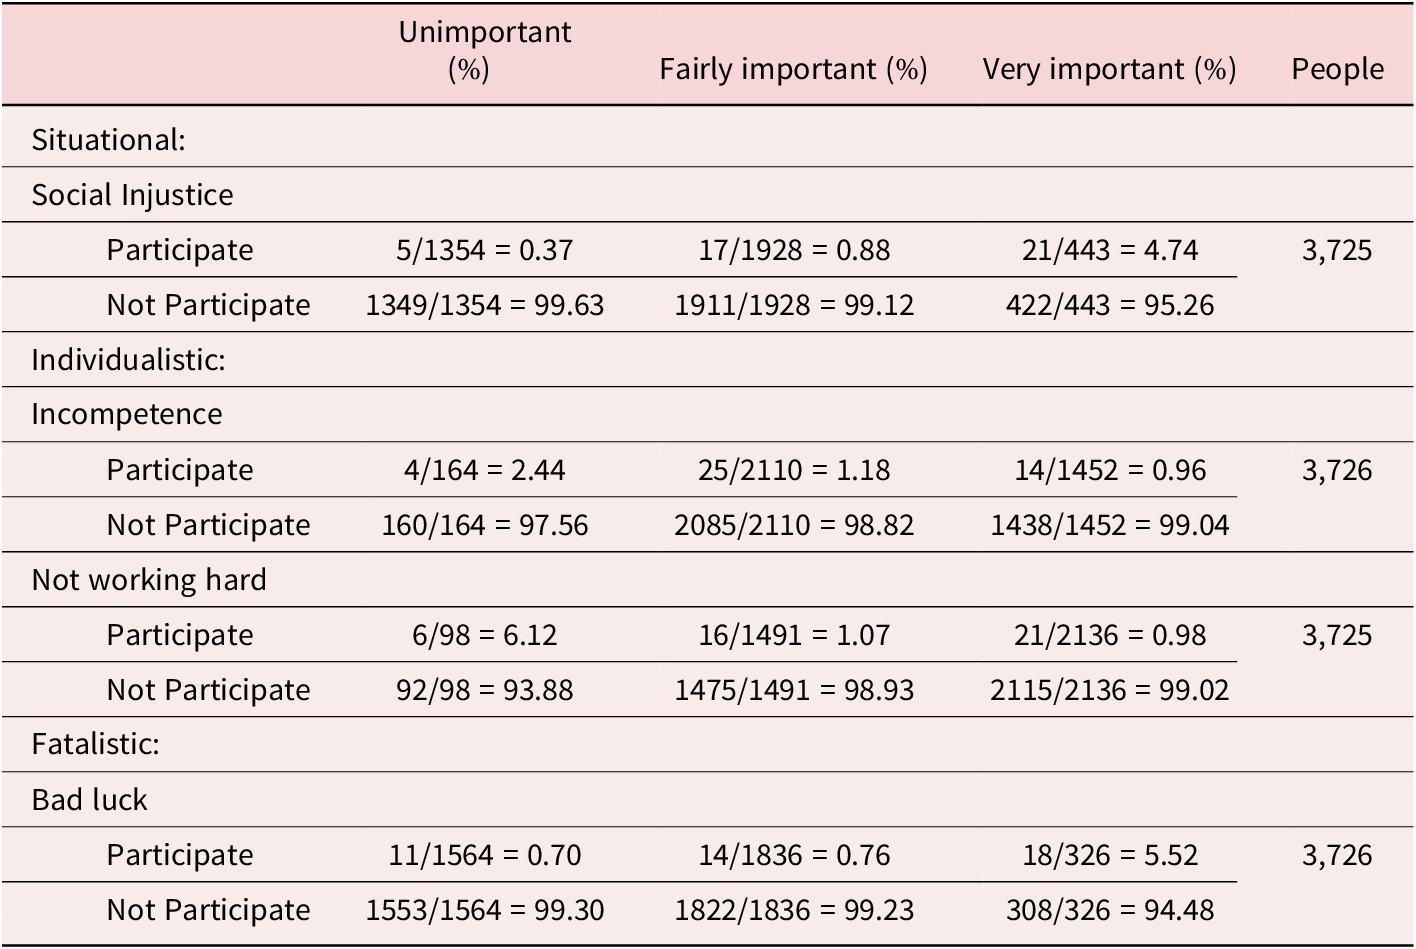
Table 4. Long description
The table is divided into three main sections based on perceived causes of poverty or status.
1. Situational: Social Injustice.
For those who find it Unimportant, 0.37 percent 5 out of 1354 participate.
For Fairly important, 0.88 percent 17 out of 1928 participate.
For Very important, 4.74 percent 21 out of 443 participate.
Total people: 3,725.
2. Individualistic:
Incompetence:
For Unimportant, 2.44 percent 4 out of 164 participate.
For Fairly important, 1.18 percent 25 out of 2110 participate.
For Very important, 0.96 percent 14 out of 1452 participate.
Total people: 3,726.
Not working hard:
For Unimportant, 6.12 percent 6 out of 98 participate.
For Fairly important, 1.07 percent 16 out of 1491 participate.
For Very important, 0.98 percent 21 out of 2136 participate.
Total people: 3,725.
3. Fatalistic: Bad luck.
For Unimportant, 0.70 percent 11 out of 1564 participate.
For Fairly important, 0.76 percent 14 out of 1836 participate.
For Very important, 5.52 percent 18 out of 326 participate.
Total people: 3,726.
Data is sourced from the Hong Kong Political Culture Survey 2021. Note that respondents can have more than one answer.
Note: Respondents can have more than one answer.
Data From: Hong Kong Political Culture Survey 2021.
Despite the small proportion of individuals who reported participating in violent actions, there is still variation across groups (see Table 4). In the “Social Injustice” category, the participation rate is 4.74 percent for those who viewed this factor as very important, compared to just 0.37 percent among those who considered it unimportant. A similar pattern is observed in the “Bad Luck” category, where the percentages for the two groups are 5.52 percent and 0.7 percent, respectively.
In contrast, when individuals attributed low income to individualistic factors, they were less likely to participate in violent actions. In the “incompetence” category, the percentages for those who viewed this factor as unimportant and those who viewed it as very important are 2.44 and 0.96, respectively. Similarly, in the “not working hard” category, the two percentages are 6.12 and 0.98, respectively.
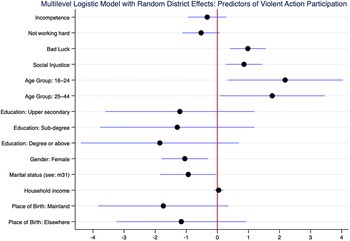
Given the small number of people who reported participating in violent actions, we conducted a multilevel logistic regression to examine the relationship between the attribution of low income and participation in violent actions. Figure 2 presents the coefficient plots predicting participation in violent actions. As discussed above (Table 4), those who attribute low income to “social injustice” or “bad luck” are more likely to participate in violent action, whereas those who attribute low income to “not working hard” are less likely to do so.
Coefficient plots from multilevel logistic regression predicting participation in violent action.
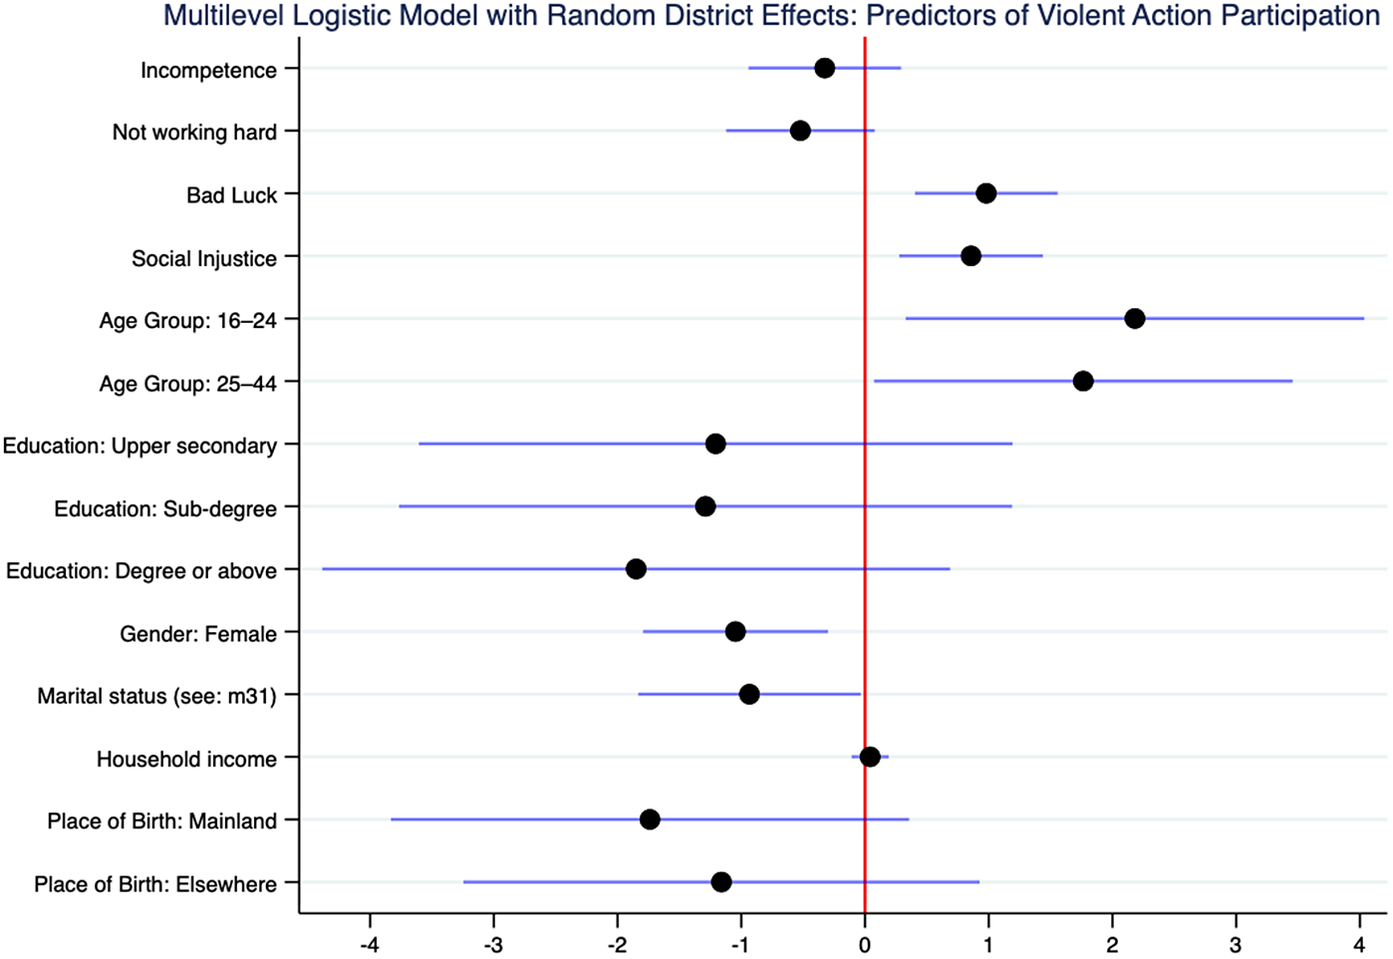
Figure 2. Long description
The X axis represents the coefficient scale from negative 4 to positive 4. A vertical red line marks the zero point. Predictors are listed on the Y axis from top to bottom.
* Incompetence and Not working hard show negative coefficients with confidence intervals crossing or near zero.
* Bad Luck and Social Injustice show positive coefficients entirely to the right of the zero line.
* Age Group 16 to 24 and Age Group 25 to 44 show the strongest positive coefficients with wide confidence intervals.
* Education levels including Upper secondary, Sub-degree, and Degree or above all show negative coefficients with intervals crossing zero.
* Gender Female and Marital status see m 3 1 show negative coefficients.
* Household income is centered almost exactly on the zero line.
* Place of Birth Mainland and Place of Birth Elsewhere show negative coefficients with wide confidence intervals crossing the zero line.
Younger groups (i.e., 16–24, 25–44) are more likely to participate in violent action compared to the group aged 45–64. Females and married individuals were less likely to participate in violent action, probably due to their perception of risk or their higher family commitments, as discussed above. Education level does not seem to be associated with people’s propensity to participate in violent action, and being born in Chinese mainland is weakly and negatively associated with individuals’ propensity to participate in violent actions compared to those born in Hong Kong.
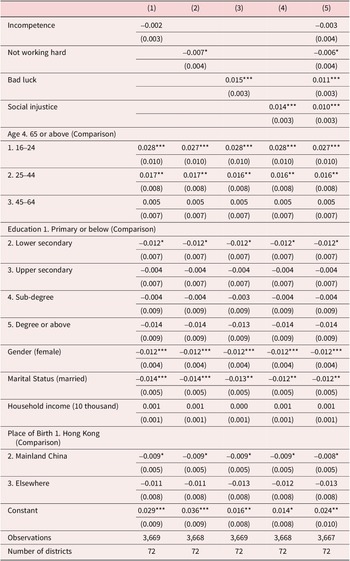
As a robust check, we re-coded the dependent variable as the number of violent actions the respondents would take. The rationale behind using the number of actions is that more political actions indicate a higher level of participation. The results of multilevel linear regressions remain consistent. Attribution to “incompetence” and “not working hard” is negatively associated with the intention to participate in violent action, whereas attribution to “bad luck” and “social injustice” is positively associated with the intention to choose violent action (Table A3).
Additional Analyses and Discussion
The above analyses suggest that people’s attribution affects their propensity to participate in both peaceful and violent collective actions. Hong Kong witnessed a series of large-scale social movements from 1997 to 2019. Existing research suggests that people participated in these movements because of their grievances associated with high (perceived) inequality and lack of opportunities for upward social mobility (Shao Reference Shao2019; Toh Reference Toh2019; Stryson Reference Stryson2023; Chen et al. Reference Chen, Wu and Lin2023; Tang and Kwong Reference Tang and Kwong2025).
Our survey includes questions about individuals’ satisfaction with government policies and performance, covering areas such as property prices, employment opportunities, anti-epidemic policies, social welfare, public healthcare services, the environment, educational opportunities, and gender equality. These governance aspects were evaluated on four levels (highly satisfied, satisfied, dissatisfied, and highly dissatisfied). We combined the responses to these issues to create a factor variable for government satisfaction, which we included as an independent variable.
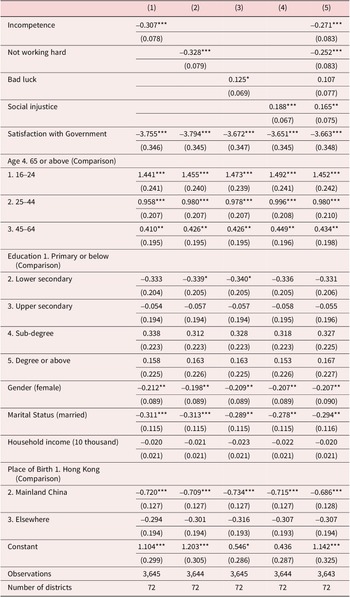
The regression analysis shows that satisfaction with the government performance is correlated with people’s intention to participate in protests (see Table A4). In the full model, attributions to “incompetence” and “not working hard” are negatively associated with individuals’ intention to participate in protests, whereas attribution to “social injustice” are positively associated with their propensity to participate. Overall, satisfaction with the government is generally negatively correlated with people’s intention to engage in protests, while attribution to “bad luck” is no longer statistically significant. In other words, those who were dissatisfied with government performance or felt deprived were also more likely to participate in collective action.
It is important to note that individuals’ participation in collective action is not always shaped by their subjective intentions, as intervening factors can either facilitate or hinder participation in collective action. Participation is discouraged when people lack a sense of efficacy, and the opposite is also true. Our survey includes questions designed to measure individuals’ sense of efficacy. One question asks, “I can influence the development of our society as long as we frequently voice our opinions,” while another states, “Ordinary citizens can influence government decisions.” Respondents can choose from four possible answers: strongly agree, agree, disagree, and strongly disagree. We combined the responses to these two questions to create a factor variable for efficacy, which we included as an independent variable.
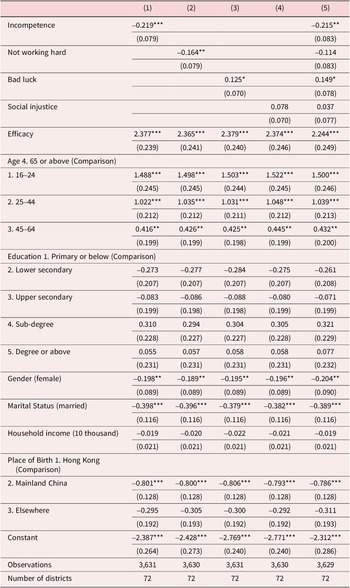
The regression analysis indicates that efficacy is associated with people’s intention to participate in protests (see Table A5). In the full model, attribution to “incompetence” is negatively associated with individuals’ intention to participate, whereas attribution to “bad luck” is positively associated with participation. It is found that efficacy is positively associated with intentions to participate. This suggests that when individuals lack confidence in their ability to effect change, they are less likely to engage in collective action without external mobilization.
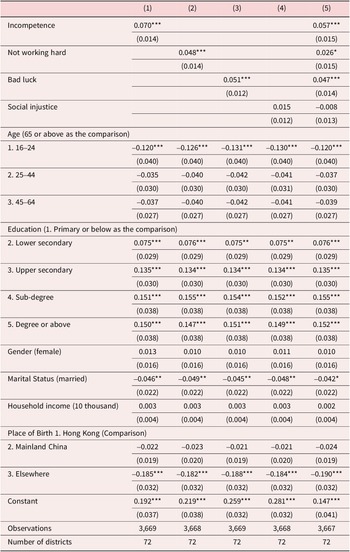
It is also important to note that this study examines the relationship between inequality attribution and people’s participation in non-institutionalized collective actions, rather than institutionalized actions like voting. The dynamics of participation in these two different types of actions can vary. Our survey also includes a question regarding people’s intention to vote, and we conducted an analysis using voting intention as the dependent variable (see Table A6). The results show that individuals who attribute income inequality to “incompetence,” “not working hard,” or “bad luck” are more likely to participate in voting. Attributions of “social injustice” is not significantly associated with voting participation. A possible explanation is that individuals attributing inequality to “incompetence” or “bad luck” may still expect the government to provide assistance.
Conclusion
High inequality is not conducive to social stability in democracies and nondemocracies (Przeworski et al. Reference Przeworski, Cheibub, Neto and Alvarez1996). Inequality tends to cause grievances among the poor by eroding their living standards and their trust in the government (Schoene and Allaway Reference Schoene and Allaway2019). Lasting inequality or life dissatisfaction creates pent-up grievances that turn the aggrieved into participants in collective action when opportunities arise (Fung Reference Fung2022). However, the relationship between inequality and political action is not always straightforward or significant (Balme and Chabanet Reference Balme and Chabanet2008); blame attribution can be an intervening variable that affects this relationship.
This article shows that residents’ attribution of low income affects their propensity to participate in both peaceful and violent collective action. Those who attribute low income to societal reasons are more likely to participate in collective action, while those who attribute low income to personal reasons are less likely to participate. These findings contribute to the understanding of the effect of inequality on society. If official discourses blaming individuals for their low income gain hegemony, then inequality may not threaten social stability because people may blame themselves or become fatalistic (Feagin Reference Feagin1972; Oorschot and Halman Reference Oorschot and Halman2000). Moreover, the poor generally lack the necessary resources and confidence, and without external support or mobilization, they tend to accept their situation. They may also rationalize their situation by accepting the rules imposed by powerful groups to avoid their subjective sense of powerlessness (Gaventa Reference Gaventa1980). If the poor lack efficacy, they are also less likely to act.
However, people’s blame attribution is not fixed, and it may change. If many people are facing poverty, they may attribute their economic plight to the government instead of individualistic reasons. In these circumstances, individuals may be motivated to participate in collective action targeting the government. This is particularly true when external mobilization efforts are available. When a deteriorating economy threatens people’s livelihoods and when inequality is framed in a way that the government should be held accountable, mass mobilization becomes possible. In Hong Kong, some movement participants staged actions because of their beliefs in the causes of their problems (Wong et al. Reference Wong, Zheng and Wan2024; Lee Reference Lee, Lee and Sing2019). They believed that government policies in Hong Kong favored business elites at the expense of the average people (Goodstadt Reference Goodstadt2000; Fong Reference Fong2014).
The government can always attempt to shape people’s blame attribution by achieving discourse hegemony and making individuals blame themselves. Yet, a more fundamental solution to income inequality than shaping people’s blame attribution lies in implementing full employment, tax policies, and an improved welfare system. Income inequality in Hong Kong has been reduced with the help of government subsidies and policy interventions. For example, the Hong Kong Census Department reported that the Gini coefficient dropped to 0.397 in 2021 after the government’s one-off relief measures and post-tax and post-social transfer, and this coefficient remained at the same level in 2023. However, the Hong Kong government has a long way to go in addressing inequality due to deep-rooted structural causes and its limited financial resources.
Funding
This project was supported by a General Research Fund (Number: 16601820) of the Research Grants Council of the Hong Kong government.
Competing interests
The authors declare none.
Appendix
Comparison of socio-economic distributions between the survey and the Hong Kong 2021 Population Census (mean or proportion)
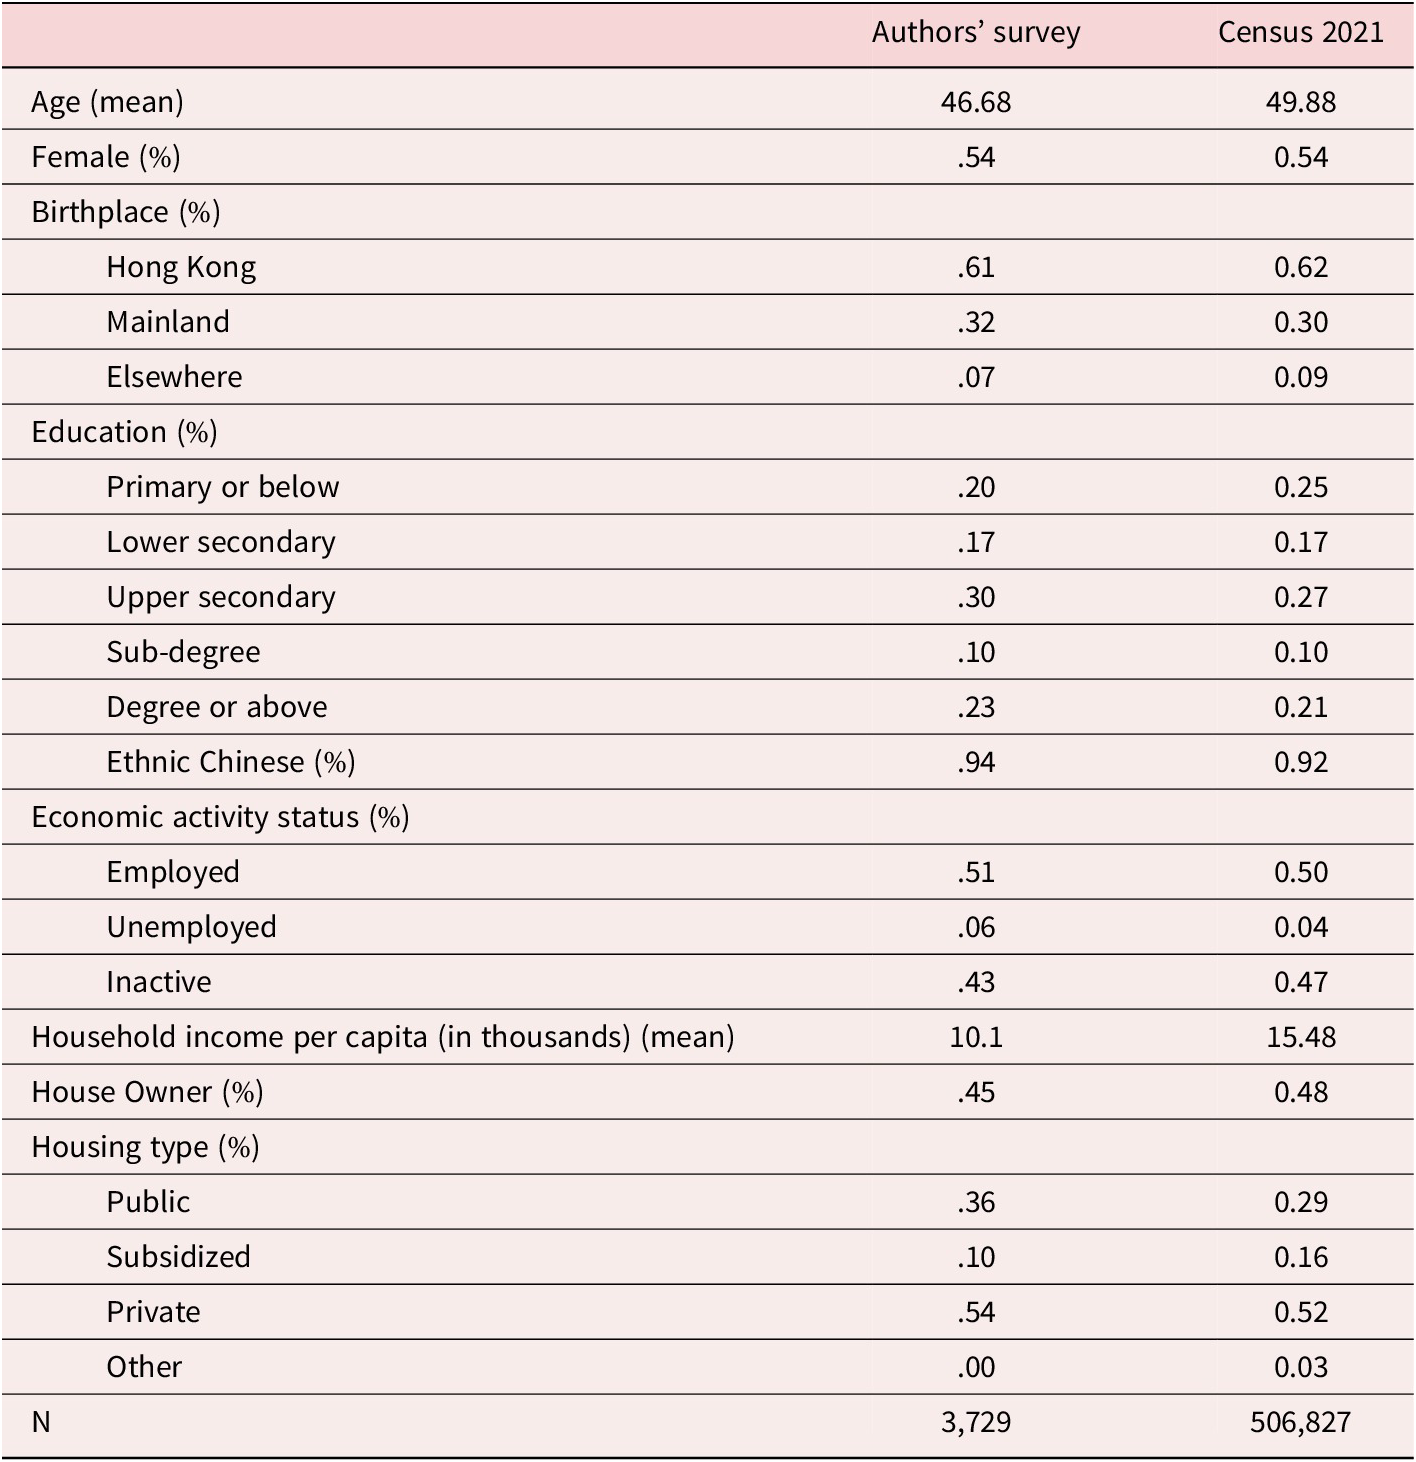
Table A1. Long description
The table compares data across three columns: Variable, Authors’ survey, and Census 2021.
* Age mean: 46.68 in survey versus 49.88 in Census.
* Female proportion: .54 in survey versus 0.54 in Census.
* Birthplace proportion: Hong Kong .61 versus 0.62; Mainland .32 versus 0.30; Elsewhere .07 versus 0.09.
* Education proportion: Primary or below .20 versus 0.25; Lower secondary .17 versus 0.17; Upper secondary .30 versus 0.27; Sub-degree .10 versus 0.10; Degree or above .23 versus 0.21.
* Ethnic Chinese proportion: .94 in survey versus 0.92 in Census.
* Economic activity status proportion: Employed .51 versus 0.50; Unemployed .06 versus 0.04; Inactive .43 versus 0.47.
* Household income per capita mean in thousands: 10.1 in survey versus 15.48 in Census.
* House Owner proportion: .45 in survey versus 0.48 in Census.
* Housing type proportion: Public .36 versus 0.29; Subsidized .10 versus 0.16; Private .54 versus 0.52; Other .00 versus 0.03.
* Sample size N: 3,729 in survey versus 506,827 in Census.
Note: 15 cases were dropped from the 2021 survey because of missing values in some variables (income, house ownership, education, and economic activity status).
Multilevel linear regression for attributions and intention to participate in collective action with random district effect (peaceful protest coded as continuous [0, 1, 2, 3])
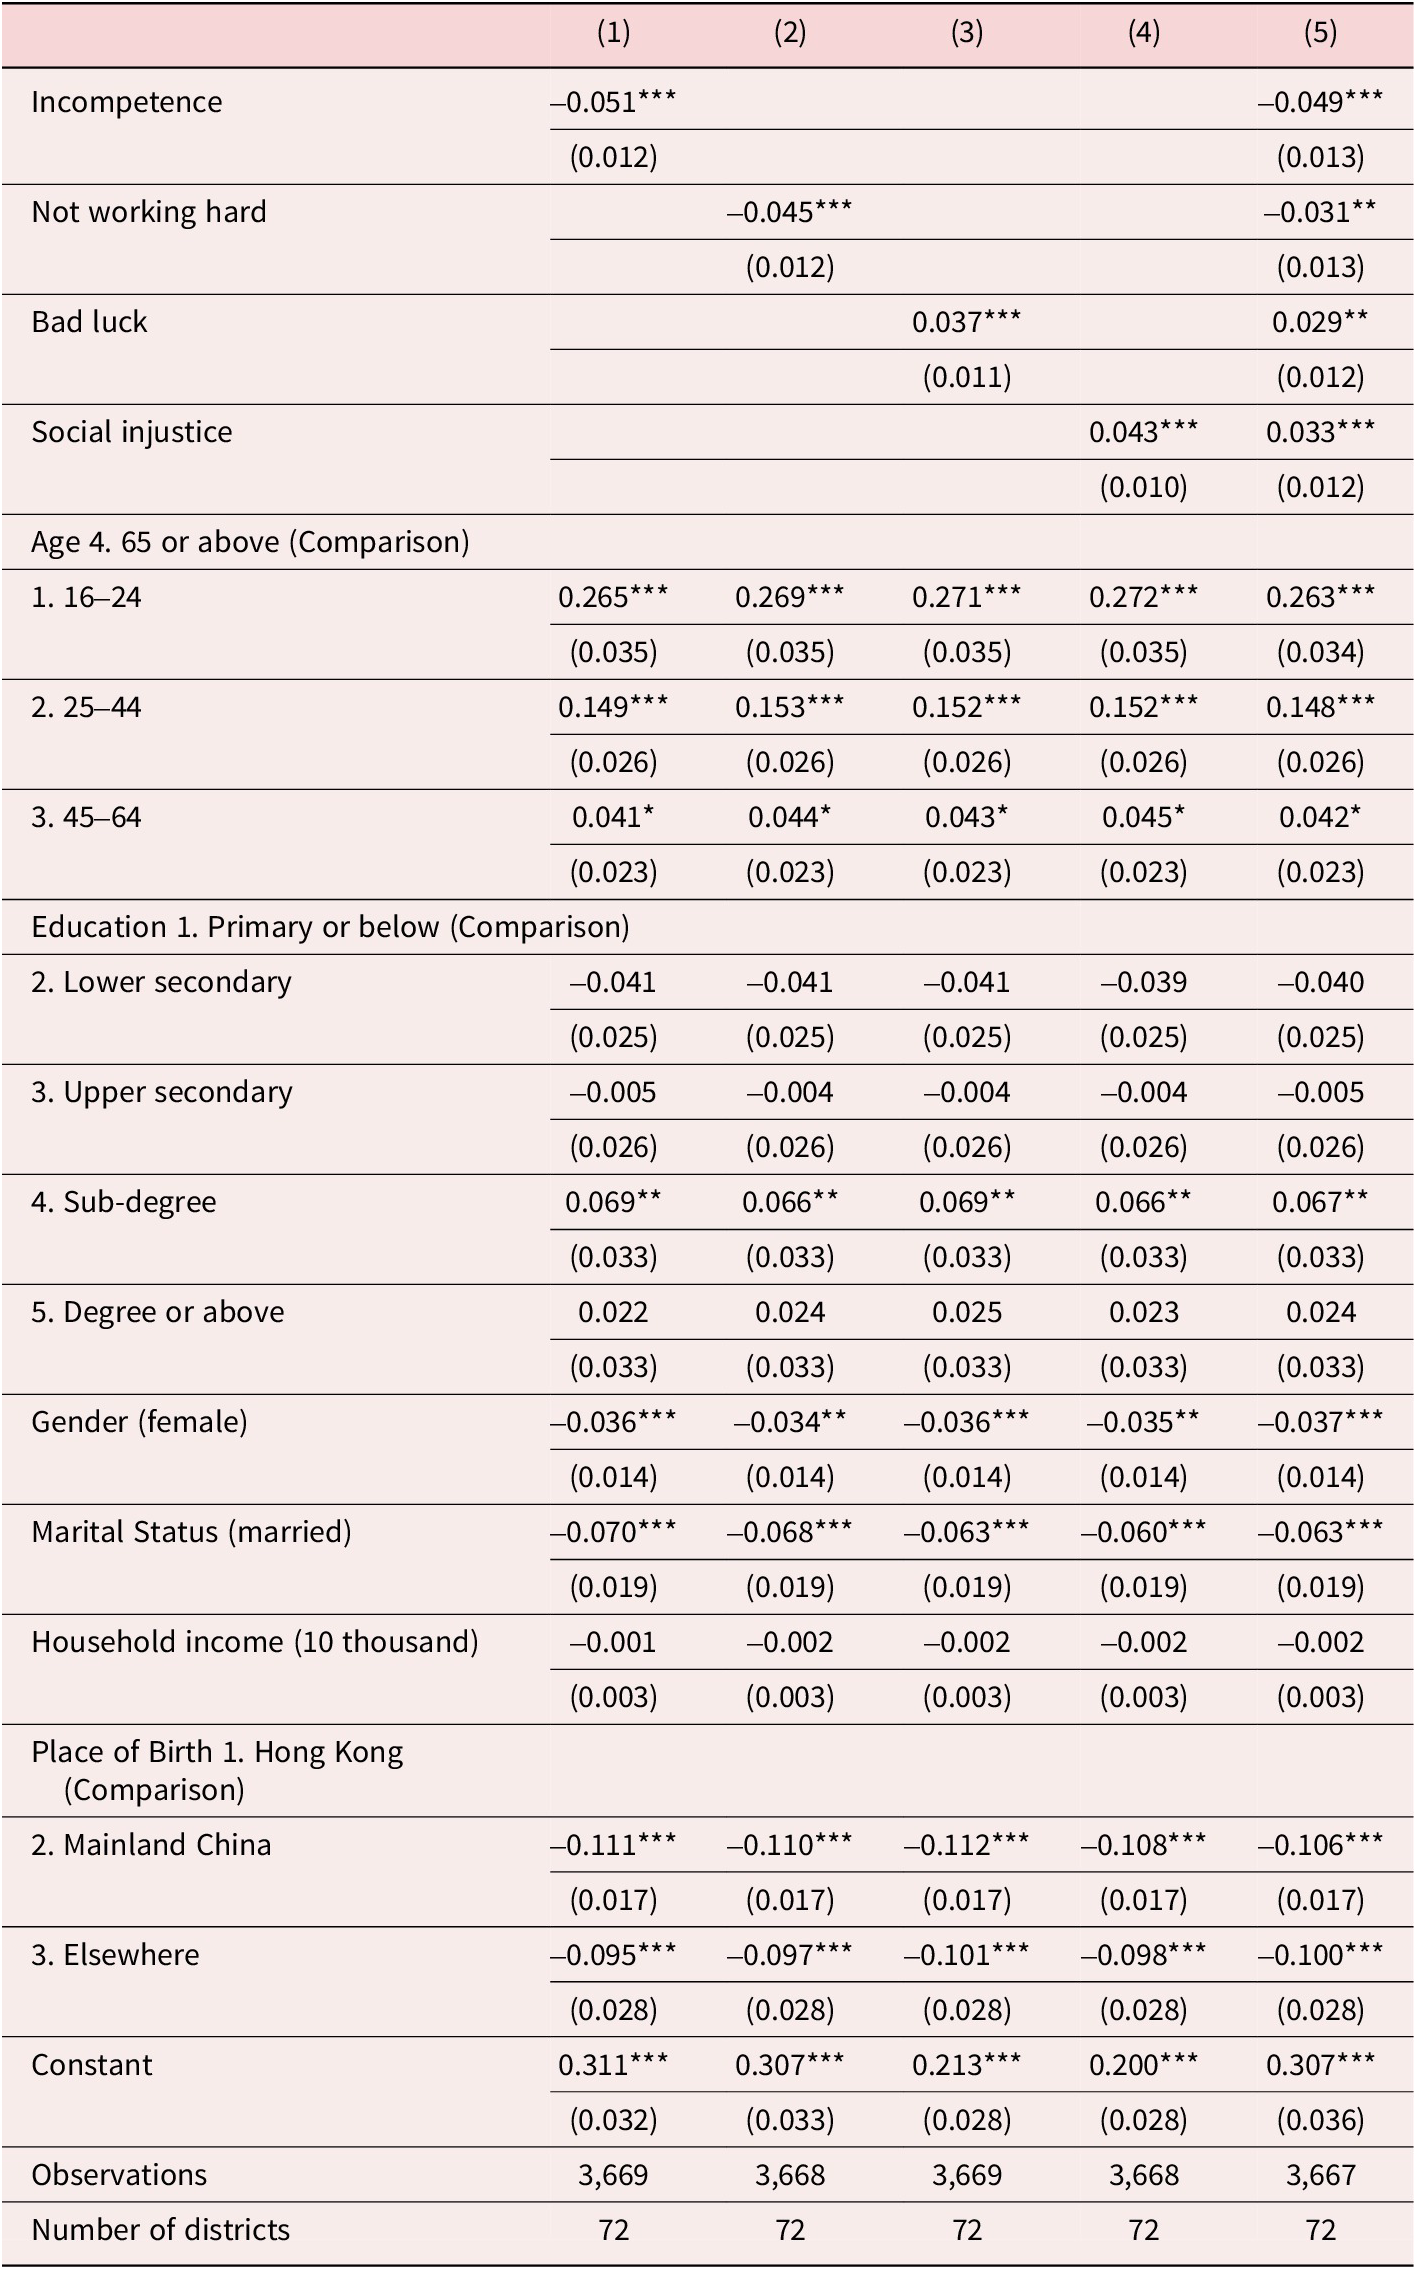
Table A2. Long description
The table presents coefficients and standard errors in parentheses for five regression models.
Independent Variables and Coefficients:
* Incompetence: -0.051 in Model 1 and -0.049 in Model 5, both significant at p < 0.01.
* Not working hard: -0.045 in Model 2 and -0.031 in Model 5, both significant at p < 0.01 and p < 0.05 respectively.
* Bad luck: 0.037 in Model 3 and 0.029 in Model 5, both significant at p < 0.01 and p < 0.05 respectively.
* Social injustice: 0.043 in Model 4 and 0.033 in Model 5, both significant at p < 0.01.
Demographic Controls (consistent across models):
* Age: Compared to 65 or above, the 16 to 24 group shows the strongest positive correlation (approximately 0.27, p < 0.01), followed by 25 to 44 (approximately 0.15, p < 0.01), and 45 to 64 (approximately 0.04, p < 0.1).
* Education: Compared to Primary or below, only Sub-degree shows a significant positive correlation (approximately 0.067, p < 0.05).
* Gender (female): Negative correlation (approximately -0.035, p < 0.05 or p < 0.01).
* Marital Status (married): Negative correlation (approximately -0.065, p < 0.01).
* Place of Birth: Compared to Hong Kong, birth in Mainland China (approximately -0.11, p < 0.01) or Elsewhere (approximately -0.10, p < 0.01) shows negative correlations.
Summary Statistics:
* Constant: Ranges from 0.200 to 0.311 (p < 0.01).
* Observations: Approximately 3,668 across all models.
* Number of districts: 72.
*** p<0.01, ** p<0.05, * p<0.1
Multilevel linear regression for attributions and intention to participate in violent action with random district effect (violent action coded as continuous [0, 1, 2, 3])
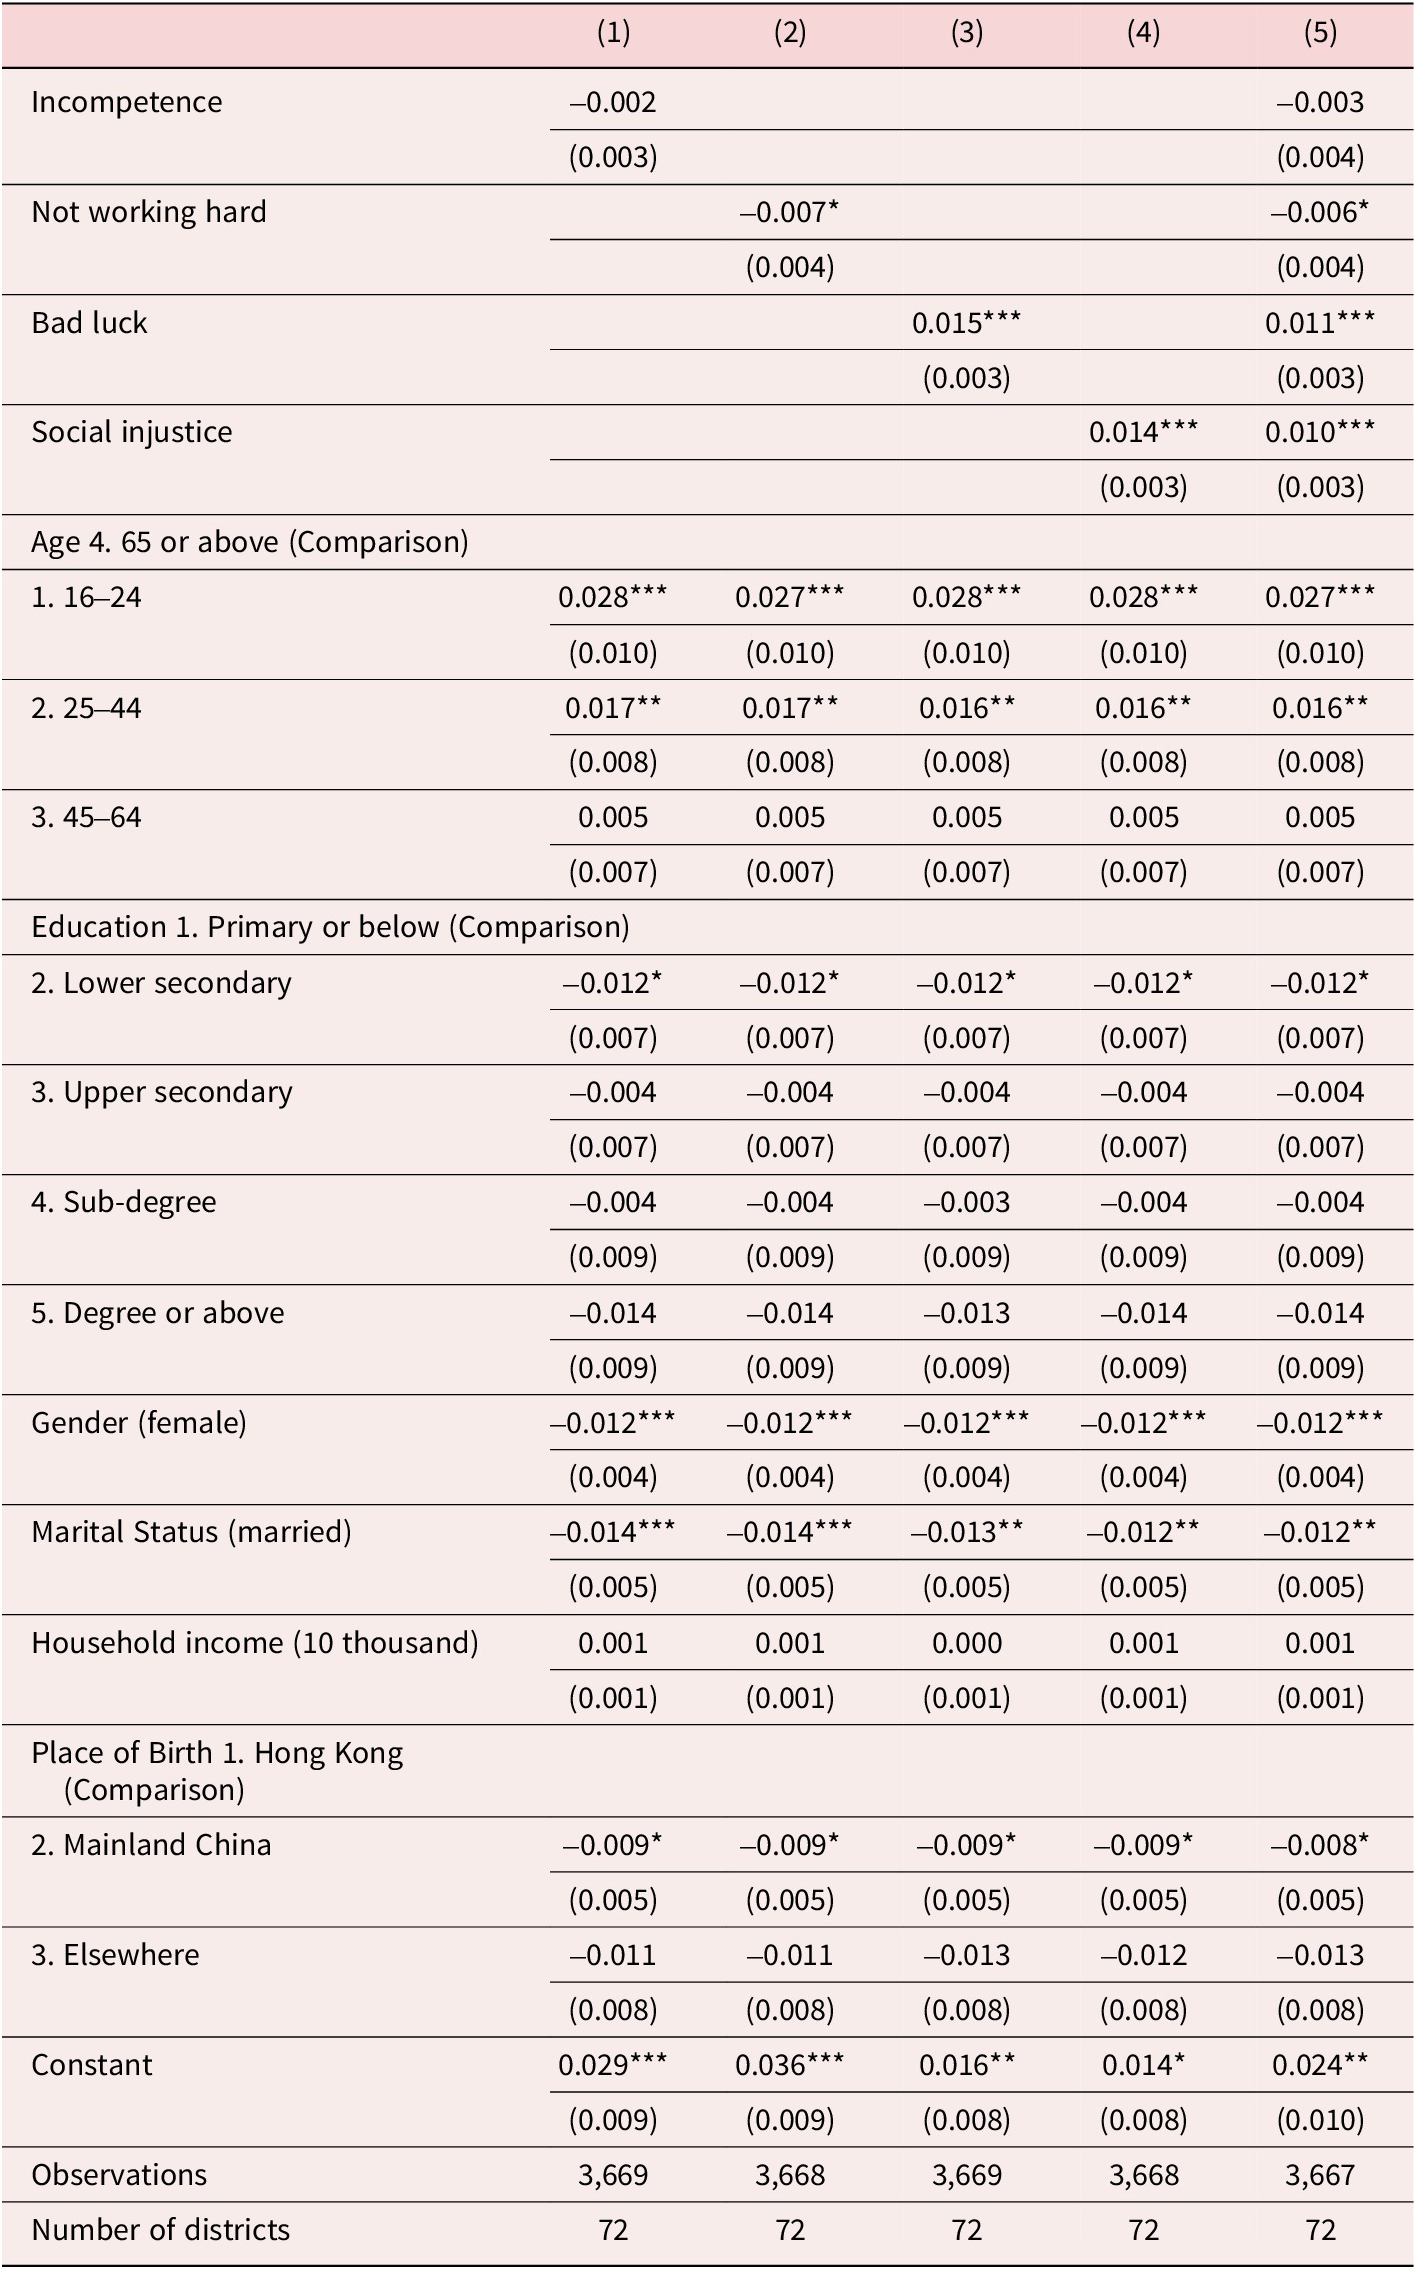
Table A3. Long description
The table presents coefficients and standard errors in parentheses for five multilevel linear regression models.
Independent Variables and Coefficients:
* Incompetence: -0.002 in model 1 and -0.003 in model 5.
* Not working hard: -0.007 in model 2 and -0.006 in model 5, both significant at p < 0.1.
* Bad luck: 0.015 in model 3 and 0.011 in model 5, both significant at p < 0.01.
* Social injustice: 0.014 in model 4 and 0.010 in model 5, both significant at p < 0.01.
Demographic Controls (consistent across models):
* Age: Compared to 65 or above, the 16 to 24 group shows a significant positive coefficient of approximately 0.028 (p < 0.01), and the 25 to 44 group shows approximately 0.017 (p < 0.05).
* Education: Compared to Primary or below, Lower secondary shows a significant negative coefficient of -0.012 (p < 0.1).
* Gender (female): Significant negative coefficient of -0.012 (p < 0.01) across all models.
* Marital Status (married): Significant negative coefficient ranging from -0.012 to -0.014 (p < 0.01 or p < 0.05).
* Place of Birth: Compared to Hong Kong, Mainland China shows a significant negative coefficient of approximately -0.009 (p < 0.1).
Model Statistics:
* Constant: Ranges from 0.014 to 0.036.
* Observations: Approximately 3,667 to 3,669.
* Number of districts: 72.
* Significance levels: *** p < 0.01, ** p < 0.05, * p < 0.1.
*** p<0.01, ** p<0.05, * p<0.1
Multilevel logistic regression for attributions and intention to participate in peaceful protest with random district effect, with satisfaction included
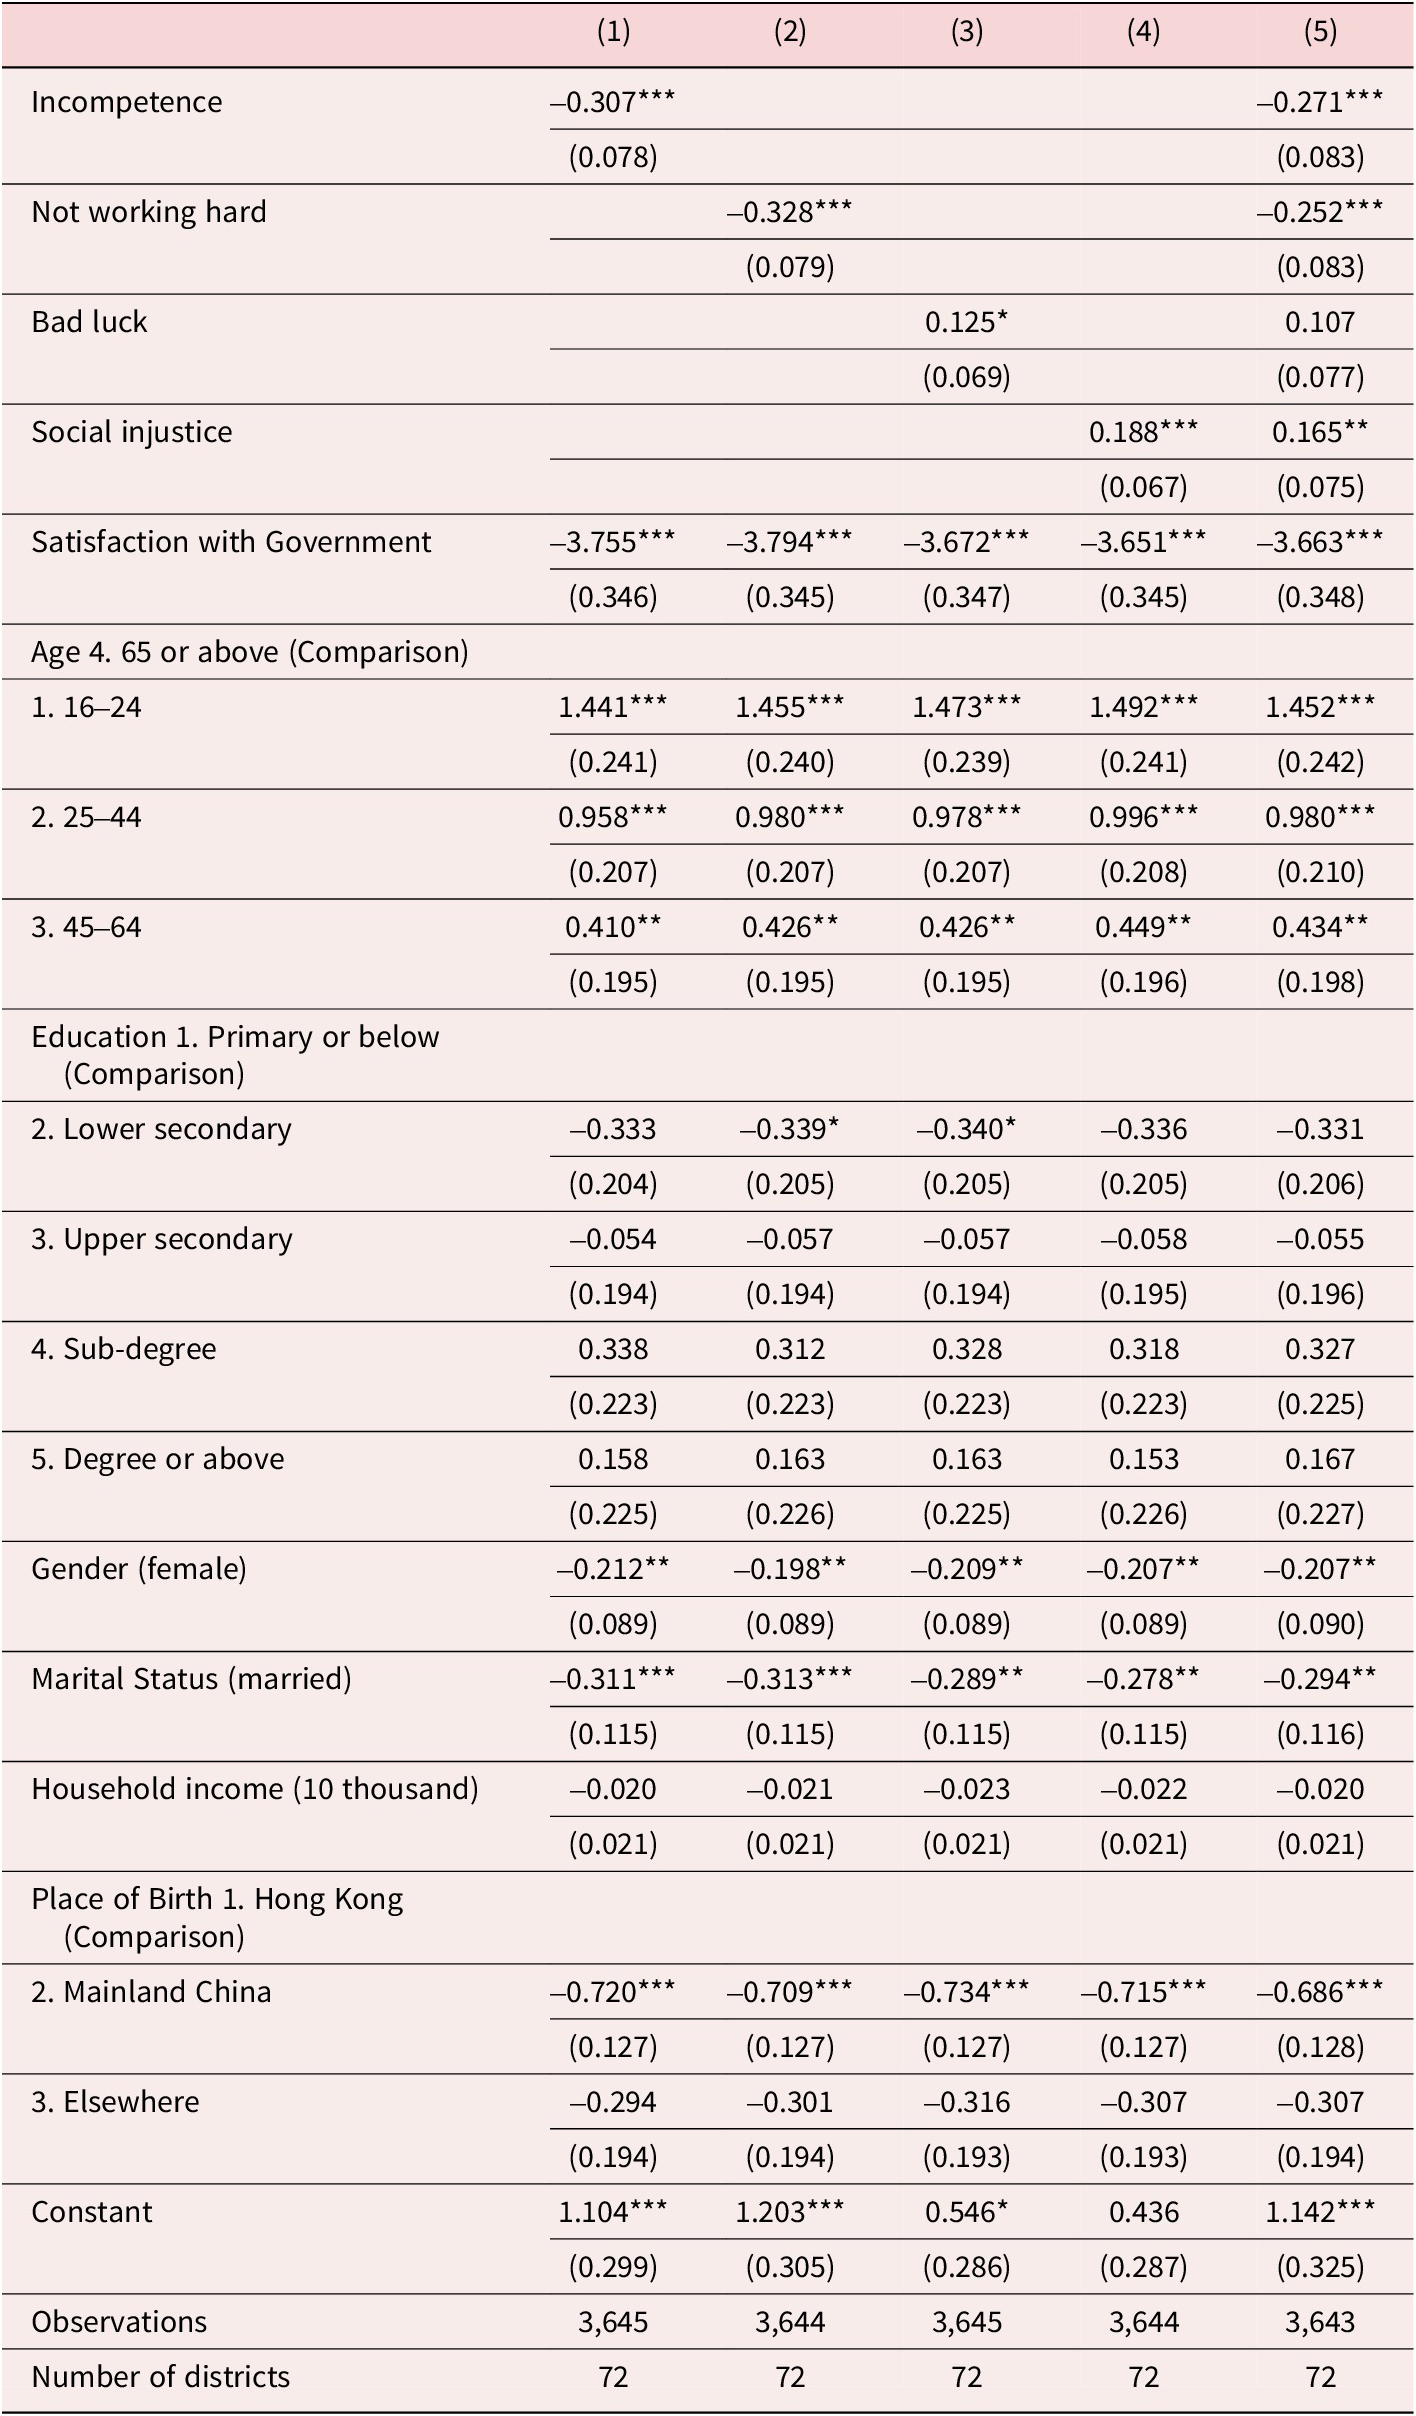
Table A4. Long description
The table presents coefficients and standard errors in parentheses for five regression models.
Key variables and their coefficients in the final Model 5 include:
- Incompetence: negative 0.271 (p < 0.01).
- Not working hard: negative 0.252 (p < 0.01).
- Bad luck: 0.107 (not significant).
- Social injustice: 0.165 (p < 0.05).
- Satisfaction with Government: negative 3.663 (p < 0.01).
Demographic controls in Model 5:
- Age 16 to 24: 1.452 (p < 0.01).
- Age 25 to 44: 0.980 (p < 0.01).
- Age 45 to 64: 0.434 (p < 0.05).
- Gender (female): negative 0.207 (p < 0.05).
- Marital Status (married): negative 0.294 (p < 0.05).
- Place of Birth (Mainland China): negative 0.686 (p < 0.01).
Education levels (Lower secondary, Upper secondary, Sub-degree, and Degree or above) and Household income are included but generally show non-significant results in the final model. The constant for Model 5 is 1.142 (p < 0.01). Total observations range from 3,643 to 3,645 across 72 districts. Significance levels are indicated by asterisks: three for p < 0.01, two for p < 0.05, and one for p < 0.1.
*** p<0.01, ** p<0.05, * p<0.1
Multilevel logistic regression for attributions and intention to participate in peaceful protest with random district effect, with efficacy included
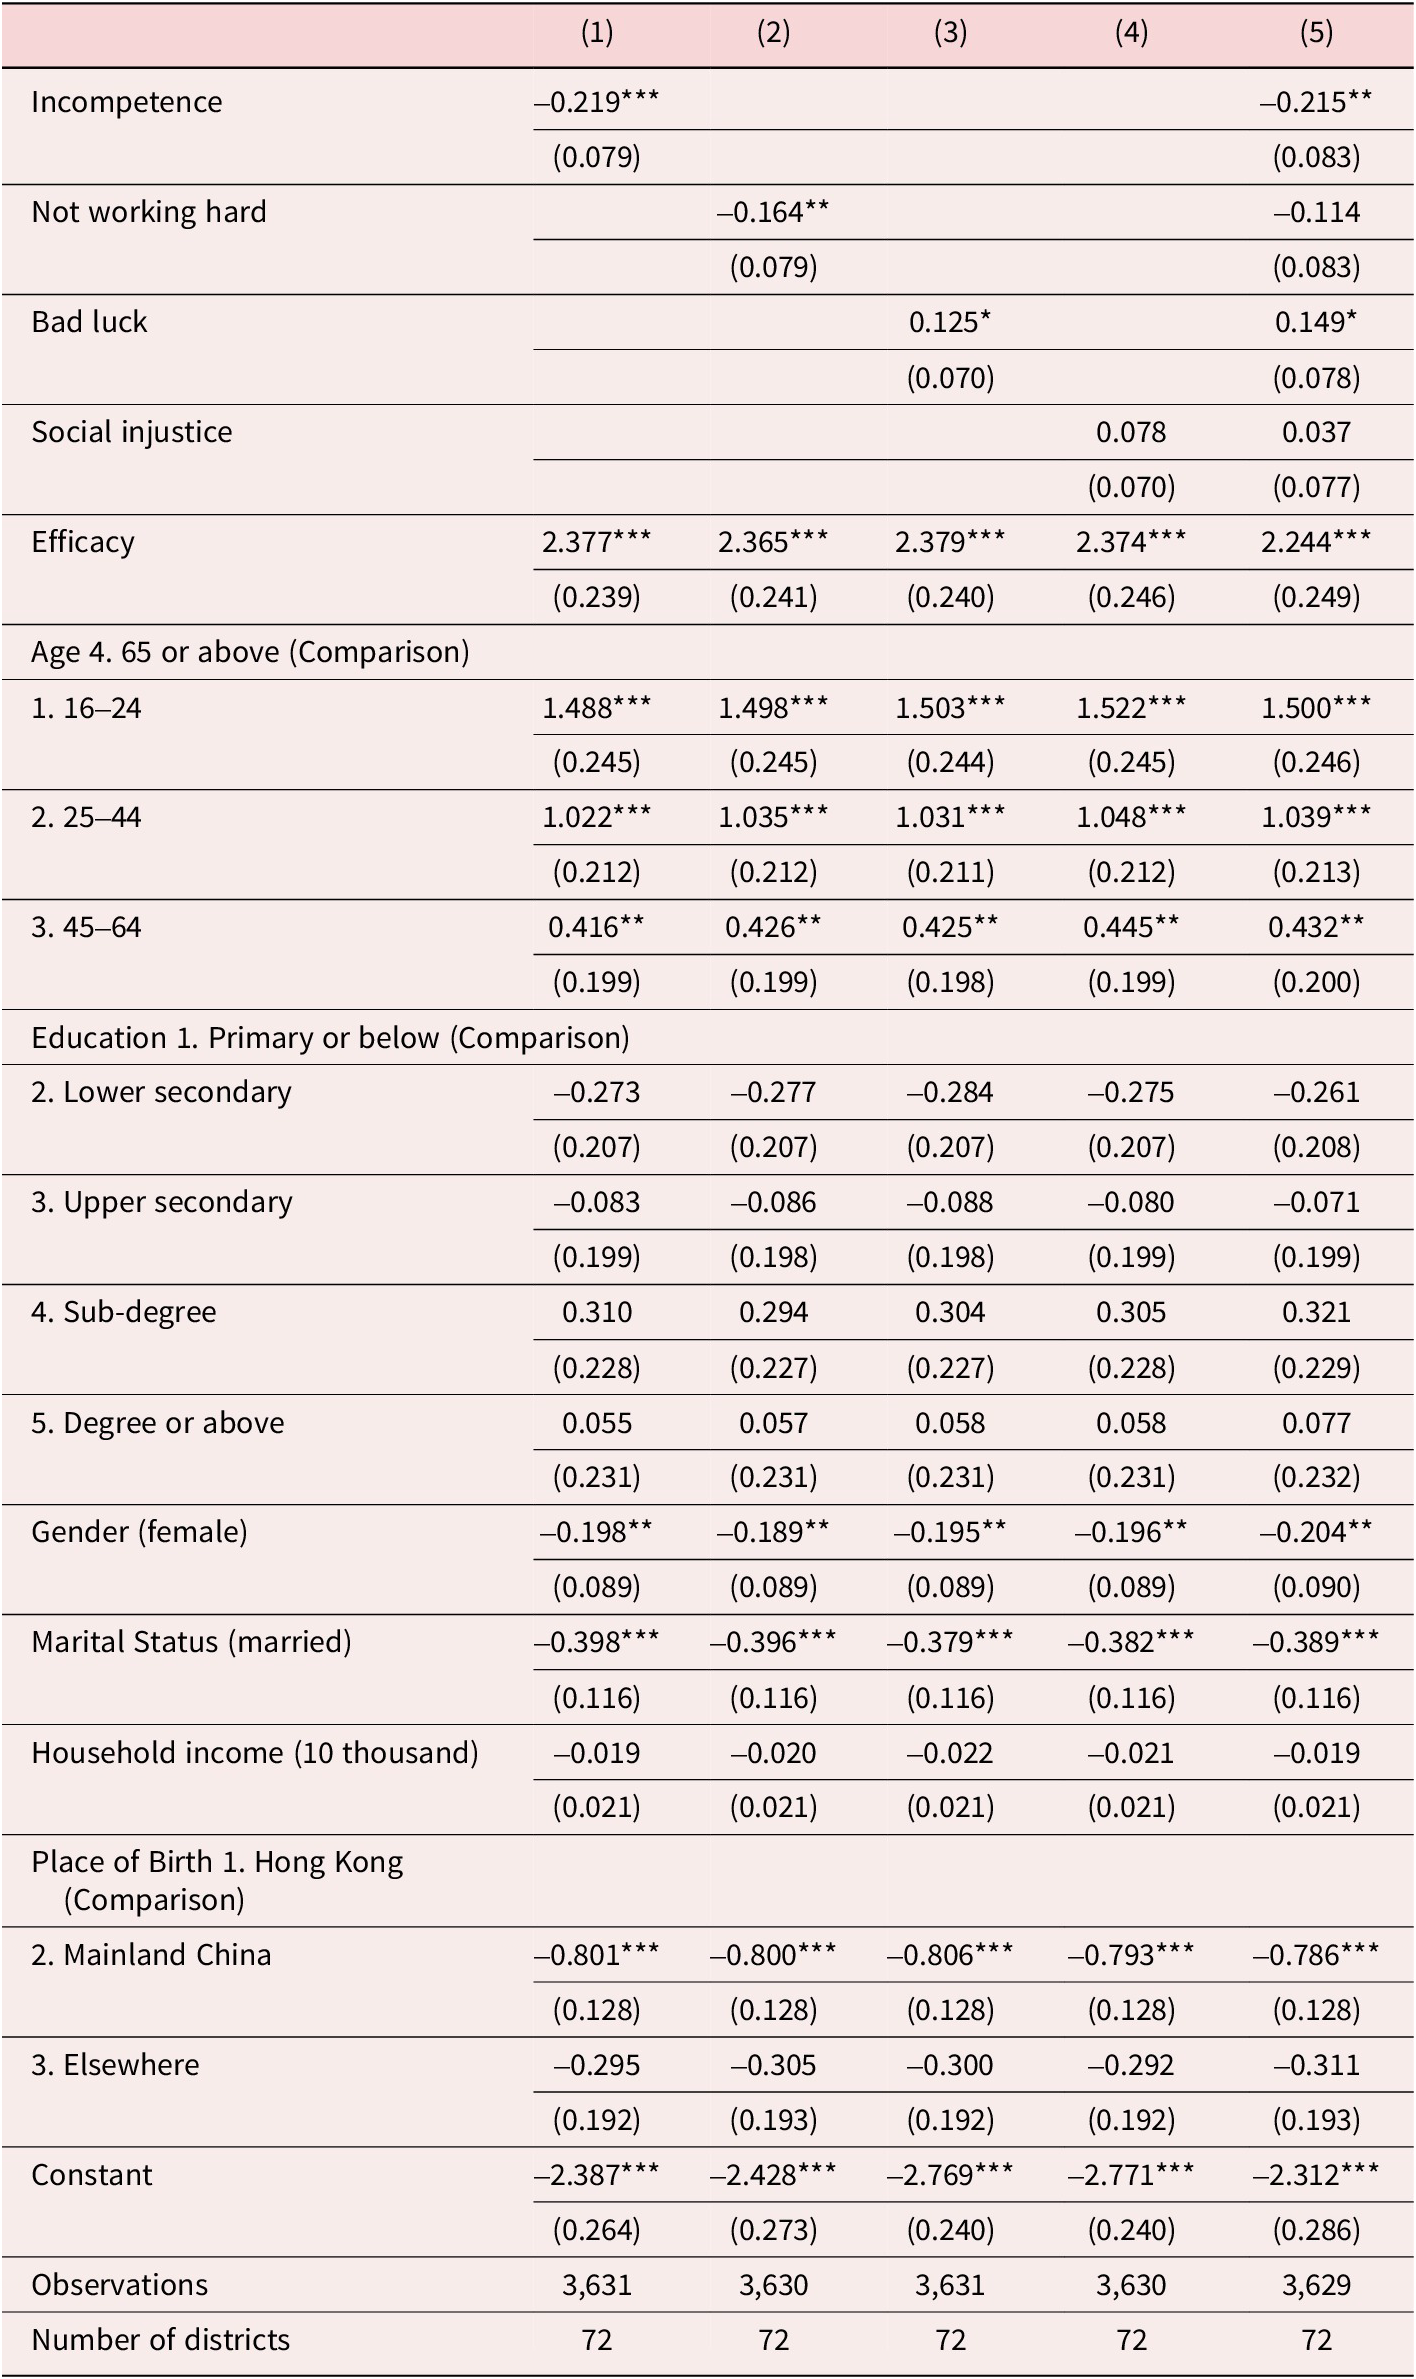
Table A5. Long description
The table presents coefficients and standard errors for five models.
Key variables and their effects across models:
* Incompetence: Negative effect in Model 1 (-0.219) and Model 5 (-0.215), both statistically significant.
* Not working hard: Negative effect in Model 2 (-0.164) and Model 5 (-0.114).
* Bad luck: Positive effect in Model 3 (0.125) and Model 5 (0.149).
* Social injustice: Small positive effect in Model 4 (0.078) and Model 5 (0.037).
* Efficacy: Strongest positive predictor across all models, ranging from 2.244 to 2.379, all significant at p < 0.01.
Demographic Controls:
* Age: Compared to 65 or above, younger groups (16-24, 25-44, 45-64) show significantly higher intentions to protest, with the 16-24 group having the highest coefficients (approx. 1.5).
* Education: Various levels (Lower secondary to Degree) compared to Primary or below; most results are not statistically significant.
* Gender (female): Consistently negative coefficients (approx. -0.2), significant at p < 0.05.
* Marital Status (married): Consistently negative coefficients (approx. -0.39), significant at p < 0.01.
* Place of Birth: Compared to Hong Kong, being born in Mainland China has a strong negative effect (approx. -0.8), significant at p < 0.01.
Summary Statistics:
* Observations: Approximately 3,630 across all models.
* Number of districts: 72.
* Significance levels: *** p < 0.01, ** p < 0.05, * p < 0.1.
*** p<0.01, ** p<0.05, * p<0.1
Multilevel Linear Regression for Attributions and Intention to Vote with Random district effect (Vote coded as continuous [0, 1, 2, 3])

Table A6. Long description
The table presents coefficients and standard errors in parentheses for five regression models.
Key independent variables include:
* Incompetence: Positive significant effect in Model 1 (0.070) and Model 5 (0.057).
* Not working hard: Positive significant effect in Model 2 (0.048) and Model 5 (0.026).
* Bad luck: Positive significant effect in Model 3 (0.051) and Model 5 (0.047).
* Social injustice: Non-significant in Model 4 (0.015) and Model 5 (-0.008).
Demographic controls:
* Age: The 16 to 24 age group shows a consistent negative significant effect (approximately -0.120 to -0.131) compared to the 65 or above group.
* Education: Higher education levels (Upper secondary, Sub-degree, and Degree or above) show strong positive significant effects (ranging from 0.134 to 0.155) compared to Primary education or below.
* Marital Status: Being married has a negative significant effect (ranging from -0.042 to -0.049).
* Place of Birth: Being born elsewhere (outside Hong Kong or Mainland China) has a strong negative significant effect (approximately -0.182 to -0.190).
Model statistics:
* Observations: Approximately 3,667 to 3,669 across models.
* Number of districts: 72.
* Significance levels: Three asterisks indicate p < 0.01, two asterisks indicate p < 0.05, and one asterisk indicates p < 0.1.
*** p<0.01, ** p<0.05, * p<0.1


 Open access

