

Introduction
Test day models (TDM) have been receiving considerable attention from research studies on the genetic improvement of dairy cattle (Gengler et al., Reference Gengler, Tijani, Wiggans and Misztal1999; Kettunen et al., Reference Kettunen, Mäntysaari and Pösö2000; Schaeffer et al., Reference Schaeffer, Jamrozik, Kistemaker and Van Doormaal2000; Swalve, Reference Swalve2000; Misztal et al., Reference Misztal, Strabel, Jamrozik, Mäntysaari and Meuwissen2000; Jensen, Reference Jensen2002; Lopez-Romero and Carabaño, Reference Lopez-Romero and Carabaño2003; Mrode and Swanson, Reference Mrode and Swanson2004; Fischer et al., Reference Fischer, Van der Werf, Banks and Ball2004; Schaeffer, Reference Schaeffer2004; Albuquerque and Meyer, Reference Albuquerque and Meyer2005). The use of TDM allows a more accurate definition of contemporary groups (CG) and associated environmental effects, thus offering a more specific definition of the effects of the lactation stage and reproduction of dairy cows. Further characteristics associated with TDM include the use of additional information on a single animal during genetic evaluations, a better adjustment for lactation of different durations and the possibility of adjusting for individual differences in the shape of a lactation curve, which permits the assessment of lactation persistence (Jakobsen et al., Reference Jakobsen, Madsen, Jensen, Pedersen, Christensen and Sorensen2002). Perhaps the most important use of TDM is that it makes possible the assessment of animals with lactations in progress, allowing for more frequent assessments and, thus, a reduction in the generation interval (Swalve, Reference Swalve1998 and Reference Swalve2000; Jensen, Reference Jensen2002).
Different models have been described for the adjustment of TDM (Misztal et al., Reference Misztal, Strabel, Jamrozik, Mäntysaari and Meuwissen2000; Swalve, Reference Swalve2000; Jensen, Reference Jensen2002). Random regression models (RRM) allow the modeling of the covariance structure among test day yields. They avoid the simplicity associated to repeatability models, which assume a correlation equal to unity and variance homogeneous among the yields, as well as the computational complexity associated to multiple character models, due to the great number of parameters that need to be estimated (Meyer, Reference Meyer1998b, Misztal et al., Reference Misztal, Strabel, Jamrozik, Mäntysaari and Meuwissen2000: Swalve, Reference Swalve2000).
The potential advantages associated with TDM have led researchers from various countries to investigate the implementation of these procedures in national genetic evaluation systems (Swalve, Reference Swalve2000; Pool et al., Reference Pool, Janss and Meuwissen2000; Jamrozik et al., Reference Jamrozik, Gianola and Schaeffer2001; Lidauer et al., Reference Lidauer, Mäntysaari, Strandén and Pösö2000 and Reference Lidauer, Mäntysaari and Strandén2003; Samoré et al., Reference Samoré, Boettcher, Jamrozik, Bagnato and Groen2002). In such a context, Jamrozik and Schaeffer (Reference Jamrozik and Schaeffer1997) reported very high heritability estimates using TDM, but negative genetic correlations among test days in early and late lactation when using Ali and Schaeffer (Reference Ali and Schaeffer1987) curve to adjust the additive genetic effect, assuming the non-hereditary animal effect constant. Later, Jamrozik et al. (Reference Jamrozik, Kistemaker, Dekkers and Schaeffer1997a and Reference Jamrozik, Schaeffer and Dekkersb), using the Wilmink (Reference Wilmink1987) curve reported more realistic heritability estimates at the beginning and end of lactation, indicating the importance of adequate modeling of the non-hereditary animal effect in random regression models. Brotherstone et al. (Reference Brotherstone, White and Meyer2000) reported that the parametric curves of Ali and Schaeffer (Reference Ali and Schaeffer1987) and Wilmink (Reference Wilmink1987) were more adequate in adjusting the milk yields first lactation Holstein cows when compared with Legendre orthogonal polynomials.
The parametric functions of Ali and Schaeffer (Reference Ali and Schaeffer1987) and Wilmink (Reference Wilmink1987) have been used in the adjustment of RRM, as they allow the modeling of the lactation curve and simultaneously characterise the covariance structure among the test day yields (Jamrozik and Schaeffer, Reference Jamrozik and Schaeffer1997; Brotherstone et al., Reference Brotherstone, White and Meyer2000). The implementation of RRM for genetic evaluations of dairy cattle depends on the estimates of the covariance components and genetic parameters for the traits included in the breeding program. The objective of this study is to evaluate and to compare the parametric logarithmic function proposed by Ali and Schaeffer (Reference Ali and Schaeffer1987) and the exponential function proposed by Wilmink (Reference Wilmink1987) and a combination of the Legendre polynomial of second order and Wilmink function to adjust test day milk yields of first lactation Holstein cows using RRM.
Material and methods
Data
Milk yield records were obtained from the milk recording services of the Brazilian Holstein and their state affiliates from 1991 to 2001. Records originated from 39 048 lactations from 531 herds located in the states of Sao Paulo, Minas Gerais, Rio Grande do Sul, Santa Catarina and Espírito Santo.
Test day records were edited for cows aged 18 to 48 months and 5 to 305 days after calving. It was required a minimum of three test day records per cow. Moreover, it was determined that each CG, defined as test herd-year-month of calving, included at least four records. After these edits 32 448 first lactations (263 390 test day records) were used in the statistical analyses. Table 1 displays number of records, animals and data structure, as well as average and standard deviations of milk yield in the test days. There was an average of eight test days per cow; and 80.85% of the cows had eight or more test days. Just 9.39% of the cows presented less than five available test days.
Structure of the data, average (kg) and standard deviations (kg) of test day milk yields

† Including parents without records and dummy identities for unknown dams.
‡ With progeny in the data.
§ With progeny in the data, including dummy assigned for animals with missing dam identities.
The pedigree data included 3737 bulls and 32 449 cows with records. Non-informative animals were eliminated and a total of 49 394 animals were included in the A matrix.
Models
The lactation curve and covariance structure among test days were modeled by three functions.
(a) Ali and Schaeffer (Reference Ali and Schaeffer1987) logarithmic function (AS):
where c = DIM/305 and DIM = days in milk.
(b) Wilmink exponential (1987) function (W):
where t = DIM.(c) An alternative form of the Wilmink exponential function (W*):
in which the second term is divided by 100 to reduce the amplitude of the covariate, expecting to improve the numeric properties of the model (Jakobsen et al., Reference Jakobsen, Madsen, Jensen, Pedersen, Christensen and Sorensen2002).(d) and a combination of parametric and non-parametric function (LEG+W):
where x = − 1+2(DIM − 5)/(305 − 5) and the coefficients a 0–a 2 are coefficients of the second order Legendre polynomial at DIM.




In the Wilmink curve, the fourth parameter (a 3) is generally considered as a constant. In the present study it was assumed equal to − 0.05.
In its general expression, the RRM may be represented by:

where y i t is the milk yield of cow i on day t; βm are the coefficients of fixed regression for an average population curve; αim and γim are, respectively, the additive genetic and the non–hereditary random regression coefficients for cow i; e it is the measurement error associated to classes of time t; F it represent fixed effects of the model: test herd–year–month, season of calving, and age of the cow at calving as a co–variable with linear and quadratic terms; P m(t) is the mth term of the adjusted function; f and k is the number of coefficients of the fixed and random effects of the adjusted function. Thus, for the AS curve in [1]: P 0(t) = 1, P 1(t) = c, P 2(t) = c 2, P 3(t) = ln 1/c, P 4(t) = (ln 1/c)2 and f = k = 5.
The model above can be written in matrix form as:

where y is the test day yields vector; b is the vector of fixed effects; α and γ are the vectors of random regression coefficients for the additive genetic and non–hereditary animal effects, respectively; e is the vector of residual random effect; and X, Z and ZD are the matrices that associate the observations to the fixed effects, random animal effects and non–hereditary animal effects, respectively. Assume
![\left [{\begin{array}{ccc}\mathbf{\alpha } \\ \mathbf{\gamma } \\ \mathbf{e} \\ \end{array} }\right ] \tilde \ N (\mathbf{0},\mathbf{V}),\,\mathbf{V} = \left [{\begin{array}{ccc}\mathbf{G}_{\mathbf{A}}\otimes \mathbf{A} & \mathbf{0} & \mathbf{0} \\ \mathbf{0} & \mathbf{P}_{\mathbf{D}}\otimes \mathbf{I} & \mathbf{0} \\ \mathbf{0} & \mathbf{0} & \mathbf{R} \\ \end{array} }\right ],](https://static.cambridge.org/binary/version/id/urn:cambridge.org:id:binary:20160203071342585-0635:S1751731107685036_eqnu3.gif?pub-status=live)
in which GA and PD are, respectively, the additive genetic and non–hereditary random regression coefficients covariance matrix effect; A is the relationship matrix; I is an identity; ⊗ is Kronecker product between matrices; and  in which n represents number of the classes of days in milk (DIM) for adjustment of heterogeneous residual variance. Thus, for the AS curve in [1], n = 1,…,29 for DIM: 5–20, 21–30,…,295–305; n = 1,…,4 for DIM: 5–45, 46–115, 116–265 and 266–305, and n = 1 residual variance (RV) was assumed homogenous or constant throughout lactation. The adjusted models using the AS curve were identified as AS, followed by ME (measurement error) and the number of classes of RV (29, 4 or 1). Thus, ASME29 identifies the AS curve adjusted with 29 classes of measurement error.
The covariance components for the random effects were estimated using ‘DxMRR’ Meyer (Reference Meyer1998a) with (AI)REML average information algorithm (Meyer, Reference Meyer1997). The convergence criterion was defined by the difference between the value of the likelihood function of consecutive iterations less than 10− 4. Each analysis was repeated with estimated values from the previous analysis until the values of the likelihood function were equal for two consecutive analyses.
The evaluation of the adjusted models was accomplished by comparing the covariance components and the parameters estimated by a repeatability single character model (Melo et al., Reference Melo, Costa, Packer and Machado2005). Also the following statistical criteria were used: logarithm of the maximum likelihood function (log ℓ); the Akaike information criteria (AIC = − 2 log ℓ+2p); and the Schwarz information criteria (BIC = − 2 log ℓ+p log(N − r(x))), in which p is the number of estimated parameters, N is the sample size and r(x) is the rank of the matrix of fixed effect coefficients in the model.
Results
The log ℓ and AIC values indicate that the adjustment of the ASME29 model is superior to the other models studied, whereas for BIC, ASME1 proved to be superior to the other models (Table 2). Values obtained for log ℓ and AIC tend to favour models with a greater number of parameters, whereas BIC, which is more likely to penalise a greater number of parameters, tends to select more parsimonious models. The W model exhibited a convergence difficulty. This was probably due to the numeric problems that occurred in function of the amplitude of the co-variables, which was not observed using the W* model. The LEG+W model showed better results than models W e W*, but inferior than the AS models.
Rank of the matrix of random regression coefficients for genetic additive effect (kA), number of parameters (p), the log likelihood (log ℓ), criteria of information of AIC and BIC for each random regression model

† AIC = − 2 log ℓ+2p. BIC = − 2 log ℓ+p log (N − r(x)), in which p is the number of estimated parameters, N is the sample size, r(x) is the matrix rank of the fixed effect coefficients in the analysis model.
The number of records, average and standard deviations, and the residual variance estimates for milk yields in the respective measurement error classes of DIM for the adjusted models are shown in Table 3. Only results for homogeneous residual variances are given for LEG+W, W e W* models, since differences among the residual variance estimates assuming 29 and four measurement error classes were rather small and similar to those observed for the AS model. The RV values found were 5.29, 5.56 and 5.63 kg2 for the LEG+W, W and W* models respectively; which were larger than 4.56 kg2 obtained for the ASME1 model (Table 3).
Days in milk (DIM), number of records (N), mean and standard deviation (s.d.) and residual variance estimates (RV) for milk yield for classes of error measurements from fitted RR models

The RV estimates obtained for the DIM through the adjustment of the ASME29 model were similar, varying from 4.15 kg2 for ME28 to 5.11 kg2 for ME26. The average RV obtained from the 29 measurement error groups was 4.55 kg2, with a standard deviation of 0.26 kg. RV estimates obtained through the adjustment of the ASME4 model varied from 4.78 kg2 for ME1 to 4.50 kg2 for ME2. The average RV obtained from this model was 4.59 kg2, with a standard deviation of 0.13 kg. The RV value estimated by fitting the ASME1 model was 4.56 kg2. Overall, it was observed similar average and small variation for RV estimates among models with different measurement error indicating there is no need to fit for heterogeneity of RV.
Covariance estimates and correlations among the random regression coefficients for the additive genetic and non-hereditary animal effects of the AS curve, as well as the associated eigenvalues are displayed in Tables 4 and 5. The estimates of the random regression coefficients for the additive genetic effect were very similar regardless of the RV modeling for the AS curve. The same trend was observed for the estimates of coefficients of the non-hereditary animal effect.
Estimates of covariance and correlations between random regression coefficients of the genetic additive effect for AS models and eigenvalues (λ) associated to matrix kA

Estimates of covariance and correlations between the random regression coefficients of the non-hereditary animal effect for AS models and eigenvalues (λ) associated to matrix kp

Covariance estimates and correlations among the random regression coefficients in the W and W* curves for the additive genetic and non-hereditary animal effects are shown in Table 6. The variance estimates were similar for coefficients a 0 and a 2 but higher for a 1 with the W* curve. Some differences were observed between functions regarding the magnitude and meaning of the correlations among the coefficients. This was certainly due to the scale effect related to the co-variable (t/100) associated to coefficient a 1.
Estimates of variance (diagonal), covariance (below the diagonal) and correlations (above the diagonal) between random regression coefficients for the W and W* models and eigenvalues (λ) associated to kA and kp, respectively the additive genetic and non-hereditary animal effects

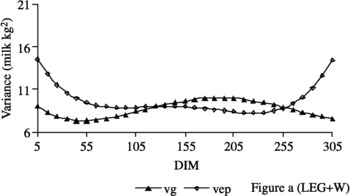
The genetic variance estimates obtained from the ASME1 (Figure 1a), ASME4 (Figure 1b), ASME29 (Figure 1c), LEG+W (Figure 2) and W* (Figure 3a) models were similar throughout the lactation period. In the ASME1 model, the genetic variance (7.59 to 11.88 kg2) presented an average of 8.77 kg2, with a standard deviation of 0.63 kg (Figure 1a). However, genetic variance estimates for the W model exhibited a different trend, increasing from 9.47 kg2 on the fifth DIM to 171.27 kg2 at the end of lactation (Figure 3b).
Estimates of genetic (vg) and non-hereditary (vep) variances obtained by fitting the models ASME1 (Figure a), ASME4 (Figure b) and ASME29 (Figure c).

Estimates of genetic (vg) and non-hereditary (vep) variances obtained by fitting the model LEG+W (Figure a).
Estimates of genetic (vg) and non-hereditary (vep) variances obtained by fitting the models W* (Figure a) and W (Figure b).

Variance estimates of the non-hereditary animal effect presented a trend similar to that observed for the genetic variance estimates in the ASME1 (Figure 1a), ASME4 (Figure 1b), ASME29 (Figure 1c) and W* (Figure 3a) models, with the exception of an increase occurring from the 240th DIM through to the end of lactation. With respect to the W model, variance estimates for the non-hereditary animal effect accompanied the same trend as the estimates for the additive genetic effect, increasing from the beginning to the end of lactation (Figure 3b).
Heritability estimates did not differ among the ASME29, ASME4, ASME1 and LEG+W models (Figure 4a). The estimates decreased from 0.35 at the beginning of lactation to 0.30 on the 25th DIM and afterwards increased to 0.41 on the 234th DIM; and again decreased through to the end of lactation. Heritability estimates for the W* model (Figure 4b) exhibited a more stable trend, decreasing from 0.36 at the beginning of lactation to 0.33 on the 44th DIM and small increase at the end of lactation with a value of 0.40. Heritability estimates in the W model (Figure 4c) began with a value of 0.27 and was larger than the estimates obtained from the other models, particularly at the end of lactation (0.65). The estimates for the W model reflected the trend of increasing genetic variance along lactation.
Estimates of heritability obtained by fitting the models ASME29, ASME4, ASME1 and LEG+W (Figure a), W* (Figure b) and W (Figure c).

Genetic correlation estimates among test day yields were similar between ASME1 (Table 7), W* (Table 8) and the LEG+W models (Table 10). Estimates were close to the unity for adjacent test day yields and decreased for DIM in the beginning and the end of lactation. Genetic correlation estimates were slightly higher for the ASME1 model between the beginning and mid-period of lactation, whereas this trend of higher values was observed for the W model among the test day yields in the intermediary phase and at the end of lactation. Genetic correlation values among the test day yields for the W* (Table 9) model were similar to those obtained for the other models, with the exception of negative estimates observed between test days in the beginning and end of lactation. Correlation estimates among test days non-hereditary animal effect were similar for the fitted models. Slightly higher estimates were observed for the LEG+W, W and W* models. The same trend reported for genetic correlations was observed: estimates were close to the unity for adjacent test days and decreased for yields in more distant DIM along the lactation period.
Estimates of heritability (diagonal), genetic (below the diagonal) and non-hereditary correlations (above the diagonal) between test-day milk yields for selected days in milk (DIM) using the ASME1 model

Estimates of heritability (diagonal), genetic (below the diagonal) and non-hereditary correlations (above the diagonal) between test-day milk yields for selected days in milk (DIM) using the W model

Estimates of heritability (diagonal), genetic (below the diagonal) and non-hereditary correlations (above the diagonal) between test-day milk yields for selected days in milk (DIM) using the W* model

Estimates of heritability (diagonal), genetic (below the diagonal) and non-hereditary correlations (above the diagonal) between test-day milk yields, for selected days in milk (DIM) using the LEG+W model

Discussion
Pool and Meuwissen (Reference Pool and Meuwissen1999) observed that the use of data from incomplete lactations (less than 280 days of lactation) could affect the estimate of variance components. They recommend only using data from complete lactations for estimating such parameters. However, discarding data from incomplete lactations or lactations in progress may bias the estimates of these parameters, particularly in the management of some national production systems (Costa et al., Reference Costa, Melo, Machado, Freitas, Packer and Cobucci2005), where cows with low yields may not have the same opportunity to complete lactation as cows with high yields. Thus, it was considered reasonable to use lactations from cows with at least three tests (approx. 90 days into lactation) to avoid data selection and allow more realistic estimates of the model parameters under national conditions. This decision proved to be prudent, as the residual variance estimates exhibited a tendency toward homogeneity throughout the lactation period.
With respect to model selection, AIC and BIC information criteria involved two terms: one associated to the maximum likelihood function, which measures the lack of model fitting; and another that penalises more complex models by considering the number of parameters of the model. The log ℓ and AIC favour more parameterised models, whereas BIC, by penalising the number of parameters in the model, tends to favour more parsimonious models. Thus, the log ℓ and AIC criteria indicated the ASME29 model, whereas BIC indicated ASME1 as the model with the best fit.
The W model presented convergence problems and was therefore characterised as a hard fitting model among those evaluated. The analyses were re-initiated various times using different values in order to attain the convergence criterion. Results from one analysis were rarely repeated in the following one. Thus, the results of the W curve should be viewed with caution. The results obtained from the W* model, however, were consistent, demonstrating that the division of the covariate by 100 was effective in circumventing problems of instability in the estimation of random regression coefficients.
These results are in agreement with those obtained by Schaeffer and Guo (Reference Schaeffer and Guo2002). They evaluated different models (but not the W* model, as suggested by Jakobsen et al., Reference Jakobsen, Madsen, Jensen, Pedersen, Christensen and Sorensen2002) and conclude that the AS model was superior to the W model, which was one of the three worst fitted models. In the present study, the W* model proved to be computationally efficient, as it did not present convergence problems.
Differently from observations in other studies (Olori et al., Reference Olori, Hill, McGuirk and Brotherstone1999; Rekaya et al., Reference Rekaya, Carabaño and Toro1999; Brotherstone et al., Reference Brotherstone, White and Meyer2000; Jamrozik et al., Reference Jamrozik, Gianola and Schaeffer2001; Lopez-Romero and Carabaño, Reference Lopez-Romero and Carabaño2003), in which higher RV estimates were obtained for the beginning and end of lactation, RV estimates in the present study were similar among the DIM classes, as well as among the fitted models. Thus, assuming RV homogeneity does not appear to compromise the accuracy of the estimates of the other variance components and genetic parameters (Tables 3, 4 and 5). Lopez-Romero and Carabaño (Reference Lopez-Romero and Carabaño2003) concluded that RV homogeneity could be assumed in the interval between 75 and 275 days of lactation, but that RV heterogeneity should be assumed outside of this interval, that is, a RV should be considered for each DIM outside this interval. However, considering a RV for each DIM means an overparameterised model and significantly hinders the estimation of the variance components.
Similar trends for variance estimates of genetic and permanent effects throughout the lactation were observed among the ASME1 (Figure 1a), ASME4 (Figure 1b), ASME29 (Figure 1c), LEG+W (Figure 2) and W* (Figure 3a) models. Estimates decreased from the beginning of lactation to more stable values through to the final third of lactation, when values increased. Estimates obtained from the W model (Figure 3b) increased from the beginning to the end of lactation, when they reached markedly elevated values in comparison to the estimates obtained from the other models. These results differ from those reported by Jamrozik et al. (Reference Jamrozik, Schaeffer and Dekkers1997b), who obtained similar results using both the AS and the W curve and from those from Jamrozik et al. (Reference Jamrozik, Kistemaker, Dekkers and Schaeffer1997a), who described a reduction in genetic variance from the beginning to the 25th day of lactation and then stability in values through to the end of lactation when using the W model.
Heritability estimates did not differ among the ASME1, ASME4, ASME29 and LEG+W models (Figure 4a), ranging between 0.30 and 0.41. After a decrease at the beginning, there was an increase that resulted in higher values at mid lactation and another decrease toward lower values at the end of lactation. The heritability estimates for the W* model (Figure 4b) exhibited a more stable trend, decreasing from 0.36 at the beginning of lactation to 0.33 on the 44th DIM. A slight increase was observed at the end of lactation, when heritability estimates reached the value 0.40. Olori et al. (Reference Olori, Hill, McGuirk and Brotherstone1999) reported similar trends when fitting a quadratic polynomial curve. With respect to the convergence problems observed, heritability estimates in the W model (Figure 4c) were higher than those obtained from the other models (except at the beginning of lactation). Starting from 0.27 at the beginning of lactation, the estimates increased continually until reaching 0.65 by the end of the period. This trend was similar to that observed by Brotherstone et al. (Reference Brotherstone, White and Meyer2000), who, however, reported lower heritability estimates (0.08 to 0.24).
Estimates obtained from the ASME1, ASME4, ASME29, LEW+W and W* models were the most similar to the estimates obtained by Melo et al. (Reference Melo, Costa, Packer and Machado2005). Their estimates for test day yields from single-character analyses ranged from 0.22 to 0.36. These estimates are a reference (Rekaya et al., Reference Rekaya, Carabaño and Toro1999) to characterise an expected value for the heritability estimates from TDM throughout the lactation period.
Genetic correlation estimates among test day yields were similar between the ASME1 (Table 7) and W models (Table 8). Estimates were close to the unity for adjacent test day yields but decreased to lower values for yields between the beginning and end of lactation. Genetic correlation estimates were slightly higher for the ASME1 model between the beginning and mid lactation periods, whereas this trend toward higher values was observed for the W model between test day yields from the intermediary phase and the end of lactation. Overall, these results were similar to those reported in other studies (Jamrozik and Schaeffer, Reference Jamrozik and Schaeffer1997; Brotherstone et al., Reference Brotherstone, White and Meyer2000; Jakobsen et al., Reference Jakobsen, Madsen, Jensen, Pedersen, Christensen and Sorensen2002; Costa et al., Reference Costa, Melo, Machado, Freitas, Packer and Cobucci2005).
Genetic correlation estimates among test day yields for the W* model were similar to those obtained from the other models, except for the negative values observed between test days in the beginning and end of lactation (Table 9). Similar results were reported in other studies (Rekaya et al., Reference Rekaya, Carabaño and Toro1999; Brotherstone et al., Reference Brotherstone, White and Meyer2000).
The present study was focused on the evaluation of the parametric functions of Ali and Schaeffer and Wilmink and a combination of Legendre and Wilmink function, but other studies report satisfactory results obtained from using the Legendre orthogonal polynomials to fit random regression models (Olori et al., Reference Olori, Hill, McGuirk and Brotherstone1999; Brotherstone et al., Reference Brotherstone, White and Meyer2000; Pool et al., Reference Pool, Janss and Meuwissen2000). Brotherstone et al. (Reference Brotherstone, White and Meyer2000) observed that parametric functions resulted in higher values for the maximum likelihood functions, but produced negative genetic correlations between test days in the beginning and end of lactation, which were not observed when using Legendre polynomials. The authors suggest that in situations where there are no computational limits, polynomials of a higher order are more efficient. They also suggest that a combination of parametric and non-parametric functions (Lidauer et al., Reference Lidauer, Mäntysaari, Strandén and Pösö2000 and Reference Lidauer, Mäntysaari and Strandén2003) would possibly improve the modeling of the genetic and permanent environment variance components. This was not confirmed in the present study because the performance of the LEG+W model was worse than the AS models.
Conclusions
The AS models evaluated in the present study exhibited similar results for residual and genetic variances. Heritability estimates for test day milk yields were close to the values obtained from single-trait analyses and of similar magnitude to results found in the literature.
The model based on the Wilmink curve presented convergence problems. Its variation, the W* model, resulted in negative genetic correlation estimates between test days yields in the extremes of the lactation. The LEG+W model did not show any improvement over the AS models.
The ASME1 was characterised as the most parsimonious and of lower computational demand to model test day milk yields of Holstein cows in Brazil by RRM.
Acknowledgements
This work was supported by Prodetab/Embrapa Project 054-02/99 and by FAPESP Process 99/03 838-6. Data were provided by ABCBRH (Holstein Brazilian Association). The first author is supported by a scholarship of the FAPESP.



