

Introduction
The architecture and urban planning of the Roman Republic, particularly in the city of Rome, were deeply intertwined with political dynamics, serving as instruments for asserting, contesting, and negotiating power. Traditionally viewed as merely a precursor to Imperial grandeur, Republican architecture is increasingly being recognized for its crucial role in shaping the political landscape.Footnote 1 Among public spaces, the Forum Romanum, in particular, evolved in response to shifting power structures, transitioning from a multifunctional space to a controlled political arena. These changes were most dynamic during the last decades of the Roman Republic, the civil wars, and the principate of Augustus, when Rome’s main square became first a space of dignitas and then, under Caesar and Augustus, a space dominated by their personal power.Footnote 2 These transformations affected not only the organization of space but also the ways in which individuals engaged with political discourse. The rostra of the Forum Romanum were central to public speaking in ancient Rome, serving as platforms for political oratory and civic engagement. Simultaneously, as occulatissimi loci (highly visible places), they carried profound symbolic significance, serving as sites for displaying statues of distinguished citizensFootnote 3 and, during civil wars, the severed heads of opponents – thus becoming emblems of complete political domination.Footnote 4 As the Roman state transitioned from Republic to Empire, the placement of the rostra within the Forum changed significantly, influencing the potential size and spatial arrangement of the audiences the speakers addressed.
This study examines how architectural modifications in the Forum Romanum influenced the oratorical taskscape Footnote 5 – meaning the dynamic interaction of physical space, social practices, crowd spatial configurations, and the performative aspects of public speaking – by using the visibility of hand gestures as a proxy for estimating audience sizes. Given the inherent challenges of reconstructing ancient crowd capacities, we employ a method that assesses the spatial extent of visual communication, drawing on historical accounts of contiones in which gestures remained visible even when speech was unintelligible.Footnote 6 This approach, which requires minimal computational complexity compared to, for example, acoustic simulations, provides a clearer understanding of crowd sizes and distribution, and their implications for political communication, by facilitating comparisons between different speaking platforms.
Estimating crowd sizes is essential for understanding the effectiveness of oratory in ancient Rome, as larger audiences amplified the reach of a speaker’s message, ensuring that their rhetoric would influence not only those who received it in person but also a wider audience through secondary dissemination. The more people who witnessed and interpreted a speaker’s gestures, the greater the potential impact of their message, even in cases where speech was only partially audible. Moreover, the scale of public gatherings reflected the extent of civic participation in political life, as the presence and engagement of citizens in these assemblies shaped collective decision-making and reinforced the performative nature of Roman politics.Footnote 7
In addition, the ability to draw and hold a large crowd also signaled a speaker’s capacity to mobilize support and resonate with the populace, reinforcing their political legitimacy and influence.Footnote 8 This consideration may have informed the architectural and spatial modifications introduced by Caesar and Augustus, as both sought to reshape the Forum to control public gatherings and consolidate their authority within Rome’s evolving political landscape.
By analyzing the spatial arrangement of the rostra in the Forum Romanum, this study offers fresh insights into the strategic use of architectural modifications in ancient Rome. It focuses on how Caesar and Augustus may have deliberately reshaped the oratorical taskscape of the Forum to control public gatherings and consolidate their power. In considering whether the changes were driven by a desire to manage crowd sizes and amplify political impact, it deepens our understanding of civic participation and the legitimization of authority during Rome’s transition from Republic to Empire.
Hand gestures in Roman rhetoric and public speaking
Public speakers use gestures in a number of different ways, including making deictic references, as a way of representing objects or actions, and as a way of punctuating, marking, or showing aspects of the structure of their speech.Footnote 9 These types of gestures are sometimes called illustrators.Footnote 10 Gestures can also express emotions and feelings and often play a very important role in key moments of social interaction, sometimes even replacing words.Footnote 11 In the latter case, they become kinesic codes or emblems, in the terminology of Ekman and Friesen;Footnote 12 the ultimate example – where signs replace all words – is sign languages.Footnote 13
The significance of gestures in communication among the Romans is indicated not only by rhetorical treatisesFootnote 14 but also by anecdotes found scattered through the work of various ancient authors regarding this aspect of body language.Footnote 15 According to Lucretius,Footnote 16 there was even a pre-speech stage of human history when communication was based on gestures and grunts alone. While there is no evidence of codified sign languages in Roman times, the concept of gestural communication was not foreign to ancient thought – Plato in the Cratylus has Socrates ask: “Suppose that we had no voice or tongue, and wanted to communicate with one another, should we not, like the deaf and dumb, make signs with the hands and head and the rest of the body?”Footnote 17 Though this passage is often cited as the oldest reference to sign language, it likely describes ad hoc non-verbal communication rather than a formal system like modern sign languages, which emerged only about 300 years ago.Footnote 18 In the Roman context, gestures had a wide range of communicative functions, including expressing emotion, indicating, mimicking, signaling, and displaying rhythm.Footnote 19
The use and significance of gestures in Roman rhetoric and art have already been the subjects of numerous studies.Footnote 20 We rely on Quintilian because his work represents the most comprehensive treatise on ancient rhetoric, in which the matter of hand gestures is also treated most extensively. Since he was active in the second half of the 1st c. CE, it is necessary to address scholarly debates regarding the evolution of gestural communication between the times of Cicero and Augustus, and those of Quintilian. Some scholars believe that the gestural repertoire developed considerably and became more formalized over this period,Footnote 21 or that the gestures may have had different meanings than in everyday life, or even that the Quintilian system had to be taught because it was artificial and unknown to average Romans.Footnote 22 Others, however, argue that gestures did not very much change and that Quintilian’s work was firmly rooted in tradition.Footnote 23 Jon Hall draws attention to the nature of the texts – Quintilian’s “textbook-ness” – while observing that Cicero advocated more spontaneous and intuitive gestures, something the textbook author could not afford to do.Footnote 24 While the precise interpretation of specific gestures may be contestable, our study focuses primarily on the visual presence of gestural communication, independent of semantic nuance. Regardless of the specific historical period of Cicero or Quintilian, we can confidently assert the existence of diverse manual gesticulations involving finger and hand(s) manipulations.
When speaking, Roman orators communicated with their listeners in two languages: verbal and non-verbal. The latter category included mainly vocal non-verbal factors (vox), gestures (gestus), and facial expressions (vultus).Footnote 25 The aim was to help stimulate the emotions of the listeners, which in turn was supposed to influence their judgement.Footnote 26 Romans believed that a speech delivered brilliantly, even if mediocre in content, held more power than a poorly presented great speech.Footnote 27 Quintilian emphasizes the importance of gestures in his analysis of Cicero’s Pro Ligario, highlighting that a skilled speaker would incorporate up to eight distinct gestures when delivering a sentence consisting of merely 17 words.Footnote 28
Gestures held great significance, particularly at public gatherings such as contiones, quaestiones, and other occasions where speakers addressed the people or soldiers,Footnote 29 as well as during public religious rites.Footnote 30 Public oratory played a crucial role in Roman politics, at various types of contiones and other meetings, including legislative, electoral, judicial, military, and funerary gatherings.Footnote 31 Legislative contiones provided an opportunity for influential politicians to discuss laws that had been proposed and present their views to the Roman people. According to some scholars,Footnote 32 contiones played a pivotal role in determining the fate of such legislation. They argue that proponents would withdraw a law if they sensed a lack of support from the participants, effectively avoiding a substantial blow to their reputation at the People’s Assembly.
In Republican times, contiones played a vital role in the elections of officials, allowing candidates to present themselves and seek public support from former consuls and other influential figures. Funerary or laudatory speeches also played an important role in Roman public life, constituting an essential component of funerary rites. They involved family members praising the deceased or officials speaking on behalf of the community. The oration delivered by Caesar at the funeral of his aunt, and the wife of the late C. Marius,Footnote 33 is considered an important step in his political career.Footnote 34
Following Caesar’s assassination, the Roman Republic was in turmoil, with public sentiment oscillating between grief and outrage. In this charged atmosphere, Mark Antony and Marcus Brutus, among others, delivered a series of historic speeches. Antony, a staunch ally of Caesar, swayed the masses by portraying Caesar as a benevolent ruler unjustly murdered, revealing Caesar’s will and his blood-stained cloak to incite emotions. In contrast, Brutus argued that the assassination was necessary to save the Republic from tyranny, appealing to the citizens’ sense of justice and republican values. These speeches showcased the political acumen and persuasive prowess of both men, setting the stage for the power struggle that would end the Roman Republic and usher in the Roman Empire.Footnote 35
Although political oratory may have diminished in significance during the Imperial period, especially in the context of public debate, given the declining role of the people in governance, the practice persisted. It remained an essential part of certain official acts, such as instructing voters before elections (for as long as elections continued) and providing platforms where the public could be informed about matters of state. Despite their reduced political weight, contiones and other speech-giving events still functioned as arenas for public communication between the government and the people.Footnote 36 Crucially, they were increasingly controlled by the emperor, who used them to communicate and reinforce his authority. We have an especially large number of examples from the Julio-Claudian dynasty, including from the time of Augustus.Footnote 37 Many of these speeches took the form of funeral eulogies, which played a significant role in reinforcing imperial authority and public memory.Footnote 38 During political crises, the role of contiones in propaganda and public persuasion often intensified again; this is exemplified in the rivalry between Galba and Otho in 69 CE, where oratory in contiones played a key part in securing military and public support.Footnote 39 Evidence from the correspondence between Marcus Aurelius and Fronto suggests that imperial public rhetoric retained a crucial administrative function, with the emperor expected to address not only the senatorial body but also the broader populace on diverse matters during public assemblies.Footnote 40 Although the sources are limited, it appears that consuls, praetors, and later urban prefects also presided over public-speaking events, particularly those with ceremonial purposes, such as funerals or oath-taking. By the Late Empire, their use was further restricted, likely becoming the exclusive domain of the emperor and his representatives. Ultimately, while contiones no longer shaped political decision-making as they had in the Republic, they persisted as instruments of imperial authority, public communication, and legitimacy.Footnote 41
Crowd size and composition
The substantial political and ceremonial significance of contiones and other speech-giving events justifies investigating the identity of the individuals who assembled to listen to Roman politicians and how many of them there were. The question of crowd composition has been addressed many times before.Footnote 42 The composition of the crowd itself, however, tells us little about its size. The written sources provide little assistance in this matter, as they rarely, if ever, go beyond describing the size of the crowd, as either small or large at most.Footnote 43 Consequently, attempts to estimate crowd sizes are based solely on the dimensions of the venues. For the Forum Romanum, these estimates – made in relation to elections rather than contiones – put the number of people present at 6,000, 10,000, or 15,000–20,000.Footnote 44 However, given the area of the Forum Romanum and a reasonable measure of crowd density, this estimate could be raised to at least 30,000.Footnote 45
Both the size and the composition of the crowd probably varied considerably depending on the issue being discussed, the commitment of those with a stake in the debate, the time for preparation, and even the level of the politician’s popularity across different social circles.Footnote 46 This does not change the fact that the audience (and its number) was an integral element of a speech, as Cicero made clear in De oratore: “A speaker can no more be eloquent without a large audience than a flute player can perform without a flute.”Footnote 47
Thus, the maximum number of participants in these public meetings can only be approximated. As the meetings served as platforms for conveying information, expressing opinions, and persuading others during elections and votes, certain limitations regarding the visibility of the speaker and their gestures, as well as the audibility of their speech, could have affected the maximum capacity of a specific space to accommodate people. In this paper, we present the results of analyses of the visibility of rhetorical gestures for different speaking platforms located in the Late Republican and Early Imperial Forum Romanum. While other venues were used as speaking platforms in Rome – written sources indicate that speeches were also delivered from the podium of the Capitoline Temple, the podium of the Temple of Bellona, and within the Circus FlaminiusFootnote 48 – we focus on the Forum Romanum because the other venues and their immediate surroundings are much less well understood archaeologically, making reconstructions difficult.
The main objective is to estimate, for the different case studies, the maximum number of people who could see the rhetorical gestures as a proxy for maximum crowd size. The reason for taking this approach is that written sources depict contiones in which certain members of the audience were able to see the speaker’s gestures but unable to discern the words being spoken.Footnote 49 This suggests that, in some cases, the number of those present did not fall within the range within which the speech was intelligibly audible. The approach yields measurable and reliable results that are less influenced by uncertain factors than acoustic simulations. In particular, it offers an easier way to grasp the overall crowd layout than methods focused on speech intelligibility in open areas. Although based on Roman rhetorical gestures, the methodology, in our view, is universal and could also be applied to the analysis of various public events in other cultures. Apart from the fact that the results can be viewed in the context of well-known historical events (such as Cicero’s delivery of the pro lege Manilia from the rostra vetera in 66 BCE, the contio on Metellus Nepos’s proposal to recall Pompey from the East convened at the rostra aedis Castoris in 62 BCE,Footnote 50 the speeches delivered by Mark Antony and M. Aemilius Lepidus on March 16, 44 BCEFootnote 51 from the rostra Caesaris, or the delivery of the Sixth Philippic by Cicero from the same place on January 4, 43 BCE),Footnote 52 they allow us to compare the different speaking platforms and to examine the oratorical taskscape of the Forum and changes to it more objectively. The choice of chronological range was prompted by the fact that, during this relatively short period, the Forum underwent the most dynamic changes to its spatial geometry, including the relocation of speaking platforms, while simultaneously, public assemblies experienced functional shifts driven by political changes and the rise of the Principate.Footnote 53
We shall also use the results to verify some of the hypotheses that might explain the changes that occurred in the oratorical taskscape of the Forum Romanum between the Late Republican period and the reign of Augustus.Footnote 54 Based on the results obtained, we shall present our own hypothesis regarding the desire to separate participants in contiones taking place simultaneously in different venues at the Forum.
Object of research
The subject of our study is contiones that took place in the Forum Romanum during three different – though chronologically close – periods of the forum’s development:
– Late Republican (LR): ca. 54 BCE (Fig. 1a)
Fig. 1.Forum Romanum, top views: (a) ca. 54 BCE: rostra vetera marked red, Temple of Castor and Pollux marked blue; (b) ca. 27 BCE: rostra Augusti marked red, Temple of Castor and Pollux marked blue, Temple of Divus Iulius marked yellow; (c) ca. 14 CE: rostra Augusti marked red, Temple of Castor and Pollux marked blue, Temple of Divus Iulius marked yellow.

-
– Early Augustan (EA): ca. 27 BCE (Fig. 1b)
-
– Late Augustan (LA): ca. 14 CE (Fig. 1c)

For the case of the Forum Romanum ca. 54 BCE, we analyzed two speaking platforms (see Fig. 1a):
– rostra vetera
– rostra aedis Castoris (podium of the Temple of Castor and Pollux)
For the case of the Forum Romanum ca. 27 BCE and ca. 14 CE, on the other hand, we analyzed three speaking platforms (see Fig. 1b–1c):
– rostra Augusti
– rostra aedis Castoris
– rostra aedis divi Iulii (podium of the Temple of Divus Iulius)Footnote 55
The virtual 3D reconstructions prepared for research purposes replicate the spatial geometry, the appearance of buildings, and the interrelations between those buildings as known from the products of the Digitales Forum Romanum project,Footnote 56 with minor modifications (see Supplementary Files S1–S3).Footnote 57
The rostra vetera (Republican rostra), which was adjacent to the Comitium, was the primary platform for public speaking in Rome. However, Roman politicians also used alternative venues when necessary.Footnote 58 We know that between 161 and 100 BCE, there was a transfer of the comitia from the Comitium to the area of the Temple of Castor and Pollux.Footnote 59 The speaking platform likely emerged there due to the remodeling of the Temple of Castor and Pollux around the middle of the 2nd c. BCE, referred to as Temple IA.Footnote 60 This platform was further developed during a major reconstruction initiated by L. Caecilius Metellus Dalmaticus (Temple II), which began around 117 BCE.Footnote 61 Historical records indicate that Scipio Aemilianus delivered a speech from the temple’s podium as early as 142 BCE.Footnote 62 We know of several contiones, during which crowds gathered in front of the temple, that took place in the late 60s and early 50s of the 1st c. BCE.Footnote 63 A series of contiones was certainly held there in November 44 BCE: first, Mark Antony spoke against Octavian,Footnote 64 then a contio was convened by the tribune of the plebs, Ti. Cannutius, where both the tribune and Octavian spoke against Antony.Footnote 65
The oratorical taskscape of the Forum Romanum underwent major changes during and just after the civil wars. The initial phase of this transformation can be attributed to Caesar’s interventions, which, as DaviesFootnote 66 aptly observes, “overwhelmed constraints on architectural propaganda” in parts of the Forum. This architectural reconfiguration represented a calculated effort to reshape the physical and symbolic taskscape of Rome’s central public space, thereby consolidating Caesar’s political authority through the built environment. The Forum underwent a significant functional and symbolic transformation, transitioning from its traditional role as predominantly a political arena – a space of dignitas – to an environment increasingly oriented towards the aggrandizement and promotion of charismatic individuals.Footnote 67 According to Cassius Dio’s account,Footnote 68 the decision to build the new rostra in a different location was Caesar’s, and it was under his dictatorship that its construction began. Coarelli believes that the date of 44 BCE given by Dio refers to the completion of the construction of the speaking platform and its dedication by Antony and that the project had begun perhaps in 45 BCE.Footnote 69 Muth hypothesizes that Caesar’s decision stemmed from the fact that the Basilica Aemilia not only limited the number of people who could gather in front of the old rostra, but even restricted the number of people who could hear the speeches delivered from there intelligibly.Footnote 70 Written sources mention several occasions on which speeches were delivered from this speaking platform.Footnote 71
A new rostra (rostra aedis divi Iuli) appeared in the Forum Romanum at the dedication of the Temple to Divus Iulius on August 18, 29 BCE.Footnote 72 The construction of the temple had begun as early as 42 BCE;Footnote 73 therefore, the available space in front of the Temple of Castor and Pollux was reduced. Most scholars believe that the rostra was an integral part of the temple podium,Footnote 74 as was the case with the Temple of Castor and Pollux. Coarelli argues that it was a free-standing platform in front of the temple,Footnote 75 but his arguments are not convincing (the traces he interprets as remnants of this rostra are more likely of Late Antique origin).Footnote 76 Although it is likely that many speeches of different natures were delivered from this place, we have secure evidence only for two funeral eulogies.Footnote 77
The fate of the rostra aedis Castoris is debated. One view holds that with the dedication of the temple (or perhaps even with its commencement),Footnote 78 the platform went out of use, as the Temple of Divus Iulius somewhat limited the space in front of it. While we know that the speaking platform was eventually removed altogether, there is disagreement about the timing. Taylor argues that the platform remained in place during Tiberius’s restoration after the fires of 14 and 9 BCE,Footnote 79 interpreting this as evidence that the podium maintained its role as a rostra – a view also supported by Ulrich.Footnote 80 However, the platform must have been removed by the beginning of the 3rd c. CE at the latest, since the surviving fragment of the Forma Urbis Romae (18bc) shows the temple without the speaking platform.Footnote 81
Thus, we have a complete picture of the physical setting for the oratorical taskscape of the Forum Romanum in the Late Republican and Early Imperial periods and can compare the visibility of rhetorical gestures for individual rostra while considering the changes that occurred over time. As the entire Forum Romanum underwent a rather far-reaching transformation during the period in question, we will also trace hypothetical scenarios for the rostra vetera and the rostra Augusti in which we examine the visibility of gestures from the rostra Augusti, but in ca. 54 BCE, and from the Republican rostra, but in ca. 27 BCE and ca. 14 CE.
Visibility analysis
Methods
The analysis of gesture visibility relies on the findings of a field experiment conducted by Reference Kopij, Głomb and PopławskiKopij, Głomb, and Popławski,Footnote 82 which aimed to establish the maximum distance from which rhetorical gestures are observable. The study involved categorizing gestures sourced from ancient Roman rhetorical treatises into three classes based on their level of detail and the size of the gesturing body part (Fig. 2).
Examples of gestures used in the experiment: (a–b) gestures of the first class; (c–d) gestures of the second class; (e–f) gestures of the third class (Aldrete Reference Aldrete1999, figures 1, 5, 7, 14, and 15. © 1999 Johns Hopkins University Press. Reprinted with permission of Johns Hopkins University Press.)

The first category involves the fingers, the second the hand, and the third the arm (or arms). The task for participants in the experiment was to identify, at different distances, one of the five gestures in each class, as demonstrated by a “mock speaker.” The procedure was based on similar experiments in psychology.Footnote 83 According to the results, the recognition of gestures in the first class (which depend on the arrangement of the fingers), becomes statistically random at distances ranging from 80 to 85 m from the speaker. Gestures in the second class (which involve recognizing the arrangement and orientation of the entire hand), cease to be visible between 250 and 260 m from the speaker. The limit of visibility of gestures in the third class was not determined in the study because it exceeded the extent of the space in the Forum. In addition, a regression analysis was performed to identify four zones of gesture visibility: Complete/Near-Complete Visibility – C/NCV (1–0.9); High Visibility – HV (0.9–0.7); Average Visibility – AV (0.7–0.4); and Low Visibility – LV (0.4–0.2). Due to insufficient data for milestones close to the speaker, in the case of the first class of gestures it was only possible to identify two of the four visibility zones: the Average Visibility (AV) zone (or rather the combined Complete/Near-Complete Visibility, High Visibility and Average Visibility zones, called the “AV zone” for simplicity’s sake), which reached up to 66 m from the speaker, and the Low Visibility (LV) zone, which lay between 66 and 83 m from the speaker (see Table 1). It is worth noting here that between 25 and 80 m, recognition remained constant (about 40–50%).Footnote 84 The visibility zones resulting from the regression analysis can be seen as a proxy for the overall visual acuity of the Roman population, who were unaware of effective ways to improve their vision.
Visibility zone intervals for a given gesture class. C/NCV = Complete/Near-Complete Visibility, HV = High Visibility, AV = Average Visibility, LV = Low Visibility. (Kopij et al. Reference Kopij, Głomb and Popławski2023, table 9.)

Visibility analyses were conducted using the Viewshed function in Exploratory 3D Analysis in ArcGIS Pro 2.9, utilizing the virtual 3D reconstructions of venues that had been custom made for each period of the Forum Romanum (Supplementary Files – S4).
In designing the analyses, we relied on the methodology proposed by Reference Kopij, Głomb and PopławskiKopij, Głomb, and Popławski.Footnote 85 Accordingly, each study involves two overlapping analyses for points that differ in height by 0.6 m, which reflects the fact that gestures can be displayed at various heights, from abdomen to head level, or even slightly above. We assumed the heights of the points analyzed to be 1.15 m and 1.75 m from the level of the construction upon which the gesturing individual was standing. We adopted this range of heights based on estimates of the average height of male inhabitants of Italy during the Roman period, which Kron estimates at 1.683 m.Footnote 86 To maximize the realism of the analyses, the pavement and other areas in the Forum Romanum where spectators might have stood were raised by 1.50 m relative to reality (without simultaneously raising the level of buildings), to ensure that the results of the analyses represented the eye level of the gathered Romans. This was necessary because the software used in the visibility analysis requires a plane to demonstrate visibility or its absence from a specified height. To reveal the potential spaces beneath the porticoes, typically concealed by a roof, we made a horizontal cut, trimming the virtual reconstructions at a specific point and thereby removing the roofs and upper parts of buildings.
We assumed in our analyses that the gestures could be seen distinctly at up to an angle of 75 degrees (especially as the orator could turn his body to maximize the audience), resulting in a total horizontal viewing angle of 150 degrees. This allowed us to consider a speaker’s ability to rotate around their axis, not only exposing hand gestures to people directly in front of them, but also aligning with the “maximum visibility model” we employed (the limitations of the model will be further discussed in the Conclusions).
The visibility analysis, as mentioned, included two groups of hand gestures, which differed in their level of detail. The first group included gestures where it is important to see the arrangement of the fingers of the hand. The second group included gestures where it is important to recognize the arrangement and orientation of the whole hand.Footnote 87 The analysis took place in three steps: the first two steps were related to the first class of gestures and involved exploring their maximum visibility and examining them by means of the results of a regression analysis, divided into the zones of visibility. Reference Kopij, Głomb and PopławskiKopij, Głomb, and Popławski were unable to capture the initial two areas of visibility for the first class of gestures, resulting in only the last two levels being utilized in the analysis. In contrast, in the third step, the broader spectrum of visibility levels resulting from the results of the regression analysis was used to study the visibility of the second class of gestures. In this case, the Low Visibility zone was excluded due to the distances obtained extending beyond the venues.
Finally, to examine our hypothesis regarding intentionally separating participants at two simultaneous events to the greatest extent possible, we conducted visibility analyses aimed at determining the level of overlap between hypothetical crowds during various time periods. Additionally, we considered the circumstances that existed after the end of Caesar’s dictatorship and before the commencement of the construction of the temple dedicated to him. These analyses were conducted for both the total visibility of the first-class gestures and for their visibility in the Average Visibility zone.
Results
The first step of the gesture visibility analysis was to study the visibility of only the first class of gestures (Fig. 2a–b), whose maximum visibility distance was determined in the experiment to be between 80 and 85 m.Footnote 88 For practical purposes, we adopted the mean of 83 m from the speaker as a threshold.
The area in front of the Republican rostra vetera (ca. 54 BCE) from which the gestures were visibleFootnote 89 covered approx. 5,601 m2 (Fig. 3). The relevant area in front of the rostra Augusti, on the other hand, covered approx. 5,653 m2 for the Forum ca. 27 BCE (Fig. 4) and 5,403 m2 for the Forum ca. 14 CE (Fig. 5). The difference between the “capacity” of the rostra vetera (ca. 54 BCE) and the “capacity” of the rostra Augusti (ca. 27 BCE) is not large, amounting to barely 52 m2, but the “capacity” of the rostra Augusti (ca. 14 CE) stands out more clearly from both, as the available area is smaller by approx. 200 m2 and 250 m2, respectively.
Results of the first class of gesture visibility analysis for the ca. 54 BCE rostra vetera with regression AV for Average Visibility zone; LV for Low Visibility zone; NV for the nonvisible area.

Results of the first class of gesture visibility analysis for the ca. 27 BCE rostra Augusti with regression AV for Average Visibility zone; LV for Low Visibility zone; NV for the nonvisible area.

Results of the first class of gesture visibility analysis for the ca. 14 CE rostra Augusti with regression AV for Average Visibility zone; LV for Low Visibility zone; NV for the nonvisible area.

The differences detected for the rostra aedis Castoris are much greater. The space available in front of the temple in the Forum ca. 54 BCE was approx. 5,963 m2 (Fig. 6), while for the Forum ca. 27 BCE and the Forum ca. 14 CE it was 4,368 m2 (Fig. 7) and 4,465 m2 (Fig. 8), respectively. The difference remains very clear even if we exclude the space occupied by the Gradus Aurelii, since then the available space is approx. 5,219 m2. In any case, such a step does not seem justified, as arguably the vast majority of that area was available to the participants in contiones. The reduction in available space was primarily due to the construction of the Temple of Divus Iulius (and later also the Arch of Augustus/Parthian Arch). It also seems that the rebuilding of the Basilica Aemilia, especially the addition of the Porticus of Gaius and Lucius, had no negative impact on the amount of space available. On the contrary, the removal of the tabernae novae slightly increased the available space in this part of the Forum.
Results of the first class of gesture visibility analysis for the ca. 54 BCE rostra aedis Castoris with regression AV for Average Visibility zone; LV for Low Visibility zone; NV for the nonvisible area.

Results of the first class of gesture visibility analysis for the ca. 27 BCE rostra aedis Castoris with regression AV for Average Visibility zone; LV for Low Visibility zone; NV for the nonvisible area.

Results of the first class of gesture visibility analysis for the ca. 14 CE rostra aedis Castoris with regression AV for Average Visibility zone; LV for Low Visibility zone; NV for the nonvisible area.

As mentioned earlier, the construction of the Temple of Divus Iulius began in 42 BCE, and the inauguration of both the building itself and the associated rostra took place in 29 BCE. In ca. 27 BCE, the available space in front of the rostra aedis divi Iulii was approx. 5,022 m2 (Fig. 9), while ca. 14 CE, it was slightly more, at approx. 5,077 m2 (Fig. 10). The increase in available space of approx. 55 m2 was related to the demolition of the tabernae novae and the construction of the Porticus of Gaius and Lucius.
Results of the first class of gesture visibility analysis for the ca. 27 BCE rostra aedis divi Iulii with regression AV for Average Visibility zone; LV for Low Visibility zone; NV for the nonvisible area.

Results of the first class of gesture visibility analysis for the ca. 14 CE rostra aedis divi Iulii with regression AV for Average Visibility zone; LV for Low Visibility zone; NV for the nonvisible area.

In the next step, we performed a study of the visibility of the first class of gestures using the results of the regression analysis.Footnote 90 The visibility zone (with a radius of 83 m), was divided into two sub-zones corresponding to Average Visibility and Low Visibility and covering areas of radius 1–66 m and 66.1–83 m from the speaker, respectively.
For the rostra vetera (ca. 54 BCE), the Average Visibility area covered approx. 4,580 m2, while the Low Visibility area covered approx. 1,021 m2 (Fig. 3). In ca. 27 BCE, for the rostra Augusti, the Average Visibility area equated to approx. 4,269 m2 and the Low Visibility zone to approx. 1,384 m2 (Fig. 4), while ca. 14 CE, the Average Visibility zone was approx. 4,186 m2 and the Low Visibility zone was approx. 1,227 m2 (Fig. 5). The difference of approx. 83 m2 between the two periods in the Average Visibility zone is due to the demolition of the tabernae novae and the construction of the Porticus of Gaius and Lucius in front of the Basilica Aemilia. The same developments were responsible for the Low Visibility zone being slightly reduced (by less than 50 m2).
In the case of the Temple of Castor and Pollux, the Average Visibility zone for the Forum ca. 54 BCE equated to approx. 4,823 m2 and Low Visibility zone to approx. 1,141 m2 (Fig. 6); for the Forum ca. 27 BCE, these zones covered approx. 3,495 m2 and approx. 873 m2 (Fig. 7), respectively; and for the Forum ca. 14 CE, approx. 3,472 m2 and approx. 993 m2 (Fig. 8), respectively. As in the analysis of the total visibility of the first class, the differences between the Forum ca. 54 BCE and in later periods are the most apparent. The area of the Average Visibility zone has decreased by as much as approx. 1,328 m2 relative to the Forum ca. 27 BCE and approx. 1,351 m2 relative to the Forum ca. 14 CE. This difference would be significantly reduced (to approx. 584–607 m2) if the area of the Gradus Aurelii was excluded from the analysis, but, for the reasons we outlined above, such a step does not appear to be justified.
For the case of the rostra aedis divi Iulii, the Average Visibility zone was approx. 3,875 m2 ca. 27 BCE (Fig. 9) and 3,934 m2 ca. 14 CE (Fig. 10), while the area of the Low Visibility zone covered approx. 1,147 m2 ca. 27 BCE and 1,143 m2 ca. 14 CE. As can be seen, therefore, the area of the Average Visibility zone increased slightly before ca. 14 CE (by approx. 60 m2), which was probably due in part to the replacement of the tabernae novae with the Porticus of Gaius and Lucius, and to a slight rebuilding of the front of the podium of the speaking platform itself, which allowed the speaker to position himself closer to the center of the rostra. The negligible difference between the areas of the Low Visibility zones, however, suggests that the possible slight shift in the speaker’s position between ca. 27 BCE and ca. 14 CE was of less significance than the changes associated with the construction of the portico adjacent to the Basilica Aemilia.
The final step of the visibility study was the investigation, using the results of regression analyses, of the second class of gestures.Footnote 91 In this case, due to the limited space, we only considered the results for Complete/Near-Complete Visibility (C/NCV), High Visibility (HV), and Average Visibility (AV) zones, with the plots for the last of these already partly outside the modeled area, meaning they should only be considered a rough approximation.
If we study the rostra vetera (ca. 54 BCE), the area of the Complete/Near-Complete Visibility zone is approx. 246 m2, the High Visibility zone approx. 5,915 m2, and the Average Visibility zone approx. 2,016 m2 (Fig. 11). For the rostra Augusti ca. 27 BCE, the area of the Complete/Near-Complete Visibility zone equals approx. 207 m2, the High Visibility zone approx. 6,035 m2, and the Average Visibility zone approx. 2,835 m2 (Fig. 12). For the rostra Augusti ca. 14 CE, by contrast, the Complete/Near-Complete Visibility zone equals approx. 208 m2, the High Visibility zone approx. 5,805 m2, and the Average Visibility zone approx. 2,291 m2 (Fig. 13).
Results of the second class of gesture visibility analysis for the ca. 54 BCE rostra vetera with regression C/NCV for Complete/Near Complete Visibility zone; HV for High Visibility zone; AV for Average Visibility zone; NV for the nonvisible area.

Results of the second class of gesture visibility analysis for the ca. 27 BCE rostra Augusti with regression C/NCV for Complete/Near Complete Visibility zone; HV for High Visibility zone; AV for Average Visibility zone; NV for the nonvisible area.

Results of the second class of gesture visibility analysis for the ca. 14 CE rostra Augusti with regression C/NCV for Complete/Near Complete Visibility zone; HV for High Visibility zone; AV for Average Visibility zone; NV for the nonvisible area.

As we can see, the demolition of the old speaking platform and the construction of a new one in a different location slightly reduced even the area of the Complete/Near-Complete Visibility zone (by approx. 40 m2). This difference is due not so much to the change of location, and thus the immediate vicinity of the rostra, as to differences in the shapes of the fronts of the platforms. The Republican rostra was constructed on a circular plan (as part of the Comitium), while the front of the rostra Augusti is straight (the rostra Caesaris, not analyzed by us, seems to have duplicated the plan of the Republican rostra, but this was changed after the dictator’s death). The changes in the High Visibility zone are interesting. First, between ca. 54 BCE and ca. 27 BCE, the area of this zone increased (by approx. 120 m2), then it decreased between ca. 27 BCE and ca. 14 CE (by approx. 230 m2). The first development can primarily be explained by the displacement of the rostra to a different location, causing thus, together with other changes in the surrounding built environment, a complete alteration in the geometry of the venue. On the other hand, the decrease in the area of the High Visibility zone for the second class of gestures between ca. 27 BCE and ca. 14 CE is mainly due to the rebuilding of the Basilica Aemilia and the construction of the Porticus of Gaius and Lucius. The changes in the Average Visibility zones – estimates of the area of which, we stress again, must be treated with caution – are due to changes in the location of the speaking platform between ca. 54 BCE and ca. 27 BCE, but also to changes in the built environment: the construction of Basilica Iulia and the Temple of Divus Iulius. The differences between the Forum in ca. 27 BCE and in ca. 14 CE, on the other hand, are due to the construction of both the Porticus of Gaius and Lucius and the Parthian Arch of Augustus.
In the case of the Temple of Castor and Pollux, the area of the Complete/Near-Complete Visibility zone is identical for all periods studied and covers approx. 240 m2. Differences become apparent only in zones of lower visibility. The area of the High Visibility zone ca. 54 BCE equals approx. 6,336 m2,Footnote 92 ca. 27 BCE approx. 4,622 m2, and ca. 14 CE approx. 4,732 m2. The area of the Average Visibility zone, on the other hand, (the estimation of which should, however, be treated with caution) equals approx. 5,277 m2 ca. 54 BCE, approx. 4,580 m2 ca. 27 BCE and approx. 4,273 m2 ca. 14 CE (Figs. 14–16).
Results of the second class of gesture visibility analysis for the ca. 54 BCE rostra aedis Castoris with regression C/NCV for Complete/Near Complete Visibility zone; HV for High Visibility zone; AV for Average Visibility zone; NV for the nonvisible area.

Results of the second class of gesture visibility analysis for the ca. 27 BCE rostra aedis Castoris with regression C/NCV for Complete/Near Complete Visibility zone; HV for High Visibility zone; AV for Average Visibility zone; NV for the nonvisible area.

Results of the second class of gesture visibility analysis for the ca. 14 CE rostra aedis Castoris with regression C/NCV for Complete/Near Complete Visibility zone; HV for High Visibility zone; AV for Average Visibility zone; NV for the nonvisible area.

The significant reduction in the High Visibility area between ca. 54 BCE and 27 BCEFootnote 93 was primarily due to the construction of the Temple of Divus Iulius. This building not only took the place of the earlier Gradus Aurelii, which had presumably been available for contionales in front of the Temple of Castor and Pollux, but also obstructed the view for all spectators who might have stood between the Gradus Aurelii/Temple of Divus Iulius and the Basilica Aemilia, as well as to the southeast of the basilica. The slight increase in the area of the High Visibility zone between ca. 27 BCE and ca. 14 CE (approx. 110 m2) is instead explained by the construction of the Porticus of Gaius and Lucius. The area of the Average Visibility zone between ca. 54 BCE and ca. 27 BCE is reduced (by approx. 697 m2) due to the construction of the Temple of Divus Iulius, the construction of the Curia Iulia closer to the Basilica Aemilia than its predecessor, the Curia Cornelia, and the erection of the Arch of Augustus next to the new Imperial rostra. A further reduction in this zone between ca. 27 BCE and ca. 14 CE (by approx. 307 m2) was mainly due to the rebuilding of the Temple of Concordia.
In the case of the rostra aedes divi Iulii, the area of the Complete/Near-Complete Visibility zone is similar for ca. 27 BCE and ca. 14 CE, at approx. 230 m2 and 223 m2, respectively. Minor differences here may be due to a slight change in the speaker’s position (related to the remodeling of the front of the temple podium) and we should disregard them. There are greater differences between the areas of the High Visibility zone in these periods. In ca. 27 BCE it covers approx. 5,663 m2 and in ca. 14 CE, approx. 5,442 m2. The difference of approx. 221 m2 is due to the construction of the Porticus of Gaius and Lucius. It is worth noting that this is the only case where the replacement of tabernae novae by this structure negatively affected the visibility of gestures. The area of the Average Visibility zone, instead, increased between ca. 27 BCE and ca. 14 CE. In the former case, it covers approx. 5,901 m2 and in the latter, approx. 6,102 m2. This difference (of approx. 201 m2) is due to the reconstruction of the Temple of Concordia. It is interesting to note that, depending on the location of the speaking platform, this remodeling could have a positive effect on the area of the Average Visibility zone – as in this case – or a negative one, as in the case of the Temple of Castor and Pollux discussed above. This can be attributed to the different geometry of the two venues (Figs. 17–18).
Results of the second class of gesture visibility analysis for the ca. 27 BCE rostra aedis divi Iulii with regression C/NCV for Complete/Near Complete Visibility zone; HV for High Visibility zone; AV for Average Visibility zone; NV for the nonvisible area.

Results of the second class of gesture visibility analysis for the ca. 14 CE rostra aedis divi Iulii with regression C/NCV for Complete/Near Complete Visibility zone; HV for High Visibility zone; AV for Average Visibility zone; NV for the nonvisible area.

In addition to the above, we decided to test two alternative scenarios. First, we checked what the visibility of gestures would look like if the Republican rostra remained in place through the Forum ca. 27 BCE and ca. 14 CE, but all other changes occurred as reflected in our reconstructions (Figs. 19–20).
Results of the first class of gesture visibility analysis for the hypothetical scenario of rostra vetera at the ca. 27 BCE Forum with regression AV for Average Visibility zone; LV for Low Visibility zone; NV for the nonvisible area.

Results of the first class of gesture visibility analysis for the hypothetical scenario of rostra vetera at the ca. 14 CE Forum with regression AV for Average Visibility zone; LV for Low Visibility zone; NV for the nonvisible area.

Second, we checked what the results of the visibility analysis would look like for the Roman Forum ca. 54 BCE with the Imperial rostra (Fig. 21). The first class of gestures would have been visible from the rostra vetera, ca. 27 BCE, at approx. 6,134 m2, and from the rostra vetera, ca. 14 CE, at approx. 5,990 m2. In contrast, during ca. 54 BCE, the first class of gestures would be visible from the rostra Augusti over an area of approx. 6,337 m2.
Results of the first class of gesture visibility analysis for the hypothetical scenario of rostra Augusti at the ca. 54 BCE Forum with regression AV for Average Visibility zone; LV for Low Visibility zone; NV for the nonvisible area.

If we consider the results of the regression analysis, the Average Visibility zone of the first class of gestures for the rostra vetera at the Forum Romanum ca. 27 BCE would cover approx. 4,669 m2 and at the Forum ca. 14 CE, approx. 4,550 m2. In contrast, the Low Visibility zone area would be approx. 1,573 m2 and 1,545 m2 respectively. For the rostra Augusti on the Forum Romanum ca. 54 BCE, the Average Visibility zone would cover approx. 4,644 m2 and the Low Visibility zone approx. 1,693 m2.
Estimating crowd sizes
Based on the results presented above, we estimated the maximum sizes of the crowds that could attend the contiones held in the Forum and read the speakers’ gestures intelligibly.Footnote 94 To do so, we used the method proposed by Reference Kopij, Głomb and PopławskiKopij, Głomb, and Popławski.Footnote 95 First, we used only the results of the maximum visibility analysis of gestures in the first class, taking into account the different crowd density factors of between one and five persons/m2. Admittedly, research has shown that the limit of five people/m2 could be exceeded under appropriate circumstances, but this was usually only for a short time.Footnote 96 The framework we have adopted appears to be the most reasonable in terms of estimating the maximum number of participants at contiones. As shown in Table 2, the rostra vetera could accommodate between approx. 5,601 and 28,005 people, depending on the density of the crowd. In contrast, the rostra Augusti could accommodate between approx. 5,653 and 28,265 people ca. 27 BCE and between approx. 5,403 and 27,015 people ca. 14 CE.
Calculation of crowd size for the Republican and Imperial rostra for maximum visibility of the first class of gestures.

Table 3 shows the results of the same analysis for a crowd gathered in front of the Temple of Castor and Pollux. As can be seen, in ca. 54 BCE, the contiones taking place there could be witnessed by between approx. 5,963 and 29,815 people. For the Forum ca. 27 BCE, the crowd decreases to a range between approx. 4,368 and 24,840 people, only to increase again slightly for the Forum ca. 14 CE to between approx. 4,465 and 22,325 people.
Calculation of crowd size for the Temple of Castor and Pollux for maximum visibility of the first class of gestures.

In Table 4, we include the results of the crowd estimation for contiones held in front of the Temple of Divus Iulius. Differences between the Forum in ca. 27 BCE and in ca. 14 CE are not significant. In the former case, a contio taking place here could have been witnessed by a crowd of between approx. 5,022 and 25,110 people, while in the latter case, the figures are approx. 5,077 to 28,385 people.
Calculation of crowd size for the rostra aedis divi Iulii for maximum visibility of the first class of gestures.

Finally, for comparison, hypothetical scenarios involving the rosta vetera in the Augustan “settings” and the rostra Augusti in the Republican “setting” were also considered. The first scenario aims to demonstrate how the results of the analysis would appear if all changes occurred in the Forum except for the replacement of the rostra vetera with the rostra Caesaris/Augusti. The second scenario assumes that the construction of the rostra Caesaris/Augusti was predominantly planned within the context of the Forum ca. 54 BCE. This will help us discern whether Caesar’s intention was to increase the venue’s capacity, even if, in reality, the rostra Augusti was primarily utilized in the context of the Forum ca. 27 BCE and its subsequent phases. The results of crowd-size estimations for these two cases are shown in Table 5. The hand gestures of a speaker presenting from the rostra Augusti would have been seen by a crowd size ranging from approx. 6,337 to 31,685 people. On the other hand, approx. 6,134–30,670 people could have been in front of the rostra vetera ca. 27 BCE, and approx. 5,990–29,950 ca. 14 CE.
Calculation of crowd size for the hypothetical scenarios of the rostra Augusti at the Forum Romanum ca. 54 BCE and the rostra vetera at the Forum Romanum ca. 27 BCE and ca. 14 CE for maximum visibility of the first class of gestures.

However, it is important to acknowledge that research on crowd behavior at similar public events in modern times indicates that crowd density is not the same throughout a venue. Usually, the density is higher closer to the speaker and decreases with distance.Footnote 97 Therefore, we decided to take into account the decrease of the crowd density coefficient with the decrease of the gesture visibility resulting from the regression analysis.Footnote 98 We assumed that for the area of the Complete/Near-Complete Visibility zone, crowd density reaches a theoretical maximum of five people/m2. Then, as the degree of visibility decreases, we reduced the crowd density by one person/m2, giving us four people/m2 for the High Visibility zone, three people/m2 for the Average Visibility zone, and two people/m2 in the Low Visibility zone.
The results of estimating crowd size using this method for the rostra vetera and rostra Augusti are shown in Table 6. As can be seen, this approach changes the picture somewhat as, theoretically, the largest crowd able to intelligibly read the gestures of the speakers would have been witnessing a speech from the rostra vetera. In subsequent phases, this number slightly but steadily decreases (by approx. 210 and 550 people ca. 27 BCE and ca. 14 CE, respectively, relative to the Forum ca. 54 BCE). Although the difference in total between the rostra vetera ca. 54 BCE and the rostra Augusti ca. 27 BCE is not large, it is worth noting that the number of people who would theoretically fit into the Average Visibility zone falls by approx. 950 people. The small difference in the total is, therefore, due to the expansion of the Low Visibility zone after the position of the rostra was shifted. This shows that, although the gestures of the speakers were observed by a similar number of people in both periods, in Republican times, many more attendees saw them at least to an average degree.
Calculations of crowd sizes for the rostra vetera and rostra Augusti for the first class of gestures including the results of the regression analysis (AV = Average Visibility, LV = Low Visibility).

Table 7 shows the results of a similar analysis for contiones held in front of the Temple of Castor and Pollux. In this case, unsurprisingly, the number of people able to see the gestures drops significantly (by approx. 4,000 people) between ca. 54 BCE and the Forum ca. 27 BCE and ca. 14 CE. In this case, the decrease is noticeable in both the Average Visibility and the Low Visibility zones.
Calculations of crowd sizes for the podium of the Temple of Castor and Pollux in all periods for the first class of gestures including the results of the regression analysis (AV = Average Visibility, LV = Low Visibility).

We also estimated the crowd size taking into account the results of the regression analysis for the rostra aedes divi Iulii. The results are included in Table 8. In this case, the number of people who could see the gestures increased slightly between ca. 27 BCE and ca. 14, CE by approx. 169 people. At the same time, it is worth noting that the number of people in the Average Visibility zone increased slightly more, by approx. 177 individuals.
Calculations of crowd sizes for the rostra aedes divi Iulii in all periods for the first class of gestures including the results of the regression analysis (AV = Average Visibility, LV = Low Visibility).

The next step in estimating the crowd size for each speaking platform was to use the results of the regression analysis for the visibility of the second class of gestures, which is characterized by a lower level of detail. We reiterate that, in this case, we did not determine the area of the Low Visibility zone, as it extended beyond the area we were modelling (and arguably beyond the area of the Forum Romanum itself), and that the results for the Average Visibility zone should be treated with caution, as parts of this zone may also have extended beyond the modelled area.
The results for the rostra vetera and the rostra Augusti can be seen in Table 9. The trends remain similar to those already observed when estimating crowd size with the first class of gestures. The number of people able to see gestures in the second class increases between ca. 54 BCE and ca. 27 BCE (alongside the change in the location of the rostra) from approx. 30,940 to approx. 33,680 people (i.e., by approx. 2,740 people). Later, however, between ca. 27 BCE and ca. 14 CE, it decreases to approx. 31,130 persons (i.e., by approx. 2,550 persons). It is, however, worth noting that the differences are much smaller if we consider the Complete/Near-Complete Visibility and High Visibility zones as most certain given the limitations of our models. Then, the difference in “capacity” between the rostra vetera and the rostra Augusti is barely ca. 285 people (increasing from approx. 24,890 to. 25,175 people over time). It then drops to approx. 24,260 persons before ca. 14 CE; that is, to a level below even that of the rostra vetera ca. 54 BCE.
Calculations of crowd sizes for the rostra vetera and rostra Augusti for the second class of gestures including the results of the regression analysis. C/NCV = Complete/Near-Complete Visibility, HV = High Visibility, AV = Average Visibility.

Table 10 presents the results of estimating the maximum crowd size for the rostra aedis Castoris in all periods. Again, trends resembling those for the first class of gestures are evident. We observe a large decrease in the “capacity” of this venue between ca. 54 BCE and ca. 27 BCE, by as much as approx. 8,950 individuals (from approx. 42,375 to 33,430 persons). Between ca. 27 BCE and ca. 14 CE, there is a much smaller decrease of another approx. 480 individuals. The same is true if we consider only the Complete/Near-Complete Visibility and High Visibility zones: the decrease in the size of the maximum crowd is still very pronounced (approx. 6,860 people); however, in this case, there is an increase in capacity between ca. 27 BCE and ca. 14 CE (by approx. 445 people).
Calculations of crowd sizes for the podium of the Temple of Castor and Pollux for the second class of gestures including the results of the regression analysis. C/NCV = Complete/Near-Complete Visibility, HV = High Visibility, AV = Average Visibility.

The results of the same analysis for the rostra aedes divi Iulii, ca. 27 BCE and ca. 14 CE are shown in Table 11. For this venue, the change in capacity is negligible (approx. 320 individuals in favor of the ca. 27 BCE rostra). However, the difference increases if we exclude the Average Visibility area from the analysis, favoring the speaking platform from ca. 27 BCE by approx. 920 persons. In this case, therefore, the trend of change is opposite to that for the crowd estimation based on analyses of the visibility of more subtle gestures.
Calculations of crowd sizes for the rostra aedes divi Iulii in all periods for the second class of gestures including the results of the regression analysis. C/NCV = Complete/Near-Complete Visibility, HV = High Visibility, AV = Average Visibility.

To better understand changes in the oratorical taskscape of the Forum Romanum between the decline of the Republic and the Early Imperial period, we also estimated crowd sizes for hypothetical scenarios assuming the embedding of the rostra Augusti in the setting of the Forum Romanum, ca. 54 BCE and the rostra vetera in the setting of the main square of Rome ca. 27 BCE and ca. 14 CE. The results are shown in Table 12. In this case, the largest “capacity,” amounting to an average crowd density factor of 3 (approx. 19,000 people), is the rostra Augusti at the Forum Romanum ca. 54 BCE. Embedding the rostra vetera in the Forum ca. 27 BCE results in a crowd that is smaller by approx. 600 people (“capacity” approx. 18,400), and embedding it in the Forum ca. 14 CE results in a crowd that is reduced by a further approx. 430 people (to approx. 17,970 people).
Calculation of crowd size for the hypothetical scenarios of rostra Augusti at the Republican Forum and Republican rostra at Augustan Forum for the maximum visibility of the first class of gestures.

A similar trend can be observed for the same type of exercise taking into account the results of the regression analysis (see Table 13). In this case, however, the difference between the “capacities” of the rostra Augusti ca. 54 BCE and the rostra vetera ca. 27 BCE is much smaller (by approx. 160 individuals). It is worth noting here, however, that the rostra vetera ca. 27 BCE performs slightly better in terms of the “capacity” of the Average Visibility zone (by approx. 80 people), which is partially offset by a smaller Low Visibility zone. The differences between the rostra vetera ca. 27 BCE and ca. 14 CE, in contrast, are similar to the results of the maximum visibility analysis.
Calculation of crowd size for the hypothetical scenarios of rostra Augusti at the Republican Forum and rostra vetera at ca. 27 BCE and ca. 14 CE Forum for the first class of gestures including the results of the regression analysis. AV = Average Visibility, LV = Low Visibility.

These results can be juxtaposed with the results for the real-life scenarios, as shown in Table 14, to highlight how the “capacity” of individual venues was affected by changes in the surrounding built environment. As can be seen, in each case, the number of people able to perceive the gestures made by the speakers is higher in the case of the hypothetical scenarios.
Comparison of the “capacity” of real venues with hypothetical scenarios for the first gesture class. Hypothetical scenarios are highlighted in grey.

The results of estimating the crowd size are similar when we take into account the regression analysis for the first class of gestures (see Table 15). Again, in each successive period, the hypothetical venues have a larger “capacity” than the venues that were actually used. Using the rostra Augusti in the context of the Forum ca. 54 BCE would increase the size of the crowd who could perceive the gestures of the speakers by as many as approx. 1,530 people. It should be noted, however, that most of this increase (approx. 1,340) is in the Low Visibility zone. An even greater variation in the “capacity” of the two venues (approx. 1,580 persons) is observed for ca. 27 BCE. In that case, however, a large part of the difference is attributable to the Average Visibility zone (approx. 1,200 persons). A similar difference (approx. 1,510 people) in favor of the hypothetical scenario is observed ca. 14 CE. Again, a large part of this difference is attributable to the Average Visibility zone (approx. 1,100 persons).
Comparison of the crowd-size estimates of real venues with hypothetical scenarios for the first gesture class. Hypothetical scenarios are highlighted in grey. AV = Average Visibility, LV = Low Visibility.

The charts in Figs. 22–24 show a comparison of the “capacity” of all venues by period. In ca. 54 BCE, the hypothetical rostra Augusti could accommodate the largest number of people theoretically able to perceive the gestures of the speakers (see Fig. 22). Of the real venues, the podium of the Temple of Castor and Pollux was slightly better than the rostra vetera in this respect.
Comparison of the crowd-size estimates of real venues with hypothetical scenarios for the first gesture class, ca. 54 BCE. AV for Average Visibility zone, LV for Low Visibility zone.

Comparison of the crowd-size estimates of real venues with hypothetical scenarios for the first class of gestures, ca. 27 BCE. AV for Average Visibility zone, LV for Low Visibility zone.

Comparison of the crowd-size estimates of real venues with hypothetical scenarios for the first class of gestures, ca. 14 CE. AV for Average Visibility zone, LV for Low Visibility zone.

Furthermore, ca. 27 BCE, the largest “capacity” was a hypothetical speaking platform, this time, the rostra vetera (see Fig. 23). The amount of available space in front of the rostra aedis Castoris is significantly reduced, hence the most capacious venue becomes the rostra Augusti, followed by the rostra aedis divi Iulii. It is worth noting that if it had not been for the construction of the Temple of Divus Iulius, the podium of the Temple of Castor and Pollux would have rivalled the capacity of the rostra Augusti. Depending on the method used to estimate the crowd size, it would have had a capacity of approx. 930 more people (for total maximum visibility and an average crowd density factor of three people/m2) or slightly less, by approx. 400 people (for varying crowd density moderated by the results of the regression analysis). In the latter case, however, it can be noted that the podium of the Temple of Castor and Pollux would accommodate more people in the Average Visibility zone who were able to see the speaker’s gestures (approx. 14,470 compared with approx. 12,810 for the rostra Augusti).
As can be seen from Fig. 24, the hypothetical rostra vetera, ca. 14 CE, would have had the greatest capacity. Considering the changes associated with the construction of the Porticus of Gaius and Lucius, had the Temple of Divus Iulius not been built, the speaking platform on the podium of the Temple of Castor and Pollux would have competed with the rostra vetera for precedence. However, the most prominent venue in this period is the rostra Augusti, followed by the rostra aedis divi Iuli.
Discussion
By analyzing the gestural visibility of all speaking platforms in the Roman Forum ca. 54 BCE, ca. 27 BCE, and ca. 14 CE, we have arrived at a quantitative description that has allowed us to compare their “capacity” more objectively. The changes in the Forum between these periods, in terms of both the immediate oratorical taskscape (the location of the speaking platforms and their spatial interrelations) and its surroundings, have attracted the attention of many researchers, and several hypotheses have been put forward to explain them.
It should first be noted that these changes are part of a longer and broader trend of geometrization and monumentalization of the fora of Italian cities.Footnote 99 In accordance with this pattern, the establishment of two opposite speaking platforms (the rostra Caesaris, later reconstructed by Augustus, and the rostra aedis divi Iulii), positioned along the longer axis of the Forum, marked a significant milestone in the process of giving a regular shape to the main square of Rome.
Second, before going into a detailed analysis of each venue and how it compared with the others, it is worth pointing out that differences between the areas available for the audience to intelligibly see speakers’ gestures are noticeable, but not very large. In most cases, these areas range between approx. 5,000 and 6,000 m2. This may suggest that the choice of location for the new speaking platform was guided by the availability of spaces of this order of magnitude. From the authorities’ perspective, increasing the number of individuals who could see a speaker’s gestures without clearly hearing their speech may not have been a priority. On the one hand, such an arrangement could have reduced control over the crowd; on the other, it is plausible that greater emphasis was placed on maximizing the number of people who could clearly hear and comprehend the speaker’s words.
Rostra vetera/rostra Caesaris
Undoubtedly, the impact of Caesar, and later Augustus, and members of the imperial family on the appearance of the Forum was also connected to a display of political power, prestige, and propaganda.Footnote 100 One of the boldest moves was the construction of a new curia in a slightly different location and with a slightly different orientation from that of the Curia Cornelia (which had, in turn, repeated earlier patterns) and the construction of a new rostra Caesaris separate from the Comitium and curia. Although Sumi believes that this was a natural consequence of detaching the rostra from the curia, a process that had begun earlier, it should – together with changing the orientation of the speaker away from the Comitium and towards the Forum – be regarded as a significant break from the Republican tradition.Footnote 101 Simultaneously, Sumi implies that the change could have been linked to an effort aimed at countering Sulla’s legal measures, which, as mentioned by Cicero,Footnote 102 prohibited the tribunes of the plebs from utilizing the rostra at the Comitium. The removal of the rostra from “under the shadow of the curia” would have meant its return to the people.Footnote 103 However, the ban itself is debatable, and even if it was introduced, it was certainly lifted during the reforms of the 70s BCE. Moreover, Sulla’s legacy seems not to have bothered Caesar at this stage of his career, since, after the dictator’s equestrian statue was overthrown by the people following the Battle of Pharsalos in 48 BCE,Footnote 104 he reinstalled it on the newly built rostra Caesaris.Footnote 105 The radical break with the Republican tradition must therefore be considered above all an expression of political power and perhaps intended to emphasize the figure of the speaker (Caesar himself).Footnote 106 Caesar felt powerful enough to appear as one who is above norms and customs, in line with the concept of political provocation and transgression of principles characteristic, according to Hölscher, of the habitus of Late Republican elites.Footnote 107
Frischer and Massey propose an alternative hypothesis to Sumi’s, suggesting that Caesar deliberately selected the rostra’s location to ensure a commanding view of the Curia Iulia.Footnote 108 While their concern is with the function of the rostra not as a speaking platform but as a viewing perch for tourists to Rome, if we apply their insight to our topic of the visibility of the speaker’s gestures relative to crowd size, we can infer that Caesar, contrary to Sumi’s opinion, aimed not only to relocate the rostra away from the curia’s influence but also to (partially) reinstate the initial link between the orator and the Senate building, a connection that had been severed when speakers shifted their focus from the Comitium to the Forum during their speeches. The speaker, admittedly, did not look directly towards the curia, but he had it in his field of vision while speaking. Interestingly, fully restoring the speaker’s connection to the curia, while moving the speaking platform as far away as possible from it (to maximize the available space) would result in a gesture visibility zone of approx. 7,400 m2, which, with an average crowd density of three people/m2, would allow approx. 22,200 people to attend a contio and see the speaker’s gestures, far exceeding the “capacity” of all other analyzed venues. When the results of the regression analysis are considered, the position of this hypothetical speaking platform holds. The result drops to approx. 19,700 people, with the Average Visibility zone holding approx. 14,700 people and the Low Visibility zone approx. 5,000 people. This positioning of the rostra would not have contributed to the geometrization of the Forum, further blocking the important street, vicus Iugarius, leading towards the Forum Holitorium.
Muth offers an alternative explanation as the main reason for moving the rostra, pointing more strongly to practical issues connected directly to public speaking. In her view, attention should be paid to the geometry of the space and its effect on the shape of the crowd and, consequently, the speaker’s control over the gathering.Footnote 109 In ca. 54 BCE, the location of the rostra in relation to the Basilica Aemilia and its accompanying tabernae novae as well as Basilica Sempronia and its adjacent tabernae veteres was of the greatest importance.Footnote 110 According to Muth, the geometry of the space dictated the asymmetrical distribution of the crowd, which Caesar’s intervention rectified.Footnote 111 It is worth noting here that Muth shows the Forum “filled to the brim” in the first instance; in the case of a smaller crowd (which we believe is illustrated by the darker color in the illustrations), she does not adapt the geometry of the crowd to the new situation, merely scaling it down.
Muth’s hypothesis can be tested by our analyses. First, after the rostra had been moved, the potential crowd was indeed more symmetrically distributed in relation to the speaker than before (see Fig. 25). Furthermore, Muth points out that the rostra Caesaris had superior properties in terms of both the visibility of the speaker and the audibility of his speech.Footnote 112 We cannot yet say anything about the acoustic properties, but our analyses of the visibility of the speaker’s gestures indicate that the outcomes of assessing the effect of the platform relocation on the size of the crowd depends on the counting method, which suggests that the differences were not significant.
Superimposed gesture visibility analysis for rostra Augusti, ca. 27 BCE (RA) and for rostra vetera, ca. 54 BCE (RV).

When crowd sizes are estimated based on a uniform density factor, Caesar’s shifting of the platform results in a slight increase in venue “capacity” (for an average value of 3 persons/m2) of approx. 150 persons. It is essential to emphasize, however, that subsequent modifications to the built environment resulted in a decrease in the venue’s capacity, rendering it unable to accommodate as many people as the original rostra vetera (approx. 600 fewer individuals). As a result, the practical advantages of relocating the platform were negated in terms of capacity alone, although crowd control capabilities were unaffected.
The situation looks different, though, when we start to moderate the crowd density according to the results of the regression analysis. In that case, moving the platform causes a decrease in the “capacity” of the venue by approx. 200 people. This decrease is especially visible in the Average Visibility zone (a reduction of approx. 900 people). However, much of this loss is offset by an increase in the Low Visibility zone, farther from the speaker. Therefore, the visibility of the speaker’s gestures was diminished, potentially leading to misinterpretation. Consequently, the total communicative capacity was reduced. In this case, for this very reason, it can be suggested that the ability to control the crowd was also diminished, despite the less symmetrical distribution observed in the rostra vetera, ca. 54 BCE scenario.
It is worth noting here that each hypothetical scenario is better in terms of venue capacity than the actual situation. This shows that it would have been most beneficial, for practical reasons, to move the platform without making any other changes to the Forum’s built environment (especially those changes related to Basilica Sempronia/Iulia and Basilica Aemilia and their immediate surroundings). Nonetheless, it would be incorrect to conclude that Caesar’s initial purpose was later nullified, as construction on the Basilica Iulia had already commenced prior to the fire that affected the Curia Cornelia and subsequent alterations, which included the relocation of the rostra.
Temple of Castor and Pollux
The rostra vetera was not the only platform in the Forum Romanum used by speakers. During the Republican period, a second rostra was located at the Temple of Castor and Pollux, known as the rostra aedis Castoris. The political importance of the temple and its immediate surroundings grew with time. As a result, some functions of the Comitium were gradually transferred to the vicinity of the Temple of Castor and Pollux.Footnote 113
Döbler put forward the hypothesis that there were several practical advantages behind the choice of the temple podium as a speaking platform.Footnote 114 Positioned higher than on the rostra vetera, the speaker was more visible and thus more able to control the crowd. The German researcher also speculates that due to the geometry of the surrounding space, the acoustics were better here, although, at the same time, the speaker was visible from a shorter distance (due to the restriction of the space in front of the speaker caused by the tabernae novae and the Basilica Aemilia). Preliminary results of acoustic simulations (comparing the Temple of Castor and Pollux – in this scenario without the Temple of Divus Iulius – with the rostra Augusti) show, however, a more nuanced picture. The Temple of Castor and Pollux had better acoustic properties (i.e., those that maximized the number of people who could hear the speaker intelligibly) than the rostra Augusti only when the background noise level was high (55 dBA). The quieter the Forum and its surroundings were (49 and 36 dBA), the better the rostra Augusti performed in this respect.Footnote 115 Our results from the gesture visibility analysis show that the gestures of a speaker presenting from a temple-bound platform could be seen intelligibly by approx. 1,000–1,100 more people than in the case of the rostra vetera, ca. 54 BCE, confirming some practical benefits of choosing this venue. Although the tabernae novae and the Basilica Aemilia limited the number of people who could see the gestures, it is worth nothing that these gestures were located mainly in the Low Visibility zone of the first class of gestures. All this changed when the erection of the Temple of Divus Iulius began. This construction greatly reduced the space available for the contiones held before the Temple of Castor and Pollux, reducing the number of people who could see the speaker’s gestures by approx. 1,500. At the same time, the distribution of the crowd became less symmetrical, which may have made crowd control more difficult.
Temple of Divus Iulius
No doubt, the construction of the Temple of Divus Iulius was an expression of political power as Julius Caesar became the first Roman historical figure to be deified. Upon its dedication, the temple served as a manifestation of the political authority wielded by Caesar’s successors (predominantly the triumvirate: Octavian, Antony, and Lepidus).Footnote 116 As political circumstances evolved, the temple progressively transformed into one of the key symbols of Octavian’s hegemony, highlighting his status as a divi filius.Footnote 117 At the same time, it closed off the Forum from the southeast, later becoming the unifying element of the monumental entrances to the square from that side, in the form of the Parthian Arch and the Porticus of Gaius and Lucius.Footnote 118 It was therefore an important element in the expression of political domination, as well as in the geometrization and monumentalization of the Forum Romanum. Given that the hypothetical crowds gathered in front of the Temple of Castor and Pollux and the Temple of Divus Iulius largely overlapped, and considering the lack of further mention in written sources of its use, it must be assumed that the new rostra aedis divi Iulii replaced the platform associated with the podium of the Temple of Castor and Pollux as a speaking platform. It should be noted that this change involved reducing the “capacity” of the venue in this part of the Forum by approx. 2,500–3,000 people.
In ca. 27 BCE, the area of gesture visibility for the rostra aedis divi Iulii could accommodate approx. 2,000 fewer people than the area in front of rostra Augusti assuming an average crowd density factor of three people/m2. In ca. 14 CE, this difference was reduced to approx. 1,000 people in favor of the rostra Augusti. When we take into account the results of the regression analysis ca. 27 BCE, the speaker’s gestures in front of the rostra aedis divi Iulii could be seen by approx. 1,600 fewer people than those in front of rostra Augusti (approx. 1,000 fewer when we consider only the Average Visibility area). Similarly, ca. 14 CE, there were approx. 1,000 fewer persons in the Average Visibility and Low Visibility areas, and approx. 750 fewer in the Average Visibility zone.
Overall oratorical taskscape
Our analyses cannot address hypotheses concerning transformations of the Forum – including changes to the oratorical taskscape – as manifestations of political power or processes of spatial geometrization. They can, however, as seen above, help verify some of the hypotheses related to the practical issues of contiones and other forms of public-speaking assemblies: “capacity” and the level of crowd control. It is worth noting another, related theme that has not been addressed in the literature so far. In theory, at least, more than one contio or quaestio could take place at the same time in Rome and even in the Forum Romanum itself. This was especially possible in the case of judicial gatherings, although it cannot be ruled out that it also occurred from time to time in the case of political assemblies. If indeed two such events could take place simultaneously in the Forum, we can consider the extent to which the participants may have interfered with each other and how these events may have affected the capacity of the two venues. One could therefore ask whether the changes in the spatial configuration of rostra at the Forum Romanum were, at least in part, motivated by a desire to increase the degree of separation between crowds.
In ca. 54 BCE, the shared (or intervisible) zone of total visibility of the first class of gestures by the crowds occupying space in front of the rostra vetera and the rostra aedis Castoris, is approx. 3,250 m2, representing 58% and 54% of the total space, respectively (Fig. 26).
Shared space between two hypothetical crowds in front of rostra vetera and rostra aedis Castoris, ca. 54 BCE. Z1 for intervisible, Z2 for intervisible limited to Average Visibility zone, Z3 for visible from one rostra, NV for the nonvisible area.

If we take into account the results of the regression analysis and narrow the analyzed area down to the Average Visibility zone only, the shared area would occupy approx. 1,450 m2, or 32% of the space in front of the rostra vetera and 30% of the space in front of the rostra aedis Castoris (Fig. 26).
A similar analysis for the Forum ca. 27 BCE shows that, for maximum visibility of gestures in the first class, the area shared by the rostra Augusti and the rostra aedis divi Iulii is approx. 2,700 m2, representing 48% and 54% of the available area, respectively (Fig. 27).
Shared space between two hypothetical crowds in front of rostra Augusti and rostra aedis divi Iulii, ca. 27 BCE. Z1 for intervisible, Z2 for intervisible limited to Average Visibility zone, Z3 for visible from one rostra, NV for the nonvisible area.

If we narrow down the analyzed area to only the Average Visibility zones of the gestures in the first class for the two venues, we find that the shared area is approx. 520 m2, or 12% and 13% of the available space respectively (Fig. 27).
These results differ significantly from those for the venues ca. 54 BCE. They are even more interesting if we take into account the situation at the end of Caesar’s dictatorship and immediately after his assassination; that is, the rostra vetera had been replaced by the rostra Caesaris, and the construction of the Basilica Iulia was underway, but the erection of the Temple of Divus Iulius had not yet begun. The area shared by the participants in contiones taking place simultaneously in front of the rostra Caesaris and the rostra aedis Castoris is approx. 2,000 m2, representing 40% and 34% of the available space, respectively (Fig. 28). When narrowing down the analysis to only the Average Visibility areas for the first class of gestures, the shared area is approx. 400 m2, or 7% and 8% of the available space, respectively (Fig. 28).
Shared space between two hypothetical crowds in front of rostra Caesaris and rostra aedis Castoris. Z1 for intervisible, Z2 for intervisible limited to Average Visibility zone, Z3 for visible from one rostra, NV for the nonvisible area.

If we accept that, apart from political considerations, Caesar was guided by practical matters linked to public-speaking events when moving the rostra, then his motivations likely extended beyond merely enlarging the venue (an effect subsequently negated by other building projects in the Forum). Rather, Caesar appears to have sought greater separation from the area in front of the Temple of Castor and Pollux, which would have facilitated simultaneous public gatherings within Rome’s main square.
Drawing from Davies’s observations on the possible impact of construction activities on public events at the Forum,Footnote 119 this strategic separation between speaking platforms would have enhanced crowd capacity, speaker visibility, and speech audibility, particularly when building or renovation work occurred near one rostra. This consideration proves especially relevant during the Late Republic and Early Empire, a time characterized by extensive construction at the Forum Romanum.Footnote 120 Nevertheless, this spatial factor warrants attention across other historical periods as well given that various destructive events, especially frequent fires,Footnote 121 necessitated the ongoing reconstruction of damaged buildings.
In this context, it is worth highlighting that the front of the podium of the Temple of Venus Genetrix at the Forum of Caesar was also meant to serve as a speaking platform.Footnote 122 This architectural choice provides compelling evidence that the dictator maintained a genuine concern for accommodating public gatherings that included addressing crowds. Ulrich’s analysis, further developed by Davies, highlights architectural parallels between this temple and the Temple of Castor and Pollux, suggesting it was assumed these structures would have comparable roles in public oratory.
In a similar analysis, for the Forum ca. 27 BCE and ca. 14 CE, of crowds gathered simultaneously in front of the Temple of Castor and Pollux and the Temple of Divus Iulius, the shared space is much larger. In ca. 27 BCE, it is 85% and 74% (82% and 74% if we consider only the Average Visibility zone) for the space in front of each temple, respectively (Fig. 29).
Shared space between two hypothetical crowds in front of rostra aedis Castoris and rostra aedis divi Iulii, ca. 27 BCE. Z1 for intervisible, Z2 for intervisible limited to Average Visibility zone, Z3 for visible from one rostra, NV for the nonvisible area.

In ca. 14 CE, the amount of shared space is very similar, at 86% and 75%, respectively (84% and 74% for the Average Visibility zone) (Fig. 30). These results show that – even if the rostra aedis Castoris still existed and was used ca. 27 BCE and ca. 14 CE (and possibly beyond), as Taylor and Ulrich suppose – it is unlikely that contiones in front of it and in front of the rostra aedis divi Iulii took place simultaneously. In practical terms, despite the existence of three speaking platforms in the Forum, it was still only possible to use two at a time, in a combination of rostra Augusti—rostra aedis divi Iulii or rostra Augusti—rostra aedis Castoris.
Shared space between two hypothetical crowds in front of rostra aedis Castoris and rostra aedis divi Iulii, ca. 14 CE. Z1 for intervisible, Z2 for intervisible limited to Average Visibility zone, Z3 for visible from one rostra, NV for the nonvisible area.

Conclusions
This study has focused on analyzing key speaking platforms within the Forum Romanum – namely, the rostra vetera, rostra aedis Castoris, rostra Augusti, and rostra aedes divi Iulii – examined across three distinct periods: Late Republican, ca. 54 BCE; Early Augustan, ca. 27 BCE; and Late Augustan, ca. 14 CE. We selected these locations and periods because they represent the dynamic political and architectural transformations that occurred during the transition from the Republic to the Empire. This approach enabled us to assess how spatial reconfigurations affected the visibility of hand gestures in rhetoric and, by extension, the effectiveness of public political communication. Public assemblies such as contiones, quaestiones, and other public-speaking events served to convey information, express opinions, and persuade audiences and/or judges, making the speaker’s audibility, visibility, and gestural communication essential.
The primary aim of this research was to estimate the “capacity” of the spaces in question – measured through the visibility of a speaker’s gestures and understood as an integral component of the oratorical taskscape. Building on this measurement, we further examined how architectural modifications altered non-verbal communication, thereby shaping the overall impact of political discourse. By using gesture visibility as a proxy for audience perception, our method offers a novel tool for uncovering subtle mechanisms through which the built environment enhanced the impact of political discourse. Ancient sources indicate that public speeches, at least at times, attracted audiences larger than could have heard the speaker intelligibly, making visibility a crucial factor in shaping engagement. By prioritizing gestural visibility over acoustic simulations, our approach directly quantifies the spatial dynamics of public speaking, while also reducing ambiguity. Integrating qualitative insights from ancient rhetorical treatises with quantitative spatial analysis techniques – such as GIS-based 3D reconstructions – it provides robust and reliable estimates of audience capacity. This methodology not only simplifies computational demands but also offers a clearer framework for understanding the oratorical taskscape than approaches focused on speech audibility. As a result, it establishes a maximum range of attendees who could witness an oratorical event, enabling meaningful comparisons of different venues across space and time.
The approach presented here opens up new avenues for research in both the history of public oratory and the study of urban public spaces. Our methodology, which extends far beyond the Forum Romanum, provides a versatile analytical tool applicable across diverse eras and contexts. Given its universal applicability, this framework could be adapted for examining various public events – from ancient assemblies, religious rituals, and state ceremonies to modern political rallies – allowing researchers to explore how the design and arrangement of venues influence communication dynamics, civic participation, and the projection of authority. Through this gesture-based analysis, the study not only deepens our understanding of ancient political oratory but also establishes a replicable comparative framework for examining how the built environment shapes the perception and effectiveness of public discourse in varied cultural and historical settings.
The results of the current analysis have shown that, in ca. 54 BCE, more spectators could observe speakers’ gestures when they spoke from the rostra aedis Castoris than when they spoke from the rostra vetera. In ca. 27 BCE, the newly constructed rostra Augusti provided superior visibility compared to the rostra aedis divi Iulii in this respect, a pattern that persisted in ca. 14 CE, albeit with a slight reduction in the gap between them. Over time, venue capacity generally declined, except in the case of the rostra aedis divi Iulii, which saw a slight increase between ca. 27 BCE and ca. 14 CE. However, overall differences in crowd size remained moderate, suggesting a relatively stable venue area of approximately 5,000 to 6,000 m2, accommodating similar audience sizes.
These results highlight how shifts in the placement and hierarchy of speaking platforms altered the oratorical taskscape over time. The rostra aedis Castoris, dominant during the Late Republic, gave way to the rostra Augusti and rostra aedis divi Iulii in the early Principate, reflecting not only spatial reconfiguration but also the evolving nature of political oratory. This transformation reinforced the symbolic dominance of imperial authority, as strategically positioned platforms directed public attention and projected an image of centralized power. The relatively standardized size and enhanced visibility of the rostra Augusti and rostra aedis divi Iulii facilitated a controlled environment, reinforcing the ideological foundations of the Empire. In this way, architectural modifications shaped public assemblies into orchestrated performances of state power.
Further analysis, including hypothetical scenarios such as placing the rostra vetera in the Augustan-era Forum or situating the rostra Augusti in ca. 54 BCE, allowed us to test specific hypotheses about changes in the oratorical taskscape of Rome’s main square. While our study cannot confirm whether these alterations were motivated by political power struggles or broader trends in urban monumentalization, it does support interpretations linked to practical considerations. The demolition of the rostra vetera and the erection of the new rostra Caesaris in a different location improved audience symmetry in relation to the speaker. Combined with the addition of the rostra aedis divi Iulii, these changes led to more uniform crowd distribution across venues, possibly indicating a preference for standardization. Despite profound transformations in the political system during this period, the physical capacity of public speaking venues remained stable, even as their role in public discourse evolved.
One notable difference between the venues of ca. 27 BCE and ca. 14 CE compared to those of ca. 54 BCE was the increased area of separation between audiences attending simultaneous public speaking events at multiple platforms. Alongside the construction of the Forum of Caesar and its speaking platform at the Temple of Venus Genetrix, this suggests an effort to expand the number of venues capable of hosting events concurrently within the Forum Romanum and its vicinity.
Although our study does not provide definitive evidence that in this particular case Roman decision-makers intentionally designed public spaces to maximize gesture visibility, and thereby to maximize the number of individuals who could participate in an assembly, the analysis reveals that shifts from old rostra to new ones standardized venue dimensions and improved audience symmetry in relation to the speaker. Notably, increased separation between audiences during simultaneous events suggests a strategy to better manage crowd interactions. Ultimately, these architectural changes enhanced non-verbal communication and transformed public assemblies into orchestrated displays of state power.
Limitations and further lines of research
The results of our research depend to a great extent on the state of preservation and the state of research at the Forum Romanum, which determines the quality of the virtual reconstructions used. As a result, these reconstructions may not reflect the actual appearance of the Forum during a given period in every detail. Indeed, it is possible that the remains discovered have been misinterpreted or incorrectly dated, and structures may have existed that are neither mentioned in written sources nor preserved archaeologically but reduced the amount of space available for a given venue.
It must be strongly emphasized that these findings represent a “best-case scenario,” as we did not incorporate visibility-limiting factors, particularly illumination conditions. The experimental framework underpinning this analysis excluded both ambient illumination levels and solar positioning, factors which variably affect gesture visibility. The latter factor appears to be particularly significant for speaker visibility – including gestural communication – given the outdoor setting of contiones and similar public events. While the number of clear days may have fluctuated significantly during the period under investigation, the average likely approximated contemporary conditions. Furthermore, the specific location and orientation of the Temple of Castor and Pollux and the rostra vetera suggest solar positioning influenced the experience: the temple’s position potentially caused afternoon glare for audiences throughout various seasons, while the rostra vetera’s placement may have affected the sight of the speaker. Consequently, the relocation of speaking platforms may have been motivated by attempts to mitigate solar effects on the experience of both audiences and speakers. Testing this hypothesis, however, requires further investigation into the relationship between solar positioning and its effects on speaker visibility and gestural communication.
The versatility of the method used means that it can also be applied to other venues in diverse cultural and historical settings. For instance, our methodology could shed light on the reasons for the construction of the Tribunal Praetoris on the Forum.Footnote 123 Furthermore, we could extend our investigation into the Imperial period. For example, it might be valuable to assess the impact of Imperial monuments placed on the Forum on the theoretical visibility of speakers on the Augustan and Diocletianic rostra. As these monuments accumulated, they likely reduced the potential number of spectators at Imperial orations from the rostra. Such a study could add new support to the Frischer-Massey thesis suggesting that, as the Imperial period progressed, the primary function of the rostra was depoliticized and aestheticized, so that it was used less by speakers at political meetings and more by tourists seeking panoramic views of the Forum Romanum. Our research covers only one of several channels through which speakers communicated with the audience. Apart from the hand gestures analyzed, there were other forms of communication that occurred, including verbal communication encompassing both the speech’s content and the manner of delivery (vox). Additionally, non-verbal communication channels such as facial expressions (vultus) were also employed. Therefore, it would be interesting to confront our findings with the results of analyses of the visibility of facial expressions and audibility of speech. Moreover, comparable analyses could be extended to other venues of public gatherings in Rome, including the Capitoline Hill, the Temple of Bellona, and the Circus Flaminius.
Supplementary material
The Supplementary Materials provide a set of digital resources, including three-dimensional virtual reconstructions of the ca. 54 BCE, ca. 27 BCE, and ca. 14 CE Forum Romanum (S1–S3, .obj). In addition, the materials include detailed documentation of the parameters applied in the Viewshed analysis within Exploratory 3D Analysis in ArcGIS Pro 2.9 (S4, .docx). These resources allow for replication of the study and assessment of spatial relationships within the Forum. To access the Supplementary Materials for this article, please visit: https://doi.org/10.5281/zenodo.12705221.
S1 – The 3D virtual reconstruction of the LR Forum Romanum used in the study (.obj).
S2 – The 3D virtual reconstruction of the EA Forum Romanum used in the study (.obj).
S3 – The 3D virtual reconstruction of the LA Forum Romanum used in the study (.obj).
S4 – Parameters used in the Viewshed function in Exploratory 3D Analysis in the ArcGIS Pro 2.9 (.docx).
Acknowledgments
The study is a part of the project “One, two, three! Can everybody hear me? Can everybody see me? Acoustics and proxemics of Roman contiones,” funded by a research grant from the National Science Centre, Poland under the SONATA15 scheme (project No. 2019/35/D/HS3/00105). Szymon Popławski was also supported by the Foundation for Polish Science (FNP).


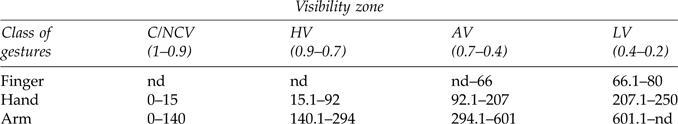


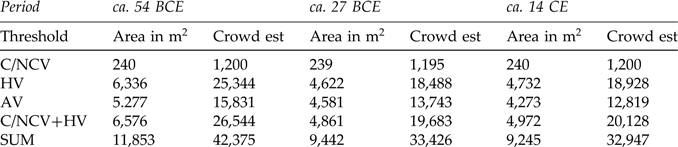
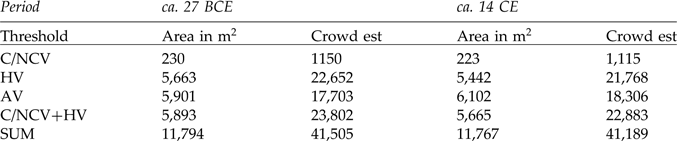
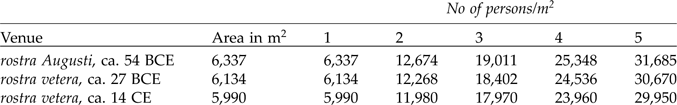


 Open access