Conjugated linoleic acids (CLA) are a group of geometrical and positional fatty acids (FA) isomers that are naturally found in ruminant meat and milk products and have shown to possess bioactive properties in diverse animal models( Reference Park and Pariza 1 ). Extensive research on the synthesis of cis-9, trans-11 and trans-10, cis-12 CLA in the rumen and their effect on metabolism has been conducted and are of special interest to dairy science( Reference Shingfield and Wallace 2 ). Briefly, cis-9, trans-11 CLA is the main CLA isomer found in milk, and it originates directly from ruminal biohydrogenation (BH) of dietary linolenic and linoleic acid (LA), and from endogenous synthesis from trans-11 C18 : 1 by stearoyl-CoA desaturase (SCD1) in the mammary gland( Reference Griinari, Corl and Lacy 3 ). Trans-10, cis-12 CLA, if present, is found at very low concentrations in milk and originates exclusively from altered ruminal BH of dietary FA when low-fibre/high-starch diets or high unsaturated FA diets are fed( Reference Bauman and Griinari 4 ). Trans-10, cis-12 CLA reduces milk fat synthesis up to 50 % through down-regulation of lipogenic capacity, key lipogenic enzymes and factors in mammary tissue, and is the causative factor of BH-induced milk fat depression (MFD)( Reference Harvatine, Boisclair and Bauman 5 ).
Transfer of dietary FA to milk has been proposed to fit a two-pool model, with a fast pool representing direct transfer of absorbed FA to milk through chylomicrons and a slow pool representing indirect transfer through uptake by non-mammary tissues and cycling back to plasma in NEFA and lipoproteins (LP)( Reference Palmquist and Mattos 6 ). Studies using 14C-labelled FA have determined that direct transfer to milk fat is expected to occur during the first 24 h, whereas indirect transfer occurs 24–36 h post-absorption( Reference Palmquist and Mattos 6 , Reference Palmquist and Conrad 7 ).
Abomasal infusion of FA allows bypassing ruminal BH, and therefore physiological effects of BH metabolites, and, more importantly, allows observation of FA absorptive and post-absorptive metabolism, as well as trafficking to milk. de Veth et al. ( Reference de Veth, Griinari and Pfeiffer 8 ) summarised the transfer efficiency of abomasally infused trans-10, cis-12 CLA to milk and Harvatine & Bauman( Reference Harvatine and Bauman 9 ) characterised the clearance of trans-10, cis-12 CLA from plasma and milk after cessation of abomasal infusion. However, these approaches did not allow estimation of the direct and indirect transfer rates, which may provide further understanding of inter-tissue trafficking of trans-10, cis-12 CLA and physiology of MFD. In this study, we used a perturbation tracee model, which consisted in enriching the pool of trans-10, cis-12 CLA in lactating dairy cows’ plasma and milk, following observation of the time course of appearance and disappearance of the tracee (trans-10, cis-12 CLA) over a 7-d period. The main objective of this study was to characterise the kinetics of trans-10, cis-12 CLA transfer to plasma and milk and to determine the proportion transferred through the direct and indirect transfer pathways using a perturbation model. Our hypothesis was that the perturbation model would allow estimation of direct and indirect transfer rates and the construction of a mathematical compartmental model to investigate trafficking of CLA between tissues and milk.
Methods
Experimental design and treatments
All experimental procedures were approved by the Pennsylvania State University Institutional Animal Care and Use Committee. Five ruminally cannulated multiparous mid-lactation cows (148 (se 86) d in milk; 44·1 (se 11·2) kg of milk/d) were housed in tie-stalls at the Pennsylvania State University Dairy Production Research and Teaching Center. All cows were fed once daily (07.00 hours) a contemporary lactating cows’ diet (16·3 % crude protein, 31·6 % neutral detergent fibre, 21·5 % acid detergent fibre, 24·8 % starch, 3·7 % diethyl ether extract) and received a single abomasal bolus infusion of an enriched CLA NEFA mixture over a 30-min period 2 h before the afternoon milking on day 0 of the experiment.
The abomasal bolus infusion consisted of 53 g of a NEFA mixture that provided 15·0 g of each CLA isomer (28·6 % trans-10, cis-12 CLA; 28·6 % cis-9, trans-11 CLA; Table 1). The target dose (15 g) causes maximal reduction in milk fat synthesis( Reference Baumgard, Sangster and Bauman 10 ), and according to previous studies was sufficient to cause a detectable increase in plasma and milk trans-10, cis-12 CLA( Reference Harvatine and Bauman 9 ) required for a perturbation model. The NEFA mixture was prepared by saponification of a methyl ester stock (Lutalin, BASF). Briefly, the methyl ester was mixed with twice the volume of a 10 % potassium hydroxide in ethanol solution in an orbital shaker at room temperature for 2 h. The resulting NEFA were acidified to pH 4 with 6 N hydrochloric acid in water and ten volumes of distilled water were added. NEFA were extracted in hexane and dried over sodium sulphate for 2 h. Subsequently, hexane was removed in a rotary evaporator at 45°C. Before treatments, subsamples of the CLA NEFA mixture were methylated for total fat and FA analysis as described below (dual methylation), for calculation of treatment mass (Table 1). The CLA NEFA mixture was infused manually, using a 60-ml disposable syringe, through an abomasal infusion line as described in Urrutia & Harvatine( Reference Urrutia and Harvatine 11 ). The infusion lines were inserted approximately 9 h before the bolus infusion and placement in the abomasum was verified before infusion. The lines were rinsed with 50 ml of warm water before and after CLA infusion and with 20 ml of 70 % ethanol after the final water rinse.
Fatty acid (FA) composition of the treatment mixtureFootnote *
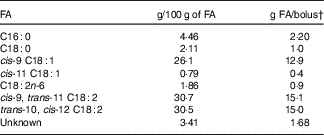
* Mixture contained 93 % FA.
† Calculated as (g/100 g of each FA in mixture)×(93 % FA in mixture)×(53 g of mixture in bolus).
Milk sampling and analysis
Cows were milked twice daily at 06.30 and 18.30 hours and milk yield was determined by an integrated milk metre (AfiMilk; S.A.E. Afikim). The parlour weights were adjusted using a stall deviation calculated as described by Urrutia & Harvatine( Reference Urrutia and Harvatine 12 ). Milk was sampled at each milking from days 0 to 7 and on days 10 and 12 relative to the bolus. A subsample of milk was stored at 4°C with preservative (Bronolab-WII; D&F Control Systems, Inc.) until analysed for fat and protein by Fourier transform infrared spectroscopy (Fossomatic 4000 Milko-Scan and 400 Fossomatic; Foss Electric, Dairy One DHIA). Fat cakes were obtained from a second subsample of fresh milk by centrifugation at 1300 g and then analysed for FA composition as described by Rico & Harvatine( Reference Rico and Harvatine 13 ) with slight modification. Briefly, milk lipids were extracted with hexane:isopropanol, transmethylated in the presence of sodium methoxide and fatty acid methyl esters (FAME)-quantified by GC with a flame ionisation detector and a capillary column (SP-2560; 100 m× 0·25 mm (i.d.) with 0·2-μm film thickness; Supelco Inc.). Initial oven temperature was 80°C; it was increased at 2°C/min to 190°C for 15 min, and then increased at 5°C/min to 215°C for 3 min. Inlet and detector temperatures were 250°C with a 50:1 split ratio. Peaks were identified using FAME standards (GLC 68D and 780 and pure trans-10, cis-12 CLA and cis-9, trans-11 CLA; NuChek Prep Inc.; Bacterial Acid Methyl Ester Mix, 47080-U; Sigma-Aldrich Inc.; and GLC 110 mixture; Matreya LLC) and recoveries of individual FA were determined using an equal weight reference standard (GLC 461; NuChek Prep Inc.).
Blood sampling and analysis
Indwelling jugular catheters were placed the morning of the bolus infusion. Blood samples were collected in potassium EDTA tubes (Greiner Bio-One North America Inc.) at −1, 1, 2, 4, 6, 12, 18, 24, 30, 36, 48, 72, 144, 216 and 288 h relative to the bolus infusion. Blood was immediately placed on ice, centrifuged within 30 min at 1300 g for 15 min at 4°C and plasma was harvested and stored at −20°C until laboratory analysis.
Total plasma FA profile was determined as described by Urrutia & Harvatine( Reference Urrutia and Harvatine 11 ). Briefly, internal standards were added to plasma and lipids were extracted with hexane:isopropanol; FA were directly methylated in a dual methylation procedure using sodium methoxide followed by methanolic HCl. FAME were quantified as described above with a modified temperature programme (initial 70°C, increased 8°C/min to 110°C, increased 4°C/min to 165°C for 20 min, increased 2·5°C/min to 215°C and held for 20 min) and a 40:1 split ratio.
Statistical analysis
Experimental power was 0·80 calculated using the one-sample Z-test method based on observing a 0·075 % increase of milk trans-10, cis-12 CLA with a sd of 0·06 % using the Power & Sample Size Calculator (Statistical Solutions, LLC). The two-sided test had an α of 0·05 and the standard deviation was based on a similar previous experiment with an abomasal infusion of trans-10, cis-12 CLA( Reference Harvatine and Bauman 9 ).
Data were analysed as repeated measures using PROC MIXED in SAS (version 9.3; SAS Institute). For performance and milk FA data, the model included the random effects of cows and milking time (morning and evening) and the fixed effect of time. For plasma FA data, the model included the random effects of cows and fixed effects of time. The AR(1) covariance structure was used, time was the repeated variable and cows was the subject. Denominator df were adjusted by the Kenward–Rogers method. Data points with Studentised residuals outside of ±3·5 were considered outliers and excluded from analysis.
To determine direct and indirect transfer of trans-10, cis-12 CLA to milk, least square means (LSM) obtained were fit to a bi-exponential decay model in JMP Pro 10.0.2 (SAS Institute Inc.) by non-linear modelling procedures, and the AUC of each exponential was calculated by the following equation:
 $${\rm AUC}{\ \equals \ }{\minus}\left( {{{{\rm Intercept}} \over {\rm slope}}} \right){\times}\left( {\left[ {\rm e^{{\left( {{\minus}{\rm slope{\times}}{\it t}1}} \right)}} } \right]{\minus}\left[ {\rm e^{{\left( {{\minus}\rm slope{\times}{\it t}0} \right)}} } \right]} \right)$$
Total apparent transfer of CLA isomers (trans-10, cis-12 and cis-9, trans-11 CLA) to milk was calculated by subtracting the expected background mass (calculated for each post-bolus milking event, morning and evening as Pre-bolus CLA g/100 g × post-bolus FA yield) from the actual mass of CLA in milk from days 1 to 7 and analysed using the fit model procedure in JMP Pro (ANOVA) with cows as random effect and CLA isomers as a fixed effect.
Compartmental modelling
Model-based compartmental analysis was applied using the Windows version of the Simulation, Analysis and Modelling software (WinSAAM version 3.3.0( Reference Wastney, Patterson and Linares 14 ); http://winsaam.org). The developed compartmental models describe the kinetics of trans-10, cis-12 CLA and cis-9, trans-11 CLA, in plasma and milk, following abomasal bolus infusion. In this type of analysis, the system is represented by discrete compartments where the components under study traffic through, and processes with, similar kinetics are lumped into the same compartment( Reference Cifelli, Green and Green 15 ). In this case, the data obtained were sufficient to perform compartmental modelling of CLA kinetics and generate working hypothesis models to help inform further research.
An initial compartmental model was developed for trans-10, cis-12 CLA based on information in the literature. Then, the model structure and parameter values were iteratively adjusted to obtain a satisfactory fit of the LSM plasma and milk data to the model( Reference Stefanovski, Moate and Boston 16 ). Final values for model parameters (fractional transfer coefficients; L(I,J)s, or the portion of the CLA isomer in Compartment J that is transferred to Compartment I each day) and their statistical uncertainties were obtained using weighted non-linear regression analysis in WinSAAM. A fractional standard deviation of 0·1 was used as the weighting factor for non-linear regression. Once the model for trans-10, cis-12 CLA had been developed, a similar process was applied to obtain an independent model for cis-9, trans-11 CLA. To minimise model complexity, values for kinetic parameters representing biological processes that were assumed to be similar for the two CLA isomers were made equal. Setting these parameters equal was done for simplicity and to increase the df between model parameters and data to aid in model identifiability. Additional details are provided in the Results and discussion.
The final L(I,J)s were then used to calculate other kinetic parameters, including the mean transit (turnover) times (t(J); the average time that a CLA molecule spends in Compartment J during a single transit before exiting that compartment reversibly or irreversibly) and recycling number (ν(I); the average number of times a CLA molecule recycles to Compartment I before exiting that compartment irreversibly). The mean time to milk (TTM50 %) was calculated as the time at which 50 % of the absorbed trans-10, cis-12 CLA was present in the milk pool. For more details on these kinetic parameters and their calculations, see Table 1 in Cifelli et al. ( Reference Cifelli, Green and Green 15 ).
Results and discussion
The objective of this study was to characterise transfer kinetics of trans-10, cis-12 CLA. The bolus infusion contained an equal dose of cis-9, trans-11 CLA, which allowed comparison of both CLA isomers. However, characterisation of cis-9, trans-11 CLA kinetics was limited as milk cis-9, trans-11 CLA originated from three sources: ruminal synthesis from BH of dietary unsaturated FA, mammary gland synthesis from desaturation of trans-11 18 : 1 and exogenous CLA from bolus infusion. On the other hand, milk trans-10, cis-12 CLA most likely originated solely from the abomasal infusion, as trans-10, cis-12 CLA was below the level of detection in pre-trial milk and plasma samples (online Supplementary Tables S1 and S2). Cows were fed a diet high in fibre and low in starch and unsaturated FA (31·6 % neutral-detergent fibre; 24·8 % starch and 3·7 % diethyl ether extract) to prevent synthesis of trans-10, cis-12 CLA in the rumen.
Plasma and milk conjugated linoleic acids
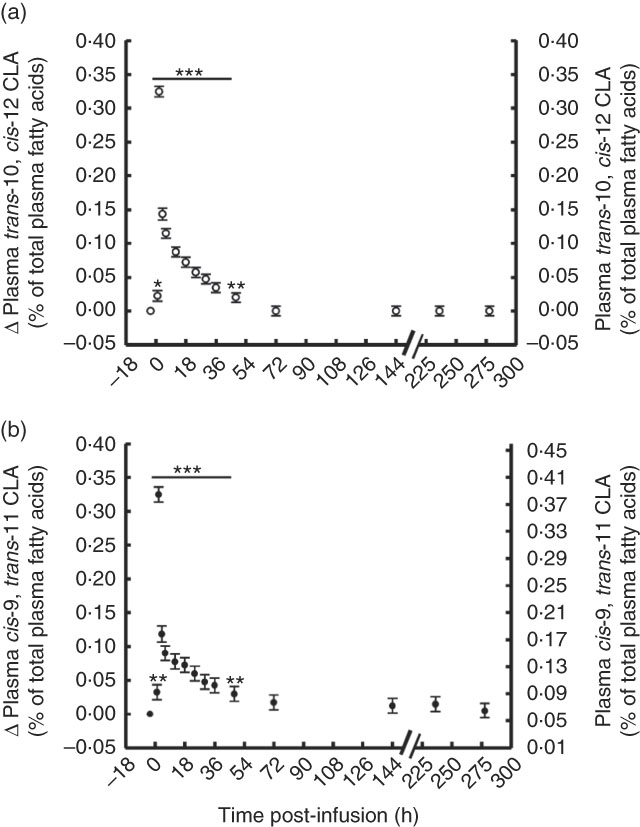
Plasma concentration of trans-10, cis-12 and cis-9, trans-11 CLA peaked 2 h post-bolus, reaching 0·29 and 0·38 % of total plasma FA, respectively (Fig. 1, online Supplementary Table S1). However, both CLA isomers were enriched in plasma at the same magnitude (0·29 and 0·31 % point increase for trans-10, cis-12 and cis-9, trans-11 CLA, respectively) and returned to pre-bolus values by 72 h post-bolus (0·03 and 0·11 % of total plasma FA for trans-10, cis-12 and cis-9, trans-11 CLA, respectively).
Conjugated linoleic acid (CLA) isomer enrichment in plasma following abomasal infusion of 15 g/d of trans-10, cis-12 and cis-9, trans-11 CLA. (a) trans-10, cis-12 CLA (% of plasma fatty acids (FA)). (b) cis-9, trans-11 CLA (% of plasma FA). Values are least-square means of the difference between pre- and post-bolus concentration (primary y-axis) and actual plasma CLA concentration (secondary y-axis) (n 5), with their standard errors of the difference represented by vertical bars. Significant differences: * P<0·05; ** P<0·01; *** P<0·001.
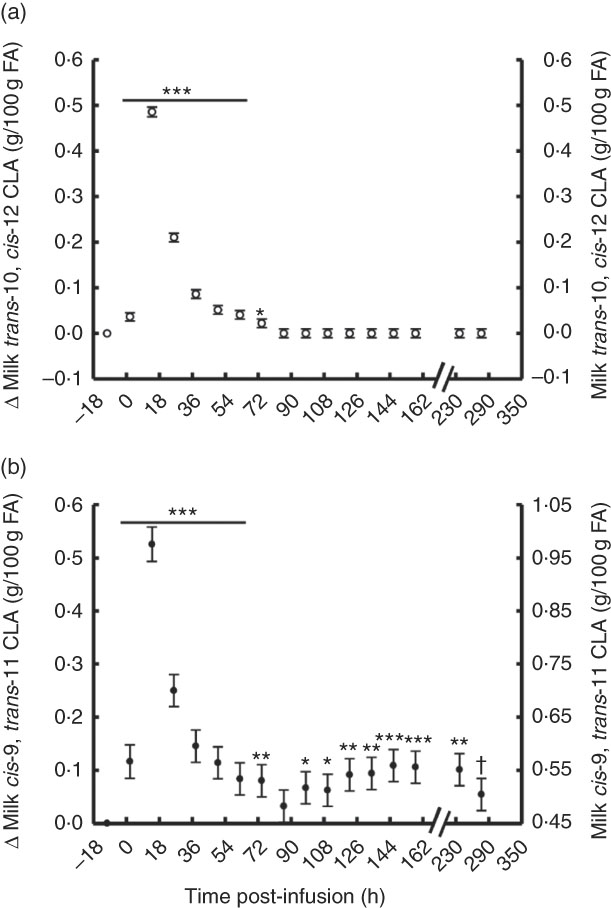
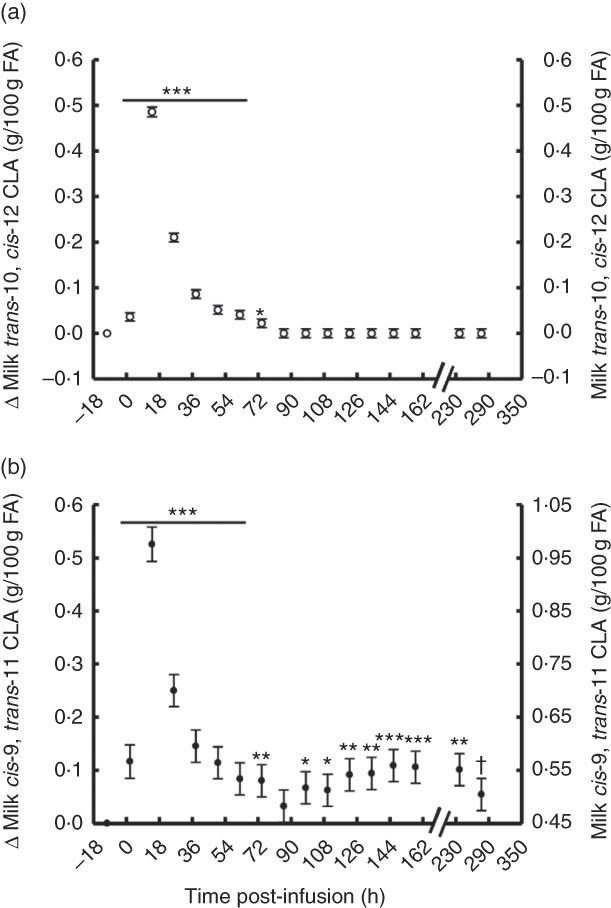
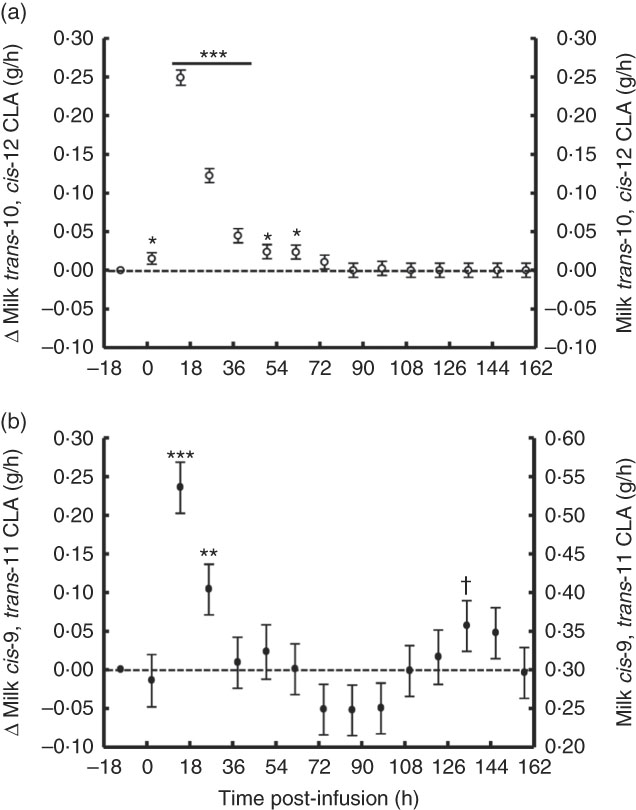
The temporal transfer of trans-10, cis-12 CLA to milk followed a similar pattern of plasma trans-10, cis-12 CLA, where yield and concentration peaked 14 h post-bolus (0·25 g/h and 0·49 % of milk FA) and was not detectable in milk after 86 h (Fig. 2(a) and 3(b), online Supplementary Table S2). The temporal pattern of milk cis-9, trans-11 CLA initially followed a similar pattern, with a peak at 14 h post-bolus (second milking post-infusion; 0·54 g/h and 0·98 % of milk FA, online Supplementary Table S2) and returned to baseline 86 h post-infusion. At the initial peak, both CLA isomers were enriched in milk to a similar magnitude (0·48 and 0·52 % point increase for trans-10, cis-12 and cis-9, trans-11 CLA, respectively). However, milk cis-9, trans-11 CLA yield and concentration presented a second rise at 86 h after infusion (Fig. 2(b) and 3(b)), probably because of trans-10, cis-12 CLA-driven changes in activity of the SCD1 enzyme discussed below.
Milk conjugated linoleic acid (CLA) concentration following abomasal bolus of 15 g/d of trans-10, cis-12 and cis-9, trans-11 CLA. (a) Milk trans-10, cis-12 CLA (g/100 g fatty acids (FA)). (b) cis-9, trans-11 CLA (g/100 g FA). Values are least-square means of the difference between pre- and post-bolus concentrations (primary y-axis), and actual milk CLA concentration (secondary y-axis) (n 5), with their standard errors of the difference represented by vertical bars. Significant differences: * P<0·05; ** P<0·01; *** P<0·001; † P<0·10.
Milk conjugated linoleic acid (CLA) yield following abomasal bolus of 15 g/d of trans-10, cis-12 and cis-9, trans-11 CLA. (a) Milk trans-10, cis-12 CLA (g/h). (b) cis-9, trans-11 CLA (g/milking). Values are least-square means of the difference between pre- and post-bolus yield (primary y-axis) and actual milk CLA yield (secondary y-axis) (n 5), with their standard errors of the difference represented by vertical bars. Significant differences: * P<0·05; ** P<0·01; *** P<0·001; † P<0·10.
Total apparent transfer of CLA isomers to milk during the 7-d period was 41 % for trans-10, cis-12 and 79 % for cis-9, trans-11 CLA (Table 2). Transfer of CLA isomers to milk fat has been reported to be dose dependent( Reference Chouinard, Corneau and Barbano 17 ). Individual trans-10, cis-12 CLA abomasal infusion studies have reported a transfer efficiency of 15·3–18·8 %( Reference de Veth, Griinari and Pfeiffer 8 , Reference Urrutia and Harvatine 11 ), whereas measurement of dietary trans-10, cis-12 CLA duodenal flow and transfer to milk ranged between 36 and 48 %( Reference Pappritz, Lebzien and Meyer 18 ), and a meta-regression of seven experiments reported a transfer efficiency of 22 % (r 2 0·94)( Reference de Veth, Griinari and Pfeiffer 8 ). Transfer of abomasally infused cis-9, trans-11 CLA has been previously reported to be 22·5 %( Reference Chouinard, Corneau and Barbano 17 ). In the current experiment, we observed a higher transfer of both CLA isomers to milk than previous reports, presumably because of the extended period included in the analysis (7 d v. 3–5 d), which accounts for tissue recycling, and allows recovery of transient inhibitory effects of trans-10, cis-12 CLA on FA uptake, and milk fat synthesis and secretion. As discussed later, the remaining fractions of CLA isomers that were not transferred to milk were possibly lost during digestion as undigested FA or in post-absorptive metabolic processes including β-oxidation and incorporation into tissues.
Transfer of conjugated linoleic acid (CLA) isomers to milk fat following abomasal bolus (Mean values with their standard errors)
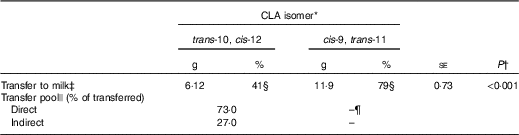
* Treatment was a single abomasal bolus of 15 g of each CLA isomer, trans-10, cis-12 CLA and cis-9, trans-11 CLA, infused over a 30-min period. Values are least-square means, n 5.
† Effect of CLA isomer.
‡ Calculated by subtracting the expected mass from the actual mass of CLA in milk from day 1 to 7.
§ Percental transfer of the bolus dose.
|| Direct transfer represents mammary gland uptake of the lipids contained in chylomicrons and indirect transfer represents mammary gland uptake of preformed sources of fatty acids (non-chylomicron lipoproteins and plasma NEFA). Values represent the relative AUC of each exponential obtained by curve fitting treatment means to a double exponential decay function in JMP Pro 10.0.2 (SAS Institute Inc.).
¶ Could not be determined because of a second rise in milk cis-9, trans-11 CLA.
Milk trans-10, cis-12 CLA concentration following the post-bolus peak fit a non-linear biexponential decay model (Y=7·39×e−0·083t +1·32×e−0·037t ; r 2 0·99, RMSE=0·062). The first exponential, or fast pool, representing direct transfer from the gut to the mammary gland through chylomicrons was 73 % of total trans-10, cis-12 CLA transferred to milk. The second exponential, or slow pool, representing indirect transfer through other tissues was the remaining 27 %. Indirect transfer includes all trans-10, cis-12 CLA that, before being transferred to the mammary gland, was trafficked through other tissues and cycled back to plasma through NEFA and LP. Magnitude of release and uptake of FA from other tissues is directly related to energy balance and lactation stage( Reference McNamara and Hillers 19 , Reference Bauman and Currie 20 ), with greater tissue uptake expected in a positive energy balance status. In our study, calculated energy balance was positive for all cows (9·8 (se 2·9) Mcal/d); however, as discussed later, compartmental modelling suggests that it is unlikely that a major fraction of trans-10, cis-12 CLA was incorporated into tissues other than the mammary gland.
Direct transfer was completed by 37 h after bolus infusion, based on intersection of the exponentials. Palmquist & Mattos( Reference Palmquist and Mattos 6 ) used this bi-exponential model approach to investigate transfer of 14C-labelled LA to milk. In their experiments, total LA transfer to milk ranged between 39 and 56 % depending on the basal diet. Of the total LA transferred, direct transfer ranged from 86 to 90 % and indirect transfer ranged from 10 to 14 %. Our data show lower direct transfer of trans-10, cis-12 CLA, presumably owing to differences in CLA post-absorptive metabolism and to acute inhibition of FA transfer and secretion in milk owing to the milk fat depressing action of this CLA isomer.
Milk cis-9, trans-11 CLA following the bolus in the current experiment did not fit the non-linear model because of the second peak in milk cis-9, trans-11 CLA that occurred after 86 h.
Milk fat, fatty acids and desaturase ratios
MFD is characterised by a reduction in milk fat yield up to 50 %, without reduction of milk yield or other milk components. During MFD, yield of both de novo-synthesised and preformed FA are decreased in milk, but there is a greater reduction in de novo-synthesised FA( Reference Harvatine, Boisclair and Bauman 5 ). In this study, milk fat concentration and yield progressively decreased following CLA bolus infusion, reaching a nadir 4 d post-infusion and returning to pre-bolus values by days 5 and 6, respectively (online Supplementary Fig. S1). Concentration of milk de novo-synthesised FA (sum of all saturated and unsaturated paired number FA less than 16 carbons in length; <16 C) and mixed-source FA (sum of all saturated and unsaturated 16 carbon FA; 16 C FA) were acutely reduced following the CLA bolus, reached a nadir at 50 h after infusion with an 8·5 and 9·5 % reduction and slowly returned to pre-bolus values by 288 and 110 h after infusion, respectively (online Supplementary Fig. S2). As expected, the proportion of milk preformed FA (sum of all known saturated and unsaturated FA not taken into account into de novo or mixed-source FA and all >16 C FA) progressively increased, peaked at 50 h (13 % increase) and remained high throughout the study. The time course of milk fat concentration and yield, and milk de novo and preformed FA concentration, followed a similar pattern to that observed by Harvatine & Bauman( Reference Harvatine and Bauman 9 ) who provided trans-10, cis-12 CLA as a 7·5-g bolus followed by 2·5 g every 4 h. Inhibition of de novo and mixed-source FA synthesis is expected with trans-10, cis-12 CLA infusion, owing to transcriptional regulation of genes involved in milk fat synthesis by this CLA isomer( Reference Harvatine, Boisclair and Bauman 5 ).
Expression of important lipogenic enzymes including SCD1 (i.e. FA synthase and acetyl-CoA carboxylase α) and lipogenic transcription factors (sterol regulatory element binding protein 1 and thyroid hormone responsive spot 14) are coordinately reduced in the lactating mammary gland during abomasal trans-10, cis-12 CLA infusion( Reference Harvatine and Bauman 21 , Reference Baumgard, Matitashvili and Corl 22 ). Particularly, SCD1 expression was reduced 54 % (P<0·01) in mammary tissue during abomasal infusion of 13·6 g/d of trans-10, cis-12 CLA( Reference Baumgard, Matitashvili and Corl 22 ). Desaturase ratios are the product:precursor ratios for the SCD1 enzyme (ex. C14 ratio=C14:1/(C14:0+C14:1)), and despite the lack of correlation with SCD1 enzyme activity in adipose tissue( Reference Archibeque, Lunt and Gilbert 23 ) milk desaturase ratios are often used as a proxy for mammary gland SCD1 enzyme activity in MFD experimental models (trans-10, cis-12 CLA abomasal infusion)( Reference Harvatine and Bauman 9 , Reference Baumgard, Matitashvili and Corl 22 ). The SCD1 enzyme activity and the desaturase ratios are acutely reduced by trans-10, cis-12 CLA, with Harvatine & Bauman( Reference Harvatine and Bauman 9 ) reporting nadir at 12 h after initiation of infusion. In the present study, milk C14 desaturase ratio followed an inverse pattern of milk trans-10, cis-12 CLA, dropping 15 % at 14 h post-infusion and progressively returning to pre-bolus values 50 h post-infusion (online Supplementary Fig. S3). The C16 and C18 desaturase ratios were also decreased 9·5 and 13 % and returned to baseline at 26 and 38 h, respectively (online Supplementary Fig. S3). As expected, the reduction and recovery of SCD1 activity was opposite of the pattern of milk trans-10, cis-12 CLA, which indeed illustrates the inhibitory effect of this CLA isomer on the SCD1 enzyme. As discussed by Harvatine & Bauman( Reference Harvatine and Bauman 9 ), the short-life of SCD1 enzyme (2–4 h) allows observation of acute responses in gene expression resulting either from direct trans-10, cis-12 CLA inhibition or through other signalling pathways regulating milk fat synthesis enzyme expression and activity.
Inhibition of the SCD1 gene has important implications for determining endogenous synthesis and transfer of cis-9, trans-11 CLA to milk fat. Although we expect that endogenous synthesis of cis-9, trans-11 CLA was decreased in a similar pattern as 14 C desaturase ratio, transfer of exogenous cis-9, trans-11 CLA provided in the bolus to milk limits the interpretation of changes in the trans-11 18 : 1 desaturase ratio.
Interestingly, 126 h post-bolus infusion, the 14 C desaturase ratio increased above pre-bolus levels. This may represent an overshoot in regulation of SCD1 as the trans-10, cis-12 CLA inhibition was relieved. The second peak in cis-9, trans-11 CLA appears to be driven by this increase in SCD1 activity.
Compartmental modelling
The major objective of this study was to quantify trans-10, cis-12 CLA transfer to milk through the direct and indirect pathway, and, through compartmental modelling, to characterise tissue compartments involved in trans-10, cis-12 CLA transfer to milk. For this, compartmental models (one for each CLA isomer) were independently developed to describe the observed data (CLA in plasma and milk) and parameter values were determined using WinSAAM. In the trans-10, cis-12 CLA model (Fig. 4(a)), Compartment 2 represents the abomasum, which is the site of bolus infusion, as well as the site of loss of undigested trans-10, cis-12 CLA. Absorbed trans-10, cis-12 CLA is transferred to delay component 3, representing the site of chylomicron production. Chylomicron trans-10, cis-12 CLA (mainly in TAG) is secreted into a fast turning-over plasma pool (Compartment 4) that can either be transferred to a slow turning-over non-chylomicron LP pool (Compartment 5; with CLA presumably in phospholipids or cholesteryl esters) or to an accessible pool in the mammary gland (Compartment 6). Observed data for plasma trans-10, cis-12 CLA were partitioned into two simulated compartments (Compartments 4 and 5) using a ‘summer function’ in WinSAAM to fit the data to a model that reflects known physiology. Uptake of plasma CLA by extravascular tissues is represented in Compartment 6. During the model development process, a separate compartment for extravascular tissues other than the mammary gland was included; however, based on best fit, extravascular tissues were grouped into one. We report that this extravascular compartment is primarily composed by the mammary tissue with the assumption that the mammary gland is the principal tissue involved in FA uptake, based on the known high rate of FA uptake in the lactating mammary gland( Reference Palmquist and Mattos 6 ). The data also indicate that, once in the extravascular tissue compartment, trans-10, cis-12 CLA can be either secreted to luminal milk fat (Compartment 8) and delivered to milk (Compartments 9 (twice-daily collected milk) and 10 (cumulative milk)) or transferred to a pool of CLA that is transiently unavailable (Compartment 7) and slowly recycles to the available pool for milk fat synthesis. In addition, the data indicate that there is irreversible loss of trans-10, cis-12 CLA from the unavailable extravascular tissue pool [L(0,7)] that might be explained by β-oxidation; however, mammary oxidation of FA is generally low( Reference Emery 24 , Reference Annison, Linzell and Fazakerley 25 ). At present, the cellular location of the unavailable trans-10, cis-12 CLA pool (Compartment 7) and the biological fate of the irreversible loss are biologically unknown.
Proposed compartmental models for conjugated linoleic acid (CLA) isomer kinetics in lactating dairy cows. (a) Model for trans-10, cis-12 CLA and (b) shows the partially parallel model for cis-9, trans-11 CLA.
 and
and
 , sites of sampling;
 , compartments;
 , delay elements;
 , a forcing function;
 and
and
 , fractional transfer coefficients [L(I,J)s] or the fraction of CLA in Compartment J that is transferred to Compartment I each day. Model-predicted values for L(I,J)s are shown with the appropriate arrows. (a) Compartment 2 represents the site of administration of the bolus dose (abomasum). Component 3 represents CLA absorption and packaging into chylomicrons. Compartments 4 and 5 represent CLA in chylomicrons and non-chylomicron lipoproteins, respectively; total plasma CLA is the sum of these two compartments. Compartment 6 represents a CLA pool in extravascular primarily mammary tissue, which is available for milk fat synthesis and secretion into the lumen of mammary ducts (Compartment 8); CLA in Compartment 6 can also exchange with a second, non-accessible extravascular primarily mammary tissue pool of CLA (Compartment 7, from which there is irreversible loss). Compartment 9 represents secreted milk collected twice daily and Compartment 10 represents cumulative milk collections. The fractional transfer rate for CLA to the two milk compartments is identical [L(10,8)=L(9,8)], except that Compartment 9 was ‘emptied’ after each milk collection. (b) Compartments 35 and 30 represent plasma and milk trans-11 18 : 1, respectively, resulting from absorption and mammary gland uptake of this fatty acid. The remaining parts of the model are the same as in (a) with L(3,2)=L(13,12), L(4,3)=L(14,13), L(5,4)=L(15,14), L(6,4)=L(16,14), L(6,5)=L(16,15) and L(8,6)=L(18,16).
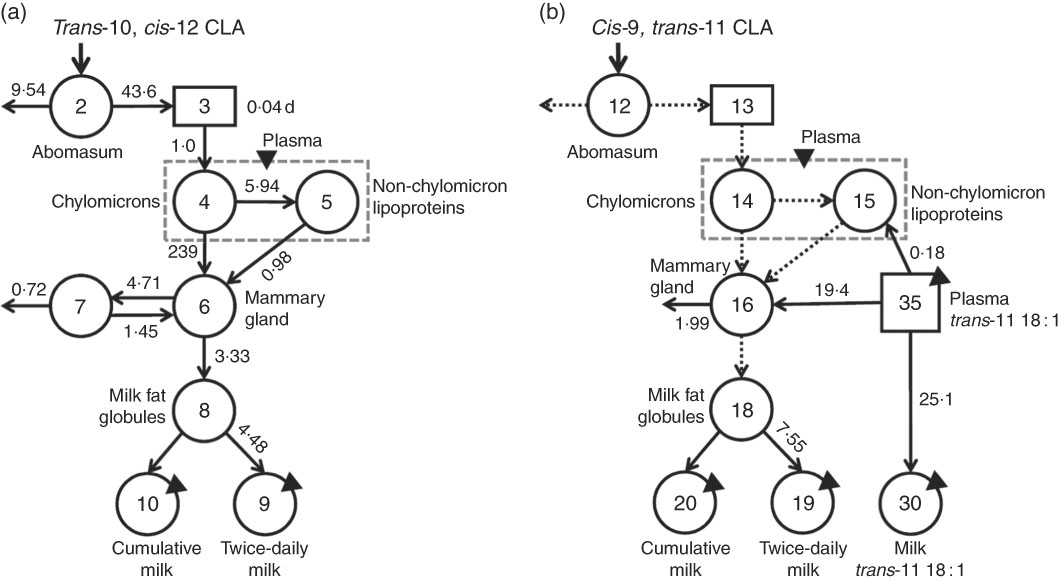
Once the model for trans-10, cis-12 CLA was completed, an independent model for cis-9, trans-11 CLA was developed (Fig. 4(b)), and then parameter values were made the same (
) in the cis-9, trans-11 CLA model as in the model for trans-10, cis-12 CLA for biological processes assumed to be the same for the two isomers (i.e. absorption, plasma LP transport until CLA is taken up by extravascular tissue, transfer of CLA to intraluminal milk fat). In addition, because trans-11 18 : 1 is a precursor for cis-9, trans-11 CLA, data for plasma trans-11 18 : 1 (component 35) were used as a forcing function to help define the system kinetics for cis-9, trans-11 CLA. As shown in Fig. 4(b), plasma trans-11 18 : 1 turned over into plasma or extravascular, primarily mammary tissue cis-9, trans-11 CLA (Compartment 16), or it was directly transferred to a trans-11 18 : 1 milk pool (Compartment 30). In contrast to the model for trans-10, cis-12 CLA, only one extravascular pool was required to fit the data for cis-9, trans-11 CLA (Compartment 16, from which there was irreversible loss). The absence of an unavailable extravascular pool of cis-9, trans-11 CLA suggests that the two CLA isomers are processed differently and therefore compartmental modelling provides support for the hypothesis that cis-9, trans-11 and trans-10, cis-12 CLA are biologically unique.
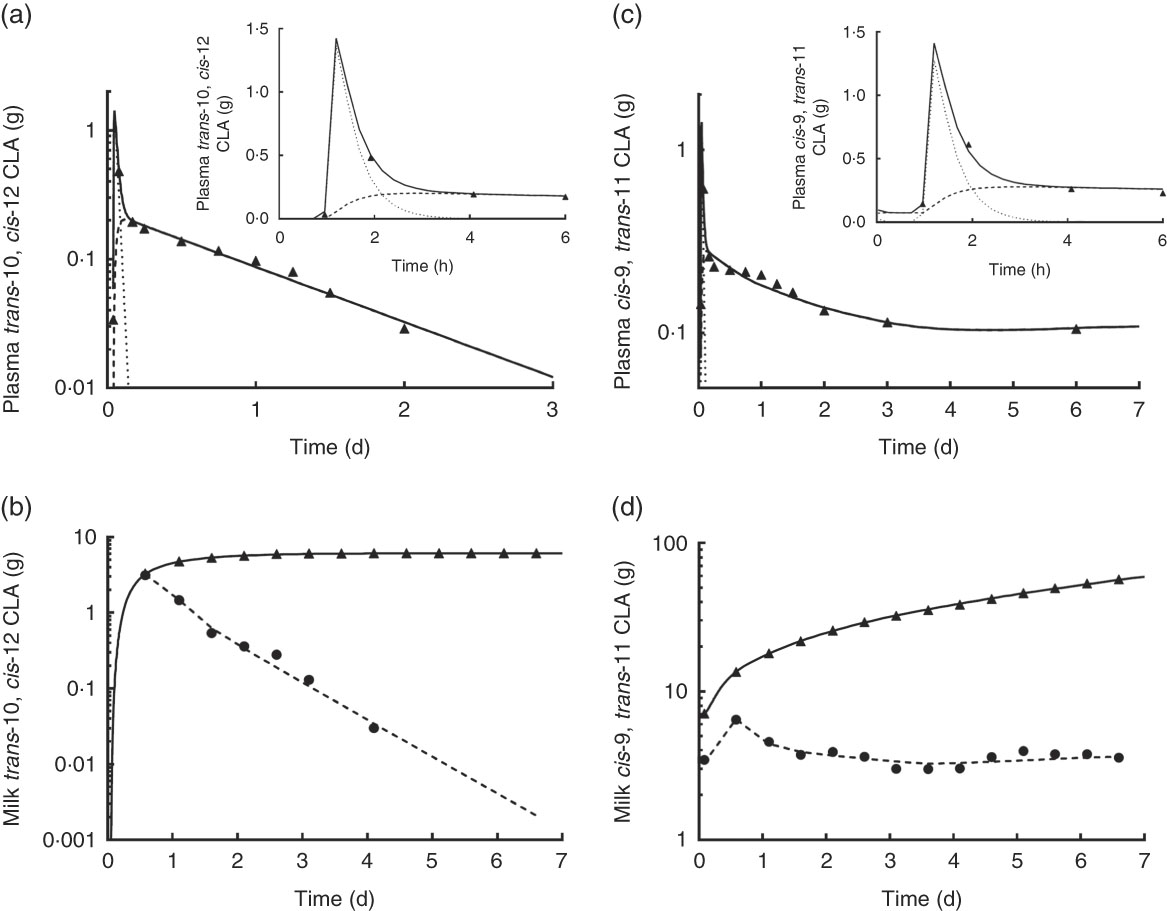
Observed and model-predicted fits to the data for both CLA isomers in plasma and milk v. time are shown in Fig. 5. For trans-10, cis-12 CLA in plasma (Fig. 5(a)), the composite model-simulated curve (
 ) represents the sum of the fast turning-over chylomicron pool (
 ; Compartment 4, shown in Fig. 4(a)) and the slow turning-over non-chylomicron LP pool (
 ; Compartment 5). Chylomicron trans-10, cis-12 CLA peaked at approximately1 h (Fig. 5(a) inset) and then rapidly fell as CLA was either transferred to other LP or taken up by the mammary gland. Trans-10, cis-12 CLA in non-chylomicron LP gradually increased with time and by approximately 2 h was higher than CLA in chylomicrons. Fig. 5(b) shows the model-simulated fit to the data for twice-daily milk collections (
; Compartment 9) and cumulative milk (
; Compartment 10). For the individual milk collections, trans-10, cis-12 CLA decreased from approximately 14 h to 3·5 g d, after which this isomer was no longer detectable in milk. Over the same time, trans-10, cis-12 CLA in cumulative milk increased, reaching a plateau when the isomer reached approximately 6 g in milk.
; Compartment 5). Chylomicron trans-10, cis-12 CLA peaked at approximately1 h (Fig. 5(a) inset) and then rapidly fell as CLA was either transferred to other LP or taken up by the mammary gland. Trans-10, cis-12 CLA in non-chylomicron LP gradually increased with time and by approximately 2 h was higher than CLA in chylomicrons. Fig. 5(b) shows the model-simulated fit to the data for twice-daily milk collections (
; Compartment 9) and cumulative milk (
; Compartment 10). For the individual milk collections, trans-10, cis-12 CLA decreased from approximately 14 h to 3·5 g d, after which this isomer was no longer detectable in milk. Over the same time, trans-10, cis-12 CLA in cumulative milk increased, reaching a plateau when the isomer reached approximately 6 g in milk.
Observed data and model predicted fit for plasma and milk trans-10, cis-12 and cis-9, trans-11 conjugated linoleic acid (CLA) v. time. (a) and (c) show observed data (
) and model-predicted curves for plasma (
), as well as for the two simulated plasma pools (chylomicrons (
) and non-chylomicron lipoproteins (
)); insets show curves from 0 to 6 h. (b) and (d) show observed data (
and
 ) and model-calculated curves for twice-daily milk collections (
) and for cumulative milk collections (
). The models are shown in Fig. 4.
) and model-calculated curves for twice-daily milk collections (
) and for cumulative milk collections (
). The models are shown in Fig. 4.
The model-predicted kinetic parameters (L(I,J)s and the delay time in component 3) are indicated in Fig. 4 with arrows describing traffic between compartments. Using these parameter values, the model estimated that 18 % of the trans-10, cis-12 CLA that entered the system was irreversibly lost from Compartment 2 (abomasum) during digestive processes, likely owing to non-absorbed CLA. For simplification, our proposed model did not include a compartment representing duodenum; therefore, non-absorbed CLA is represented as abomasal loss. Previous studies have shown high apparent intestinal digestibility of trans-10, cis-12 CLA, ranging from 69 to 100 %, depending on basal diet composition( Reference Pappritz, Lebzien and Meyer 18 , Reference Loor, Ueda and Ferlay 26 , Reference Loor, Ueda and Ferlay 27 ). In addition, of the trans-10, cis-12 CLA that was absorbed (82 %), 71 % was transferred to milk (Compartment 10), whereas 29 % was irreversibly lost from Compartment 7, presumably by oxidation. Experimental approaches to measure transfer of trans-10, cis-12 CLA to body tissues have not allowed an accurate approximation( Reference von Soosten, Kramer and Jahreis 28 ), and in the present study tissues other than plasma and milk were not sampled. However, based on the transfer of trans-10, cis-12 CLA to milk (58 % from compartmental modelling (82×71 %) and 41 % from direct measurement (Table 2)) and the irreversible loss (23·8 % from compartmental modelling (82×29 %)) it is unlikely that a major fraction of trans-10, cis-12 CLA was incorporated into extravascular tissues other than the mammary gland. Before being irreversibly lost from the unavailable extravascular pool, trans-10, cis-12 CLA recycled between the two extravascular compartments an average of 1·4 times. The model also predicted that the TTM50 % for trans-10, cis-12 CLA was 13 h. Mean transit times for CLA isomers in the plasma pools, mammary pools and the pool representing intraluminal milk fat are shown in Table 3.
Model-derived mean transit times for conjugated linoleic acid (CLA) isomers in lactating dairy cows
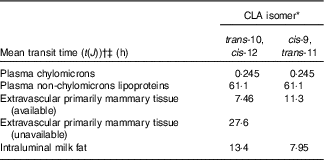
* Treatment was a single abomasal bolus of 15 g of each CLA isomer, trans-10, cis-12 CLA and cis-9, trans-11 CLA, infused over a 30-min period. Values were obtained by compartmental modelling of least-square means for each CLA isomer, n 5. The model is shown in Fig. 4.
† Calculated as t(J)=1/∑ L(I,J)s exiting Compartment J.
‡ Mean transit times represent the average amount of time that CLA isomers remain in a compartment before leaving it reversibly or irreversibly, expressed in hours.
For plasma cis-9, trans-11 CLA, Fig. 5(c) shows the model-predicted composite plasma curve (
) and simulations for cis-9, trans-11 CLA in the two plasma pools: the fast (
) and slow (
) turning-over compartments (Compartments 14 and 15, respectively, as shown in Fig. 4(b)). As shown in Fig. 5(c) inset (0 to 6 h), and similar to trans-10, cis-12 CLA (Fig. 5(a)), cis-9, trans-11 CLA in chylomicrons peaked at approximately1 h, the same time that cis-9, trans-11 CLA began to gradually increase in non-chylomicron LP. The two curves crossed at approximately 2 h, after which cis-9, trans-11 CLA was higher in non-chylomicron LP. Fig. 5(d) shows the model-predicted fit for the twice-daily milk collections (
; Compartment 19) and cumulative milk (
; Compartment 20). Data for the individual milk collections indicate that cis-9, trans-11 CLA increased slightly before 1 d and then, in contrast to trans-10, cis-12 CLA (Fig. 5(b)), was present in milk at a relatively steady level (3–4 g) until the end of the experiment. As a result, cumulative milk collections for cis-9, trans-11 CLA increased linearly from approximately 14 h, and by 7th day they were ten times the amount of trans-10, cis-12 CLA found in milk.
On the basis of results from the compartmental models, cis-9, trans-11 CLA in the mammary gland was transferred to milk at a higher fractional rate than trans-10, cis-12 CLA (7·55 v. 4·48/d), which is in agreement with our direct measurements (Table 2) that showed higher transfer to milk of cis-9, trans-11 than trans-10, cis-12 CLA (79 v. 41 %). In addition, cis-9, trans-11 CLA appeared to be lost (presumably oxidised) from the extravascular tissue pool (Compartment 16) at a higher fractional rate compared with trans-10, cis-12 CLA. This finding could relate to trans-10, cis-12 CLA recycling in the extravascular primarily mammary tissue that was not found to occur for cis-9, trans-11 CLA. On the basis of these models, we also estimated that approximately 40 % of plasma trans-11 18 : 1 was converted to cis-9, trans-11 CLA in the mammary gland for further transfer to milk fat, that <1 % was converted to cis-9, trans-11 CLA before mammary gland uptake and that the remaining fraction was directly transferred to milk as trans-11 18 : 1.
Conclusions
This study characterised the transfer of trans-10, cis-12 and cis-9, trans-11 CLA to plasma and milk using a perturbation experimental model, and showed higher milk transfer rates for trans-10, cis-12 CLA than previous reports, owing to extended sample collection period, which allowed measurement of indirect transfer. Compartmental modelling of CLA isomers revealed an interesting working hypothesis of trafficking of trans-10, cis-12 CLA within extravascular tissues primarily represented by the mammary gland, with a transient pool of unavailable trans-10, cis-12 CLA that is slowly transferred to milk. However, this work could be extended to test the interaction of lactation and diet effects. Overall, this study provides a better understanding of the physiology of MFD and, importantly, of tissue barriers (mechanisms) involved in the delay of MFD recovery.
Acknowledgements
The authors thank Y. Ying, F. Pino, R. Bomberger and N. Shulman (Penn State University, University Park) for their assistance during experimental periods and laboratory analyses, as well as Dr Arnulf Troescher (BASF) for helpful discussion and BASF for donating the CLA stock.
This research was funded by Penn State University. N. L. U. was a recipient of a PhD scholarship from the Foreign Fulbright Program, USA, and from CONICYT, Chile. M. T. was a recipient of an internship from the Summer Research Opportunity Program of Penn State University, USA.
N. L. U. and K. J. H. designed the experiments; N. L. U. and M. B. conducted the experiment; N. L. U., M. T., J. L. F., M. H. G. and K. J. H. analysed experimental samples and data; and N. L. U., J. L. F. and K. J. H. wrote the paper and K. J. H. has primary responsibility for the final content.
The authors declare that there are no conflicts of interest.
Supplementary material
For supplementary material/s referred to in this article, please visit https://doi.org/10.1017/S0007114518001551