
The authors apologise for typographical errors in the above article.
In multiple instances it is stated that both multinomial logistic regression and linear regression were used for modelling. However, only logistic regression was utilised since the outcome for all models is dichotomic (class membership yes/no). This error is present on pages 408 (abstract), 410 (Methods) and 413 (Table 5). These errors do not affect the results, as logistic regression was originally employed, but was mistakenly labelled as linear regression.
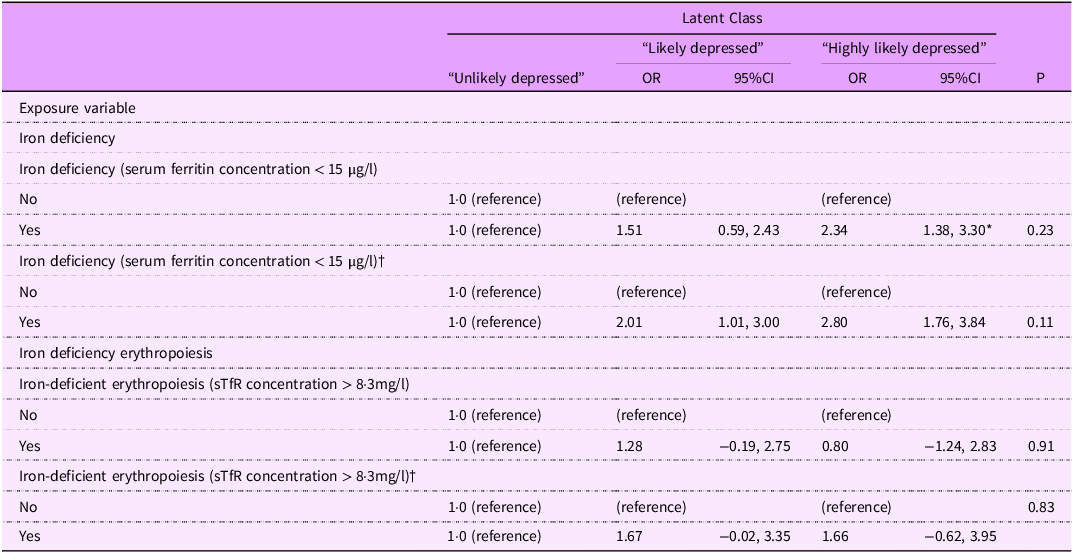
Furthermore, there are errors in Table 4 under the category “Iron deficiency (serum ferritin concentration < 15 μg/l)” and “Iron deficiency erythropoiesis (sTfR concentration > 8·3 mg/l)†”. In both instances, the first row should be labelled “no”, and the second row should be labelled “yes”. For the same table, all analyses have been re-run, and the corrected values for the iron deficiency erythropoiesis adjusted model have been updated.
A corrected version of Table 4 is below:
Table 4. Probability of latent class membership for exposure variables: results obtained by multinomial logistic regression analysis

sTfR, soluble transferrin receptor.
Values indicate OR, obtained by multinominal logistic regression analyses with class 1 (‘unlikely depressed’) as the reference category. P-values are based on Wald statistics.
sTfR, CRP, AGP: serum concentrations of soluble transferrin receptor, C-reactive protein and α1-acid glycoprotein.
*Interpretation: girls with iron deficiency have 134·0 % higher odds of being ‘highly likely depressed’ compared with girls without iron deficiency.
†Iron deficiency model adjusted for years since menstruation, BMI z-scores, CRP and AGP. Iron-deficient erythropoiesis model adjusted for the same variable than iron deficiency model and age at menarche.


 Open access