


INTRODUCTION
The election of individuals with criminal backgrounds to public office can compromise democratic governance by distorting policymaking and eroding public trust. Against this backdrop, several countries—including Belgium, Brazil, Denmark, Germany, and Türkiye—have enacted constitutional provisions and election laws that bar certain convicted felons from running for office. Others, such as Norway, Slovenia, Sweden, Switzerland, and the United States (specifically, the U.S. Congress), rely on democratic processes to exclude criminal offenders from elected positions. Must democracies rely on institutional bans to keep criminals out of office, or can we count on democratic processes to do the job?
Political parties act as gatekeepers by determining who appears on the ballot and, in list-based systems, how candidates are ranked. Because many political careers develop through long-term involvement in party activities—such as youth organizations, committee service, and campaign work—parties have repeated opportunities to observe prospective candidates, giving them insight into competence and integrity (Mattozzi and Merlo Reference Mattozzi and Merlo2015). However, limited candidate supply, inadequate vetting procedures, factional interests, or strategic considerations may still lead them to nominate individuals with publicly documented criminal histories. Voters can serve as an independent check through their electoral choices, rewarding trusted candidates and penalizing those they doubt. Still, voter judgments are often made under conditions of limited information, shaped by ideological commitments, media narratives, and campaign messaging (see, e.g., Anduiza, Gallego, and Muñoz Reference Anduiza, Gallego and Muñoz2013; De Vries and Solaz Reference De Vries and Solaz2017; Eggers Reference Eggers2014).
These dynamics raise key empirical questions: to what extent can parties and voters prevent candidates with criminal backgrounds from gaining office—and who plays the more decisive role? We investigate these questions in the context of Norwegian local politics, a setting that is especially suitable for three main reasons.
First, with no legal barriers against electing convicts, Norway provides an ideal environment to assess democracy’s capacity to prevent unlawful individuals from entering and advancing in politics. While Norway ranks among the least corrupt countries worldwide,Footnote 1 news coverage shows that individuals with criminal backgrounds have been elected to public office. For example, the national newspaper Aftenposten identified 46 convicts that entered municipal councils following the 2023 local elections.Footnote 2 Public skepticism is evident as well—Figure A.2 in the Supplementary Material shows that many Norwegians believe representatives misuse their authority for personal gain.
Second, local elections are decided by a flexible-list system: voters can express their preference for individual politicians (as in open-list systems) and parties can choose to assign an advantaged position to some of their candidates (akin to closed-list systems). Candidates placed in these advantaged positions are placed on the top of the list and receive a “head start” in personal votes, making it more difficult for other candidates to compete in the intra-party contest (Fiva, Izzo, and Tukiainen Reference Fiva, Izzo and Tukiainen2024). Nevertheless, voter preferences still significantly shape the electoral outcome: about 24% of elected council members in our sample were chosen directly because of personal votes, which means they would not have been elected based on party rankings alone.
Third, our study benefits from an exceptional dataset: detailed criminal records for every candidate who ran for local office in Norway from 2003 to 2019. This comprehensive dataset allows us to compare politicians with the general adult population, controlling for characteristics, such as gender, age, working status, income, and municipality of residence. The data on criminal records, covering the period from 1998 to 2022, include information on types of crime, timing, and punishment.
It is the combination of these three features that makes Norway an unusually valuable research case. The absence of formal bans on electing convicts provides a clear test of democracy’s ability to self-police; the flexible-list electoral system—situated between open and closed lists in Carey and Shugart’s (Reference Carey and Shugart1995) typology—allows us to observe both party gatekeeping and voter-driven candidate promotion; and the exceptional individual-level data permit a systematic analysis of selection across the different stages. These conditions create an ideal setting for identifying the relative effectiveness of party vetting and voter selection. These selection mechanisms are not uniquely Norwegian: in proportional representation (PR) systems, parties play a central gatekeeping role in determining which candidates appear on the ballot, while voters ultimately evaluate them at the ballot box.Footnote 3 Given that these mechanisms are fundamental features of democratic systems, analyzing their operation in this context sheds light on potential vulnerabilities elsewhere. Our findings clarify not only the extent to which criminal candidates are excluded but also when and how vetting occurs.
We document a clear downward pattern in criminal involvement across the political hierarchy. Candidates who are nominated but not elected are less likely to have received a court-issued legal sanction than the general population. Among elected officials, the prevalence of criminal involvement is even lower, with mayors displaying the lowest levels of lawbreaking behavior.
We uncover three distinct mechanisms behind this pattern. First, the sharpest reduction in criminal involvement occurs at the initial nomination stage, particularly within established local party organizations. While the initial nomination reflects both a candidate’s willingness to put themselves forward and a party’s willingness to endorse them, long-established local parties are likely to have stronger vetting procedures and deeper knowledge of prospective candidates. The fact that established local party organizations systematically field fewer convicted candidates suggests that parties play a central role in screening out individuals with criminal backgrounds.
Second, parties reinforce this selection by strategically placing their most law-abiding nominees at the top of their ballots. Since the mayor is almost always chosen from among these first-ranked candidates, the office represents the clearest manifestation of party vetting. The extremely low incidence of criminal backgrounds among mayors thus reflects how party organizations shape not only who enters politics but also who reaches its highest local positions.
Third, voters provide only modest additional filtering at the polls through their personal votes. Their contribution to keeping convicted individuals out of office is negligible compared to the vetting carried out by party organizations. This may partly reflect that the voters take for granted that the nomination process has already filtered out undesirable candidates.
To probe the scope conditions of our findings, we analyze variation in candidate supply, information contexts shaped by municipality size, and local crime prevalence through a set of heterogeneity analyses. These analyses allow us to assess whether the filtering mechanisms we identify operate similarly under more demanding local conditions.
We contribute to the growing literature on political parties as gatekeepers in candidate selection. One strand of research investigates how party leaders incentivize candidates to align with party goals and invest in costly campaign efforts (e.g., Invernizzi and Prato Reference Invernizzi and Prato2025; Mattozzi and Merlo Reference Mattozzi and Merlo2015). Along these lines, scholars examining list-based electoral systems have debated whether parties strategically assign high-quality candidates to the top or middle positions on their electoral lists (e.g., Buisseret et al. Reference Buisseret, Folke, Prato and Rickne2022; Cox et al. Reference Cox, Fiva, Smith and Sørensen2021; Crutzen, Konishi, and Sahuguet Reference Crutzen, Konishi and Sahuguet2024). Our study advances this literature by empirically examining how a candidate’s lawfulness—a novel measure in this context—affects their position on party lists.
Another strand of literature examines how parties leverage their gatekeeping power to further strategic interests, such as ensuring positions for preferred candidates (e.g., Buisseret and Prato Reference Buisseret and Prato2022; Fiva, Izzo, and Tukiainen Reference Fiva, Izzo and Tukiainen2024). Incumbent party leaders may see highly capable or well-regarded candidates as threats, leading them to prioritize loyalty over competence (Besley et al. Reference Besley, Folke, Persson and Rickne2017). A crucial decision is the selection of the candidate placed at the top of the list, effectively nominating them as the party’s mayoral candidate. Our contribution is to empirically assess whether mayoral candidates are selected positively or negatively on lawfulness compared to council members, and to determine the role of party versus council vetting.
We also contribute to an expanding literature that leverages register data to study the selection of quality attributes to politics (for reviews, see Dal Bó and Finan Reference Dal Bó and Finan2018; Gulzar Reference Gulzar2021). In an influential study, Dal Bó et al. (Reference Dal Bó, Finan, Folke, Persson and Rickne2017) show that elected politicians in Sweden are positively selected on cognitive skills, a pattern also observed in Norway (Cox et al. Reference Cox, Fiva, Smith and Sørensen2021), Denmark (Dahlgaard and Pedersen Reference Dahlgaard and Pedersen2025), and Finland (Jokela et al. Reference Jokela, Meriläinen, Tukiainen and von Schoultz2025). Similarly, Sørensen (Reference Sørensen2024) shows that Norwegian politicians are positively selected on pro-social attitudes as measured by charitable giving. As far as we know, our article is the first study to document that a representative democracy can prevent criminals from entering politics and to uncover the processes that drive this outcome.Footnote 4
Elsewhere, democratic processes appear less effective at filtering out criminally linked candidates. Between 2004 and 2014, Indian candidates accused of criminal activities were almost three times more likely to secure election victories compared to candidates without such allegations (Vaishnav Reference Vaishnav2017, 12). This phenomenon is so pronounced that jail time has been described as a “badge of honor” in Indian politics.Footnote
5 $ {}^{,} $
Footnote
6 Similarly, Britto et al. (Reference Britto, Daniele, Le Moglie, Pinotti and Sampaio2024) document the overrepresentation of criminally charged candidates in Brazilian politics, even though convicted individuals are legally barred from holding elected office. By focusing on an established democracy, our study speaks directly to the broader challenge of how even robust systems can falter and pose a threat to democratic norms and stability.
$ {}^{,} $
Footnote
6 Similarly, Britto et al. (Reference Britto, Daniele, Le Moglie, Pinotti and Sampaio2024) document the overrepresentation of criminally charged candidates in Brazilian politics, even though convicted individuals are legally barred from holding elected office. By focusing on an established democracy, our study speaks directly to the broader challenge of how even robust systems can falter and pose a threat to democratic norms and stability.
OUR EMPIRICAL CASE: NORWAY
This section reviews Norway’s institutional setting, focusing on local government and elections—the arena where most political careers start and where our data are drawn—before outlining the criminal justice system that defines how crimes are sanctioned.
Local Politics
Norwegian local governments provide essential welfare services, including schooling, elderly care, and child care. Each local government is governed by a council of 11–77 members, who make decisions by simple majority rule. Elected every four years in September, these councils ensure democratic representation for all citizens over 18, including eligible foreign residents.Footnote 7 During the first council meeting after the election, members elect both a mayor and an executive board. As the council’s key figure, the mayor directs the activities of the executive board.
Local elections in Norway operate under a flexible-list PR system, with local party organizations beginning their nomination procedures about a year before the election. While Norwegian election law sets formal requirements for the content of list proposals, it does not specify how they should be determined. Local party organizations typically appoint a nomination committee to recruit candidates, but senior party members—including the incumbent leadership—often have significant influence over the final composition of the lists (Fiva, Izzo, and Tukiainen Reference Fiva, Izzo and Tukiainen2024). The final ballot is usually decided at a nomination meeting open to all local party members.
The election system permits parties to grant certain candidates a “head start,” equivalent to 25% of the party’s total vote count. This advantage renders it nearly impossible for other candidates to rival “head start” candidates within the same party (Fiva, Izzo, and Tukiainen Reference Fiva, Izzo and Tukiainen2024).Footnote 8 The advantaged candidates are listed in bold letters at the top of the party list. The initial ranking of candidates does not otherwise play any formal role, except if there is a tie. The top-ranked candidate on a party’s list is its mayoral candidate.
Voters cast a ballot for a party, determining the across-party seat distribution, and can indicate their preference for specific candidates by marking checkboxes on the party list. This process, along with the candidates’ head start status, establishes the basis for the within-party seat distribution.
In systems where parties allocate nominations for elected and appointed offices based on seniority, as in Norway, candidates must invest significant time and effort to reach positions where they can extract rents (Cirone, Cox, and Fiva Reference Cirone, Cox and Fiva2021). This extended career path increases the costs of running, discouraging individuals primarily motivated by short-term personal gain.Footnote 9 Even so, some individuals may still view local political office as an opportunity to secure personal benefits, despite the limited immediate financial returns. While large-scale rent extraction in general is lower in Norway than in high-corruption settings, local office still provides discretionary power, budget influence, and privileged networks that can be leveraged for personal gain.Footnote 10
The Criminal Justice System
The justice sector in Norway includes the police (politiet), the public prosecutor’s office (påtalemyndighetene), and the courts (domstolene), each playing a key role in criminal justice. The police enforce laws, investigate crimes, and issue fixed penalties for minor offenses. They also initiate investigations upon discovering or receiving reports of criminal activity. The public prosecutor decides whether to press charges, with around $ 40\% $
of formal charges going to court, while the rest are dismissed, fined, or resolved through alternative processes (Bhuller, Khoury, and Løken Reference Bhuller, Khoury and Løken2025). The courts determine guilt and appropriate punishment.
$ 40\% $
of formal charges going to court, while the rest are dismissed, fined, or resolved through alternative processes (Bhuller, Khoury, and Løken Reference Bhuller, Khoury and Løken2025). The courts determine guilt and appropriate punishment.
The Norwegian court system consists of three tiers: the district court (tingretten), the court of appeals (lagmannsretten), and the supreme court (høyesterett). All criminal cases start in the district court, where most cases are resolved (Bhuller et al. Reference Bhuller, Dahl, Løken and Mogstad2020), and both the convicted and the prosecutor can appeal decisions.
Figure 1 illustrates the various pathways a crime can take within the criminal justice system. It details the process from the commission of a crime to the relevant institution responsible for handing out the legal sanction, as well as the possible outcomes of the crime not being detected, not being reported, not being prosecuted, or ending in acquittal.
Stages from Crime to Legal Sanction in the Norwegian Justice System
Note: This figure is adapted from Thorsen, Lid, and Stene (Reference Thorsen, Lid and Stene2009, 19) and outlines the different pathways a crime can take within the legal system from the moment it is committed. The public prosecutor’s office oversees three main types of legal sanctions: fixed penalties, penalty charge notices, and conditional dismissal of criminal proceedings. The courts are responsible for administering five additional sanctions: fines, probation, imprisonment, community punishment, and special sanctions.

Norwegian politicians do not enjoy legal immunity, and holding office does not shield individuals from criminal liability. While the Norwegian Constitution (Section 20) grants the government discretionary power to issue pardons, such decisions are rare, politically costly, and do not erase convictions. Moreover, local politicians have no institutional authority over judicial outcomes, so holding office offers no protection in legal matters.
Legal Sanctions
Legal sanctions are broadly categorized into eight distinct subgroups.Footnote 11 The least severe crimes are punished with a fixed penalty (forenklet forelegg), which is a fine typically issued immediately upon apprehension of an offense by the police. These fines are predominantly issued for minor traffic infringements.
The penalty charge notice (forelegg) is a more severe penalty than a fixed fine, issued by the public prosecutor’s office. It includes a fine based on the offense and the offender’s financial situation. Acceptance resolves the case without court involvement, but refusal sends it to court. If individuals over 18 fail to pay, they may face imprisonment.
The focus in this article is on the five most severe legal sanctions, that is, judicial sanctions issued by the courts which include fines, probation, imprisonment, community punishment, and special sanctions.Footnote 12 Courts frequently impose a combination of these sanctions, such as imprisonment alongside a fine.
PARTY GATEKEEPING AND VOTER CHOICE IN LIST-BASED PROPORTIONAL REPRESENTATION SYSTEMS
Electoral rules structure the balance of influence between parties and voters in candidate selection. In closed-list systems, parties exercise near-total control by determining candidate rankings (e.g., Cox et al. Reference Cox, Fiva, Smith and Sørensen2021; Crutzen, Konishi, and Sahuguet Reference Crutzen, Konishi and Sahuguet2024). In open lists, by contrast, candidate ranking is established by voters’ preference votes rather than by the party, shifting power away from parties (e.g., Carey Reference Carey2007; Carey and Shugart Reference Carey and Shugart1995; Persson and Tabellini Reference Persson and Tabellini2000). Norway’s flexible-list system lies in between: parties assign candidates to advantageous slots, but voters can use personal votes to influence which candidates are elected. Yet the scope for voter influence is limited by information asymmetries—while parties learn about aspirants through years of internal engagement (Cirone, Cox, and Fiva Reference Cirone, Cox and Fiva2021; Mattozzi and Merlo Reference Mattozzi and Merlo2015), voters often have less insight into candidates’ qualifications. This difference in access to information creates an asymmetry that shapes the candidate selection process. The following discussion reviews theoretical perspectives on this process and their relevance to our empirical analysis.
Political Parties as Gatekeepers
Political parties act as gatekeepers in the political selection process by determining which candidates appear on the ballot and where they are placed. In our empirical analysis, we examine the start of political careers through initial nominations on party lists, which reflect both a candidate’s willingness to run and the party’s decision to include them on the ballot. Party leaders carefully consider candidates’ attributes, as the right mix enhances electoral success and ultimately shapes the party’s identity. When assembling a list of candidates, political parties balance several objectives.
First, party leaders aim to incentivize individual candidates’ behavior in order to get them to contribute to the party’s goals and invest in costly campaign efforts (e.g., Cox et al. Reference Cox, Fiva, Smith and Sørensen2021; Invernizzi and Prato Reference Invernizzi and Prato2025). In closed (or semi-closed) electoral systems, candidates who only care about securing their own seats have little incentive to exert effort if they hold safe, top-list positions. This suggests that placing high-quality candidates in the middle of the list could improve the party’s overall electoral success by motivating all candidates to campaign more actively (Crutzen, Konishi, and Sahuguet Reference Crutzen, Konishi and Sahuguet2024). However, if candidates also value executive positions and parties commit to assigning these positions strictly by list rank, the strongest candidates will instead be placed at the top (e.g., Cox et al. Reference Cox, Fiva, Smith and Sørensen2021).Footnote 13 We empirically examine whether lawfulness follows a hump-shaped pattern, increases with rank, decreases with rank, or remains flat; the latter could occur if candidates with questionable legality are rare, reducing the need for party screening.
Second, parties may also use their gatekeeping power to advance strategic interests, such as securing positions for preferred candidates (e.g., Fiva, Izzo, and Tukiainen Reference Fiva, Izzo and Tukiainen2024). If unlawful individuals attain influential positions within a party, they may view other candidates as threats to their leadership. As a result, incumbent party leaders might resist nominating highly competent individuals, prioritizing loyalty over quality (Besley et al. Reference Besley, Folke, Persson and Rickne2017). In our empirical context, a key decision is selecting the candidate placed at the top of the list, effectively nominating them as the party’s mayoral candidate. We examine whether mayors are positively or negatively selected compared to council members.Footnote 14
Third, when candidate quality is fully observable to voters, electoral competition incentivizes parties to exclude all low-quality candidates (Galasso and Nannicini Reference Galasso and Nannicini2011). However, parties may sometimes face a limited pool of high-quality candidates. As a result, party leaders must balance trade-offs among various candidate attributes, such as criminal background, campaign effectiveness, ideological alignment, party loyalty, and managerial competence. To assess the empirical significance of candidate supply, we will split our analyses by parties’ list length (a proxy for candidate supply).
Fourth, screening capacity likely varies significantly across local party organizations. Long-established local parties typically have stronger vetting procedures and local networks, allowing for more effective candidate screening. We examine this by using a party’s presence in the previous local election as a proxy for screening capacity.
Voter Selection
Norway’s flexible-list PR system enables voters to express candidate preferences through personal votes. If parties and voters share the same information and prioritize integrity similarly, voters have little reason to alter the party’s proposed ranking.
However, these conditions are not necessarily met (e.g., Chong et al. Reference Chong, De La O, Karlan and Wantchekon2015; Ferraz and Finan Reference Ferraz and Finan2011). First, information asymmetry may limit voters’ ability to evaluate candidates. Media coverage tends to focus on high-profile politicians, while privacy and rehabilitation laws may restrict access to public records, including criminal convictions.
Second, new information that was previously unknown to parties may emerge during the election campaign. Voters may also have private knowledge about specific candidates that the party lacks, prompting them to cast preference votes.
Third, even when credible information about criminal records is available, voters may discount its relevance due to partisan bias, in-group loyalty, or selective exposure to media sources. In polarized environments, the voters may view a party’s criminal involvement as a lesser evil compared to its main rival, reducing their incentives to prioritize clean candidates (Eggers Reference Eggers2014; Mares and Visconti Reference Mares and Visconti2020; Solaz, De Vries, and De Geus Reference Solaz, De Vries and De Geus2019). A further possibility is that voters who distrust political elites may actually favor candidates with criminal records, interpreting them as disruptive outsiders capable of challenging the status quo.Footnote 15
Although court decisions are public in Norway, perpetrators’ identities are often anonymized to protect privacy and support rehabilitation. This limits voters’ ability to vet candidates through official records. However, media coverage and the close-knit nature of many communities (the median municipality has around 5,000 inhabitants) may compensate for this through social networks and local reputation. Moreover, Norway’s multi-party system provides voters with alternatives: rather than being confined to a flawed list, they can shift support to an ideologically similar party or even establish a new local list if the preferred party repeatedly nominates undesirable individuals.
Although we cannot directly test how information about criminal records influences voter behavior, we examine whether personal familiarity influences candidate selection by comparing municipalities of different sizes. If informal networks substitute for formal knowledge, positive selection may be stronger in smaller municipalities, where social ties and local reputations play a larger role.
Discussion
Our analysis so far has emphasized how candidate selection unfolds in the Norwegian flexible-list context. To place these mechanisms in a broader perspective, it is important to note that voters in some settings often tolerate or even support candidates with criminal backgrounds. Studies on Brazil (Britto et al. Reference Britto, Daniele, Le Moglie, Pinotti and Sampaio2024), India (Vaishnav Reference Vaishnav2017), Italy (Daniele and Geys Reference Daniele and Geys2015), and the Philippines (Teehankee and Thompson Reference Teehankee and Thompson2016) show that such candidates are frequently elected to prominent political positions. The 2024 U.S. presidential election further illustrates how voters may overlook or reinterpret a candidate’s criminal record. President Donald J. Trump became the first convicted felon to win the presidency, with many of his supporters viewing the legal cases against him as politically motivated rather than legitimate prosecutions.Footnote 16 His victory highlights how ideological polarization and skepticism toward established institutions can outweigh concerns about candidate integrity. These recent developments in the United States have intensified concerns about democratic backsliding by linking the electoral success of candidates with criminal records to the erosion of democratic norms and institutions (Levitsky and Ziblatt Reference Levitsky and Ziblatt2019; Lieberman et al. Reference Lieberman, Mettler, Pepinsky, Roberts and Valelly2019).
The cases discussed differ from Norway regarding factors such as crime prevalence, electoral systems, and political contexts.Footnote 17 Yet, the recent example from the 2024 U.S. presidential election illustrates that even well-established democracies are not immune to candidates with criminal records achieving political success. By focusing specifically on Norway—another stable, long-lasting democracy—this article explores how effectively democratic mechanisms can filter out such candidates.
DATA
Politician Data
We rely on a comprehensive dataset of candidates running for local office in Norway between 2003 and 2019, encompassing approximately 60,000 candidates per election (Fiva, Sørensen, and Vøllo Reference Fiva, Sørensen and Vøllo2024). This publicly available dataset provides detailed information on candidates’ background characteristics—such as year of birth, gender, and place of residence—along with election outcomes, party affiliation, list rank, and leadership positions.
Our starting point is the 300,176 candidates running for local office in the years 2003, 2007, 2011, 2015, and 2019. After excluding party-independent and minor party lists,Footnote 18 our sample comprises 268,477 candidates.
Since 2003, Statistics Norway has collected data on local election candidates, making it possible to match more than $ 99\% $
of candidates in our sample to their unique 11-digit personal number (personnummer), which is assigned to all Norwegians. These data are further linked to other registry databases maintained by Statistics Norway, including the Crime Register (Statistics Norway 2025), and provided to us in de-identified form. As a result, we have access to a panel dataset containing near-complete records of criminal convictions for every local politician and Norwegian citizen during our sample period.Footnote
19
$ 99\% $
of candidates in our sample to their unique 11-digit personal number (personnummer), which is assigned to all Norwegians. These data are further linked to other registry databases maintained by Statistics Norway, including the Crime Register (Statistics Norway 2025), and provided to us in de-identified form. As a result, we have access to a panel dataset containing near-complete records of criminal convictions for every local politician and Norwegian citizen during our sample period.Footnote
19
After excluding individuals whom Statistics Norway could not match, as well as those below the age of 20 in the election year and those who did not reside in Norway in the five years preceding the election year, we are left with a final sample of 259,992 candidate-year observations and 17,627,265 noncandidate-year observations.
Crime Register and Other Administrative Data
The crime register (Straffesaksregisteret) compiles all recorded penal sanctions from 1998 to 2022 in Norway for people aged 15 and above.Footnote 20 It includes detailed information about all offenses, such as the type of offense, sentencing, conviction year, and the year the offense occurred. Offenses in the register range from minor infractions such as speeding to serious crimes, such as fraud, rape, or homicide.
Due to the sensitivity of these records, our access to other administrative data from Statistics Norway is limited. However, we have key variables crucial for understanding criminal behavior in Norway, including a de-identified municipality-of-residence variable, gender, year of birth, employment status, and income decile, offering valuable insights into individuals’ socioeconomic context.
In our main analysis, we study crimes in five broad sub-groups: drug, economic, violence, traffic, and other crimes. In Table B.1 in the Supplementary Material, we display aggregate statistics from Statistics Norway to illustrate the specific crimes that dominate our sample. Driving under the influence was the most common crime that resulted in a court-issued legal sanction, followed by drug-related offenses under the penal code, speeding, assault, and violence against an officer. Table B.2 in the Supplementary Material reveals that imprisonment is the predominant form of punishment, accounting for nearly $ 50\% $
of all legal penalties handed down by the courts. Another
$ 50\% $
of all legal penalties handed down by the courts. Another $ 30\% $
of the convictions resulted in probation. Appendix B of the Supplementary Material gives further details about court-issued legal sanctions.
$ 30\% $
of the convictions resulted in probation. Appendix B of the Supplementary Material gives further details about court-issued legal sanctions.
To give a sense of what the crime data look like in combination with the data on local politicians, we plot the share of individuals who committed a crime in the five years leading up to the election year (i.e., from $ t-5 $
to
$ t-5 $
to $ t-1 $
) across various population groups in Figure 2. The upper left panel of Figure 2 shows that candidates running for office are less likely to have criminal records than the general population, with elected officials being even less likely than their unelected counterparts, and mayors having the cleanest records. In the remaining panels, we find that this pattern persists when we further break down criminal convictions by type of offense.
$ t-1 $
) across various population groups in Figure 2. The upper left panel of Figure 2 shows that candidates running for office are less likely to have criminal records than the general population, with elected officials being even less likely than their unelected counterparts, and mayors having the cleanest records. In the remaining panels, we find that this pattern persists when we further break down criminal convictions by type of offense.
Share of Politicians and Citizens with Criminal Convictions, by Crime Type
Note: This figure displays the share of individuals who committed a crime resulting in a court-issued legal sanction within the five years preceding the election year ( $ t-5 $
to
$ t-5 $
to $ t-1 $
). The upper left panel presents data on any crime committed, while the other panels provide a breakdown by the type of crime. The population is divided into four mutually exclusive categories: individuals not running for local office in year t (“Population”;
$ t-1 $
). The upper left panel presents data on any crime committed, while the other panels provide a breakdown by the type of crime. The population is divided into four mutually exclusive categories: individuals not running for local office in year t (“Population”; $ N= $
17,627,265), candidates running for local office in year t that are not elected (“Nominated (not elected)”;
$ N= $
17,627,265), candidates running for local office in year t that are not elected (“Nominated (not elected)”; $ N= $
212,207), candidates elected to local office in year t who do not serve as mayors (“Elected (non-mayors)”;
$ N= $
212,207), candidates elected to local office in year t who do not serve as mayors (“Elected (non-mayors)”; $ N= $
45,867), and those elected to local office in year t who are appointed mayors (“Mayors”;
$ N= $
45,867), and those elected to local office in year t who are appointed mayors (“Mayors”; $ N= $
1,918). We use data from elections held in 2003, 2007, 2011, 2015, and 2019.
$ N= $
1,918). We use data from elections held in 2003, 2007, 2011, 2015, and 2019.

To shed light on whether a criminal record signals broader behavioral patterns relevant for public office, we examine in Appendix D of the Supplementary Material the association between past convictions and other observable behaviors. Using data on recidivism, compliance with tax regulations, and charitable giving, we find that individuals with prior convictions are substantially more likely to reoffend, more likely to incur penalty taxes for inaccurate or incomplete reporting, and less likely to make charitable donations than those without a criminal record. These patterns hold both for the general population and for elected politicians, reinforcing the view that a criminal record reflects persistent traits relevant to candidate integrity.
METHODS
We consider political selection as a dynamic process occurring throughout an individual’s career, starting from their initial nomination and extending to potential executive positions. In this section, we describe a series of tests designed to quantify the extent to which lawful and unlawful citizens advance in the political hierarchy at different stages. The flexible-list electoral setting provides an ideal context for this study. It enables us to explore the underlying forces behind any positive selection, specifically, whether voters or party organizations play a more significant role in this process.
Initial Nomination
The start of a political career is reflected in the initial nomination on a party list, which depends on both the candidate’s willingness to stand for election and the party’s decision to include them on the ballot. We estimate the following model using ordinary least squares (OLS) to compare the criminal records of first-time candidates with those of individuals from the general population:
 $$ Crim{e}_{it}={\displaystyle \begin{array}{l}{\alpha}_t+\beta Ru{n}_{it}+\gamma Mal{e}_i+\sum_{l=20}^{100}{\delta}_l\mathbf{I}\left(l=Ag{e}_{it}\right)+\hskip2px {\epsilon}_{it}.\end{array}} $$
Here, $ Crim{e}_{it} $
is an indicator variable equal to 1 if individual i has been convicted of any serious crime within the five years prior to the election year.
$ Crim{e}_{it} $
is an indicator variable equal to 1 if individual i has been convicted of any serious crime within the five years prior to the election year. $ Ru{n}_{it} $
is a dummy variable that is equal to 1 for individuals running for office for the first time in election year t.
Footnote
21 We control for gender (
$ Ru{n}_{it} $
is a dummy variable that is equal to 1 for individuals running for office for the first time in election year t.
Footnote
21 We control for gender ( $ Mal{e}_i $
) and one-year age fixed effects from 20 to 100 [
$ Mal{e}_i $
) and one-year age fixed effects from 20 to 100 [ $ {\sum}_{l=20}^{100}{\delta}_l\mathbf{I}(l=Ag{e}_{it}) $
].Footnote
22 The parameter of interest,
$ {\sum}_{l=20}^{100}{\delta}_l\mathbf{I}(l=Ag{e}_{it}) $
].Footnote
22 The parameter of interest, $ \beta $
, captures the relative crime propensity of candidates running for office compared to individuals of the same age and gender in the general population (who never ran for office during the sample period). In extensions, we also include fixed effects for individuals’ working status, income decile, and municipality of residence. Standard errors are clustered at the municipality level in this and all subsequent analyses.
$ \beta $
, captures the relative crime propensity of candidates running for office compared to individuals of the same age and gender in the general population (who never ran for office during the sample period). In extensions, we also include fixed effects for individuals’ working status, income decile, and municipality of residence. Standard errors are clustered at the municipality level in this and all subsequent analyses.
The Best at the Top?
In electoral systems with flexible lists, political parties play a crucial role in determining election outcomes by assigning ranks to their candidates on the ballot (Buisseret et al. Reference Buisseret, Folke, Prato and Rickne2022; Cox et al. Reference Cox, Fiva, Smith and Sørensen2021; Crutzen, Konishi, and Sahuguet Reference Crutzen, Konishi and Sahuguet2024). As discussed above, a critical decision in our context is selecting the candidate to be placed at the top of the list, effectively nominating them as the party’s mayoral candidate. Another significant decision involves determining which candidates should get the top ranks.Footnote 23 To assess the role of political parties as gatekeepers, we estimate the following model using OLS:
 $$ Crim{e}_{it}={\displaystyle \begin{array}{l}{\alpha}_t+\sum_r\ {\beta}_r\mathbf{I}\left(r=Ran{k}_{it}\right)+\gamma Mal{e}_i\\ {}+\hskip2px \sum_{l=20}^{100}{\delta}_l\mathbf{I}\left(l=Ag{e}_{it}\right)+{\epsilon}_{it}.\end{array}} $$
This model is estimated for candidates running for office only. It is otherwise identical to Equation 1, except that $ Ru{n}_{it} $
has been replaced with list position fixed effects [
$ Ru{n}_{it} $
has been replaced with list position fixed effects [ $ {\sum}_r{\beta}_r\mathbf{I}(r=Ran{k}_{it}) $
]. These fixed effects run from list position
$ {\sum}_r{\beta}_r\mathbf{I}(r=Ran{k}_{it}) $
]. These fixed effects run from list position $ r=1 $
to list position
$ r=1 $
to list position $ r=9 $
, leaving lower-ranked candidates as the reference group (
$ r=9 $
, leaving lower-ranked candidates as the reference group ( $ r\ge 10 $
). If political parties prioritize “clean candidates,” we expect to see that the
$ r\ge 10 $
). If political parties prioritize “clean candidates,” we expect to see that the $ \beta $
’s are falling in absolute value by r. As noted above, theoretical expectations about the relationship between candidate traits and list rank vary: parties may place their most law-abiding candidates at the top, distribute them evenly, or even position them in the middle of the list, depending on how they weigh electoral strategy, effort incentives, and internal politics. Also for this model, we will assess the sensitivity of the results to the inclusion of various fixed effects (working status, income decile, and local party list).Footnote
24
$ \beta $
’s are falling in absolute value by r. As noted above, theoretical expectations about the relationship between candidate traits and list rank vary: parties may place their most law-abiding candidates at the top, distribute them evenly, or even position them in the middle of the list, depending on how they weigh electoral strategy, effort incentives, and internal politics. Also for this model, we will assess the sensitivity of the results to the inclusion of various fixed effects (working status, income decile, and local party list).Footnote
24
Do Voters Favor Candidates with Clean Records?
Electoral systems with preference voting allow citizens to endorse candidates they perceive as more law-abiding. Even if voters cannot directly observe a candidate’s criminal activities, they may still use informational shortcuts to screen candidates based on this dimension.Footnote 25 Individuals with criminal tendencies often display patterns of lower prosocial engagement (see Appendix D of the Supplementary Material), which in the electoral context may be reflected in reduced campaign effort or in the ideological positions they articulate (Jokela et al. Reference Jokela, Meriläinen, Tukiainen and von Schoultz2025).
To investigate if voters favor lawful candidates when casting their preference votes, we estimate the following model using OLS:
 $$ Improv{e}_{it}={\displaystyle \begin{array}{l}{\alpha}_t+\eta Crim{e}_{it}+\gamma Mal{e}_i\\ {}+\hskip2px \sum_{l=20}^{100}{\delta}_l\mathbf{I}\left(l=Ag{e}_{it}\right)+\theta Ran{k}_{it}+{\epsilon}_{it}.\end{array}} $$
Here, $ Improv{e}_{it} $
is a dummy variable that takes the value of 1 if candidate i in year t either ascended in the party-list or remained in the same position relative to their initial rank; in other words, if the candidate’s final rank was numerically lower or equal to their initial rank. Hence, popular candidates who receive enough personal votes to surpass others will have
$ Improv{e}_{it} $
is a dummy variable that takes the value of 1 if candidate i in year t either ascended in the party-list or remained in the same position relative to their initial rank; in other words, if the candidate’s final rank was numerically lower or equal to their initial rank. Hence, popular candidates who receive enough personal votes to surpass others will have $ Improv{e}_{it}=1 $
. Since lower-ranked candidates have a greater potential to improve their position compared to higher-ranked candidates, we control for initial rank (
$ Improv{e}_{it}=1 $
. Since lower-ranked candidates have a greater potential to improve their position compared to higher-ranked candidates, we control for initial rank ( $ Ran{k}_{it} $
) in Equation 3. The parameter of interest,
$ Ran{k}_{it} $
) in Equation 3. The parameter of interest, $ \eta $
, captures the extent to which voters favor lawful candidates when casting personal votes. Note that if voters switch parties to support candidates with a clean record, this behavior is not captured by Equation 3. As above, we will assess the sensitivity of the results to the inclusion of working status, income decile, and local party list fixed effects.
$ \eta $
, captures the extent to which voters favor lawful candidates when casting personal votes. Note that if voters switch parties to support candidates with a clean record, this behavior is not captured by Equation 3. As above, we will assess the sensitivity of the results to the inclusion of working status, income decile, and local party list fixed effects.
RESULTS
In this section, we present our main results. For each of the three tests that we described in the previous section, we first present graphical analyses and then proceed with the formal estimation framework, as laid out in Equations 1–3.Footnote 26
Initial Nomination
In Figure 3, we analyze the criminal records of first-time nominees in comparison to those of the general population within the same five-year age group.Footnote 27 The left-hand panel of Figure 3 displays the general male population with red circles, while the data for first-time male nominees are represented by brown triangles. The right-hand panel presents the corresponding plot for women.
Share of First-Time Nominees and Citizens with Criminal Convictions, by Age and Gender
Note: This figure displays the share of individuals who committed a crime resulting in a court-issued legal sanction within the five years preceding the election year ( $ t-5 $
to
$ t-5 $
to $ t-1 $
). We split the sample into two mutually exclusive groups: individuals not running for local office in year t (
$ t-1 $
). We split the sample into two mutually exclusive groups: individuals not running for local office in year t ( $ N= $
14,372,180), and individuals who are running for local office for the first time in year t (
$ N= $
14,372,180), and individuals who are running for local office for the first time in year t ( $ N= $
81,213). We use data from elections held in 2007, 2011, 2015, and 2019.
$ N= $
81,213). We use data from elections held in 2007, 2011, 2015, and 2019.

Figure 3 illustrates two well-known empirical regularities. First, beyond the late teens, the propensity to commit crime declines rapidly as individuals age (see, e.g., Farrington Reference Farrington1986; Hirschi and Gottfredson Reference Hirschi and Gottfredson1983). Second, men are much more likely to be involved in criminal activities than women (see, e.g., Steffensmeier and Allan Reference Steffensmeier and Allan1996).
The key take-away from Figure 3 is that first-time male candidates tend to exhibit lower levels of criminal behavior than the general male population, whereas first-time female candidates display similar levels of legal compliance as their counterparts in the general female population.
Estimates of $ \beta $
in Equation 1 are reported in Table 1. In line with the graphical analysis, the estimated difference is negative, indicating that first-time nominees are less likely to have a criminal background than the general population.Footnote
28 In Column 1, we estimate the difference in the proportion of individuals with a criminal record between first-time nominees and the general population, while including only election year fixed effects. The coefficient in Column 1 indicates that first-time nominees are about
$ \beta $
in Equation 1 are reported in Table 1. In line with the graphical analysis, the estimated difference is negative, indicating that first-time nominees are less likely to have a criminal background than the general population.Footnote
28 In Column 1, we estimate the difference in the proportion of individuals with a criminal record between first-time nominees and the general population, while including only election year fixed effects. The coefficient in Column 1 indicates that first-time nominees are about $ 0.7 $
percentage points—
$ 0.7 $
percentage points— $ 36\% $
relative to the mean—less likely to engage in criminal activities when compared to the general population. This result is robust to controlling non-parametrically for life cycle effects (Column 2), gender (Column 3), employment status and income decile (Column 4), and municipality fixed effects (Column 5).
$ 36\% $
relative to the mean—less likely to engage in criminal activities when compared to the general population. This result is robust to controlling non-parametrically for life cycle effects (Column 2), gender (Column 3), employment status and income decile (Column 4), and municipality fixed effects (Column 5).
Comparison of Criminal Convictions among First-Time Nominees and the General Population

Note: This table displays the regression results from Equation 1, comparing criminal involvement between first-time nominees ( $ N= $
81,213) and the general population (
$ N= $
81,213) and the general population ( $ N= $
14,372,180). Criminal involvement is defined as having committed a crime resulting in a court-issued legal sanction within the five years preceding the election year (
$ N= $
14,372,180). Criminal involvement is defined as having committed a crime resulting in a court-issued legal sanction within the five years preceding the election year ( $ t-5 $
to
$ t-5 $
to $ t-1 $
). Table F.1 in the Supplementary Material provides summary statistics for the estimation sample. Standard errors are clustered at the municipality level. Full model results are reported in Table G.1 in the Supplementary Material. Significance levels: ***: 0.01, **: 0.05, and *: 0.1.
$ t-1 $
). Table F.1 in the Supplementary Material provides summary statistics for the estimation sample. Standard errors are clustered at the municipality level. Full model results are reported in Table G.1 in the Supplementary Material. Significance levels: ***: 0.01, **: 0.05, and *: 0.1.
In Figure C.1 and Table C.1 in the Supplementary Material, we present results broken down by party affiliation. Among seven of the nine major parties, first-time nominees show lower levels of criminal involvement compared to the general population. However, two anti-establishment parties—the Red Party on the far-left and the Progress Party on the far-right—are notable exceptions. First-time nominees from the Red Party show no statistically significant difference in criminal involvement compared to the general population, whereas first-time nominees from the Progress Party display higher levels of criminal involvement.
In contrast to our findings, Britto et al. (Reference Britto, Daniele, Le Moglie, Pinotti and Sampaio2024) find that Brazilian first-time nominees are about twice as likely to have a criminal charge compared to the general population. This disparity may partly reflect Brazil’s political context, where opportunities for rent extraction are greater (see, e.g., Ferraz and Finan Reference Ferraz and Finan2008) and winning a mayoral election can lower the risk of conviction for past misconduct (Lambais and Sigstad Reference Lambais and Sigstad2023), in turn increasing the attractiveness of public office for individuals with criminal histories compared to Norway.
The Best at the Top?
In Figure 4, we examine the relationship between criminal involvement and candidate rankings, split by gender.Footnote 29 Figure 4 reveals a clear pattern: among male candidates, those ranked 1st and 2nd on the ballot are less likely to have criminal records than those ranked lower on the ballot. A similar trend is observed among female candidates, where those ranked 1st are the least likely to be involved in criminal activities compared to their counterparts positioned further down the ballot. This suggests that parties may be strategically prioritizing candidates with cleaner records for the top ballot positions, particularly for the highest-ranked spots, which corresponds to the party’s mayoral candidate.
Share of Candidates with Criminal Convictions across Initial Ranks, by Gender
Note: This figure displays the share of individuals who committed a crime resulting in a court-issued legal sanction within the five years preceding the election year ( $ t-5 $
to
$ t-5 $
to $ t-1 $
) per their initial rank. The x-axis is arranged inversely, positioning higher-ranked (numerically lower) individuals toward the right, with the mayoral candidates occupying the prime position at rank one. Candidates ranked tenth and lower are collectively categorized under rank “10+.” The y-axis displays the share who committed a crime for all candidates at the given rank position. We use data from elections held in 2003, 2007, 2011, 2015, and 2019.
$ t-1 $
) per their initial rank. The x-axis is arranged inversely, positioning higher-ranked (numerically lower) individuals toward the right, with the mayoral candidates occupying the prime position at rank one. Candidates ranked tenth and lower are collectively categorized under rank “10+.” The y-axis displays the share who committed a crime for all candidates at the given rank position. We use data from elections held in 2003, 2007, 2011, 2015, and 2019.

To more formally assess the role of political parties as gatekeepers, we estimate Equation 2, and report the results in Table 2. Each estimate represents the difference in the proportion of candidates with a criminal record relative to those in the reference category (rank 10 or lower). We progressively add more controls, following the same approach as in the previous analyses. Across all specifications, we consistently find that the top two candidates are the most law-abiding. In our preferred model, reported in Column 5, we find that candidates ranked 1–2 are about $ 0.35 $
percentage points less likely to have a criminal record compared to those ranked
$ 0.35 $
percentage points less likely to have a criminal record compared to those ranked $ 10 $
and above.Footnote
30 Only a few of the other coefficient estimates are statistically significant at conventional levels.Footnote
31 This suggests that parties prioritize virtue only for their most viable candidates, with this focus diminishing further down the list.Footnote
32
$ 10 $
and above.Footnote
30 Only a few of the other coefficient estimates are statistically significant at conventional levels.Footnote
31 This suggests that parties prioritize virtue only for their most viable candidates, with this focus diminishing further down the list.Footnote
32
Criminal Convictions among Top-Ranked and Lower-Ranked Candidates on Party Lists
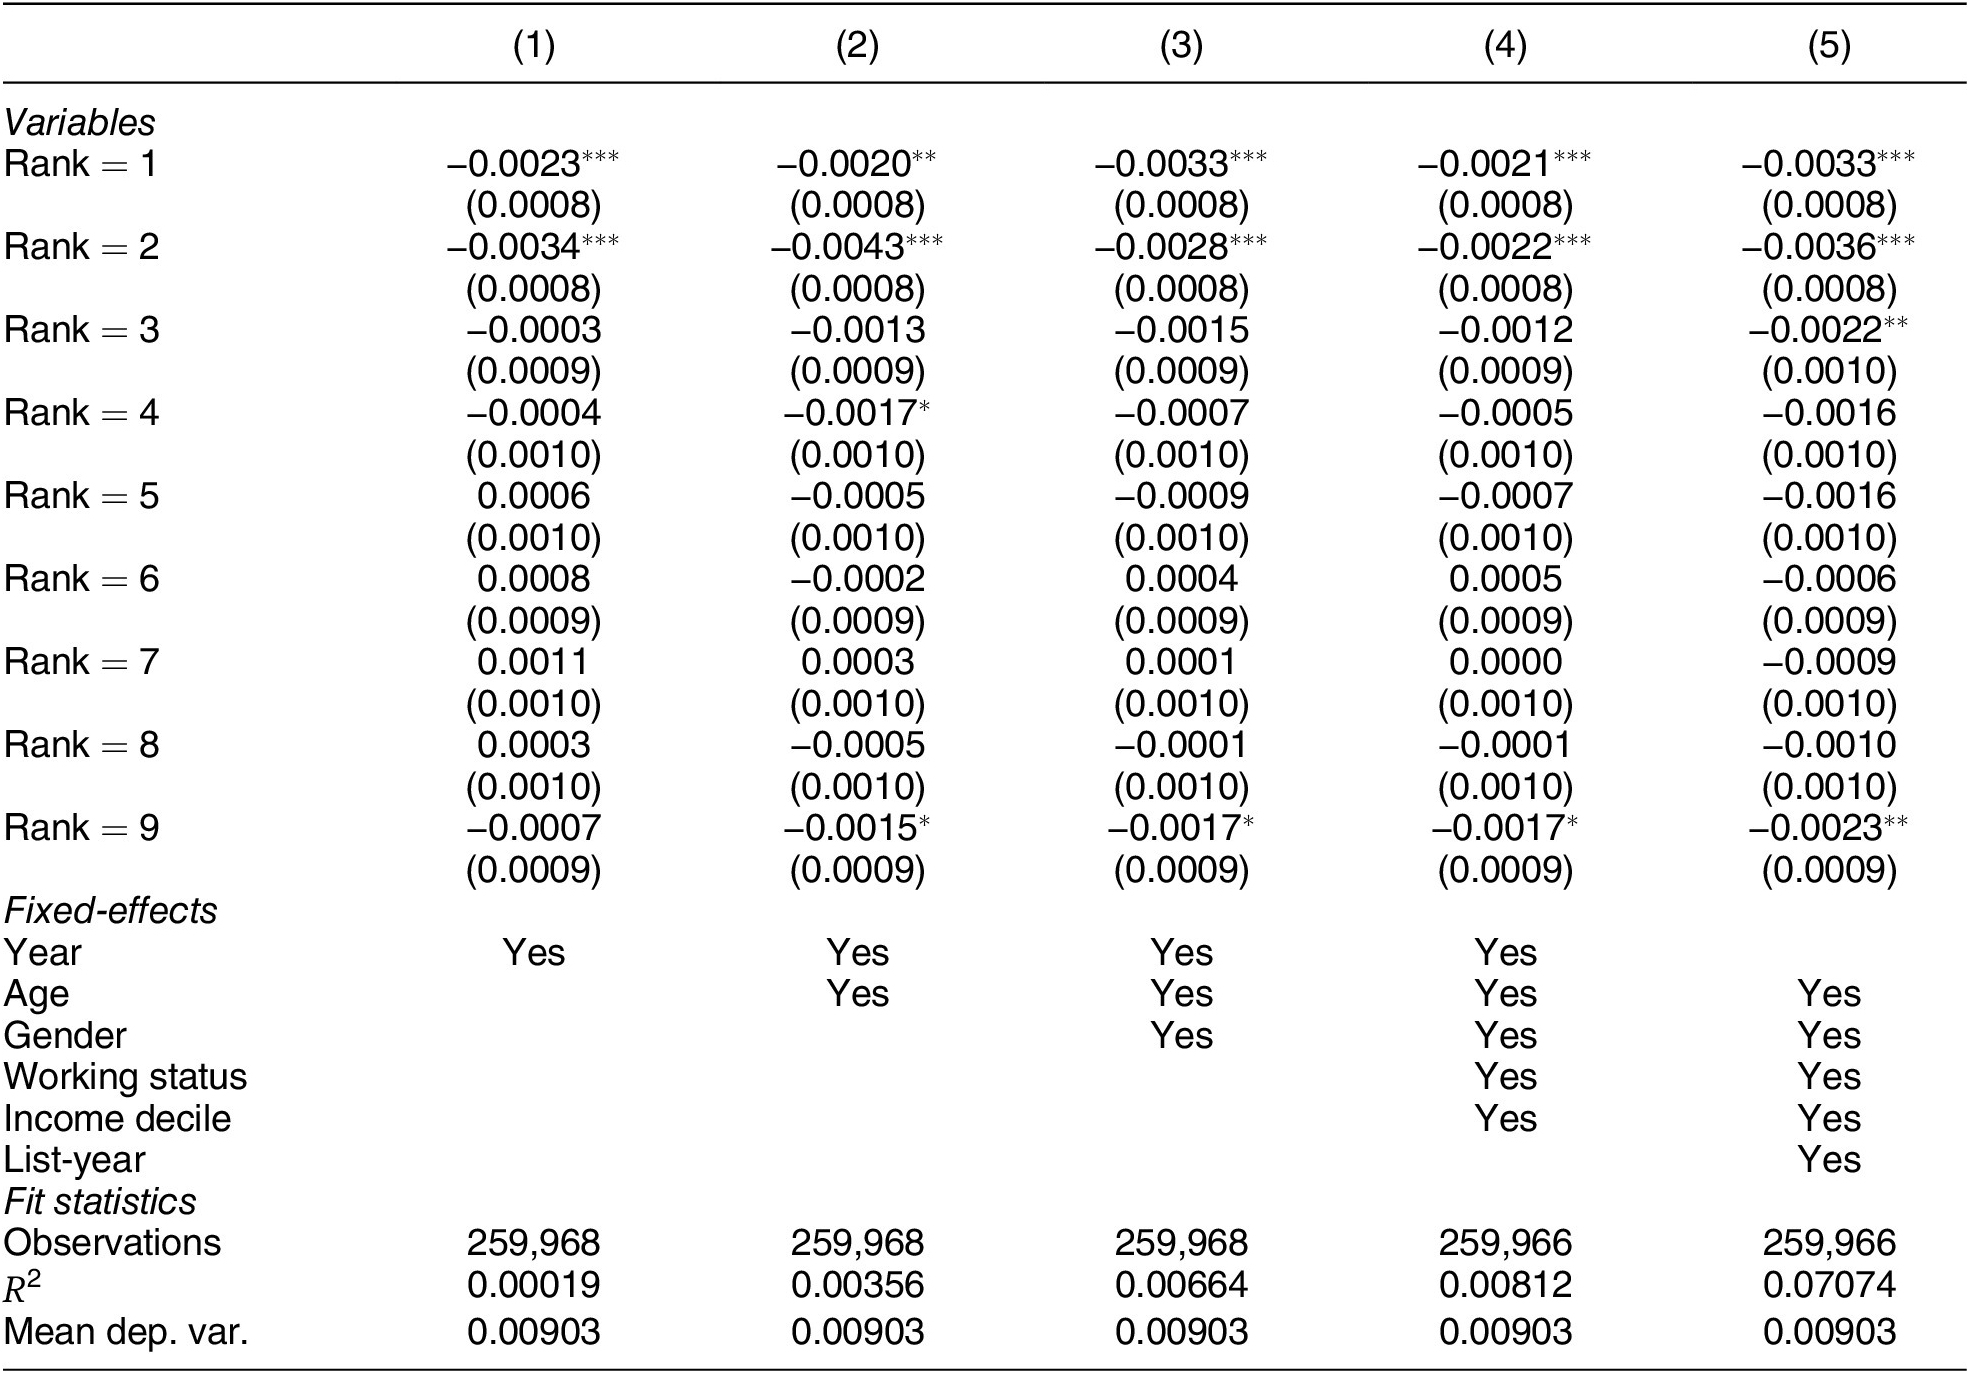
Note: This table displays the regression results from Equation 2, comparing criminal involvement across candidates of varying ranks. Criminal involvement is defined as having committed a crime resulting in a court-issued legal sanction within the five years preceding the election year ( $ t-5 $
to
$ t-5 $
to $ t-1 $
). We use candidates ranked 10 and above (
$ t-1 $
). We use candidates ranked 10 and above ( $ N=152,\hskip-0.15em 085 $
) as the reference group. Each estimate represents the difference in the proportion of candidates with a criminal record between those in the
$ N=152,\hskip-0.15em 085 $
) as the reference group. Each estimate represents the difference in the proportion of candidates with a criminal record between those in the $ 10+ $
category and those ranked 1st, 2nd, 3rd, 4th, and so on. Table F.2 in the Supplementary Material provides summary statistics for the estimation sample. Standard errors are clustered at the municipality level. Full model results are reported in Table G.2 in the Supplementary Material. Significance levels: ***: 0.01, **: 0.05, and *: 0.1.
$ 10+ $
category and those ranked 1st, 2nd, 3rd, 4th, and so on. Table F.2 in the Supplementary Material provides summary statistics for the estimation sample. Standard errors are clustered at the municipality level. Full model results are reported in Table G.2 in the Supplementary Material. Significance levels: ***: 0.01, **: 0.05, and *: 0.1.
This pattern likely reflects the environment in which parties operate. As discussed above, the incentives to exclude candidates with criminal backgrounds hinge on reputational and institutional constraints surrounding political leadership. In Norway, these constraints appear strong enough to generate the clear pattern at the top of the lists that we document. But in systems where individuals with criminal records already hold senior roles, parties may settle into a high-crime equilibrium in which promoting similarly unlawful candidates carries little political risk and loyalty to the entrenched leaders is valued over lawfulness.
Do Voters Favor Candidates with Clean Records?
Figure 5 explores how candidates’ final rankings—after incorporating personal votes—deviate from their initial positions on the ballot, comparing those with and without criminal records, separately by gender. If voters favor lawful candidates when casting personal votes, candidates with criminal backgrounds should fall to lower final ranks (higher numerically) compared to noncriminal counterparts starting from identical initial positions.
Final Candidate Rank after Personal Votes, by Initial Position, Conviction Status, and Gender
Note: This figure plots candidates’ mean final rank against their original position for those initially ranked 1–10. In the two panels, we split into two mutually exclusive groups: nominees who committed a crime resulting in a court-issued legal sanction within the five years preceding the election year ( $ N=975 $
), and those who did not (
$ N=975 $
), and those who did not ( $ N=111,\hskip-0.10em 482 $
). The dashed line indicates a situation where the initial rank equals the mean final rank. We use data from elections held in 2003, 2007, 2011, 2015, and 2019.
$ N=111,\hskip-0.10em 482 $
). The dashed line indicates a situation where the initial rank equals the mean final rank. We use data from elections held in 2003, 2007, 2011, 2015, and 2019.

In Figure 5, the red circles, representing convicted candidates, tend to be positioned above the brown triangles, representing non-convicted candidates, suggesting that voters are positively selecting politicians based on lawfulness when casting their personal votes.Footnote 33 However, the pattern observed in the raw data appears relatively modest.Footnote 34
In Table 3, we report the regression results from estimating Equation 3. Across all specifications, we find that individuals with a criminal record are statistically significantly less likely to improve their rank (or retain their original ballot position) compared to their non-convicted counterparts. As expected, lower-ranked candidates (those with higher numerical values for Initial rank) have a greater potential to improve their position compared to higher-ranked candidates, as reflected in the positive estimate for the control variable Initial rank. The key point estimate of approximately $ 0.075 $
in Column 5 indicates that individuals with a criminal background are about 7.5 percentage points less likely to improve or maintain their position compared to their peers, which is relatively modest compared to the average proportion of candidates who advance in rank within the estimation sample.Footnote
35 On average,
$ 0.075 $
in Column 5 indicates that individuals with a criminal background are about 7.5 percentage points less likely to improve or maintain their position compared to their peers, which is relatively modest compared to the average proportion of candidates who advance in rank within the estimation sample.Footnote
35 On average, $ 57\% $
of candidates in our sample advance or retain their rank, so the estimated effect corresponds to a
$ 57\% $
of candidates in our sample advance or retain their rank, so the estimated effect corresponds to a $ 13\% $
reduction relative to the average.
$ 13\% $
reduction relative to the average.
Rank Improvements after Personal Votes Comparing Convicted and Non-Convicted Politicians

Note: This table displays the regression results from Equation 3, analyzing the share of candidates who improve or maintain their rank due to personal votes between criminal and noncriminal politicians. Criminal involvement is defined as having committed a crime resulting in a court-issued legal sanction within the five years preceding the election year ( $ t-5 $
to
$ t-5 $
to $ t-1 $
). We split the sample into two mutually exclusive groups: (1) Candidates who were convicted of having committed a crime (
$ t-1 $
). We split the sample into two mutually exclusive groups: (1) Candidates who were convicted of having committed a crime ( $ N=2,\hskip-0.15em 202 $
) and (2) candidates who were not (
$ N=2,\hskip-0.15em 202 $
) and (2) candidates who were not ( $ N=245,\hskip-0.15em 651 $
). Each estimate represents the difference in the share improving or maintaining the ranks due to personal votes between convicted and non-convicted politicians. Table F.3 in the Supplementary Material provides summary statistics for the estimation sample. Standard errors are clustered at the municipality level. Full model results are reported in Table G.3 in the Supplementary Material. Significance levels: ***: 0.01, **: 0.05, and *: 0.1.
$ N=245,\hskip-0.15em 651 $
). Each estimate represents the difference in the share improving or maintaining the ranks due to personal votes between convicted and non-convicted politicians. Table F.3 in the Supplementary Material provides summary statistics for the estimation sample. Standard errors are clustered at the municipality level. Full model results are reported in Table G.3 in the Supplementary Material. Significance levels: ***: 0.01, **: 0.05, and *: 0.1.
In Table A.3 in the Supplementary Material, we repeat the analyses but instead of using a single explanatory crime variable, we include dummy variables for each of five mutually exclusive categories of crime. The results, taken at face value, suggest that candidates convicted of economic crimes are punished more harshly by voters, followed by those convicted of drug crimes. However, the large standard errors prevent us from drawing strong conclusions.
THE ROLE OF PARTIES, VOTERS, AND COUNCILS IN FILTERING CRIMINAL CANDIDATES
Decomposition of Effects
The previous analyses have shown that the electoral process positively selects candidates based on lawfulness through at least three steps: initial nomination, party ranking of candidates, and voter selection. To decompose the relative importance of each step, we rely on a set of counterfactual election outcomes.
We observe a total of 47,785 candidates elected in the local elections in the election years 2003, 2007, 2011, 2015, and 2019. In the counterfactual exercises, we draw a new set of council members from different populations. We then compare the average criminal involvement between the randomly drawn council members and the actual council members.
In the first counterfactual exercise, we randomly select individuals for the local council from the eligible population within the relevant municipality-year.Footnote 36 For these counterfactual council members, we calculate the average crime involvement during the five years preceding the relevant election. This random draw is repeated 1,000 times, before we take the average. This counterfactual outcome constitutes our population benchmark.
In the second counterfactual exercise, we begin by calculating the actual number of individuals elected from each party list. Next, we randomly select candidates from the relevant party list, disregarding their original rank and personal votes, and measure their crime involvement during the five years preceding the election. We carry out the process 1,000 times and then take the average. This counterfactual shows how important initial nomination is for political selection on lawfulness.
The third counterfactual exercise isolates the combined effect of initial nomination and party rankings. In this exercise, we choose candidates from a party list in the order they appear on the ballot, disregarding personal votes, thereby mimicking a closed-list electoral system.
The bar chart in Figure 6 presents the results of this exercise, showing the three counterfactuals alongside the actual election outcome. As we move from the counterfactual based on the general population (left-most bar, in red) to the actual election outcome (right-most bar, in turquoise), we observe that the largest decrease in criminal involvement occurs between the first and second counterfactual outcomes. This suggests that initial nomination on a party list is a crucial step in explaining why Norwegian local politicians are more law-abiding than the general population. There is also a substantial decrease from the second to the third counterfactual election outcome, reflecting that parties tend to reserve top spots on the lists to the most law-abiding candidates (Table 2). Since the third counterfactual and the actual election outcome show a similar proportion of individuals with criminal records, personal votes appear to have a negligible impact on excluding criminals from local politics. This may be because voters (correctly) assume that the nomination process has already filtered out (most) undesirable candidates.
Share of Council Members with Criminal Convictions under Actual and Counterfactual Election Outcomes
Note: This figure displays the share of individuals who committed a crime resulting in a court-issued legal sanction within the five years preceding the election year ( $ t-5 $
to
$ t-5 $
to $ t-1 $
) for different counterfactual and actual election outcomes. The left-most bar (red) represents council members randomly drawn from the entire eligible population residing in the municipality (“Random draw from municipality,” based on 1,000 draws). The next bar to the right (brown) shows council members randomly drawn from the relevant electoral list (“Random draw from list,” 1,000 draws). The subsequent bar (green) represents top candidates selected from a party list in the order they appear on the ballot, thereby mimicking a closed-list electoral system (“Top candidates selected”). Finally, the right-most bar (turquoise) depicts the actual election outcome (“Actual election outcome”).
$ t-1 $
) for different counterfactual and actual election outcomes. The left-most bar (red) represents council members randomly drawn from the entire eligible population residing in the municipality (“Random draw from municipality,” based on 1,000 draws). The next bar to the right (brown) shows council members randomly drawn from the relevant electoral list (“Random draw from list,” 1,000 draws). The subsequent bar (green) represents top candidates selected from a party list in the order they appear on the ballot, thereby mimicking a closed-list electoral system (“Top candidates selected”). Finally, the right-most bar (turquoise) depicts the actual election outcome (“Actual election outcome”).

Party Organization Capacity
Our analyses suggest that political parties can effectively screen out individuals with criminal backgrounds from their electoral lists and thereby limit their representation in local councils. To further examine the validity of this claim, we split our sample based on whether the local party organization in question was in operation in the previous local election, using this as a proxy for the screening capacity of the local party organization. This test follows from the theoretical expectation that long-established local parties are better equipped to vet candidates due to stronger networks and organizational capacity (see the earlier discussion of party screening capacity).
The left-hand panel of Figure 7 shows that in municipality-years where the local party organization was already active, candidate vetting appears to be strong. Criminal involvement drops substantially from the general population to those on the party list, and declines further when considering the counterfactual election outcome mimicking a closed-list electoral system. As in Figure 6, there is no evidence that voters play any role in the positive selection on lawfulness.
Council Members’ Criminal Convictions under Counterfactual Outcomes, Comparing New and Established Party Organizations
Note: This figure displays the share of individuals who committed a crime resulting in a court-issued legal sanction within the five years preceding the election year ( $ t-5 $
to
$ t-5 $
to $ t-1 $
) for different counterfactual and actual election outcomes. The sample is divided into two mutually exclusive groups: parties that had a list in the municipality during the previous local election (“Existing local party organization”) and parties that did not (“New local party organization”). The left-most bar (red) represents council members randomly drawn from the entire eligible population residing in the municipality (“Random draw from municipality,” based on 1,000 draws). The next bar to the right (brown) shows council members randomly drawn from the relevant electoral list (“Random draw from list,” 1,000 draws). The subsequent bar (green) represents top candidates selected from a party list in the order they appear on the ballot, thereby mimicking a closed-list electoral system (“Top candidates selected”). Finally, the right-most bar (turquoise) depicts the actual election outcome (“Actual election outcome”). We exclude data from 2003 due to the unavailability of the previous party list data for that year. Similarly, data from 2019 are excluded due to municipal mergers, which caused many established parties to appear as new in some municipalities.
$ t-1 $
) for different counterfactual and actual election outcomes. The sample is divided into two mutually exclusive groups: parties that had a list in the municipality during the previous local election (“Existing local party organization”) and parties that did not (“New local party organization”). The left-most bar (red) represents council members randomly drawn from the entire eligible population residing in the municipality (“Random draw from municipality,” based on 1,000 draws). The next bar to the right (brown) shows council members randomly drawn from the relevant electoral list (“Random draw from list,” 1,000 draws). The subsequent bar (green) represents top candidates selected from a party list in the order they appear on the ballot, thereby mimicking a closed-list electoral system (“Top candidates selected”). Finally, the right-most bar (turquoise) depicts the actual election outcome (“Actual election outcome”). We exclude data from 2003 due to the unavailability of the previous party list data for that year. Similarly, data from 2019 are excluded due to municipal mergers, which caused many established parties to appear as new in some municipalities.

In contrast, the right-hand panel shows that in municipality-years where local party organizations did not field a list in the previous election, their ability (or willingness) to vet candidates appears significantly weaker. The reduction in criminal involvement from the general population to the actual election outcome is quite modest, and once again, there is no indication that voters contribute to this positive selection.
The existing local party organizations tend to nominate fewer candidates with criminal records when compared to newer local party organizations. However, voter influence in filtering out criminal politicians appears minimal in both cases, suggesting that voters’ decisions are not significantly impacted by the number of criminal candidates running in this setting.
In Figure C.2 in the Supplementary Material, we provide results by national party brands. Notably, among political parties established over a century ago, selection based on lawfulness is stronger than in newer parties with weaker organizational structures, such as the Green Party, Red Party, and Progress Party.
Heterogeneity in Candidate Selection
Parties often face a limited supply of highly qualified candidates and must weigh trade-offs among attributes, such as criminal background, campaign effectiveness, ideological fit, party loyalty, and managerial skills. To proxy candidate supply, we divide parties by list length, splitting the sample into those with a list length below or above the municipal median in a given year (Figure A.6 in the Supplementary Material). This test follows from our theoretical expectation that limited candidate supply may constrain party selection. The underlying assumption is that longer lists reflect a broader candidate pool, increasing intra-party competition and allowing party leaders to be more selective. Consistent with this expectation, we find that parties with above-median list lengths have a lower share of candidates with criminal backgrounds, both overall and at the top of their lists.
In Figure A.7 in the Supplementary Material, we test whether candidate selection differs by municipal population size, reflecting our expectation that informal networks may substitute for formal information. If informal networks are important, positive selection should be stronger in smaller municipalities, where social ties and local reputation matter more. However, Figure A.7 in the Supplementary Material shows no meaningful differences between municipalities above and below the median population size.
One might hypothesize that parties’ ability to filter out candidates with criminal backgrounds is particularly effective in a low-crime country like Norway, potentially making it an outlier. In higher-crime environments, the pool of reputationally viable candidates may be smaller, making screening more challenging and costly; at the same time, higher crime can strengthen parties’ and voters’ incentives to vet carefully. Within Norway, average crime rates (defined as the share of residents with a criminal conviction in the past five years) vary substantially across municipality-year observations, ranging from 0.8% in the lowest decile to 3% in the highest decile. This within-country variation offers a useful test of whether our findings travel to more adverse settings. Figure A.8 in the Supplementary Material shows a moderately positive relationship between the share of criminals in the municipal population and the share among politicians. Yet, even in the highest-crime municipality-years—where 3% of residents have a recent criminal record—fewer than 1% of elected officials do. This pattern indicates that the filtering mechanisms we identify operate even under demanding local conditions, bolstering the external validity of our results.
Do Local Councils Vet Mayors?
In its first meeting after the election, the municipal council elects the mayor by majority vote. If a single party holds a majority of council seats, its first-ranked candidate will almost certainly fill the mayoral role, and within-council dynamics are unlikely to alter the outcome. However, in most cases, no party holds a majority, allowing for postelection negotiations about which candidate should be promoted to mayor.Footnote 37
As noted above, political parties almost always place their mayoral candidate at the top of their party list.Footnote 38 Thus, when council members vote on whom to promote to mayor, their choice is effectively restricted to the first-ranked candidates. To investigate whether local councils are more likely to promote first-ranked candidates with a clean track record to mayor, we run the following regression:
 $$ \begin{array}{rl}Crim{e}_{imt}={\theta}_{mt}+\tau Mayo{r}_{imt}+\psi SeatShar{e}_{p[i]mt}+{u}_{imt}.& \end{array} $$
Here, $ Crim{e}_{imt} $
is an indicator variable equal to 1 if the first-ranked candidate i, elected in municipality m in year t, was convicted of any serious crime within the five years preceding the election year.
$ Crim{e}_{imt} $
is an indicator variable equal to 1 if the first-ranked candidate i, elected in municipality m in year t, was convicted of any serious crime within the five years preceding the election year. $ Mayo{r}_{imt} $
is an indicator variable equal to 1 for candidates promoted to mayor. Municipality-year fixed effects (
$ Mayo{r}_{imt} $
is an indicator variable equal to 1 for candidates promoted to mayor. Municipality-year fixed effects ( $ {\theta}_{mt} $
) are included to ensure that inference for the parameter of interest,
$ {\theta}_{mt} $
) are included to ensure that inference for the parameter of interest, $ \tau $
, is derived from comparisons of first-ranked candidates elected to the same council at the same time (in different parties). Additionally, we control for the seat share of the party p represented by candidate i.
$ \tau $
, is derived from comparisons of first-ranked candidates elected to the same council at the same time (in different parties). Additionally, we control for the seat share of the party p represented by candidate i.
Because first-ranked candidates that belong to the same political party ( $ p[i] $
) can be particularly useful for predicting counterfactuals, we replace the municipality-year fixed effects (
$ p[i] $
) can be particularly useful for predicting counterfactuals, we replace the municipality-year fixed effects ( $ {\theta}_{mt} $
) with party-year fixed effects (
$ {\theta}_{mt} $
) with party-year fixed effects ( $ {\theta}_{p[i]t} $
) or municipality-party fixed effects (
$ {\theta}_{p[i]t} $
) or municipality-party fixed effects ( $ {\theta}_{mp[i]} $
) in alternative specifications.
$ {\theta}_{mp[i]} $
) in alternative specifications.
We present the results in Table 4. The estimate in Column 1 shows that mayors are 0.57 percentage points less likely to have a criminal record than the first-ranked candidates from other parties elected to the same council.
Criminal Records of Mayors Compared to First-Ranked Candidates Not Selected as Mayor

Note: Estimates correspond to Equation 4. Crime equals $ 1 $
if the first-ranked candidate committed an offense that resulted in a court-issued legal sanction within the five years preceding the election year (
$ 1 $
if the first-ranked candidate committed an offense that resulted in a court-issued legal sanction within the five years preceding the election year ( $ t-5 $
to
$ t-5 $
to $ t-1 $
). Mayor equals
$ t-1 $
). Mayor equals $ 1 $
for candidates promoted to mayor in the council’s postelection meeting. The sample includes 11,039 first-ranked candidates from the nine major parties, of whom 1,872 became mayors. Standard errors are clustered at the municipality level. Significance levels: ***: 0.01, **: 0.05, and *: 0.1.
$ 1 $
for candidates promoted to mayor in the council’s postelection meeting. The sample includes 11,039 first-ranked candidates from the nine major parties, of whom 1,872 became mayors. Standard errors are clustered at the municipality level. Significance levels: ***: 0.01, **: 0.05, and *: 0.1.
The difference is statistically significant at all conventional levels. This implies that first-ranked candidates who are not promoted to mayor resemble other elected candidates more closely than they do mayors (see Figure A.10 in the Supplementary Material). In Column 2, we introduce a linear control for each candidate’s party seat share to account for the influence of party size on mayoral selection. With this adjustment, the coefficient of interest falls by 75% and loses statistical significance.
In Column 3, we replace municipality-year fixed effects with party-year fixed effects. Thus, instead of comparing mayoral candidates from different parties on the same council, we compare mayoral candidates from the same party across different councils. Here, we again observe a substantial and significant negative effect, suggesting that councils select candidates with fewer criminal records to serve as mayor. When we add a control for seat share in Column 4, the absolute value of $ \widehat{\tau} $
increases, although statistical precision falls.
$ \widehat{\tau} $
increases, although statistical precision falls.
Finally, we introduce municipality-party fixed effects ( $ {\theta}_{mp[i]} $
), meaning that we compare first-ranked candidates running for the same local party across different years. The point estimates in Columns 5 and 6 again indicate that mayors are less likely to have a criminal record than other mayoral candidates, though this difference is not statistically significant at conventional levels.
$ {\theta}_{mp[i]} $
), meaning that we compare first-ranked candidates running for the same local party across different years. The point estimates in Columns 5 and 6 again indicate that mayors are less likely to have a criminal record than other mayoral candidates, though this difference is not statistically significant at conventional levels.
While all the fixed effects regressions suggest that councils vet mayors, the specifications that control for party size indicate that this effect is partly or entirely driven by larger parties securing the mayoral positions. The largest party groups rarely secure a majority of council seats but can often claim the mayoralty due to their better negotiating position and/or informal norms within the council. The overlap of confidence intervals with zero precludes any firm conclusions.
CONCLUSION
The belief that democratic processes are sufficient to prevent unfit individuals from attaining public office has deep historical roots. For example, in defense of the electoral college, Alexander Hamilton, the likely author of the 68th essay of The Federalist Papers, argues that “the process of election affords a moral certainty, that the office of President will never fall to the lot of any man who is not in an eminent degree endowed with the requisite qualifications” and that “there will be a constant probability of seeing the station filled by characters pre-eminent for ability and virtue.”Footnote 39 This article demonstrates that electoral processes can indeed effectively screen out individuals with criminal backgrounds from elected bodies, thereby making stringent legal disqualification rules less necessary.
Using population-wide administrative data from Norway, we find that average criminal involvement declines across stages of the political hierarchy: nominees have lower rates than the general population, elected officials lower than unelected nominees, and mayors the lowest of all. This pattern shows that democratic filtering is possible without legal bans, but it operates mainly through party organizations rather than voters, with established parties providing more effective filtering.
These results should be understood in context; the electoral institutions are embedded in an environment characterized by high transparency, including openness in decision-making processes and active media scrutiny (Andersen and Sørensen Reference Andersen and Sørensen2022; Bruns and Himmler Reference Bruns and Himmler2011). Criminal backgrounds are more likely to be exposed when candidates are elected to office and elected representatives are not immune to criminal prosecution. This setting facilitates political processes that deter individuals with criminal backgrounds from seeking office, incentivize political parties to exclude such candidates, and ultimately sustain the integrity of democracy (see, e.g., Folke, Persson, and Rickne Reference Folke, Persson and Rickne2017; Svaleryd and Vlachos Reference Svaleryd and Vlachos2009). Clearly, the effectiveness of such party vetting is likely to vary across institutional and political environments, and our findings should be interpreted with this scope in mind.
Several important issues remain for future research. The finding that anti-establishment parties are less effective at filtering out criminal politicians raises significant questions about the trade-offs between political integrity and representativeness, particularly when candidates with criminal records symbolize anti-establishment sentiment or advocate for radical change. Further research is needed to understand how parties balance voter expectations with democratic ideals.
Moreover, this article underscores the crucial role of established party organizations in vetting candidates, suggesting that candidate-centered electoral systems—which rely more heavily on voters’ capacity to remove unsuitable candidates—may be especially susceptible to criminals entering political office. Future studies should focus on developing rigorous research designs to empirically test this proposition and clarify the vulnerabilities inherent in different electoral systems.
SUPPLEMENTARY MATERIAL
To view supplementary material for this article, please visit https://doi.org/10.1017/S0003055426101634.
DATA AVAILABILITY STATEMENT
The analyses rely on Norwegian administrative register data provided by Statistics Norway under a restricted-use agreement. These data cannot be publicly shared for legal reasons, but qualified researchers may apply for access through Statistics Norway (https://www.ssb.no/en/data-til-forskning/utlan-av-data-til-forskere/soknad-offentlig-myndighet). Research documentation and replication code that support the findings of this study are openly available at the American Political Science Review Dataverse: https://doi.org/10.7910/DVN/PE5NTH.
ACKNOWLEDGEMENTS
We are grateful to Editor Monika Nalepa and the referees for their thoughtful comments, which greatly improved the manuscript. We also thank Alexandra Cirone, Benny Geys, Tom O’Grady, Max-Emil King, Henrik Sigstad, Daniel M. Smith, Janne Tukiainen, Andreas Økland, and numerous seminar participants for valuable feedback.
FUNDING STATEMENT
This research was funded by the Research Council of Norway (Grant No. 314079).
CONFLICT OF INTEREST
The authors declare no ethical issues or conflicts of interest in this research.
ETHICAL STANDARDS
The authors affirm this research did not directly involve human participants.


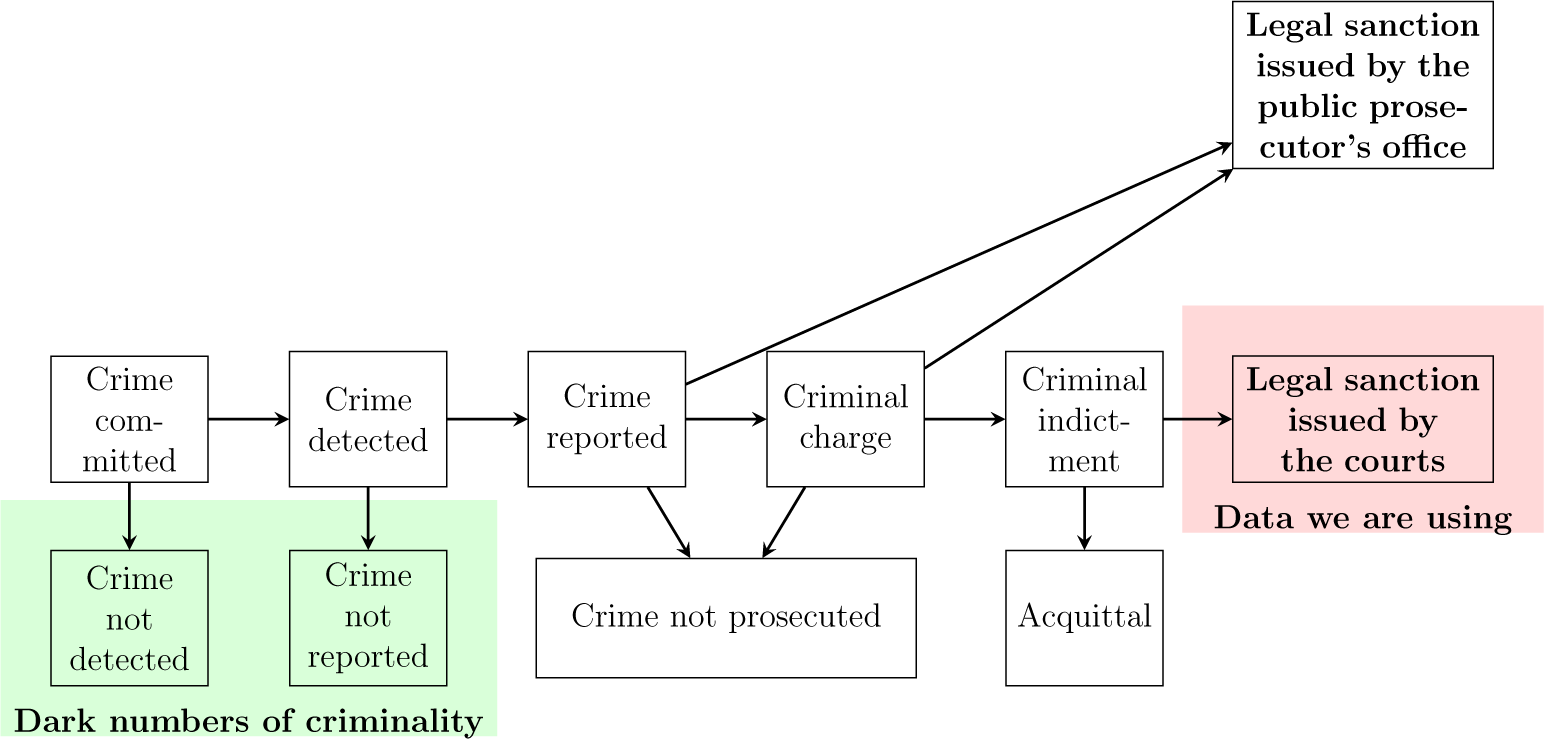
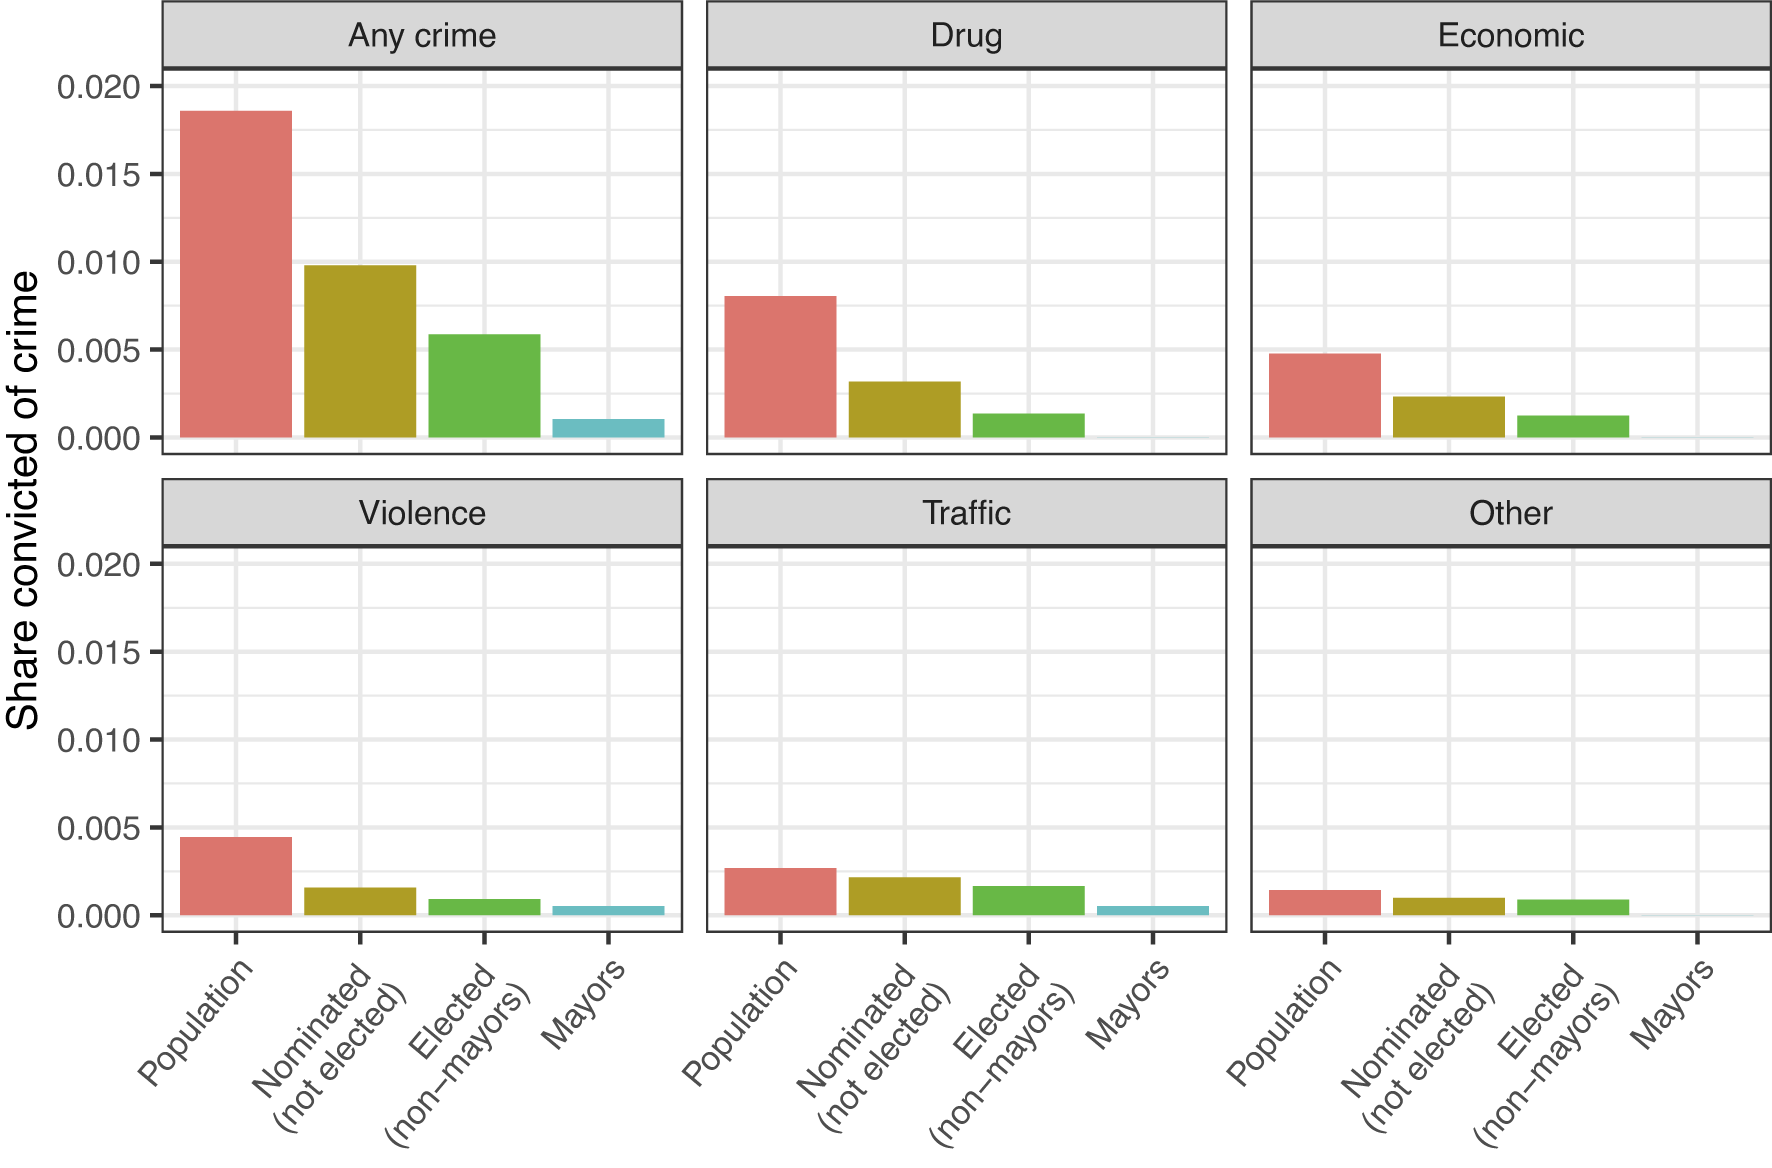


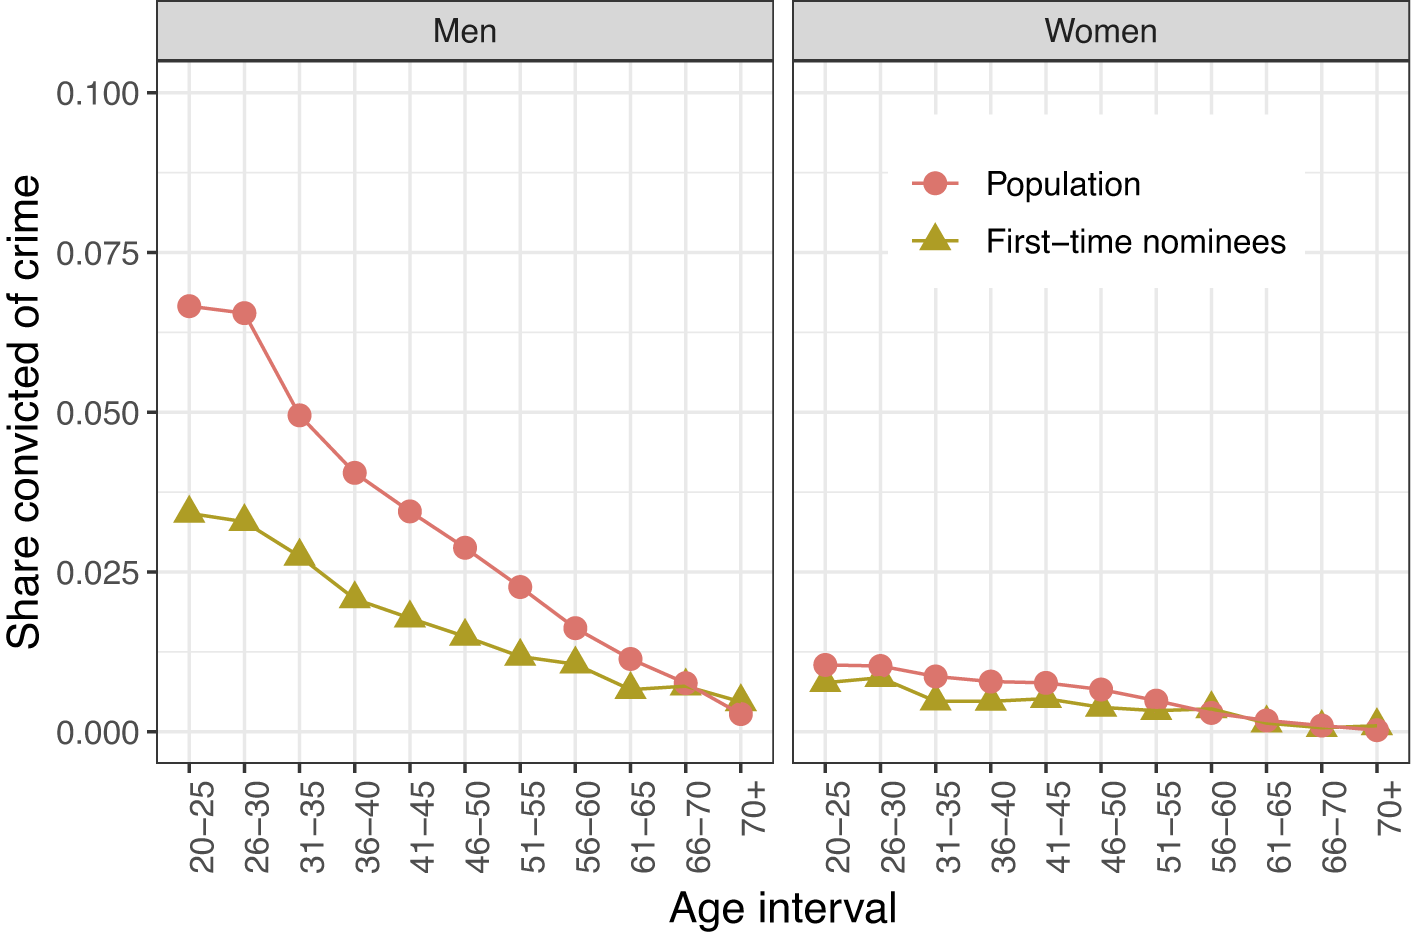


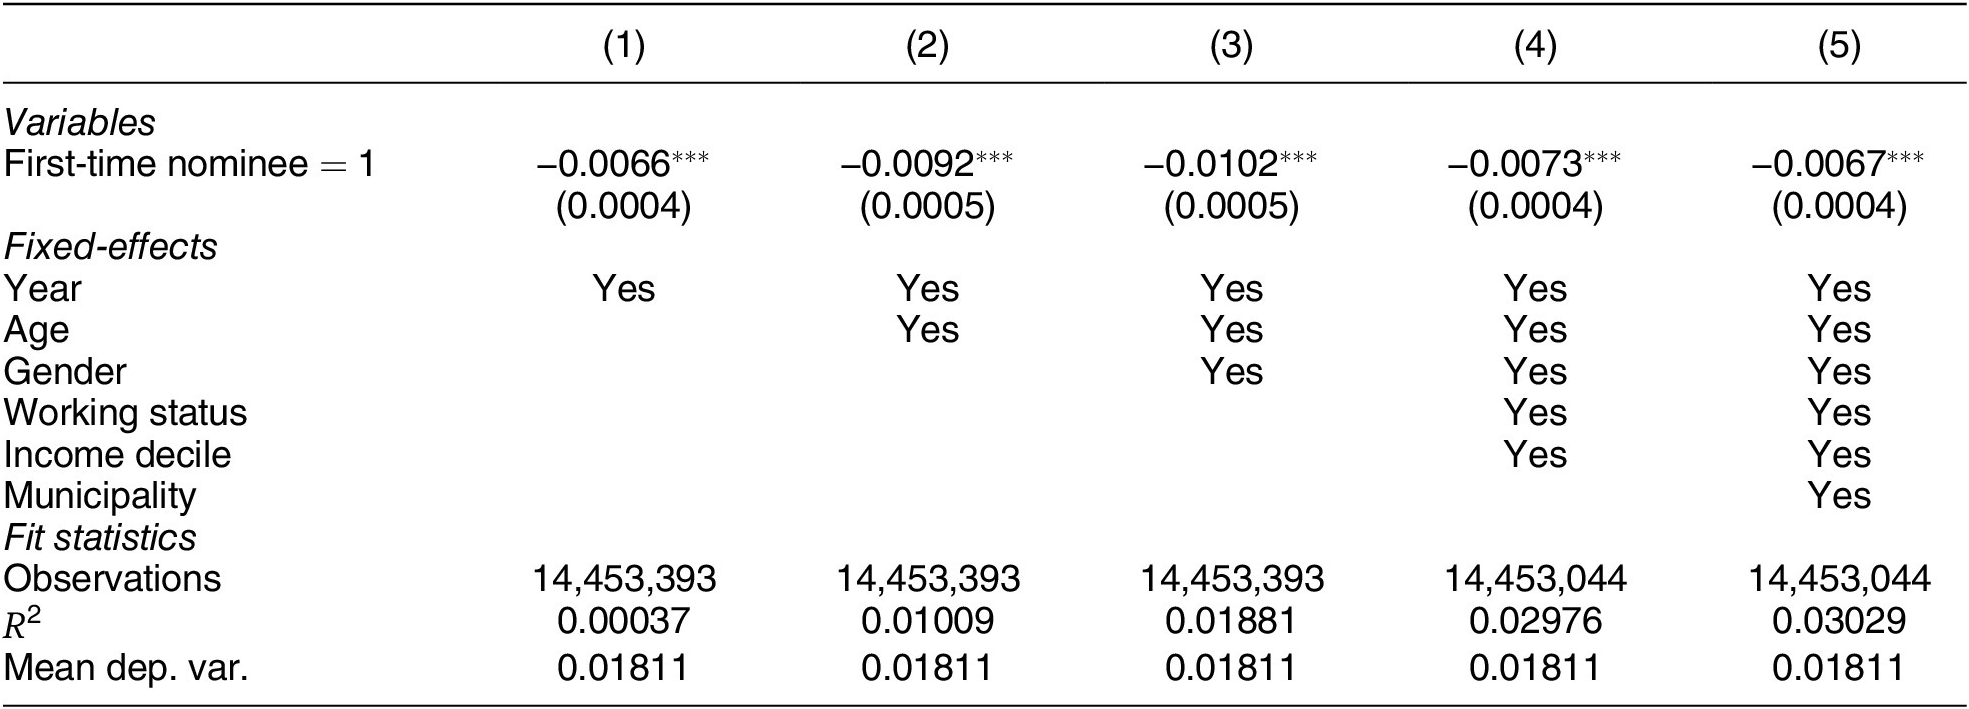
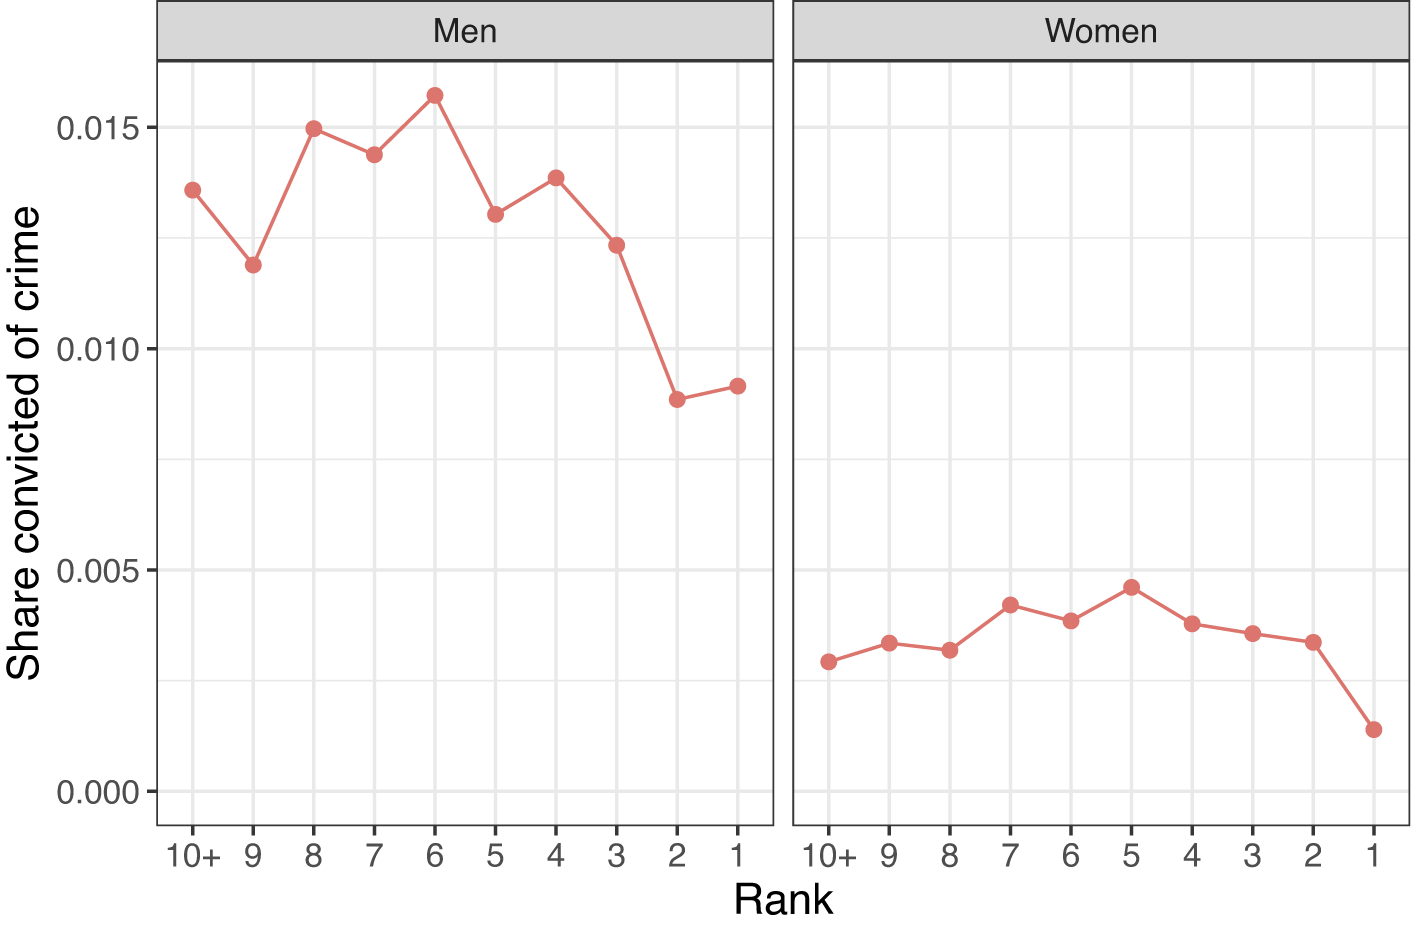


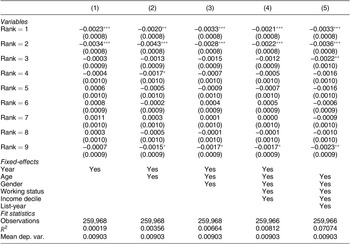
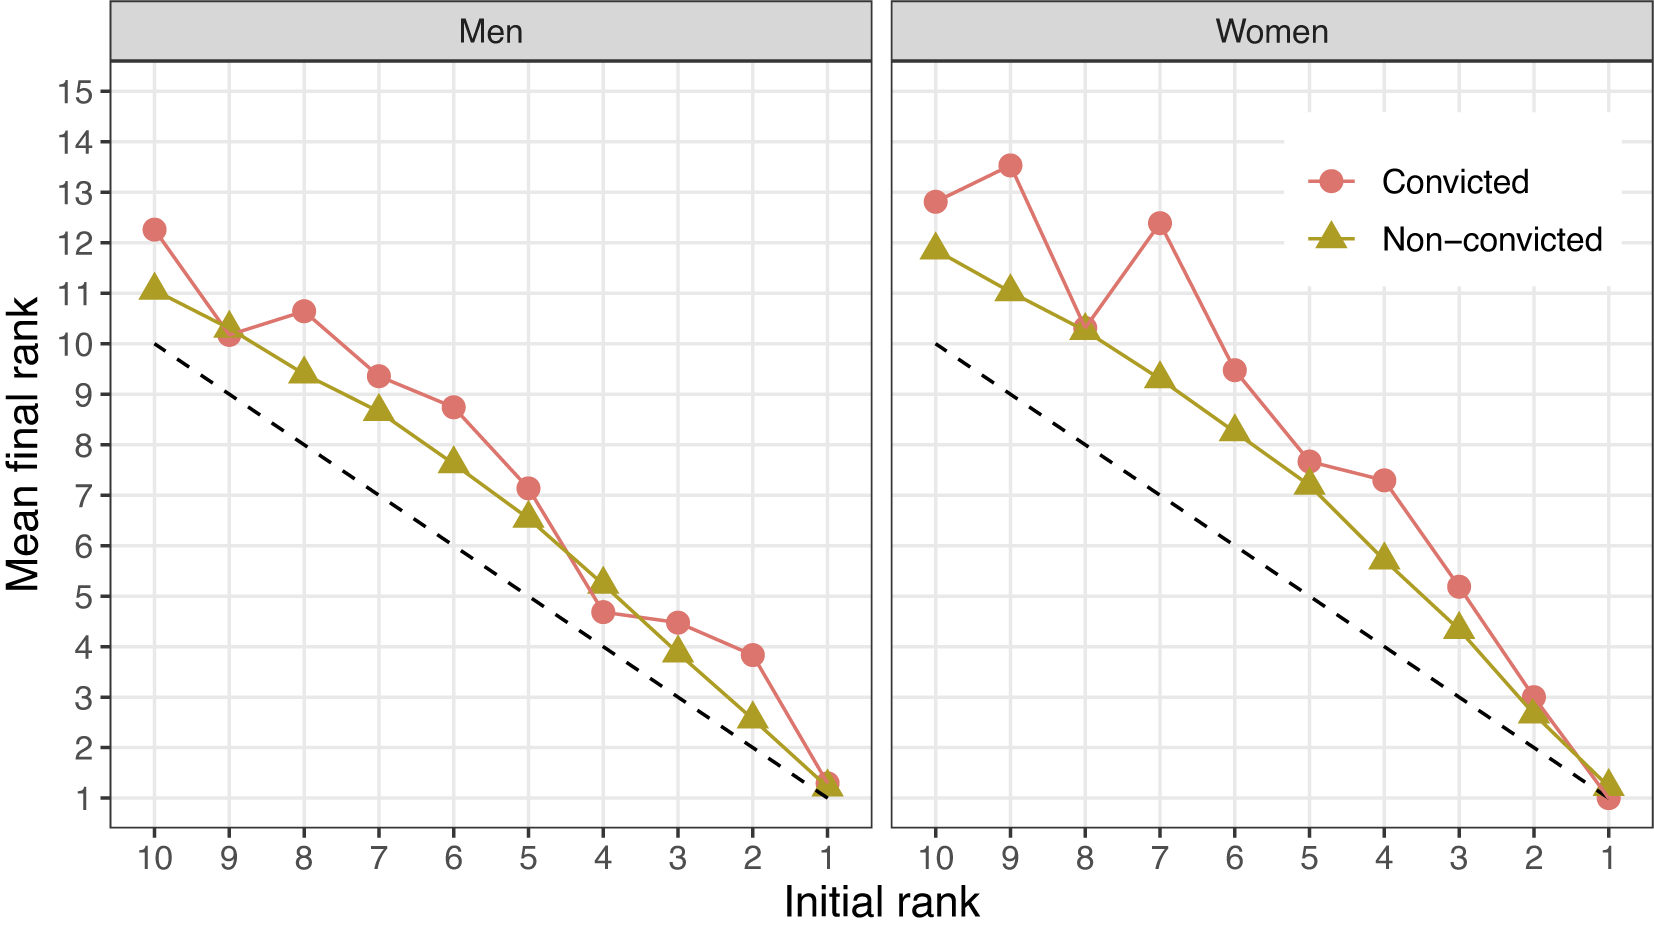


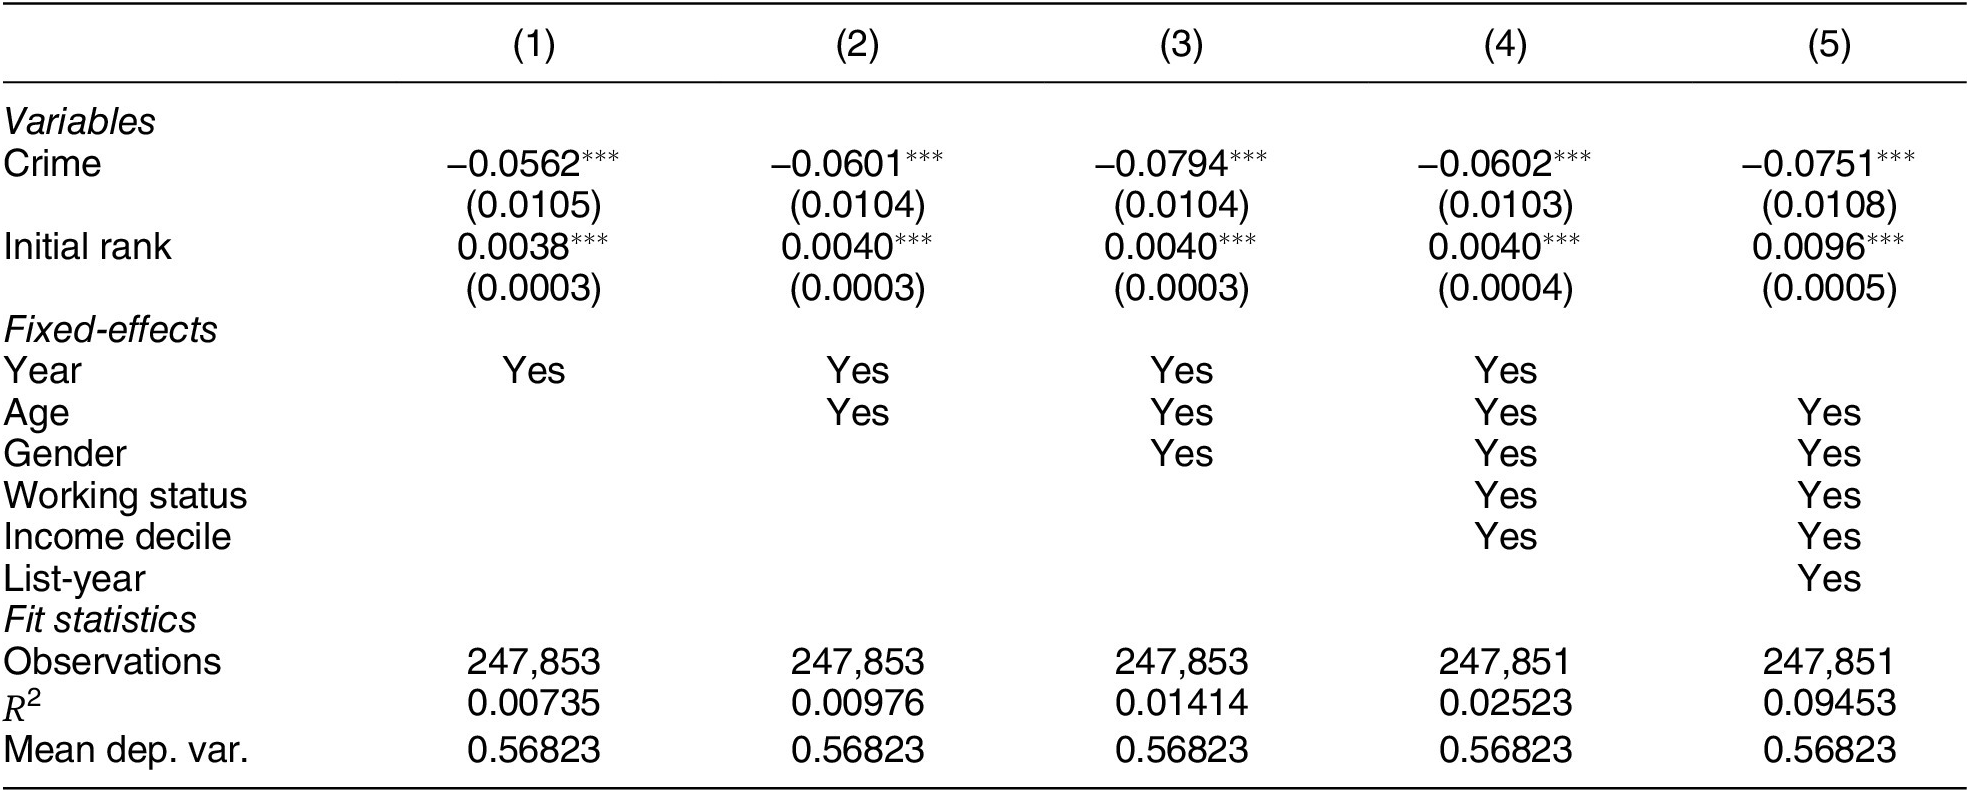
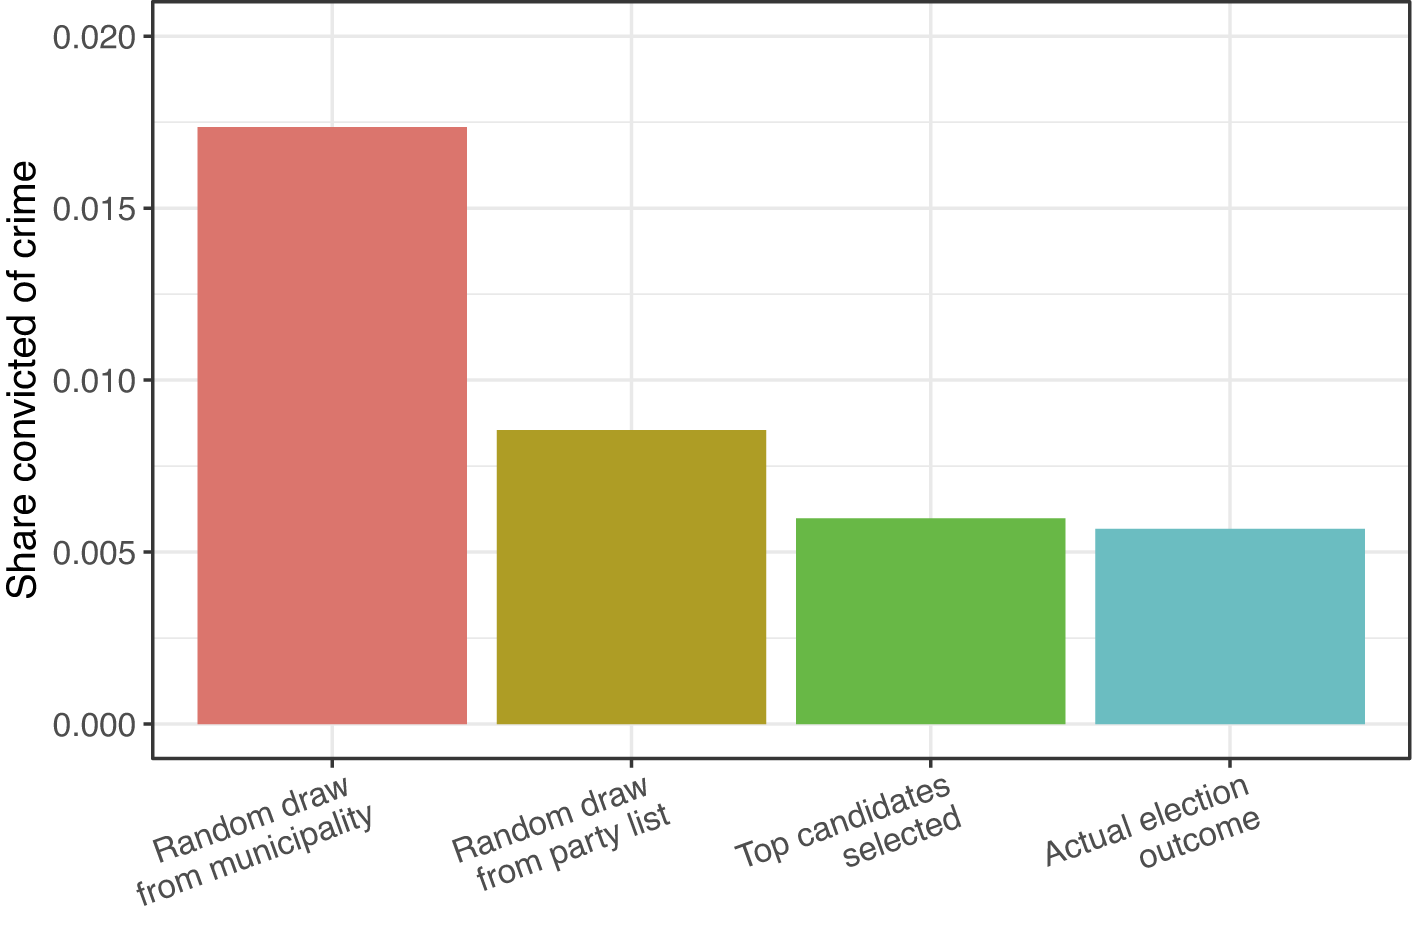


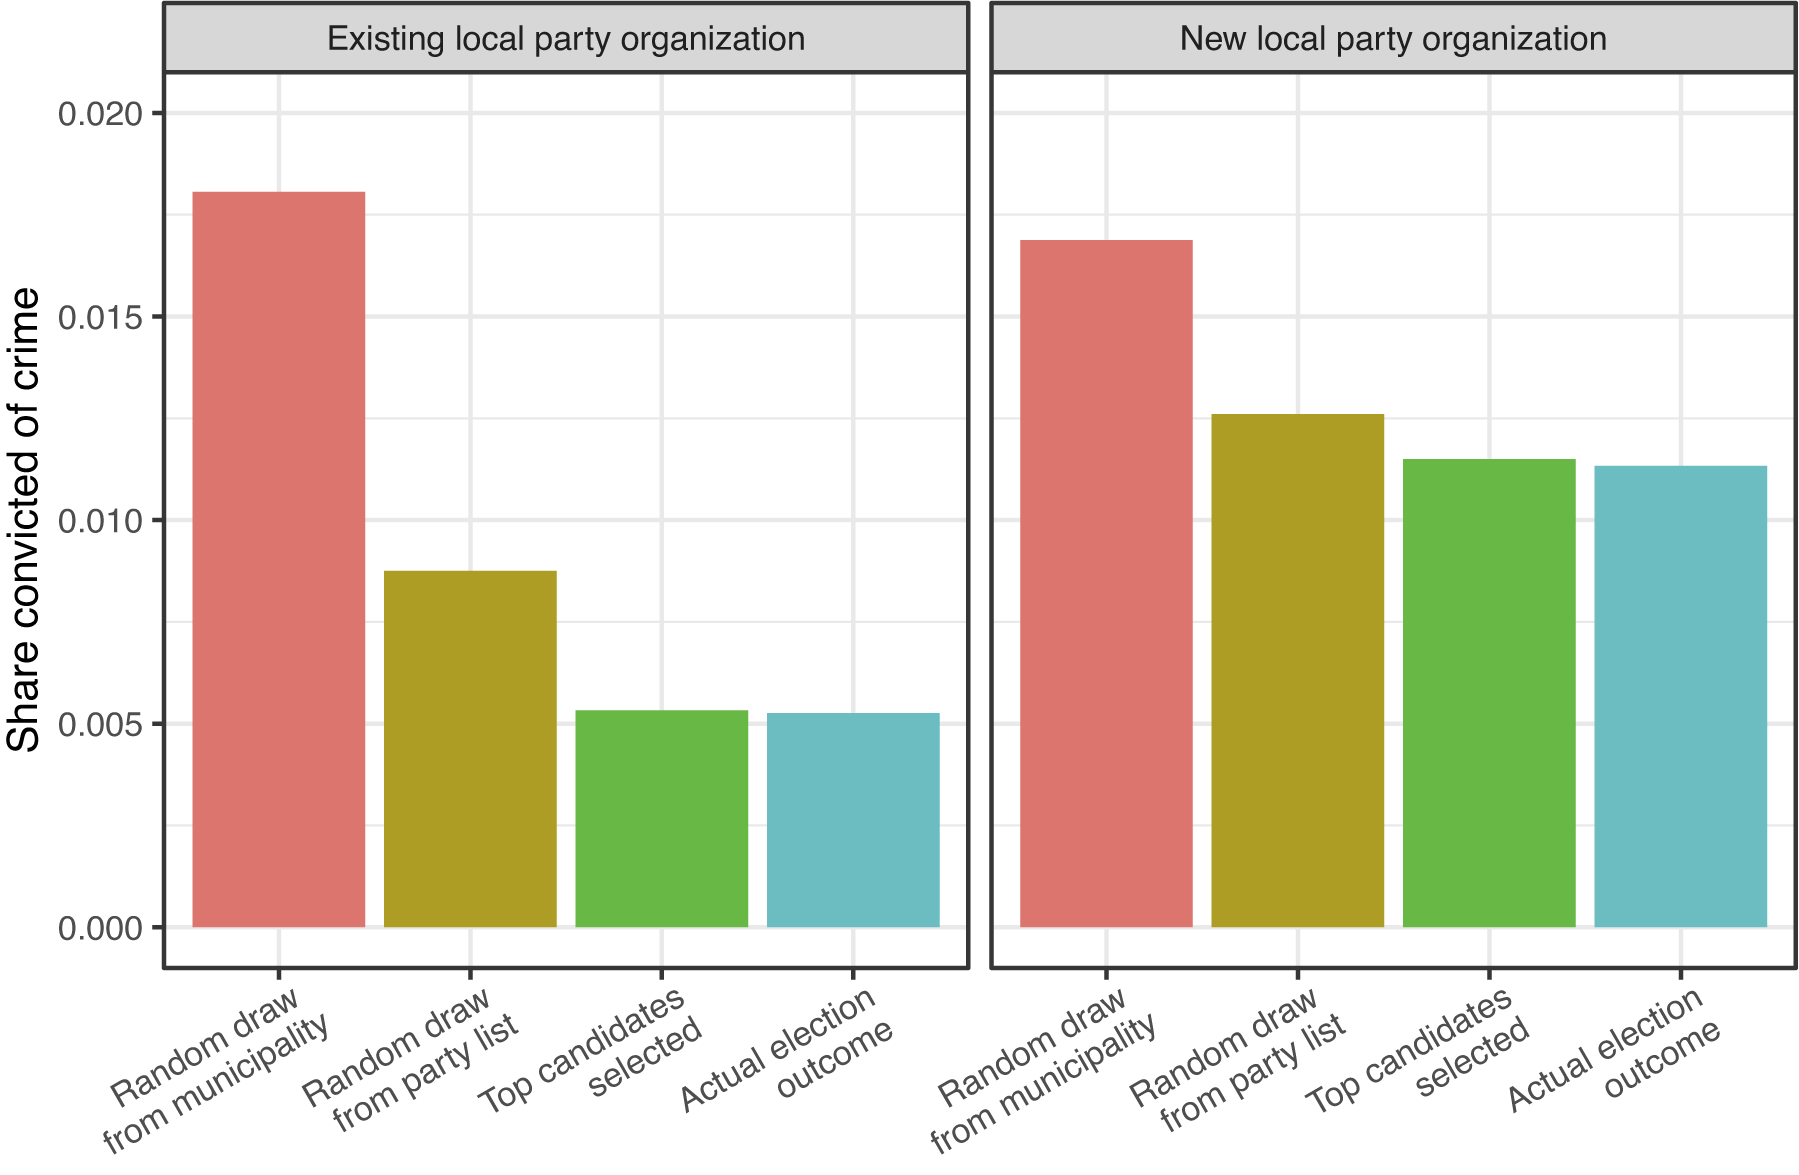


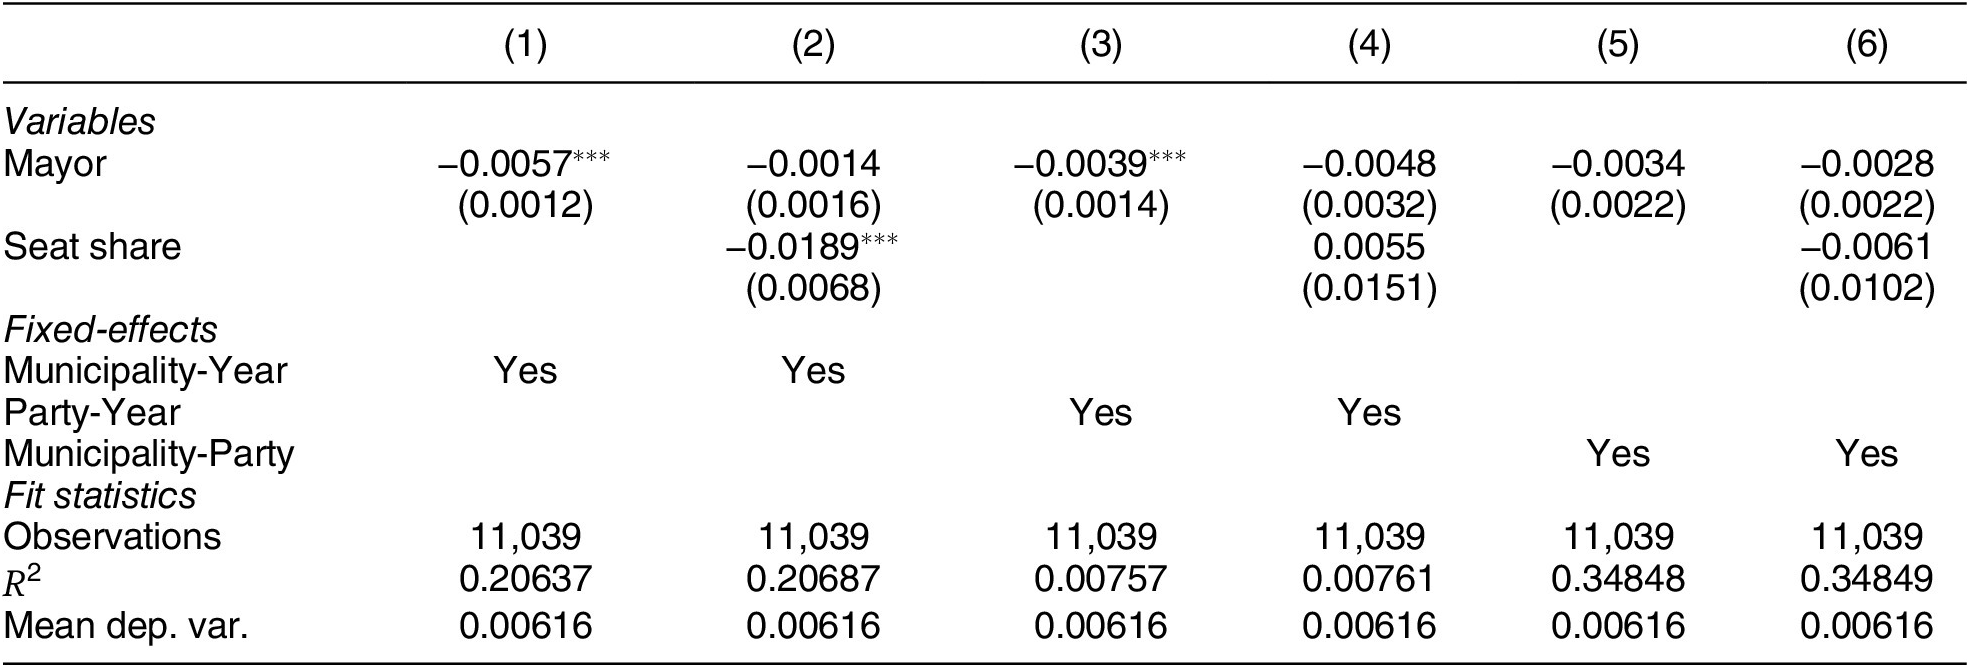


 Open access


Comments
No Comments have been published for this article.