


1 Introduction
Crowdfunding platforms have become widely popular in the past few years (Massolution 2015). Despite the broad focus of the existing platforms, which host projects on themes including everything from technology to the arts, technology- and design-oriented hardware products are among the main drivers on these crowdfunding platforms. Take for instance Kickstarter.com, which is self-reported as the world’s largest crowdfunding platform. Since its launch in 2009, more than 10,000 hardware projects have been successfully crowdfunded, and campaign backers have in all together pledged more than $3 billion (Kickstarter.com 2016).
According to design and technology curators at Kickstarter, a number of campaigns and related products, would never have been funded by managers and investors in the established industry (Yulman et al. Reference Yulman, Terra, Dunham and Gallagher2017). In this sense, crowdfunding is ‘changing what gets made and who has the opportunity to make it’ (Yulman et al. Reference Yulman, Terra, Dunham and Gallagher2017). This change is facilitated by the platform dynamics, where campaign initiators are connected with the community of backers. This community represents both a demand for new tech products and an interest in ‘behind the scenes’ insights into the product development journey, from concepts and early prototypes to real products (Belleflamme, Lambert & Schwienbacher Reference Belleflamme, Lambert and Schwienbacher2014).
Crowdfunding enables entrepreneurs to verify their ideas and to raise capital to develop new and innovative products, but the dynamics of crowdfunding, combined with the often limited experience and resources of the development teams, can bring new challenges to the design of crowdfunded products. Campaigns might get delayed or canceled; promised features may be withdrawn or the quality of the products expected by the backers might not be met. Crowdfunding is still a relatively new phenomenon in design research. This study sets out to investigate the phenomenon ‘crowdfunded product development’, which we define as the product development project taking place in the context of a crowdfunding campaign. Through an analysis of funded campaigns, we explore and identify the challenges that are associated with reward-based crowdfunding at Kickstarter.com. Here, we respectively identify and quantify both: (i) issues that occur during the product development process and (ii) issues regarding the delivered products reported by the backers.
1.1 Research focus
Crowdfunding attracts the general public to support the design and development of new and innovative products. The approach provides a venue for entrepreneurs to validate their ideas and to raise capital to cover costs associated with the development, manufacturing and fulfilment of their products. However, the dynamics of crowdfunding, combined with the often limited experiences and resources of the development teams, brings new challenges.
Crowdfunding is still a relatively new phenomenon in design research and this study sets out to investigate ‘crowdfunded product development’. Through an analysis of funded campaigns, the goal of this paper is to explore and identify the challenges that are associated with ‘crowdfunded product development’ and identify what challenges may lead entrepreneurs to fail to deliver the promises announced during campaigns.
The main focus of this paper is on the design, development and fulfilment phases after a crowdfunding campaign gets funded, with the aim of understanding:
(i) RQ1: What product development issues are reported by campaign initiators of successfully funded reward-based crowdfunding campaigns, as causes for failing to deliver on their promises?
(ii) RQ2: How do backers evaluate rewards from campaigns, that also developed and shipped their products, in terms of promised features and product quality?
(iii) RQ3: To what extend can particular product development implications or relations between RQ1 and RQ2 be identified as a cause for failure?
Our study is based on analysis of a data corpus of 144 successfully funded crowdfunded campaigns that aimed to develop consumer-oriented hardware products. All campaigns were based on a ‘reward-based’ ‘all or nothing’ principle and the products were hereby ‘preordered’ by the campaign backers. The data was collected from kickstarter.com and contains a wide range of variables such as total funding, campaign period, delivery timeline, campaign updates, and comments provided by the campaign initiators and backers. Of the 144 campaigns studied, 30 was analyzed in a pre-study focused at conceptualizing a failure mode model (FMM). The FMM was developed to assess campaigns from a longitudinal perspective, and we have systematically analyzed a further 114 campaigns, and identified the design-related issues that were faced during the product development process.
1.2 What is crowdfunding?
In broad terms, crowdfunding refers to collecting small amounts of capital from a ‘crowd’ or relatively large number of people, with the aim of funding entrepreneurial activities. While there are historical examples of crowdfunding, such as the partial construction of the Statue of Liberty (Harris Reference Harris1985), the modern concept of crowdfunding is rather new and is tightly coupled with the emergence of the Internet, digital communication technologies and online social networks (Schwienbacher & Larralde Reference Schwienbacher and Larralde2010; Mollick & Kuppuswamy Reference Mollick and Kuppuswamy2014).
According to Haas et al. the value proposition of the moderating crowdfunding platform can widely differ (Haas, Blohm & Leimeister Reference Haas, Blohm and Leimeister2014). It can be based on hedonism, where backers pledge for new innovations in products or creative projects. Here backers receive a non-monetary return in form of preordered products or rewards. It can be also based on altruism, which primarily aim to support charitable projects. This type of crowdfunding is dominated by donations, and compensations do not exceed tokens of appreciation. Finally, the value proposition can be for profit, which until today have generally been focused on the funding of start-ups, where the backers are offered monetary returns on their venture capital investments.
Generally, crowdfunding involves three types of actors: (i) the project initiator(s) who propose the offering or campaign to be funded, (ii) individuals (backers) who support the idea of the offering and (iii) a moderating organization that provides a communication platform and binds the parties together (Ordanini et al. Reference Ordanini, Miceli, Pizzetti and Parasuraman2011). The initiators range from single individuals to big organizations, but small entrepreneurial teams are behind the majority of crowdfunding campaigns (Mollick & Kuppuswamy Reference Mollick and Kuppuswamy2014).
As noted, backers can be offered different types of value in return for their support. Massolution have proposed a classification that differentiates between four different types of crowdfunding, respectively (Massolution 2012):
(1) Reward-based crowdfunding; in which backers ‘primary objective for funding is to gain a non-financial reward, such as a token of appreciation or in the case of a manufactured product, a first edition release.
(2) Lending-based crowdfunding; in which backers receive fixed periodic income and expect repayment of the original principal investment.
(3) Donation-based crowdfunding; in which backers donate to causes they want to support, with no expected compensation.
(4) Equity-based crowdfunding; in which backers receive compensation in the form of equity-based revenue or profit share arrangements.
By 2015, it was estimated that the global crowdfunding market was $16.2 billion, of which $2.68 billion originated from reward-based crowdfunding (Statista 2018). The focus of this study is on reward-based crowdfunding and the actual preordered products that the campaigns offered to backers, which excludes the type of rewards known as ‘tokens of appreciation’ (Kuppuswamy & Bayus Reference Kuppuswamy and Bayus2015) such as ‘Thank You’ letters, postcards or t-shirts. In reward-based crowdfunding primarily two models are being practiced, ‘keep it all’ and ‘all or nothing’. ‘Keep it all’ involves the campaign initiators setting a fundraising goal and keeping the entire amount raised, regardless of whether or not they meet their goal. The ‘all or nothing’ model involves the campaign initiators setting a fundraising goal and keeping nothing unless the goal is achieved (Cumming, Leboeuf & Schwienbacher Reference Cumming, Leboeuf and Schwienbacher2015). This study is focused on the ‘all or nothing’ model which is e.g. practiced at Kickstarter.com. Figure 1 below presents a theme-based timeline of what the process of a crowdfunding campaign looks like for the ‘all or nothing’ principle.
Overview of nine main topics of a reward-based crowdfunding campaign timeline. The funding deadline of the campaign represents the ‘all or nothing deadline’. This is indicated by the transition to a dotted line as only successfully funded campaigns go through the remaining steps. The figure is based on observations by the authors.

Finally, reward-based crowdfunding is not to be confused with related and linked phenomena’s. Examples hereof are ‘crowdsourcing’ (Brabham Reference Brabham2008), where the creative solutions of a distributed network of individuals are harnessed through an open call for proposals. Likewise topics like ‘social product development’ (Forbes & Schaefer Reference Forbes and Schaefer2017) and ‘open innovation’ (Chesbrough Reference Chesbrough2003) has the potential to share respectively the ‘socially inclusive’ and the ‘open’ dimensions of product development, but should be considered as prerequisites.
1.3 Crowdfunding in research
The recent boom in activity on the crowdfunding platforms has made crowdfunding an emerging area of research. A number of studies has been conducted on the business, marketing and sociotechnical aspects of crowdfunding campaigns. Examples include prediction of funding success (Greenberg et al. Reference Greenberg, Pardo, Hariharan and Gerber2013; Koch & Siering Reference Koch and Siering2015; Zhou et al. Reference Zhou, Du, Zhang, Qiao, Wang and Fan2015), economics and regulatory aspects (Agrawal, Catalini & Goldfarb Reference Agrawal, Catalini and Goldfarb2013; Moritz & Block Reference Moritz and Block2016) and the culture of participation (Bannerman Reference Bannerman2013; Gerber & Hui Reference Gerber and Hui2013). Meeting the initial funding goals in crowdfunding has been of particular interest and several indicators that have an effect on campaign quality have been identified. These include effective narratives containing trustworthy claims and intrinsic reasoning (Herzenstein, Sonenshein & Dholakia Reference Herzenstein, Sonenshein and Dholakia2011), gender of the campaign initiators (Marom, Robb & Sade Reference Marom, Robb and Sade2016), internal social capital accumulated at the crowdfunding platform (Colombo, Franzoni & Rossi-Lamastra Reference Colombo, Franzoni and Rossi-Lamastra2015), continuous and effective communication through campaign updates during the funding period (Xu et al. Reference Xu, Yang, Rao, Fu, Huang and Bailey2014) and the effective use of social media platforms for directed marketing (Gerber, Hui & Kuo Reference Gerber, Hui and Kuo2012; Etter, Grossglauser & Thiran Reference Etter, Grossglauser and Thiran2013; Zheng et al. Reference Zheng, Li, Wu and Xu2014).
What these examples have in common is the focus on, or approach to, crowdfunding as a study of the campaign initiators’ ability to successfully achieve campaign funding goals. This is also well-founded as the success rates for the campaigns are rather low (20% in the technology category at Kickstarter.com) and crowdfunding projects generally either succeed by narrow margins or else significantly fall behind their funding targets (Kickstarter.com 2016). Consequently, most of the active research on crowdfunding deals with understanding, defining and predicting characteristics that are associated with obtaining successful campaign funding. This basis does, however, also introduce the question of what success actually is and how it has been defined in existing crowdfunding research. Mollick reports that 59% of the campaign initiators on Kickstarter would like to establish a lasting venture through their campaigns (Mollick & Kuppuswamy Reference Mollick and Kuppuswamy2014). The milestone to successfully fund the campaign is obviously important in this process. However, the ability to attract funding only reflects in very general terms a perspective on the prospects of continued success after the campaign. Continuing success relies on the initiators’ ability to deliver products in a timely manner to backers, that represent the features and quality that were announced during the campaign. This ability is closely coupled with product development activities following the funding phase.
1.4 Motivation for this research
While the above-mentioned studies contribute to the understanding of different aspects of the crowdfunding paradigm, only a little is known about the performance of the campaigns in terms of their product development process and long term ability to succeed. Among different focuses that could be applied to study success, the aim of this study is to explore and investigate engineering design and product development challenges and issues that can hinder the long term success of reward-based crowdfunding campaigns. Accurate reporting’s of such challenges and issues can help researchers and practitioners to better understand reward-based crowdfunding and particular characteristics that distinguishes the paradigm from other development approaches. Also, they can serve as probes for further research aiming to further investigate the topic.
The crowdfunding campaign ‘Miito’ is a recent case that illustrates some of the potential challenges associated with crowdfunded product development (Figure 2). Miito is a ‘sustainable’ alternative to the electric kettle, designed to heat water directly in a vessel using inductive heating, while trying to minimize excess water and energy usage. It was designed by a team of formally educated engineers and designers, and the team had shown working prototypes that were described in detail in the campaign material. Significantly exceeding the initial campaign funding goal, Miito received a lot of public and media attention and the project team collected €818,098 from 6052 backers. After several delays (the first shipments of the product were promised for April 2016), in March 2017 the campaign team announced the halt of the project due to loss of manufacturing partner, issues with certification and increased timeline and costs.
Miito is a ‘sustainable’ alternative to the electric kettle. It was designed by a team of engineers and designers; the team demonstrated working prototypes in their campaign material, and presented a detailed plan for development and manufacturing. In March 2017, the campaign team announced the halt of the project due to product development challenges (Picture from campaign at Kickstarter.com).

The case of Miito is not a unique example. As crowdfunding attracts the interest of the general public, challenges in crowdfunded product development have been covered by the media, and the main reasons for delays are listed as startling success (complexities of scale), manufacturing problems, the complexity of shipping and fulfilment, changes in project scope and unanticipated legal and regulatory (certification) issues (Pepitone Reference Pepitone2012). Correspondingly, Mollick reports that over 75% of campaigns on Kickstarter could not deliver promised rewards to backers on time (Mollick Reference Mollick2014), and 9% of campaigns are canceled (Mollick Reference Mollick2015).
The work presented in this paper differs from the previous work presented above in three aspects. First, this study is focused on the product development process preceding the campaign funding period. Second, we quantitatively assess and report on the challenges that can be identified in the product development process for the studied campaigns. Third, we evaluate the campaign outcomes, in terms of products delivered to the campaign backers.
In this section we have introduced the current state of crowdfunding research. The rest of the paper is organized as follows. The next section describes our research methods and describes the development and use of the FMM. Next, we present our findings and discuss how delays are often related to the campaign initiators facing multifaceted challenges in the product development process. Finally, we conclude the paper with reflections on the results presented and their relation to design science. This includes perspectives on crowdfunding in relation to more conventional funding schemes and development activities.
2 Methods
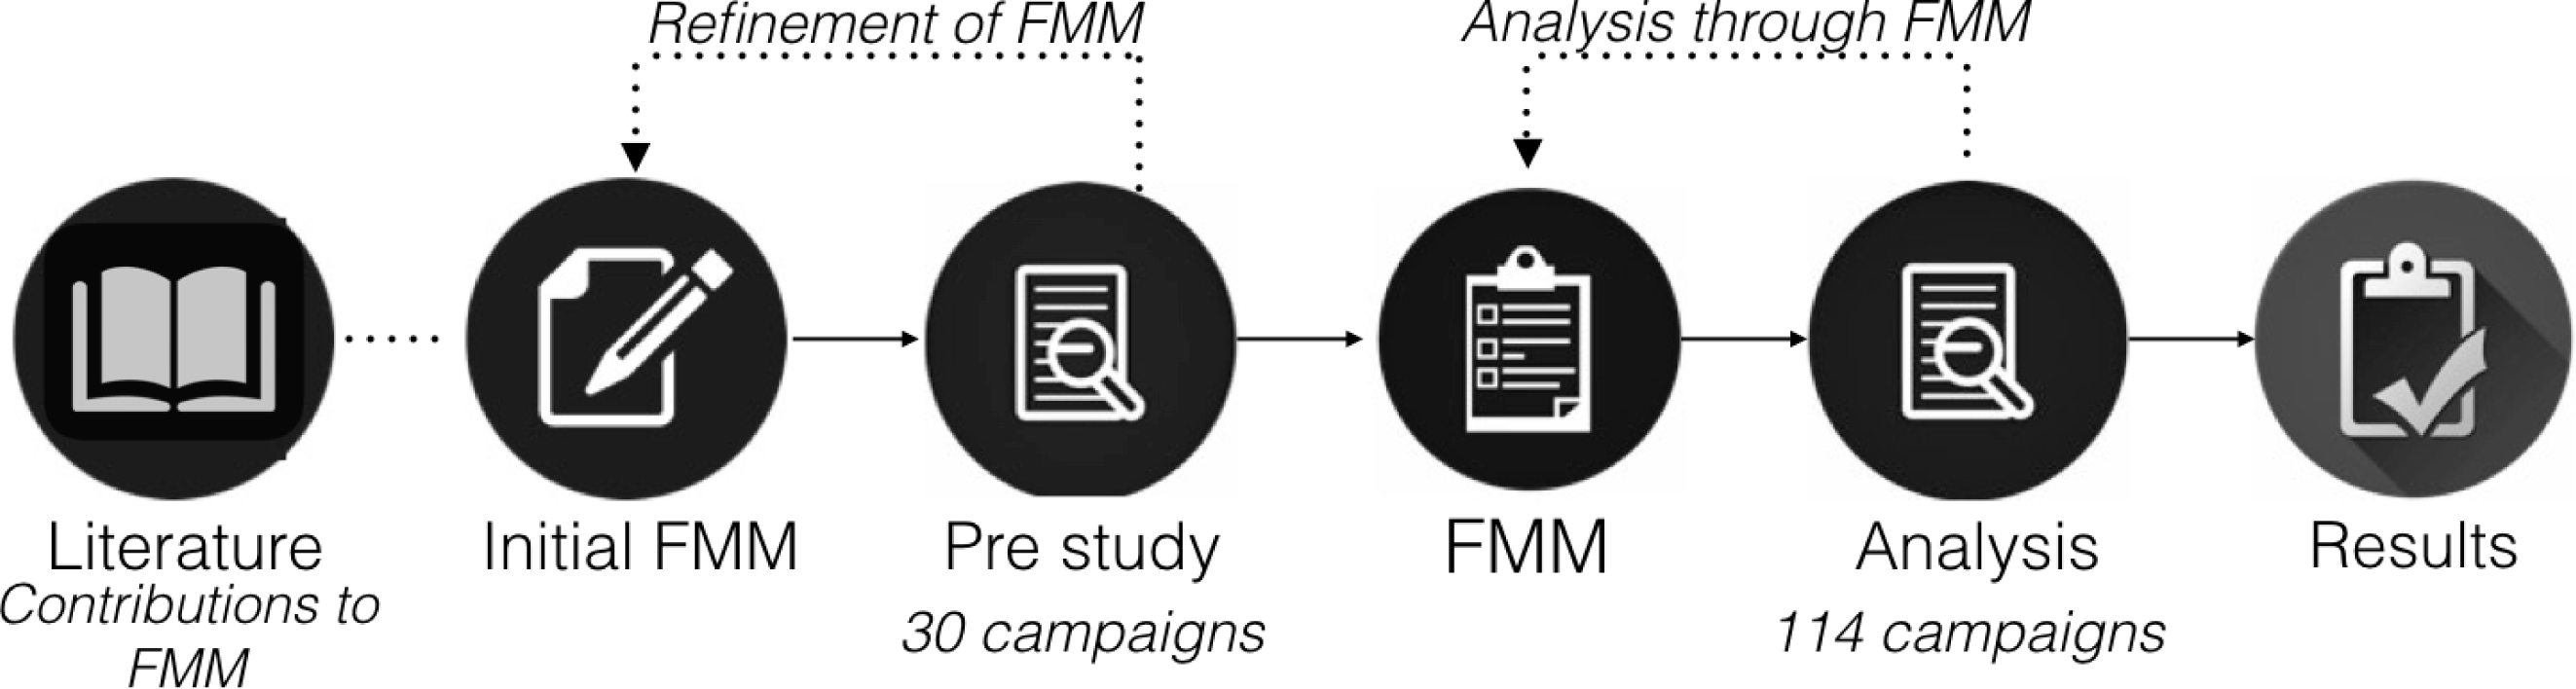
As noted, our study is based on data collected from 144 reward-based crowdfunded product development campaigns that ran on Kickstarter.com. To analyze outcomes of these campaigns in a systematic fashion, we first developed and fine-tuned a failure mode model (FMM) through analysis of 30 campaigns, and then used the model to benchmark 114 campaigns, as outlined in Figure 3. The following sections describe the data, the pre-study that led to the FMM and the analysis of the dataset.
The workflow of the study. The process started with the initial failure mode model (FMM), which was compiled from the literature and refined through the pre-study. The final FMM was used as an assessment tool throughout the analysis, which included individual assessment of the original campaign material, campaign updates after funding and comments of the backers.
2.1 Crowdfunding on Kickstarter
Kickstarter was chosen for this study as it has been characterized as the largest and most dominant crowdfunding platform (Mollick Reference Mollick2014). To study one platform is an obvious limitation for generalizability regarding crowdfunding as a paradigm. It has, however, been argued that Kickstarter can ‘serve as a broadly useful model for examining crowdfunding efforts’ (Mollick Reference Mollick2014). At Kickstarter, the first milestone of a campaign is to reach a funding threshold by offering rewards to backers. Campaigns get funded and the backers are charged for their pledges only if the campaign reaches or exceeds the funding threshold. After payment processing fees and Kickstarter’s mediation fee, 90–92% of the funds become available to the campaign initiators, who have the obligation to finalize development, manufacture the products and deliver them as rewards to campaign backers.
2.1.1 Inclusion criteria of the study
Among various types of products, services and creative arts projects that seek funding on Kickstarter, our study only focused on crowdfunded product development campaigns that were successfully funded, and aimed to reward their backers with physical consumer technology products. Furthermore, we limit our dataset based on the following considerations:
(1) The campaign should fulfil the definition of reward-based crowdfunding (Massolution 2012) and offer preorders of a product.
(2) Campaigns should be listed in the Technology category (‘Technology’ and its subcategories: gadgets, sound and wearables).
(3) Campaigns must have had a funding goal above $5000 to substantiate some level of design complexity for the campaign initiators.
(4) Campaigns should aim to develop consumer products, therefore do-it-yourself (DIY) focused projects. such as printed circuit boards, fabrication tools and sub-assemblies were excluded from the study.
(5) Campaigns must have ended before August 1, 2015, to ensure enough lead time (2 years) for project creators to have shipped products to their backers by the time the study was conducted.
(6) We study the campaign initiators’ ability to deliver the products that the campaign concerns, excluding the ‘token of appreciation’ type rewards such as thank you cards or promotional t-shirts.
The initial dataset was extracted from the Kickstarter site, using a Python based web crawler. The data analysis was conducted by evaluating both the extracted data and through analysis directly on the Kickstarter site. The extracted data allowed for a comparative overview of descriptive campaign data, whereas the online analysis ensured media richness in terms of e.g. pictures not collected by the web crawler.
There were 325 campaigns, meeting the criteria above, launched over a two-year period (2013–2015). From this pool, 30 campaigns were selected for the pre-study of the failure modes and 114 additional campaigns were randomly selected for the main analysis. The 30 campaigns from the pre-study are not included in the analysis presented throughout the paper. The authors stopped the main analysis at 114 campaigns as they meet saturation in comprehending the patterns of the campaigns. Saturation in data analysis occurs once there is no additional emerging observation from the concurrent data analysis. It was further evaluated that the collected dataset was sufficient to perform overall statistical analysis.
2.2 Failure mode model
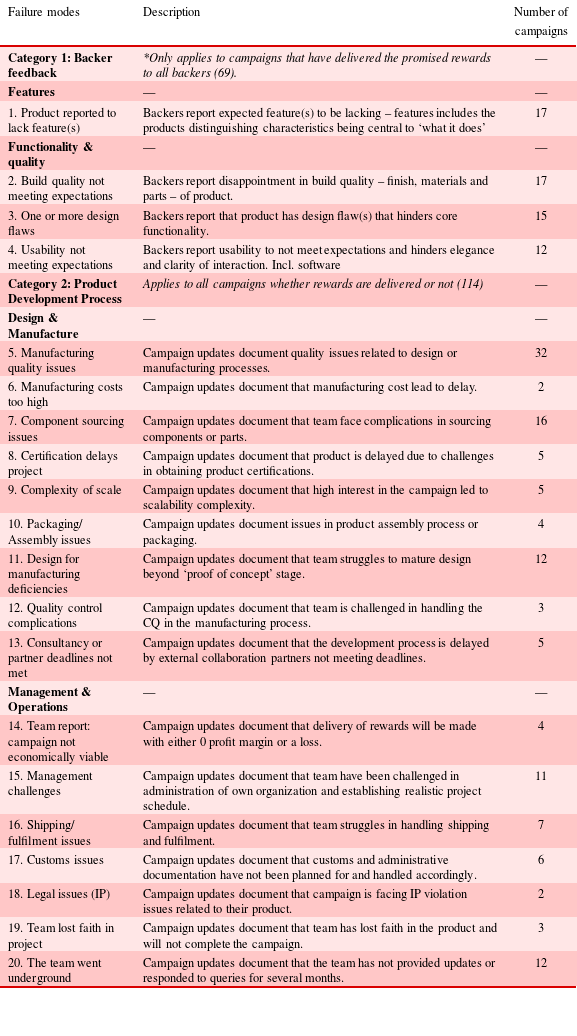
One of the main objectives of our study is to explore and understand the product development challenges in crowdfunding. Part of this process includes to establish an overview of what can go wrong after a crowdfunding campaign is successfully funded, and why campaigns might fail to deliver on promises. As the amount of data to be analyzed is substantial, we adopted failure mode analysis as a tool to systematize the process and developed a FMM, which can be seen in Table 2.
When assessing the FMM, note that incidents in Category 1 build primarily on feedback by backers. Incidents registered in Category 2 relate primarily to updates by the campaign initiators. A description of all failure modes is found in the middle column, and the number of campaigns to which each mode applies is given in the third column.
Failure mode analysis is widely used and practiced in engineering design and product development disciplines (Shimizu, Imagawa & Noguchi Reference Shimizu, Imagawa and Noguchi2003; Stamatis Reference Stamatis2003; Walsh, Dong & Tumer Reference Walsh, Dong and Tumer2018), and a number of failure mode analysis frameworks exists. The thematic variation in the Kickstarter campaigns, and the characteristic documentation of crowdfunding campaigns, demand a less exhaustive and more broadly applicable tool. In this regard, the initial FMM borrows elements from tools, benchmarks and frameworks that address both generic product development issues and issues that are specific to crowdfunding.
The ‘real-win-worth’ RWW framework has been previously used to develop crowdfunding design guidelines by (Song et al. Reference Song, Luo, Hoelttae-Otto, Seering and Otto2015a ) and to evaluate risks in crowdfunding campaigns by (Song et al. Reference Song, Luo, Hölttä-Otto, Otto and Seering2015b ), and it contributes to the product review aspects of FMM. Similarly, FMM borrows from principles on design for manufacturing (Kuo, Huang & Zhang Reference Kuo, Huang and Zhang2001) to identify manufacturability issues of crowdfunded products. Economics and project management related aspects of product development are borrowed from Ulrich (Reference Ulrich2007) and guidelines published by two technical consultancy companies specialized in hardware entrepreneurship helped identity failure modes related to component sourcing and product certifications. (Einstein Reference Einstein2015a ,Reference Einstein b ; Dragon Innovation 2016).
Based on these benchmarks, guidelines and models, an initial list of 53 metrics and failure modes were compiled. During the pre-study, a subset of crowdfunding campaigns from Kickstarter was analyzed in depth, with the aim of mapping the identified issues to the initial list and reducing its dimensionality through empirical analysis. In total, 20 failure modes were identified to be relevant from the initial list for the initial 30 projects studied. The process of reducing the dimensionality of the FMM took place as a collaborative process between the authors and the majority of the initial metrics were incorporated. This was made possible by identifying and scoping the appropriate taxon’s. The failure mode ‘certification issues’ were e.g. derived through the merger of more specific initial metrics ‘FCC certification issues’ and ‘CE certification issues’.
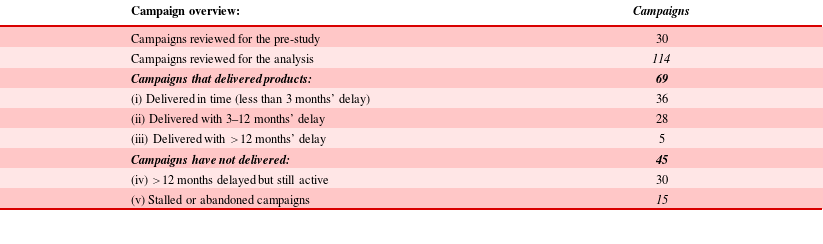
FMM distinguishes the types of issues based on the source of the data. The first category is primarily based on the backers’ feedback and it reveals whether the delivered products lack any features or live up to the expectations of the backers. The second category is primarily based on the campaign descriptions and updates provided by the campaign initiators, and shows issues related to design, manufacturing, project management and operations. In many cases it was also possible to triangulate the source data as presented in Section 2.4. It should be noted that product related issues such as features, functionality and quality can only be analyzed for the campaigns that have delivered products but process related issues were collected from all campaigns, including those that are yet to ship after more than 12 months of delays. Table 1 presents an overview of the whole data corpus. Of the 114 campaigns that were studied, 69 delivered products to their backers. Out of the 45 campaigns that had delivered by August 1st 2017, 30 were still active. 15 campaigns were stalled being either officially left behind or lacking response from creators.
Overview of the data corpus. 30 campaigns were included in the pre-study and 114 in the analysis presented. Of these, 69 has delivered products to their backers. Out of the 45 campaigns that has not yet delivered, 30 are still active. 15 campaigns are stalled being either officially left behind or lacking response from creators
2.3 Promises and failure
In reward-based crowdfunding, the campaign initiators primarily make two types of promises to their backers. These concern (i) a date of delivery and (ii) a set of specific features, functionality and quality attributes of the product that are presented during the campaign. Consequently, our analysis concerns with two types of failures – failure to deliver a product that has the features, functionality or quality that has been promised during the campaign and failure to deliver in a reasonable time.
Delays for launching new products are not unique to crowdfunded products and a 3-month delay has been suggested as acceptable when defining ‘timeliness’ (Bayus, Jain & Rao Reference Bayus, Jain and Rao2001). This concretely means that our analysis regards products delivered within less than 3 months of the announced deadline as delivered on time.
2.4 Campaign review process
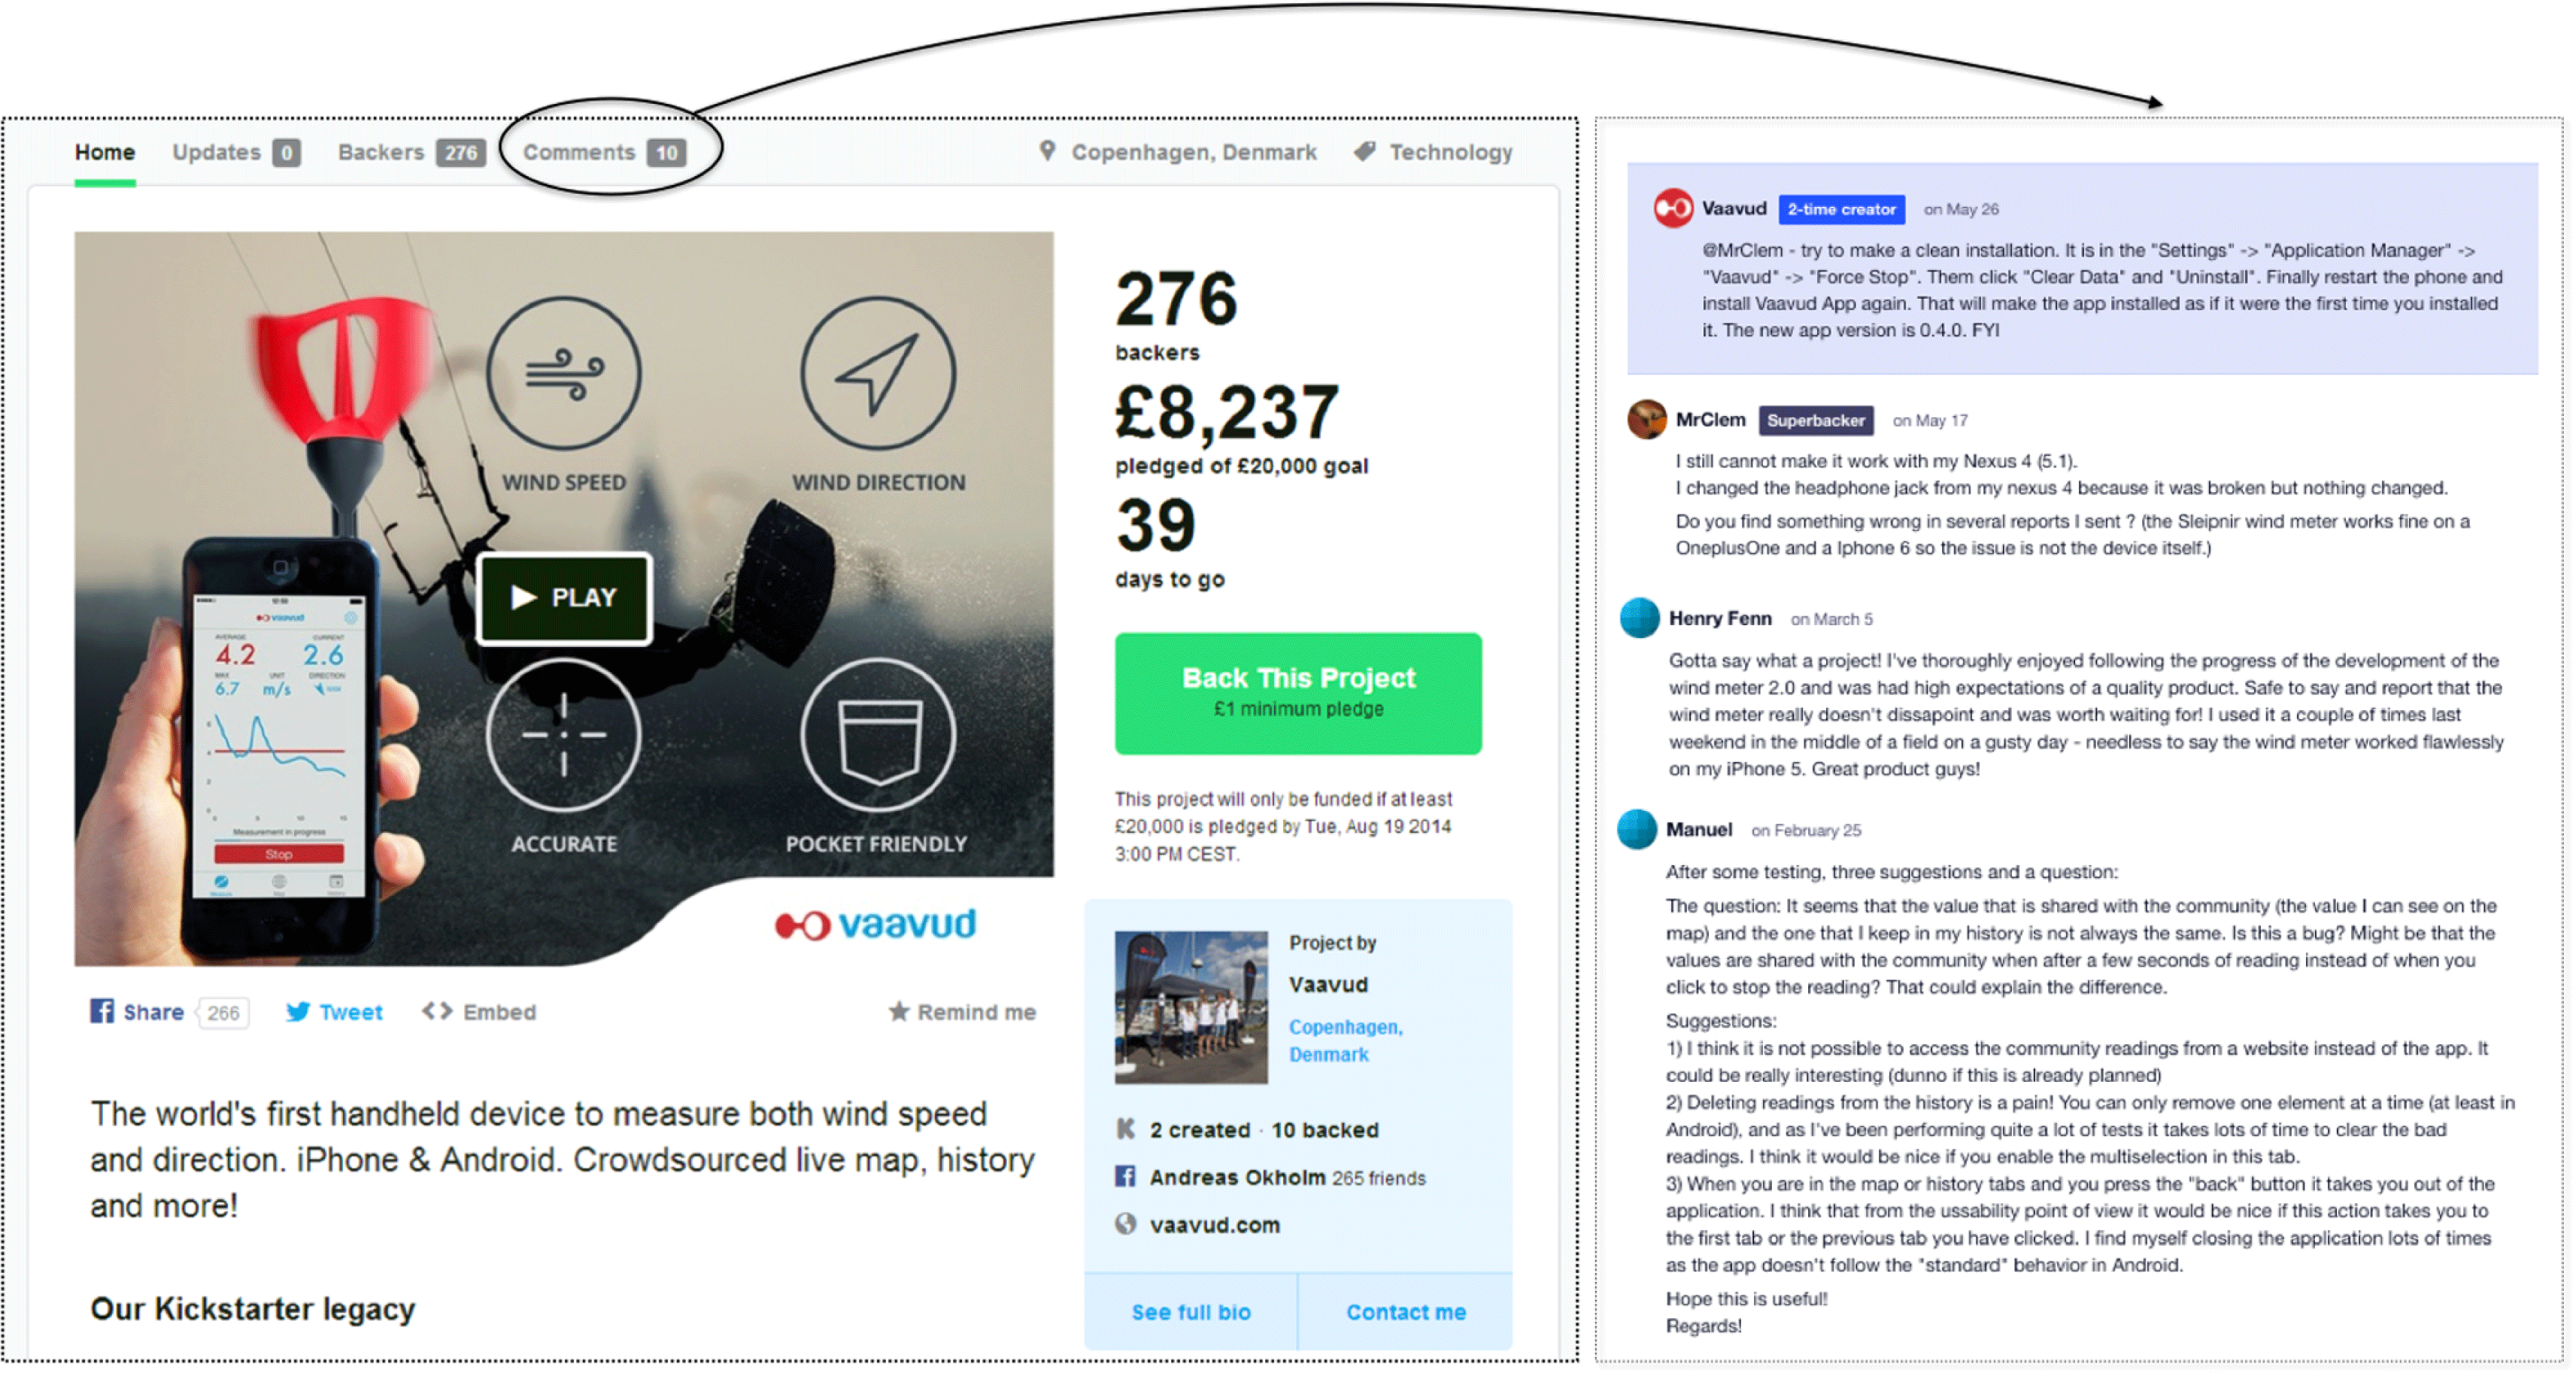
While using the FMM as an assessment scorecard, two coders were involved in the process of aggregating and analyzing data from the campaigns. An example of the campaign layout is presented in Figure 4. Note how, besides the campaign status in terms of funding, video and written background material, the presentation also features different tabs with updates from the campaign initiators and comments from backers. In the right part of the figure a sample of comments is shown. Where Figure 3 illustrates the workflow for the evaluation of campaign content for each project included in the study. The following parts of the campaign content were included in the analysis:
Example from the Vaavud Wind Meter campaign at Kickstarter.com. Note how the campaign besides the campaign status in terms of funding, campaign video and written background material also features different tabs with updates from the campaign initiators and comments from backers. In the right part of the figure a sample of comments are shown.
Campaign description page. Campaigns typically contain a short ‘marketing’ video, followed by an article that provides information on various aspects of the project. This includes an overall description of the product, delivery timeline, project plan, reflections about risk and challenges and, in some cases, a presentation of the project team. The campaign also introduces the different rewards offered to backers. This content was evaluated and descriptive campaign data was collected to establish foundational knowledge on every campaign prior to the analysis of potential failure modes. In addition, campaign dates, duration, funding obtained and the number of backers were recorded.
Comments. Backers can post comments during various stages of the campaign. This is considered to be one of the strong points of crowdfunded product development, as the backers can provide continuous feedback and constructive criticism during the development process of the projects (Anderson & Simester Reference Anderson and Simester2014). Campaign initiators can reply to the comments and eventually an active dialogue may take place. Whenever replies from campaign initiators were available they were included in the analysis, as part of the specific comment. To accommodate that single complains by backers are not necessarily representative, a specific topic needed to be addressed in ${\geqslant}2$
of the studied comments before it was registered in the FMM.
${\geqslant}2$
of the studied comments before it was registered in the FMM.
Our pre-study showed that the nature of the comments can be mapped to four phases of a typical campaign – (i) funding period, (ii) product development, (iii) shipping and backers first impressions and (iv) product reviews. Projects can gather thousands of comments of varying lengths. To make the analysis feasible, we have randomly chosen 40 comments – 10 comments that have at least 140 characters – from each of the 4 categories – for each campaign. Descriptive campaign characteristics (e.g. the end of the funding period) were used to identify the date for the specific phases introduced above and the web crawler carried out the random selection of comments. For significantly delayed campaigns, comments in the first two categories helped to clarify if the project was still active. For campaigns that have shipped rewards; the last two categories also provided insights for the FMM, in terms of assessing whether the product has lived up to the expectations of the backers.
Updates by project initiators. Campaign initiators can post updates on the progress of their campaigns to the campaign backers. Updates can vary from quick status updates to detailed statements on manufacturing challenges. Our analysis uses the updates to benchmark the projects against the FMM issues that are related to design, manufacturing, project management and operations.
Despite the variation in characteristics of these types of data, they allowed for triangulation during the analysis and coding process. This was possible as overlapping and mirrored content were often represented in e.g. both campaign updates and comments from the backers. Whenever possible, triangulation was conducted to increase the validity and robustness of the analysis (Voss, Tsikriktsis & Frohlich Reference Voss, Tsikriktsis and Frohlich2002). In this way, the different sources of data allowed for a chain of evidence to be established. By following the process presented by (Partington Reference Partington2000) incidents described directly in the data were coded into the categories of the FMM. From a comparison of each incident with previous incidents in the same metrics of the FMM, the authors developed theoretical properties of each failure mode and the dimensions of each these modes.
2.5 Limitations of research methods
The basis for this study is the data that is available on Kickstarter. The project updates and descriptions are self-reported by the campaign initiators and therefore carry subjective bias – e.g. attributing delays to factors beyond their control when this might not be the case. While the backers’ comments can counterbalance some of such issues, they can also introduce a cross-correlation bias – such as providing negative reviews for the quality of the product if it was delivered late. Finally, due to the qualitative nature of the updates and the comments in crowdfunding campaigns, there is the possibility of evaluator bias. Two independent coders with advanced degrees in engineering design analyzed the campaigns presented in the study. Owing to the substantial amount of data collected for the analysis, the coders worked collaboratively. During the process the coders compared and discussed their assessments and only a few discrepancies were encountered. In such cases, further dialogue on the interpretations of the data resulted in mutual compliance in all cases. The collaborative nature of the approach in which the coders compared and discussed their assessments did not make it possible to estimate a measure of inter-rater reliability.
The failure mode model. Incidents in Category 1 builds primarily on feedback by backers. Incidents registered in Category 2 relates primarily to updates by the campaign initiators. A description of all failure modes is found in the middle column
3 Results
In this section we present the result of our analysis. The motivation behind this study was exploratory, and our results identify and quantify issues that occur during the product development process, and also issues regarding the delivered products reported by the backers. The overall results of the analysis are presented in Table 2, which presents the final FMM and an overview of the results. This section provides further details in the light of the research questions presented in Section 1.
3.1 Do campaigns deliver on their promises?
Our analysis is based on the assessment of two basic promises of a typical crowdfunding campaign: delivering a functional product to all backers, with the features and quality that were advertised during the campaign period, and delivering it on time. These promises are not mutually exclusive; while some campaigns might deliver inferior products on time, others might be severely delayed but deliver a full set of promised features. In either case, failures in terms of product functionality and/or delays can be considered as the consequences of the underlying failure modes identified in the FFM. In the following section we outline the performance of the campaigns included in this study in terms of their timeliness.
3.1.1 Campaign delays
Figure 5 summarizes the campaign initiators’ ability to deliver products in time: 28 campaigns (32%) delivered rewards within the timeframe they had initially promised to their backers, 36 (25%) of the campaigns were delivered with 3–12 months’ delays whereas 50 (43%) of the campaigns exceeded one full year in delay. In this group, exceeding 12 months of delay, 30 (26%) of the campaigns had not yet delivered any products. 15 (13%) of the campaigns were stalled, being either officially left behind or lacking response from creators. Only 5 (4%) of the campaigns delivered products after a delay exceeding 12 months.
Overview of the campaigns ability to deliver products to campaigns backers. The legends to the left presents an overall categorization of campaigns in terms of product delivery. The legends to the right represents the three color codes in the stack-up of campaigns delayed by more than 12 months.
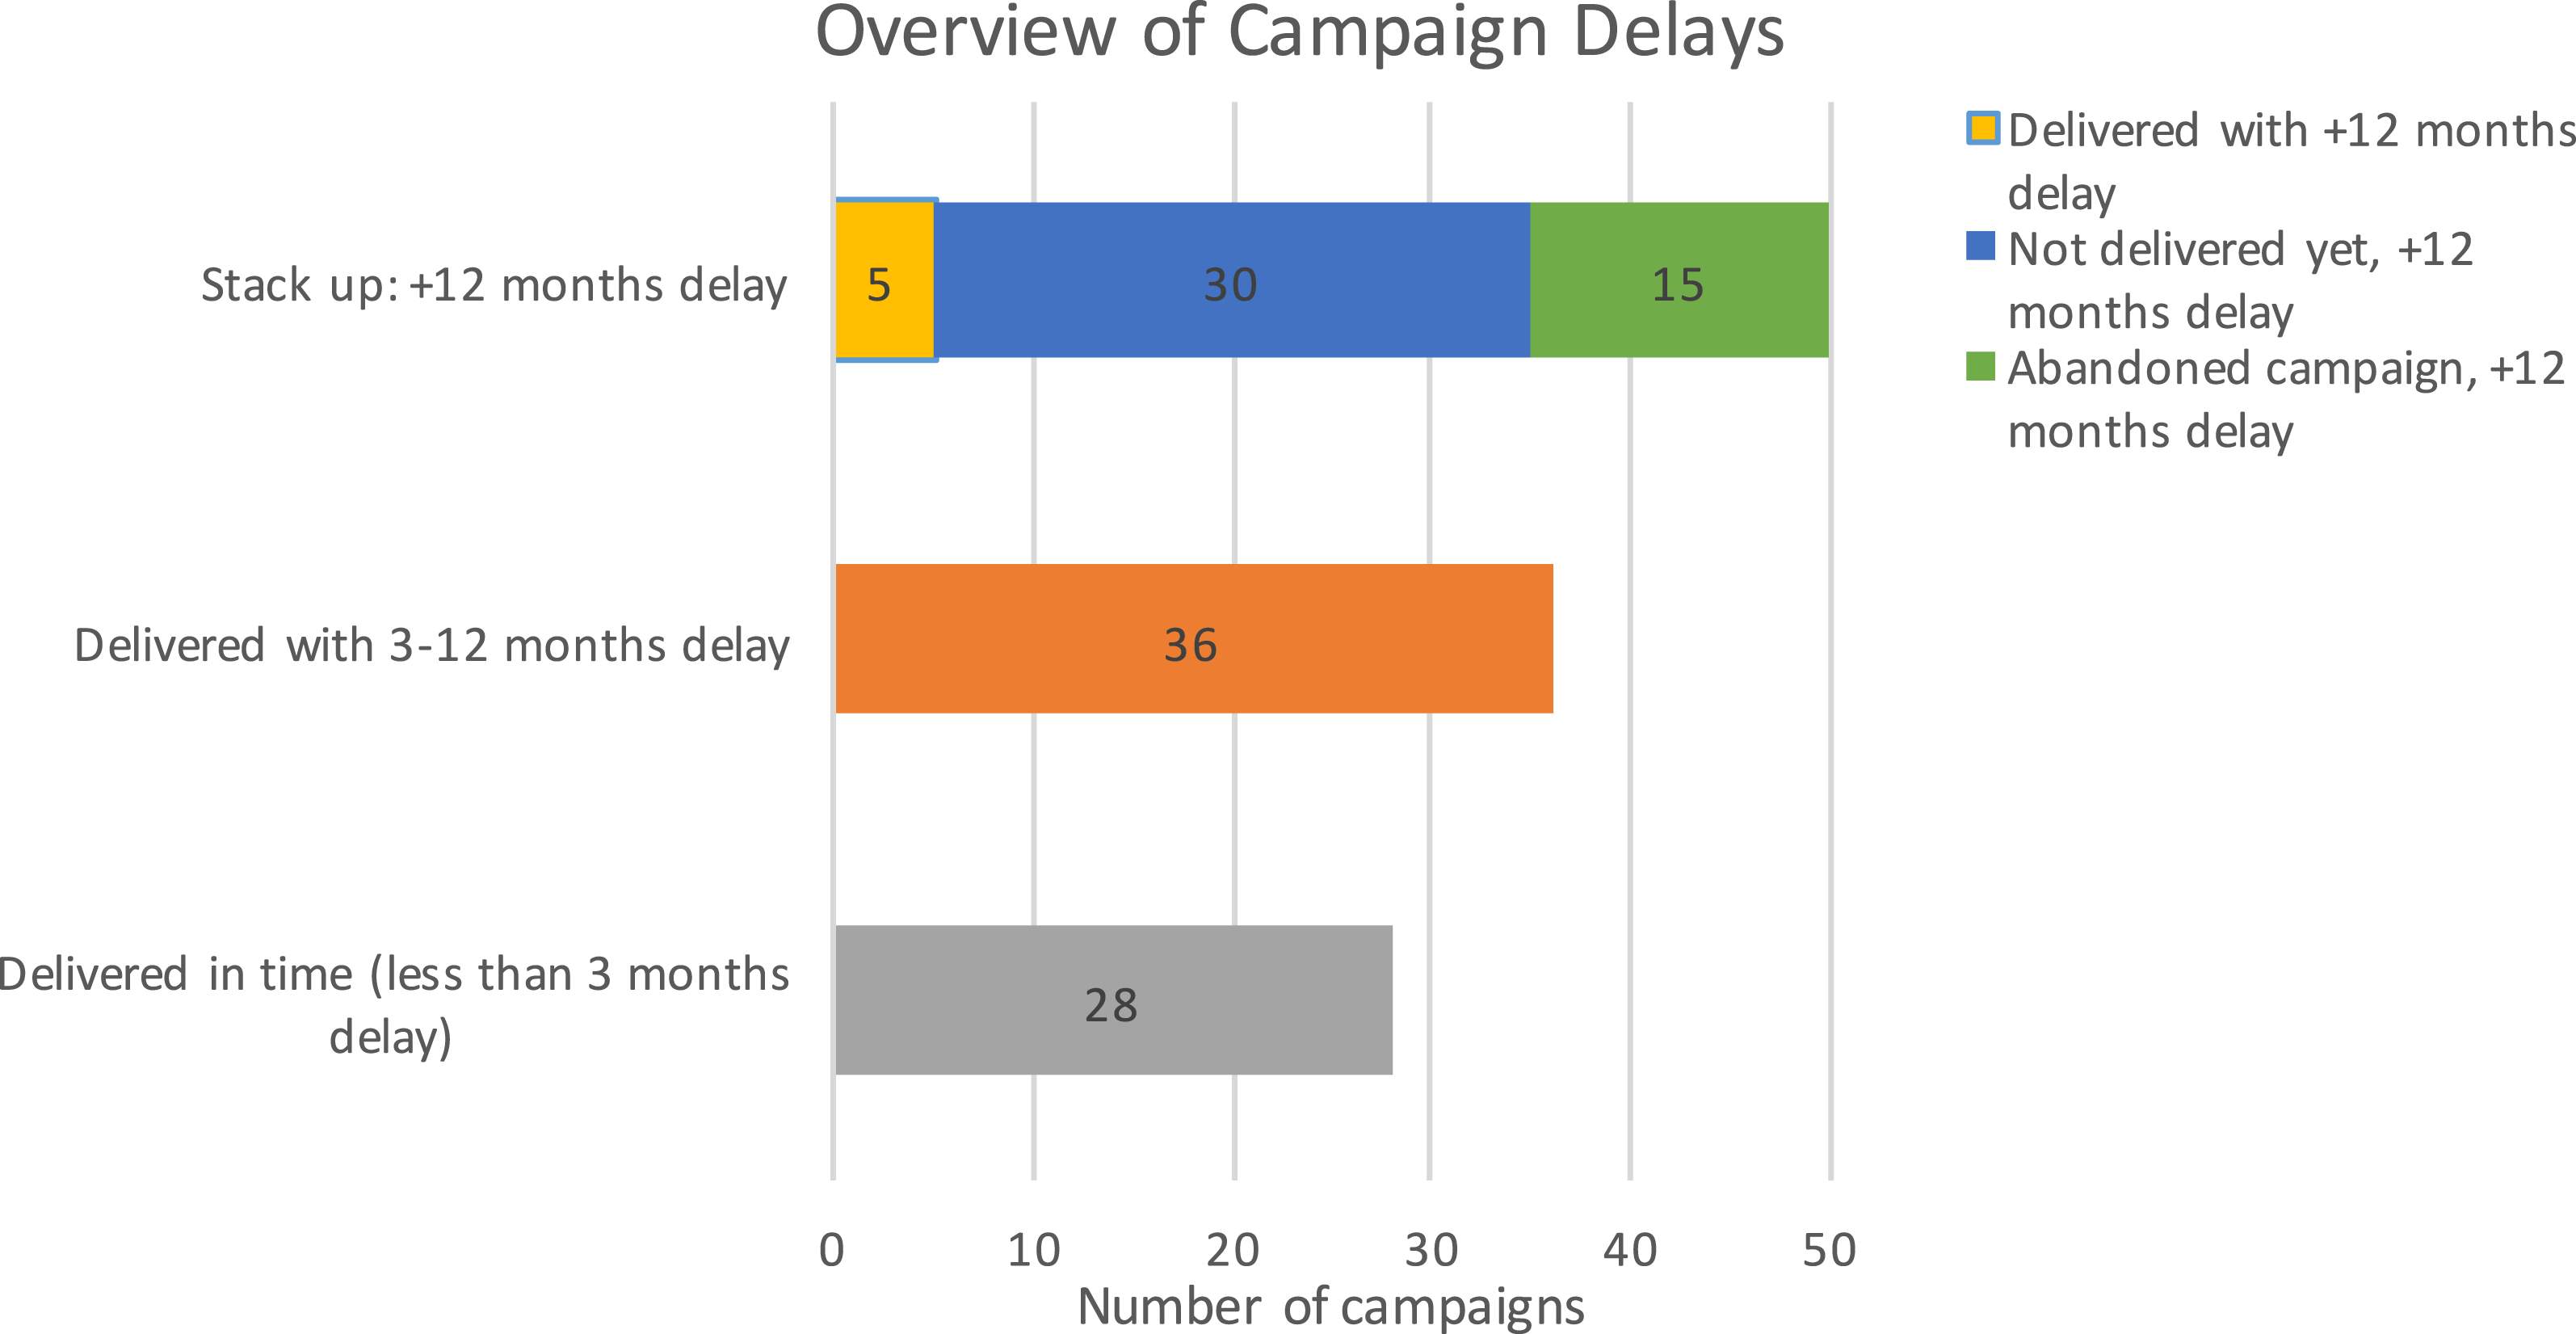
At the time of the analysis, 26% of the campaigns were still striving for delivering the products despite a $+$
12 months’ delay. Given the fact that only 4% of the campaigns in the study managed to deliver after
$+$
12 months’ delay. Given the fact that only 4% of the campaigns in the study managed to deliver after $+$
12 months’ delays, it is remains uncertain whether these campaigns will eventually deliver.
$+$
12 months’ delays, it is remains uncertain whether these campaigns will eventually deliver.
This general distribution tells us that delays are not uncommon for reward-based crowdfunding campaigns. More than half of the campaigns have nevertheless been able to deliver their products within a year after the initial deadline. In spite of significant delays, the majority of the campaigns which had not yet delivered their products (30 campaigns, 26%) were still actively engaged in the development of their products. There are, however, no guaranties that the campaign initiators will eventually be able to deliver despite their continued efforts.
In a study by Mollick it was found that 75,1% of crowdfunding campaigns did not deliver reward in time and 33% had yet to deliver after 8 months’ delay (Mollick Reference Mollick2014). These findings slightly vary from our results, and it is our assumption that the variation is primarily related to variation in the categories of campaigns included in the study.
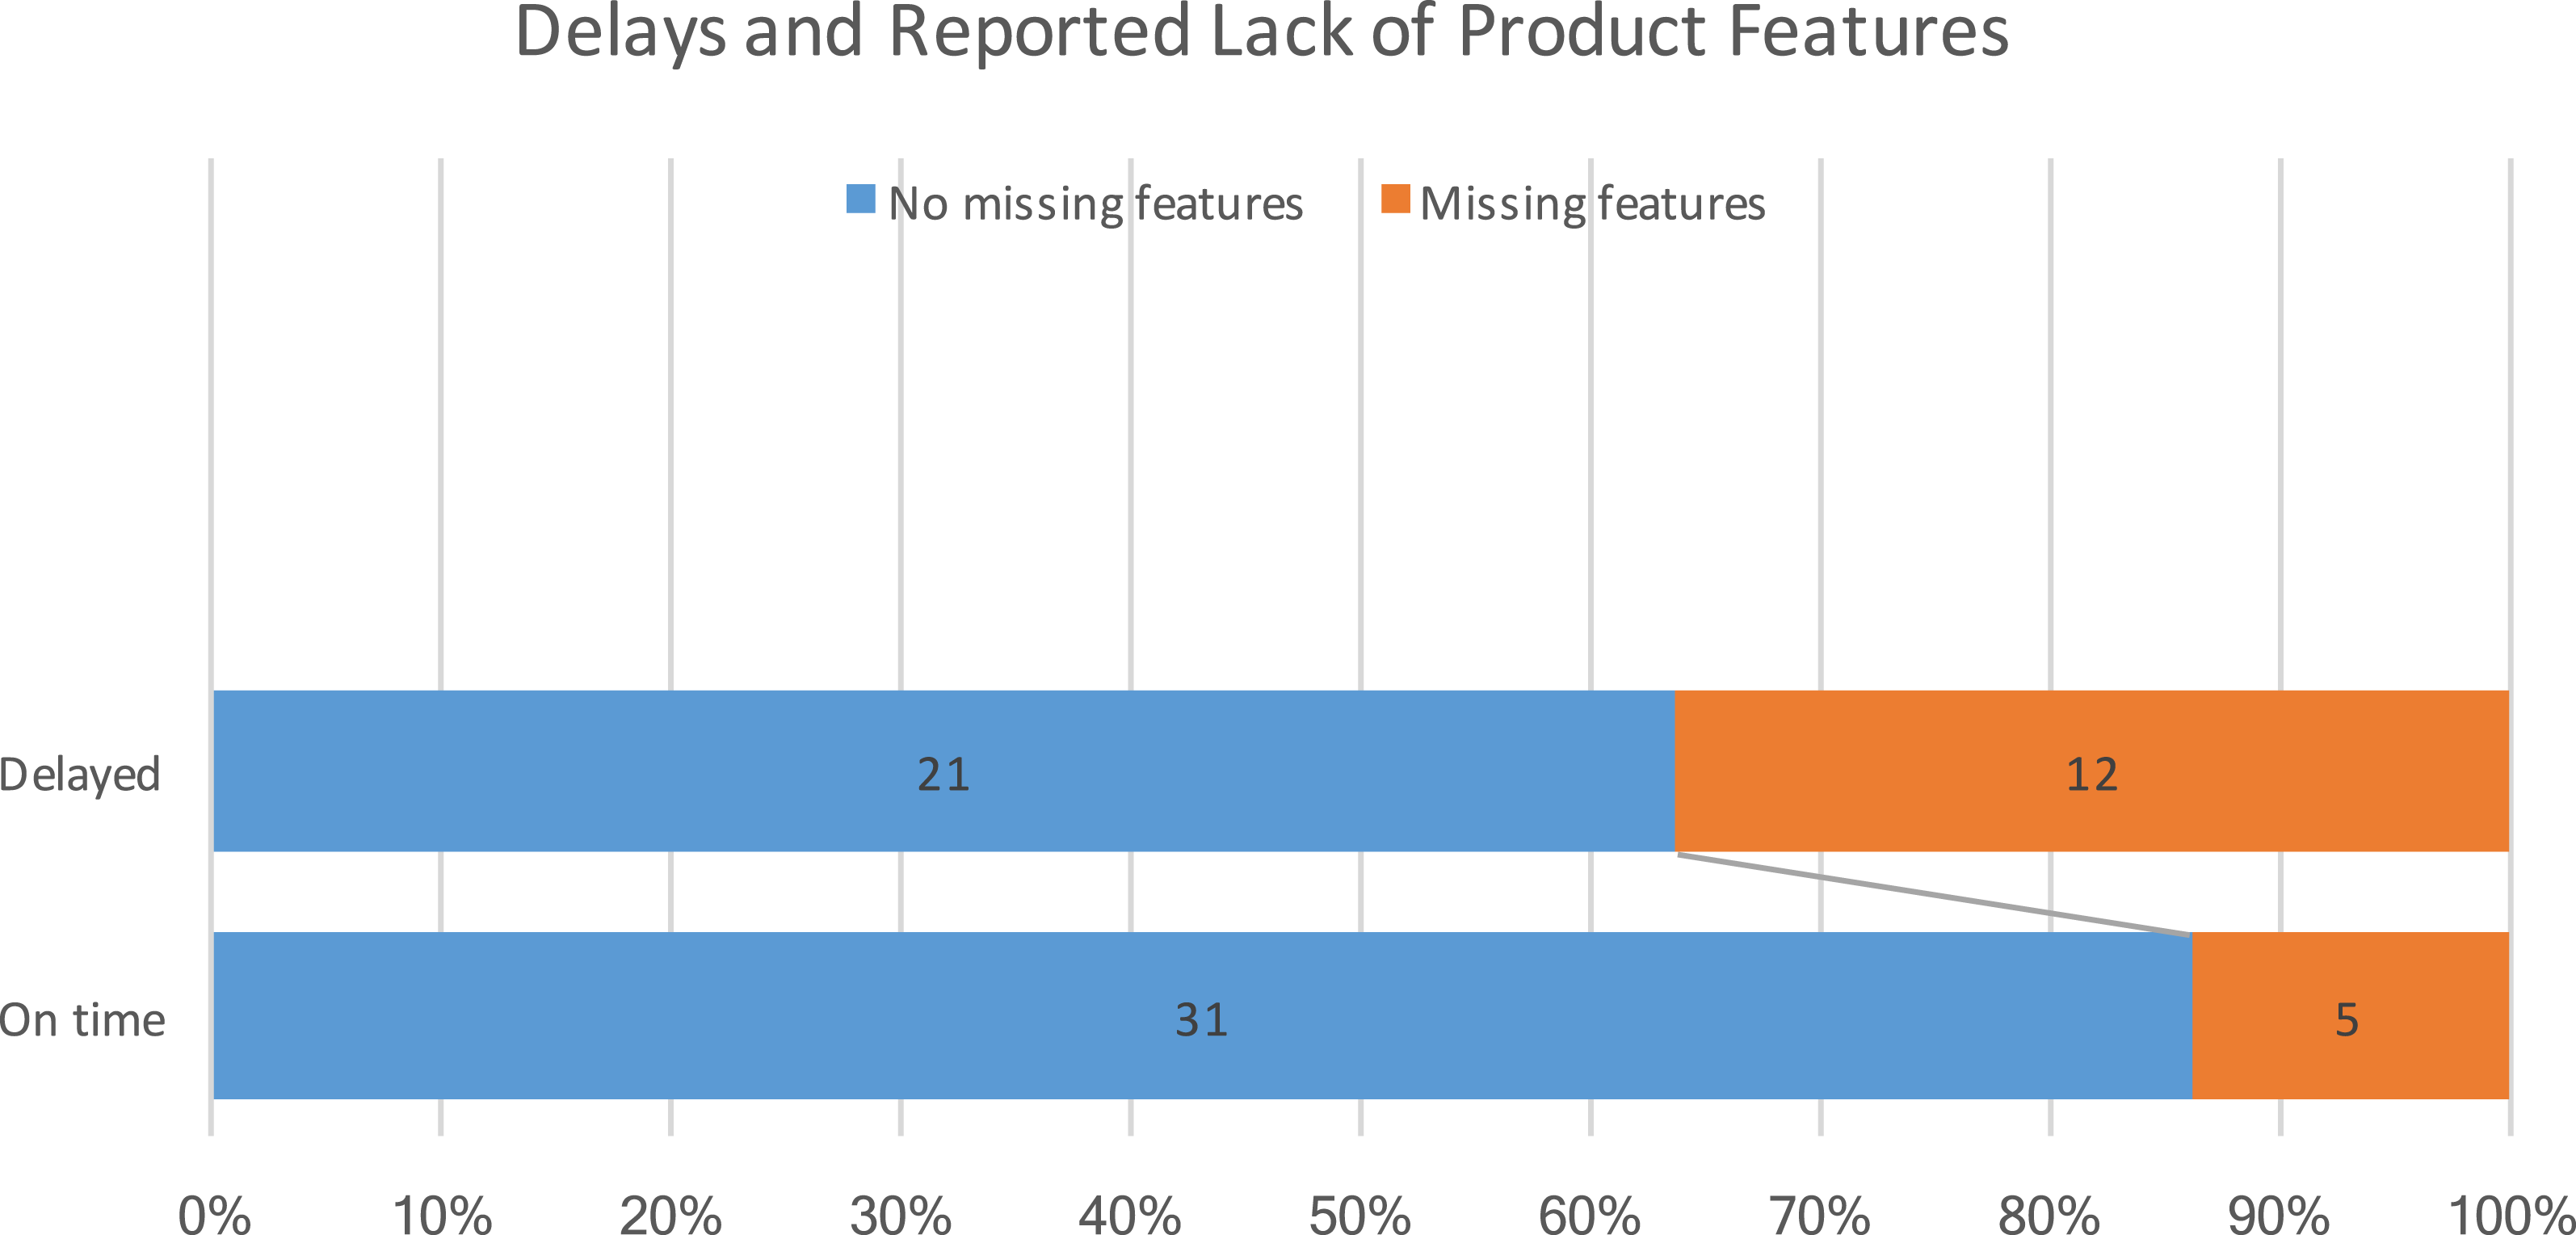
3.1.2 Product features
The majority of campaign backers not only expect to have the products delivered on time. They also expect products to be functional and to possess the features that were advertised during the funding phase of the campaign. Out of 114 campaigns analyzed, 69 of them had delivered products, as presented in Table 1 and Figure 5. Through the analysis, we identified that 17 of these products (25%) were reported to lack one or more features. Figure 6 illustrates the association between campaign delays and the reported lack of product features. The figure presents that delayed campaigns are significantly more likely to deliver products that are reported to be missing one or more of the promised features ( $p=0.030$
,
$p=0.030$
, $CI=0.95$
by Chi-square test).
$CI=0.95$
by Chi-square test).
Despite the significant increase in reports of missing features, the majority of products are still reported to meet the backers’ expectations. This result does, however, indicate that, when campaigns do not deliver products on time, there is an increased risk that the product will not meet expectations in terms of features. In the later discussion we reflect on potential causes behind this distribution.
Representation of reported lack of product features for campaigns that delivered products on time and delayed product delivery. Delayed products were reported to lack features significantly more often. Note that the $x$
-axis represents the percentage of campaigns.
$x$
-axis represents the percentage of campaigns.
3.1.3 Functionality & quality
The third aspect that affects the overall satisfaction of the backers is the quality and the functionality of the delivered products. The FMM has three attributes that are concerned with functionality and quality, all based on feedback provided by the backers through comments: build quality, design flaws and usability. Build quality refers to backer’s assessment of product finish, quality of materials and parts used. An example is the ‘The Flare Audio’ campaign, which developed a set of headphones where backers quickly started to complain about the build quality of the product. In particular, the cables seemed to fail from unexpectedly early fatigue resulting in faulty products.
Design flaws refer to specific flaws in the design, which backers report as a hindrance for use. For instance, the ‘Thermodo’ campaign delivered a tiny digital thermometer which can be connected to a smartphone though the headphone jack port, and when not in use, the product is intended to be stored in a keyring. Through the comments section of the campaign, it is discovered that many backers had lost the Thermodo from their keyring, as the keyring slot randomly ejected the Thermodo.
Usability refers to the elegance and the clarity of interaction with the product, which also includes dedicated software and apps for the shipped products in the situations where applicable. Such issues were reported for the Flyshark campaign, which delivered a foldable and portable wireless keyboard. Usability issues were reported regarding the folding mechanism, which was not designed to allow the use of the keyboard on uneven surfaces.
These different functionality and quality issues are not mutually exclusive, and some products might suffer from multiple issues at the same time. Our analysis revealed that 39 campaigns (out of 69 that delivered products) were identified to have 53 quality and functionality issues ( ${\sim}1$
, 4 issues per product). Figure 7 illustrates how these issues were distributed among campaigns that were respectively delayed or delivered on time.
${\sim}1$
, 4 issues per product). Figure 7 illustrates how these issues were distributed among campaigns that were respectively delayed or delivered on time.
What can be observed from the results in Figure 7 is that the usability issues are significantly increased for the products delivered by delayed campaigns ( $p=0.038$
,
$p=0.038$
, $CI=0.95$
). The presence of design flaws was also increasingly reported for delayed products, but not significantly. The results also show that campaign delays do not seem to change the variation in reported product build quality issues. Once again, the results indicate that when campaigns are delayed there is an increased probability that the delivered product will not meet functionality and quality expectations. We present further reflections on this topic in the later discussion.
$CI=0.95$
). The presence of design flaws was also increasingly reported for delayed products, but not significantly. The results also show that campaign delays do not seem to change the variation in reported product build quality issues. Once again, the results indicate that when campaigns are delayed there is an increased probability that the delivered product will not meet functionality and quality expectations. We present further reflections on this topic in the later discussion.
Representation of reported build quality issues, design flaws and usability issues for products delivered in time and delayed delivery of products. The results present that design flaws and usability issues were increasingly reported for delayed products, whereas build quality issues did not increase. Note that the $x$
-axis represents the number of campaigns.
$x$
-axis represents the number of campaigns.

3.2 Challenges in product development
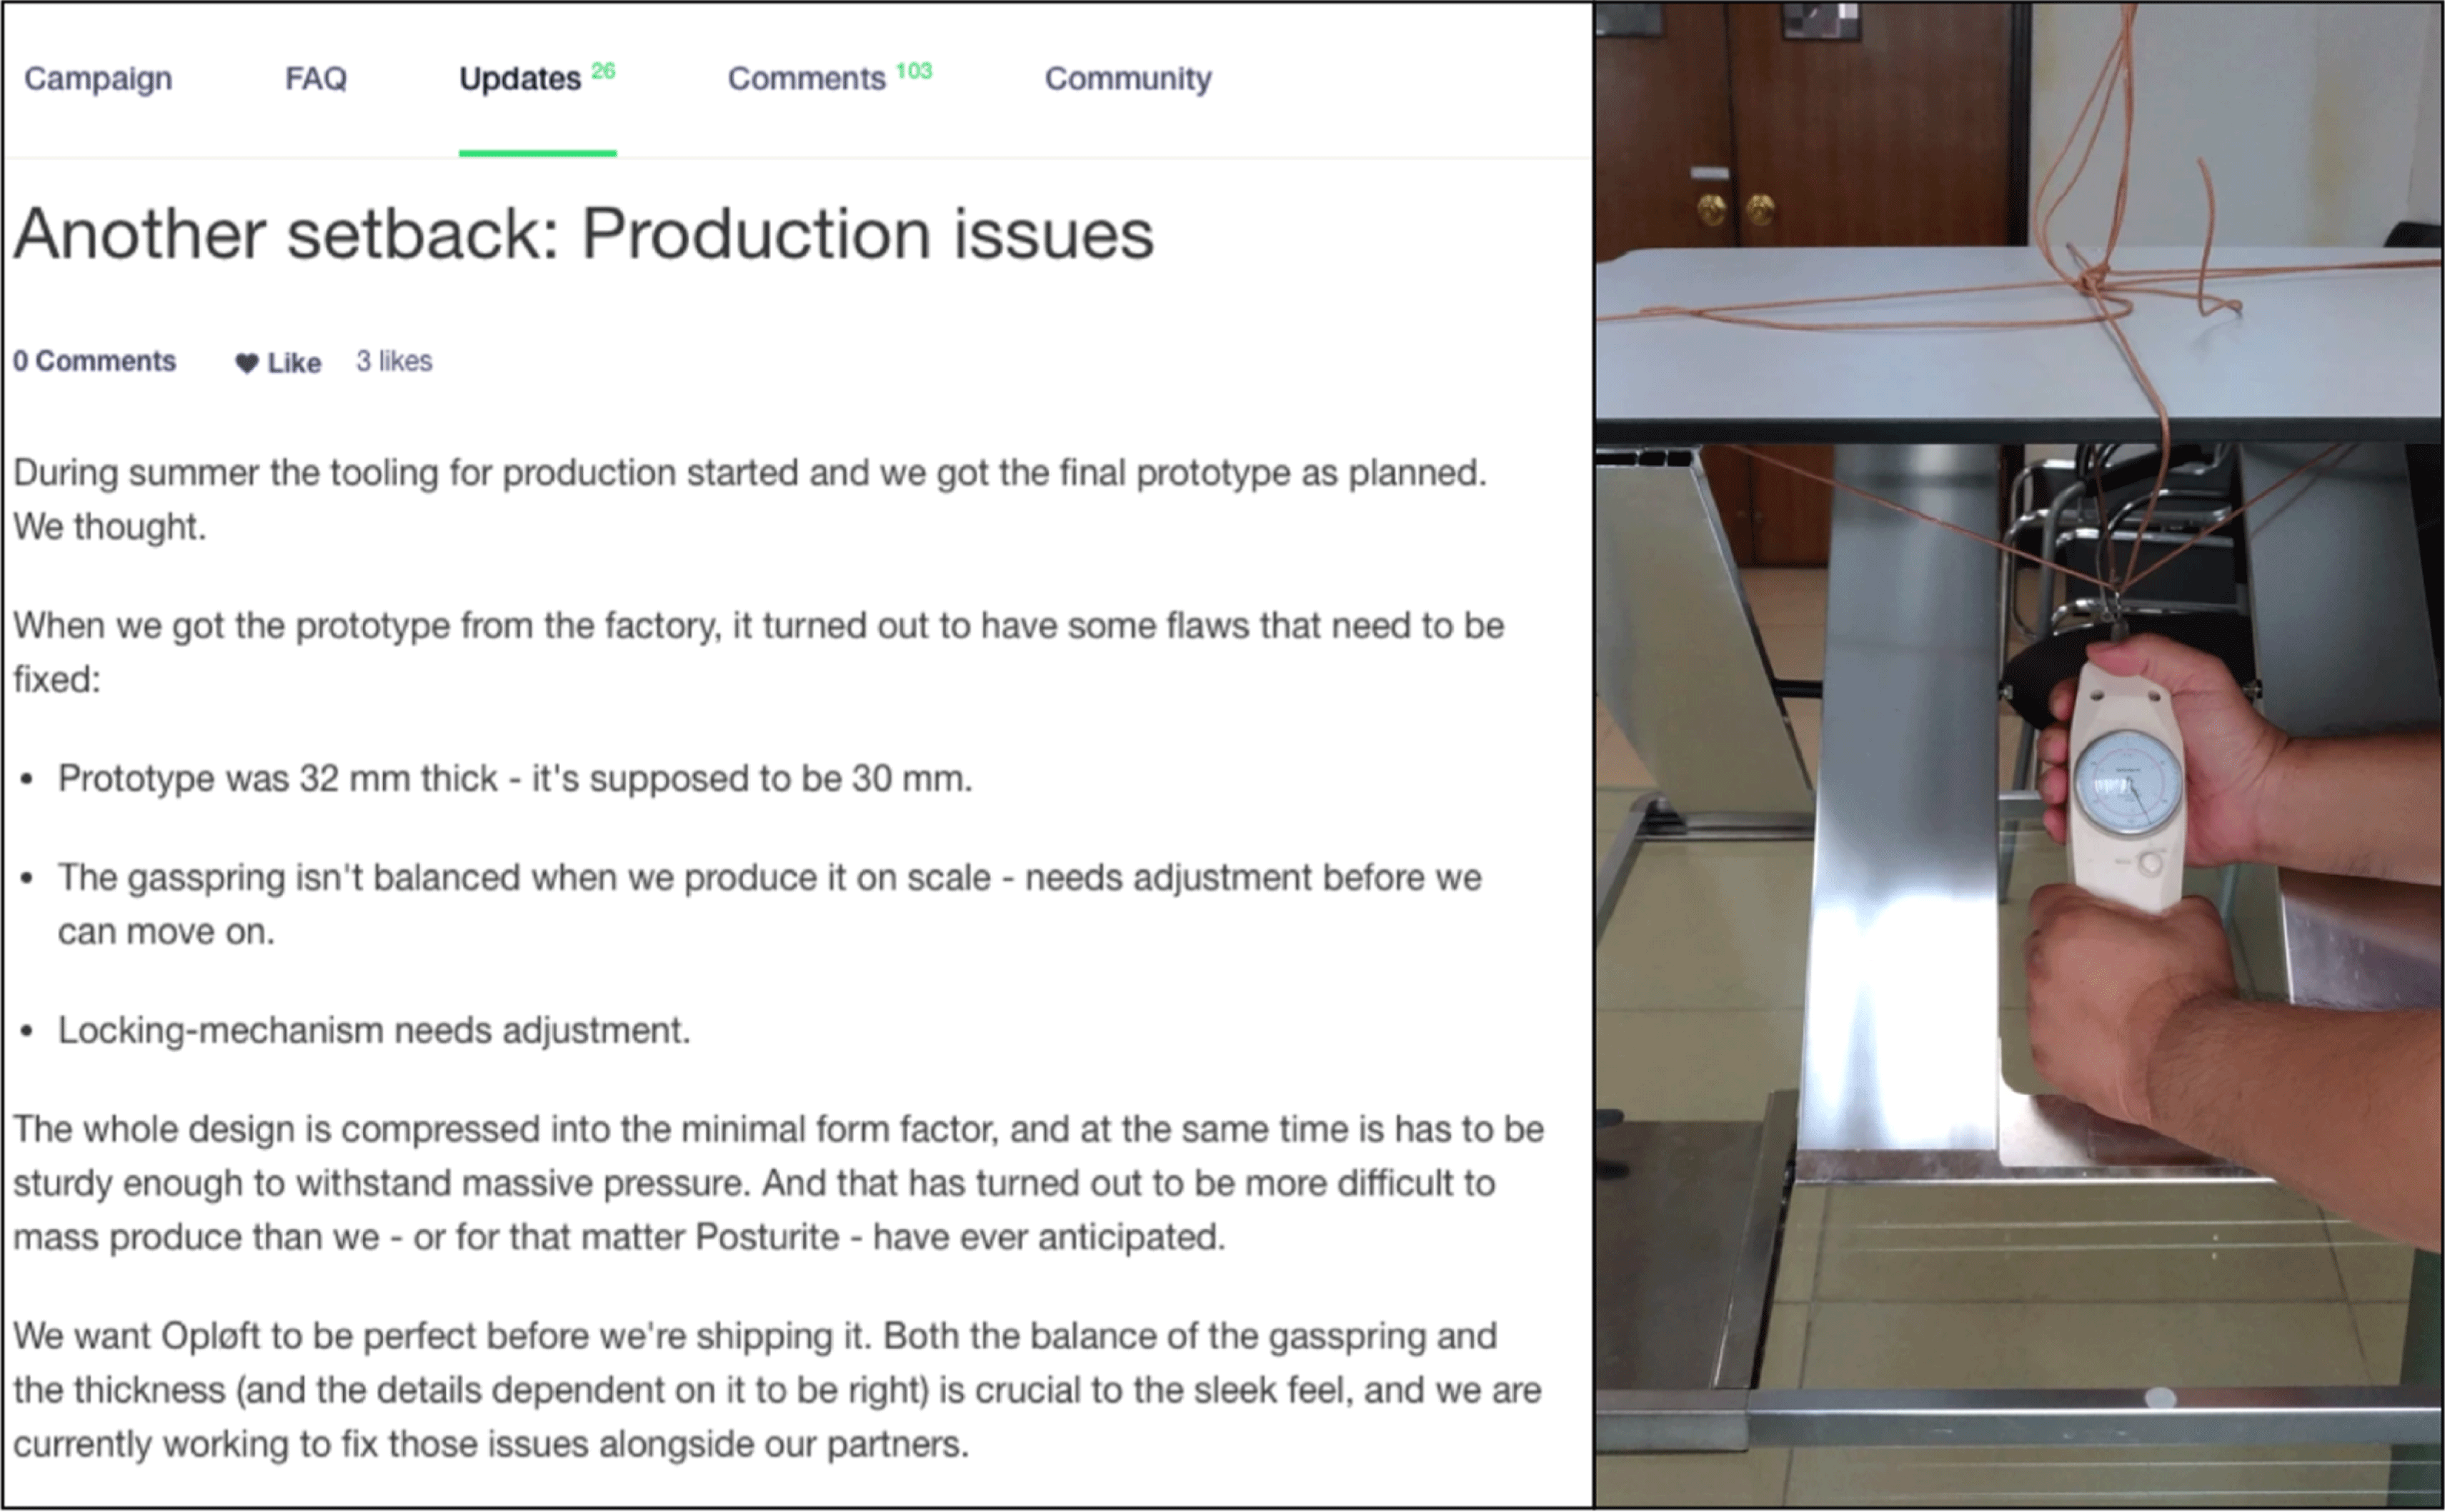
Campaign updates are an essential part of crowdfunding campaigns, where campaign initiators inform and include their backers in the product development through detailed posts (Yancey Reference Yancey2016). An example of an update, originally from the campaign named ‘Opløft’ (Kickstarter 2016), is presented in Figure 8. Combined with the responses to backer questions and comments, campaign updates provide rich information on the challenges that are faced in the various stages of development, manufacturing and fulfilment of the campaign.
Example of a campaign update. Updates communicate the progress of the campaign to their backers. Projects that are delayed or undergoing significant design changes often provide updates that detail reasoning behind the delays or design changes. We have extracted information from campaign updates to assess the reported issues regarding design, manufacturing, operations and management.
The second part of the FMM analysis is concerned with design, manufacturing, operations and project management issues that have been reported through these updates. Unlike the first part of the analysis, which deals with campaigns that have delivered products (69); the second part of the FMM concerns all campaigns (114). In total 129 incidents were recorded in the FMM, corresponding to 1, 13 incidents per campaign.
3.2.1 Design and manufacture
The Design and Manufacture category of the FMM contains nine different failure modes. As it is presented in the Table 2 and Figure 9, three of these stand out among others in terms of their recorded occurrences. These are: (i) manufacturing quality issues (ii) component sourcing issues (iii) design for manufacturing deficiencies.
Representation of the top three failure modes recorded under the design and manufacture heading. The results are presented in three categories according to their timeliness. Delivered on time, delivered delayed and not delivered. It is seen how the recorded challenges overall are increasing along with increased delay. Note that the $x$
-axis represents the number of campaigns.
$x$
-axis represents the number of campaigns.
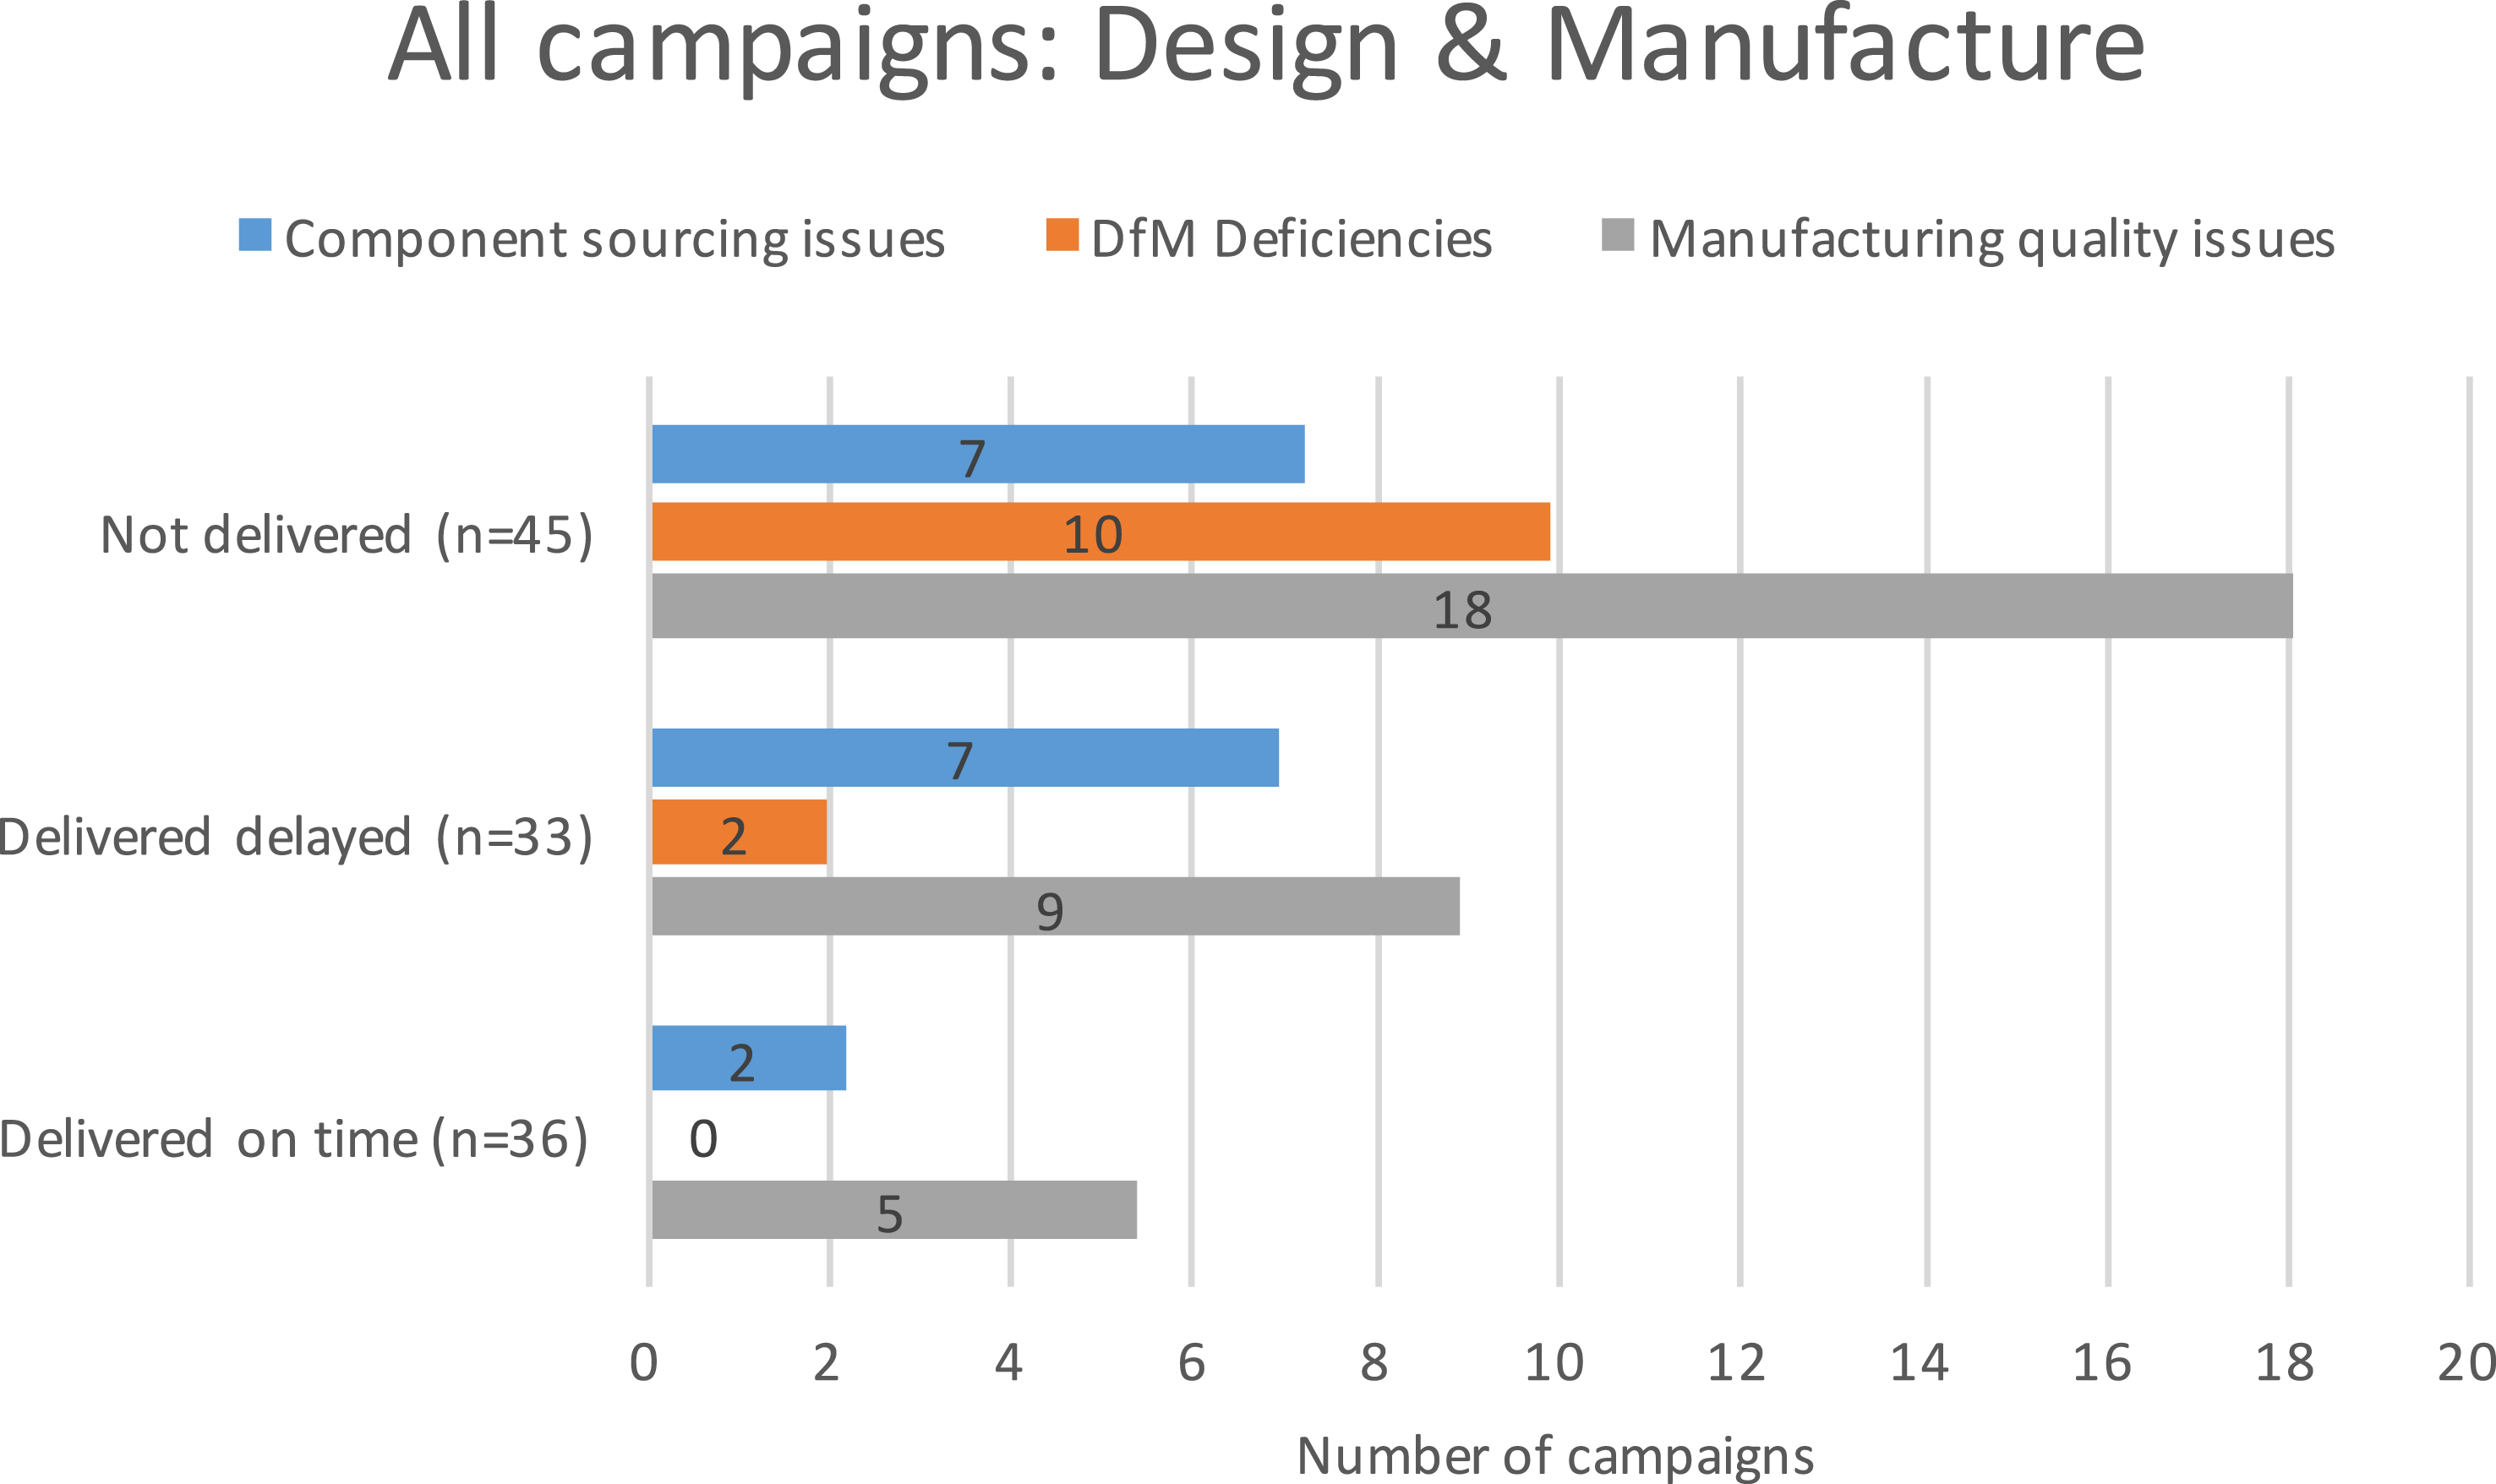
‘Manufacturing quality issues’ refers to two typical cases that are often correlated and hard to separate from each other. In some situations, the selected manufacturing process or technology does not live up to the expectations of the campaign initiators. In other cases, the design of the product does not fit the selected manufacturing processes. ‘Component sourcing issues’ refers to the situation where the demands for specific components and materials cannot be met by the suppliers due to cost, trends, global demands or the scale of the production. Finally, ‘Design for Manufacturing’ deficiencies describe cases where the campaign initiators are not capable of elevating the design of the prototypes beyond a ‘proof of concept’ stage prior to engaging with manufacturing partners.
Figure 9 further illustrates the interplay between these categories and the campaign delays. Generally, campaigns that have not delivered products face multifaceted challenges compared to the campaigns that were delivered on time.
This finding provides indications that manufacturing quality issues could be one of the main challenges hindering initiators from delivering rewards to the backers. An interpretation of the results can also be that campaigns facing delays are challenged by component sourcing issues and DfM deficiencies due to a lack of adequate manufacturing-oriented product development insights prior to launching the campaign. While product development is multidimensional, one integrating activity to accommodate such challenges is rigorous and adequate prototyping activities throughput the design process.
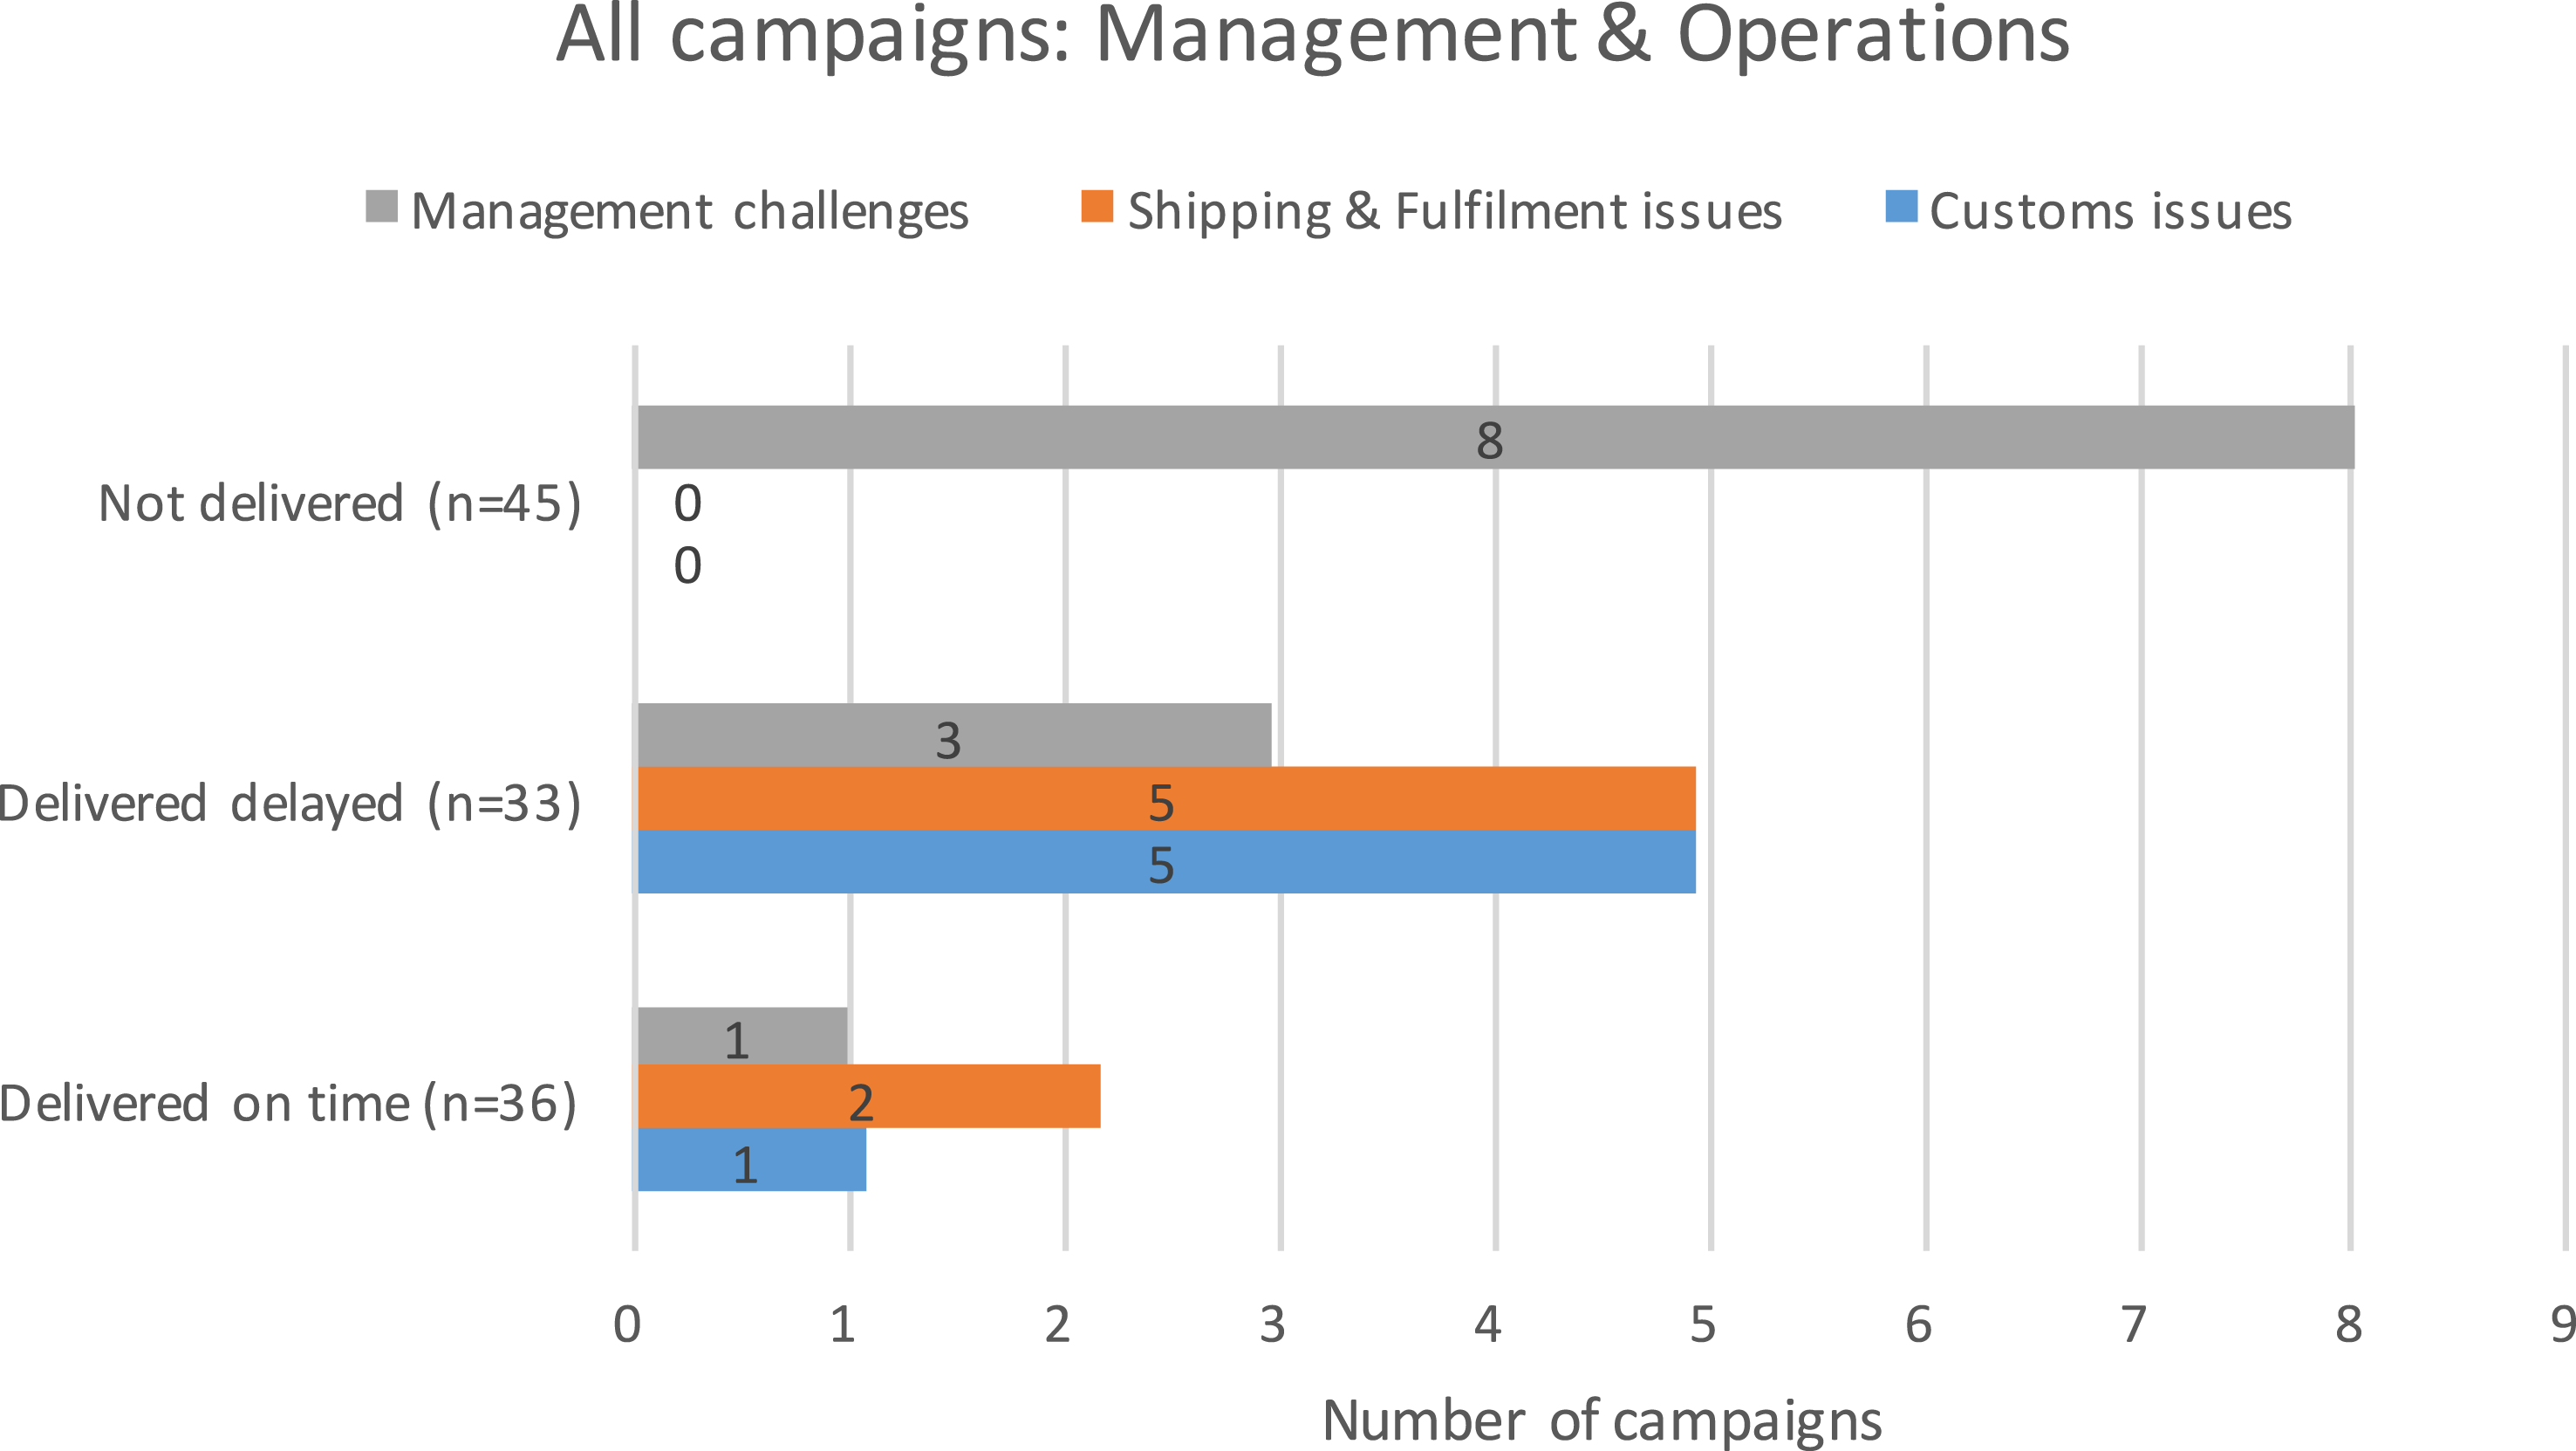
3.2.2 Management & Operations
The final subcategory of the FMM describes management and operations related issues that the campaigns encountered. The three most common issues are related to (i) management challenges, (ii) shipping & fulfilment problems and issues regarding (iii) customs. Figure 10 illustrates the distribution of these issues in relation to campaign delays. Management challenges were reported for 11 campaigns. This concerns situations where initiators described challenges related to administration of their own organization, their coordination of resources and establishment of realistic schedules for the projects. The campaigns which delivered products on time stand out by not reporting management challenges as a hindrance for the project. Management challenges were significantly over-represented ( $p=0.033$
,
$p=0.033$
, $CI=0.95$
, by Chi-square test) among the projects which have not yet delivered products (8 campaigns). Shipping & fulfilment (7 campaigns) and ‘customers’ (6 campaigns) were only reported for the campaigns that have delivered products. A general observation for these challenges were their ‘unforeseen’ characteristics; as they were reported as to be first-time experiences, and described as being surprisingly demanding.
$CI=0.95$
, by Chi-square test) among the projects which have not yet delivered products (8 campaigns). Shipping & fulfilment (7 campaigns) and ‘customers’ (6 campaigns) were only reported for the campaigns that have delivered products. A general observation for these challenges were their ‘unforeseen’ characteristics; as they were reported as to be first-time experiences, and described as being surprisingly demanding.
Representation of the top three failure modes on management and operations. The results are presented in three categories according to their timeliness. Management challenges were significantly more often reported among the campaigns that did not yet deliver products. Whereas only few incidents (4) were recorded for the campaigns that delivered in time. In total 13 incidents were recorded for the campaigns that delivered delayed. Note that the $x$
-axis represents the number of campaigns.
$x$
-axis represents the number of campaigns.
4 Discussion
In this section we present a discussion of our results in the light of our research questions. We further reflect on how our results contribute to our understanding of crowdfunding and crowdfunded product development in the perspective of design science. This includes our perspective on crowdfunding in relation to more conventional funding schemes and development activities. Finally, we outline opportunities for further work.
4.1 Contribution of this work
We consider the findings of this study exploratory, and the main contribution being the identification and quantification of product development challenges that crowdfunding campaigns encounter after the campaign funding period. Further we deliver an identification and quantification of failures to meet promises on the quality and functionality of the delivered products. Due to the exploratory nature of the study we refrain from formally verifying specific hypotheses. Crowdfunding is an evolving topic and we find this approach appropriate, as little prior work exists to guide our study. We expect that our findings will be useful for future theory building and design support tools dedicated to crowdfunded product development. We further find that the insights delivered can be of value to practitioners with interest in the dynamics of the topic.
4.1.1 What does the results of this study tell?
The objective of this study was to explore and understand why some reward-based crowdfunding campaigns fail in delivering on their promises, and how backers evaluate the products shipped to them as rewards, in terms of expected features and quality.
In order to investigate these topics, we established two aspects that can characterize ‘failure’ of the campaign. The campaigns can fail in the parameter of timelines; the ability to deliver the promised rewards to backers within a reasonable timeframe of the initial announced deadline. Also, the campaigns can fail by not delivering a product that has the features, functionality or quality that was promised in the campaign material.
Our analysis shows that both aspects of failure described in this study are common. Only 36 of 114 the campaigns in our dataset delivered products in a timely manner. Among the 69 campaigns managed to deliver products (timely or not) 30 of them were not lacking functionality and quality attributes that were expected by the backers during the funding phase. These findings have been highlighted through the FMM presented in Table 2 and the graphs presented in Section 3.2 ‘Product development challenges’.
Our study also shows how 50 (43%) of the campaigns are delayed by more than 12 months. As presented in Section 1.2, the objective for the majority of campaign initiators is to start a lasting venture (Mollick & Kuppuswamy Reference Mollick and Kuppuswamy2014) and in this light it is most likely unsatisfactory for these creators to face long delays for their campaigns. It has previously been documented in research how companies suffer significant market evaluation penalties when announcing delays of announced new products (Hendricks & Singhal Reference Hendricks and Singhal1997). Hereby we infer that; delays cause negative business effects for the campaign creators’ long term success and the campaign creators could most likely benefit from dedicated support tools to increase the likelihood of accommodating the different challenges outlined in this study.
When evaluating how campaign backers evaluate rewards in terms of expected product features and quality, we find that 17 ( ${\sim}25\%$
) of the delivered products are overall reported to lack expected features. Further, it is shown that product features will be significantly more likely to be lacking if the campaign is delayed more than 3 months. A similar significant result is reported for the products’ usability, 12 campaigns (
${\sim}25\%$
) of the delivered products are overall reported to lack expected features. Further, it is shown that product features will be significantly more likely to be lacking if the campaign is delayed more than 3 months. A similar significant result is reported for the products’ usability, 12 campaigns ( ${\sim}17\%$
), also follows the patterns that delayed campaigns are less likely to live up to the expectations of the backers. The product build quality however did not follow the pattern introduced above and was evaluated evenly by the backers across the different categories of timeliness. One explanation describing the result can be a variance in the backer’s preferences or evaluation of product quality that we do currently not understand.
${\sim}17\%$
), also follows the patterns that delayed campaigns are less likely to live up to the expectations of the backers. The product build quality however did not follow the pattern introduced above and was evaluated evenly by the backers across the different categories of timeliness. One explanation describing the result can be a variance in the backer’s preferences or evaluation of product quality that we do currently not understand.
Manufacturing quality issues were the most frequently occurring failure mode in the analysis. Further investigation of the correlation between ‘functionality and quality’ and ‘design and manufacture’ aspects of the FMM show that 30 ( ${\sim}43\%$
) of the campaigns that delivered products with missing features also faced manufacturing quality issues, and build quality issues were reported for 43 (
${\sim}43\%$
) of the campaigns that delivered products with missing features also faced manufacturing quality issues, and build quality issues were reported for 43 ( ${\sim}64\%$
) of the campaigns with manufacturing quality issues. This indicates that manufacturing quality issues can lead to tradeoffs that compromise the promises that are made to backers in terms of product attributes.
${\sim}64\%$
) of the campaigns with manufacturing quality issues. This indicates that manufacturing quality issues can lead to tradeoffs that compromise the promises that are made to backers in terms of product attributes.
Another ambition of this study was to investigate if particular product development issues could be identified as primary causes of failure. Through our analysis we have identified that five failure modes were significantly more often reported for campaigns which have been delayed or not yet delivered products to their backers. These are:
(1) Reported lack of expected features.
(2) Reported usability issues.
(3) Design for Manufacturing deficiencies.
(4) Manufacturing quality issues.
(5) Management challenges.
We find that these five failure modes should be highlighted as particular challenges in crowdfunded product development. This claim should though not be considered as an isolated measure and rather should be interpreted holistically. Despite the significance of their occurrence, the multifaceted characteristics of product development do not allow for a particular role in special campaigns or generalizations on their relevance. In this regard, we conclude that no single design implication should be highlighted as the main cause for failure in crowdfunded product development.
4.2 Kickstarter as a moderating platform
A topic of ongoing debate concerns whether delays and disappointing campaign fulfilment can be associated with failure in crowdfunding (Yancey Reference Yancey2016). For this study, we establish our analysis and results from two types failure introduced in Section 2.3 and the FMM. Kickstarter ambassadors argue that crowdfunding should not be compared to a webshop or a normal hardware store. Ambassadors argue that uncertainty in the projects is high and delays should be expected. Essentially this discourse underlines that a focus on deadlines negatively incentivizes campaign initiators to take shortcuts in the product development process. Others argue that Kickstarter does not prioritize and enforce its responsibility to keep the campaign initiators responsible for promises made to their backers (Yancey Reference Yancey2016). In this sense, Kickstarter indemnifies the platform’s responsibility and legal liability from the campaigns on the platform. As a digital and platform oriented business organization, Kickstarter is a child of the digital revolution. Despite rapid growth, the paradigm is potentially still in its infancy and our understanding of crowdfunding’s effect on engineering design and product development is still limited. This includes the legislative aspects suitable for balancing the different interests and interactions of Kickstarter and similar platforms.
Various aspects of establishing and maintaining project plans have been a topic of substantial research in both engineering design and management literature. To meet product development and fulfilment requirements requires careful project planning (Ulrich Reference Ulrich2007). We believe that this also applies to crowdfunding and it is the interest of all involved parties to establish a positive reputation around the crowdfunding paradigm. Rewards that do not meet the backer’s expectations can cause bad publicity. Further, Kickstarter will be challenged on accountability as moderator and, finally, the campaign initiators must allocate additional project resources if they encounter unexpected causes of delay or design challenges. As discussed above such is not only a matter of spending additional resources but can also cause significant market evaluation penalties.
4.3 Are campaigns intensified to oversell concepts?
The dynamics of crowdfunding imply that successfully funding a campaign is the first important ‘stop or go’ milestone for campaign initiators. Such dynamics contain a paradox, which can be considered as a design implication of its own: It can be tempting for campaign initiators to ‘oversell’ the product to attract as much funding as possible. This, along with spending only minimal product development resources before knowing the campaign outcome – in the extreme, using crowdfunding for validating the market potential of early concept prototypes. Based on our results we hypnotize that the large number of functionality and quality issues for delayed campaigns can be related to this paradox.
Such issues are also acknowledged by some of the main actors in the crowdfunding community. A recent initiative have been launched by Kickstarter, the electronic component distributor Avnet, and the hardware consultancy firm Dragon Innovation (Yulman et al. Reference Yulman, Terra, Dunham and Gallagher2017). The initiative aims to support the creators in design and manufacturing before they launch their crowdfunding campaigns.
4.4 Reward-based crowdfunding versus conventional funding schemes and development processes
In this section we present some initial perspectives on how crowdfunded product development might differ from more conventional funding schemes and what affects the dynamics have on the product development process.
4.4.1 Product offerings and design
As previously introduced, crowdfunding is essentially an open call through the internet. Backing a crowdfunding campaign can be a valuable social activity for the campaign backers (Belleflamme et al. Reference Belleflamme, Lambert and Schwienbacher2014). Part of the backers commitment to the campaign is connected to expectations of an inclusive product development process. Such expectations set particular requirements for the openness of the product development approach and interactions between the backers and the developers. In this sense the (digital) user plays an increasingly important role in the way goods are used and consumed (Brenner et al. Reference Brenner, Karagiannis, Kolbe, Krüger, Leifer, Lamberti, Leimeister, Österle, Petrie and Plattner2014), and these dynamics share some similarities with the ‘open-design’ paradigm (Boisseau, Omhover & Bouchard Reference Boisseau, Omhover and Bouchard2018), ‘mass collaboration design’ (Ball & Lewis Reference Ball and Lewis2018), ‘social product development’ (Forbes & Schaefer Reference Forbes and Schaefer2017) and the ‘creative consumers’ phenomenon by Berthon et al. (Reference Berthon, Pitt, McCarthy and Kates2007). Such requirements for openness can be considered a particular characteristic of crowdfunded product development.
As previously introduced, Mollick and Kuppuswamy identified that among the top motivations for campaign initiators to choose crowdfunding were: ‘To see if there was demand for the project’, and ‘To connect directly with a community of fans or supporters’. (Mollick & Kuppuswamy Reference Mollick and Kuppuswamy2014). Such motivations align well with an open approach to product development as introduced above. In a product development perspective, it might also be a challenge or a direct hindrance for success, as crowdfunding campaigns are not a direct substitute for practicing user oriented design or customer development. Feedback and collaboration with backers can though provide some similar insights. This occurs, however, at a point in time where the campaign initiators have simultaneously also started selling preorders of the product through the campaign. A potential result can be inertia created from changing product features, characteristics or business model after a large community of backers have made their contributions. With similar reflections, the US based hardware accelerator BOLT has made a critical argument toward user involvement aspects of crowdfunding (Einstein Reference Einstein2015c ). In line with recognized entrepreneurship literature (Ries Reference Ries2011; Blank Reference Blank2012; Aulet Reference Aulet2013) entrepreneurs pursuing a crowdfunding campaign should in this perspective carry out a palette of development activities, and in particular make use of prototyping, prior to their campaign, to support them in identifying their initial ‘beach-head market’ and core product offerings, a similar fashion to entrepreneurs pursuing traditional sales channels.
4.4.2 Manufacturing for crowdfunding campaigns
A characteristic for all crowdfunding campaigns is that, prior to the campaign, the outcome is unknown. Thus it is not known how many units to manufacture or what kind of economic resources there will be to do so. This makes final decisions on suitable manufacturing processes or partners difficult, especially as the campaign outcome (essentially, working as a market validation of the product) can be used as leverage in negotiations for attractive contracts. Through the data collection of this study, we have encountered examples indicating that some campaign initiators will not engage in dialogue with potential manufacturing partners and suppliers until after the campaign has been finalized – this would be the case with the Miito campaign introduced earlier. To the best of our knowledge, comparative research, focused on entrepreneurs following conventional funding schemes, currently does not exist. However, as introduced in Section 4.3, an ecosystem focused on manufacturing and fulfilment has started to emerge around the crowdfunding paradigm, and the manufacturing ecosystem is currently undergoing change toward broader openness toward early stage start-up companies with a need for ‘high mix low volume’ manufacturing set-ups (Dragon Innovation 2016; Bolt 2017).
A general limitation in comparing crowdfunding with conventional funding schemes is that we cannot identify if the campaign initiators are also pursuing other funding sources. In our view, crowdfunding should not be seen as an either/or alternative to traditional venture capital. We hypothesize that it is relatively common for the campaign initiators to attract multiple sources of funding for their projects. However, campaign initiators are ‘free’ to utilize the funds collected from their crowdfunding campaign as they find most appropriate. This can be considered different from public support programs for entrepreneurship venture capital traded for equity.
4.5 Opportunities in research on crowdfunded product development
From conducting this research, a range of new hypotheses have been established and we see future research potential in crowdfunded product development. Crowdfunding platforms such as Kickstarter.com are rich data libraries of product development cases. Related research could be conducted to study such topics as the impact of early versus late design decisions in product development (Tan, Otto & Wood Reference Tan, Otto and Wood2017). Another topic could be crowdfunding entrepreneurs’ ability to work within what has been presented as the novelty ‘sweet spot’ of invention (He & Luo Reference He and Luo2017). In the following sections we elaborate three topic proposals which could support future theory building from the results presented in this study.
4.5.1 Long term performance
An obvious opportunity is to carry forward this study and evaluate how the campaign teams perform in the market outside the crowdfunding environment. Other studies have found that failure rates for ‘new technology products’ and ‘consumer goods’ are documented to be around 40%. Comparison with the crowdfunding environment is (due to the nature of crowdfunding) not directly applicable, but, when campaigns start marketing their products post campaign, such comparisons becomes possible. Recently, the commercial giant Amazon started the initiative named Launchpad (Launchpad 2017). The initiative offers start-ups special vendor benefits and support in handling sales and distribution. Research questions to be studied are e.g. if crowdfunded products and organizations have a higher success rate in the market.
4.5.2 Adaption of design research
The results of our study show how many crowdfunding campaigns struggle in meeting the promises made to their backers. While we have documented specific product development challenges some aspects of the product development process remain uncovered in this work. Throughout the past decades the engineering design community has proposed various design approaches and methodologies, with the aim to support designers by providing tools, methods and guidelines to improve the chances of producing successful products (Blessing, Chakrabarti & Wallace Reference Blessing, Chakrabarti and Wallace1998). The analysis conducted in this study does not provide any insights as to what extent the campaign initiators are utilizing the existing support tools. An opportunity for further research and additional perspectives of the FMM is to study the use of methodologies and approaches for the crowdfunding teams. Such studies could include evaluations on the correlation between campaign success and use of design methodology, and could further evaluate whether crowdfunded product development introduces new challenges that call for dedicated ‘design for crowdfunding’ support tools.
4.5.3 Use of prototypes in crowdfunding
Another research potential is related to design maturity and the prototypes presented in the campaign material. Recent advancement in rapid prototyping tools (Camburn et al. Reference Camburn, Viswanathan, Linsey, Anderson, Jensen, Crawford, Otto and Wood2017) and collective design platforms (Özkil Reference Özkil2017) have made it possible to present high resolution ‘looks like’ prototypes in cheap and efficient ways. The results of our study document that campaigns with design for manufacture deficiencies are unlikely to deliver products in a timely manner. It is, however, widely unclear how mature the designs are, when they are presented on the crowdfunding platforms. Future studies, including further development and applications of FMM, could focus on prototypes and design maturity in their campaign material. This e.g. in combination with the ‘Media Richness Theory’ evaluations for optimal prototype fidelity, as introduced by Schmidt et al. (Reference Schmidt, Wallisch, Böhmer, Paetzold and Lindemann2017). Also, it could be investigated if a strong focus on ‘looks like’ prototypes introduces an inappropriate under prioritization on ‘works like prototypes’ with the ambition to advance design insights, such as the eliciting of unknown unknowns through prototype activities (Jensen, Elverum & Steinert Reference Jensen, Elverum and Steinert2017).
5 Conclusion
This paper provides an empirical review of the crowdfunding platform Kickstarter.com, with the aim of identifying challenges in crowdfunded product development, that consequently can cause in failure of the crowdfunding campaign. The analysis presented was built around a failure mode model, which was established through a pre-study. The first part of the analysis concerns the time aspect of the crowdfunding campaigns and presents an overview of the campaigns’ ability meet their deadlines in delivering products to campaign backers. The next part focuses on product evaluations made by the campaign backers and the campaign initiators’ ability to deliver on promises concerning product features and attributes is quantified. Where the two first parts of the analysis concerns the promises made to campaign backers, the third part investigates challenges in the product development process by identifying and quantifying issues and challenges, which could cause the campaigns to fail in meeting their promises to backers.
The results of this study provide insights on crowdfunded product development through Kickstarter.com, and the authors expect that the results could be of relevance to both researchers and practitioners. Lastly, the study is also an example of how the crowdfunding platforms can be utilized in research as data libraries of product development cases.
Acknowledgments
The authors would like to thank Design Science editors and reviewers, who provided insightful, constructive and timely comments and feedback!


 Open access