

China is one of the countries with the most rapid increases in the prevalence of chronic diseases; the prevalence of overweight/obesity (BMI ≥ 25 kg/m2) among adults was 15 % in 1992, 22 % in 2002( Reference Wang, Mi and Shan 1 ) and 33 % in 2007–8( Reference Yang, Liu and Ge 2 ). The prevalence of diabetes, hypertension and dyslipidaemia reached 10, 27 and 65 %, respectively, in 2007–8( Reference Yang, Liu and Ge 2 ). Due to the key role played by the diet in all these chronic diseases, it is important to better understand the eating behaviour of the Chinese population.
Over the last two decades, many important changes have been identified in the diet of the Chinese population. Eating behaviours such as snacking have emerged and continue to grow, and cooking methods have also changed from predominantly steaming and boiling to frying( Reference Wang, Zhai and Du 3 , Reference Wang, Zhai and Zhang 4 ). A marked increase in dietary diversity has also been observed, with more people consuming foods from more number of food groups( Reference Popkin, Lu and Zhai 5 ). The intake of vegetables, fruits, cakes, and milk and other animal products such as pork, poultry and eggs has increased, whereas that of cereals and tubers has decreased( Reference Zhai, Wang and Du 6 ).
In addition to the study on the number of meals consumed, cooking methods or food group consumption, data-driven dietary pattern analyses, such as factor or cluster analyses, are also useful for studying dietary patterns. Dietary patterns more closely resemble actual eating behaviours because multiple food groups instead of single food groups or nutrients are considered during analyses, and they give insights into how people eat by identifying the foods that are eaten in combination( Reference Moeller, Reedy and Millen 7 – Reference Hu 9 ). Previous studies conducted in a Chinese national survey in 2002 have identified several dietary patterns such as the ‘Yellow Earth’ or ‘traditional northern’ pattern, which is high in wheat, wheat products, maize, sorghum and tubers; the ‘green water’ or ‘traditional southern’ pattern, which is high in rice, vegetables, seafood, pork and poultry; and the ‘Western’ or ‘new affluence’ pattern, which is high in beef, lamb, milk, cheese, yogurt, cakes, juices and nuts( Reference Wang, He and Li 10 – Reference Zhang, Dagevos and He 12 ). However, to the best of our knowledge, no longitudinal analysis of dietary patterns over time has been conducted in the Chinese population.
To fill this gap, in the present study, we used measurements of dietary intake recorded during seven occasions over the course of 18 years in the China Health and Nutrition Survey (CHNS). When examining dietary patterns over time, there are two different dimensions one can look at: one is changes or stability in the general structure of the dietary patterns (are foods combined differently in each year?) and the other is the individuals' level of adherence to each dietary pattern over time. Therefore, first, we aimed to derive the dietary patterns independently at each point to determine whether the structure of dietary patterns has changed or remained stable. Second, we assessed tracking, trends over time and sociodemographic characteristics associated with the adherence to each dietary pattern.
Methods
Study design and participants
The CHNS is an ongoing study in which detailed information on income, employment, education, demographics, health and diet is collected. The survey was designed to examine across space and time how economic and social changes are associated with a range of health behaviours. A multi-stage, random-cluster process was used to draw samples in nine provinces. Survey protocols and instruments and the process followed for obtaining informed consent for the present study were approved by the institutional review committees of the University of North Carolina at Chapel Hill (UNC-CH) and the Chinese Institute of Nutrition and Food Safety (INFS), China Center for Disease Control and Prevention. The participants provided written informed consent. Additional details about the CHNS data have been provided elsewhere( Reference Popkin, Du and Zhai 13 ).
Surveys were conducted in 1989, 1991, 1993, 1997, 2000, 2004, 2006 and 2009. We used data from 1991 to 2009 because only adults aged 20–45 years were included in 1989. In all the waves of the CHNS, identical clinical, dietary and anthropometric data were obtained from each household member. In each wave, we included all adults aged 18–65 years with complete dietary data for at least three waves (n 9253); from these, 20 % had complete dietary for all the seven waves, 50 % for five or more waves, and 75 % for four or more waves.
Dietary assessment and food grouping
In the CHNS, dietary assessment is a combination of three consecutive 24 h recalls at the individual level and a food inventory at the household level carried out over the same 3 d period. The three consecutive days were randomly allocated to start from Monday to Sunday. For the food inventory, all the foods available in the household (purchased, stored or home produced) were measured on a daily basis with a Chinese balance (1991–7) or digital scales (2000–9). The changes in the household food inventory as well as wastage were used to estimate total household food consumption. For the 24 h recalls, trained interviewers recorded the types and amounts of foods consumed and the type of meals consumed and place of meal consumption. For dishes prepared at home, the amount of each dish was estimated from the household food inventory, based on the proportion of each dish that the person reported to have consumed.
The food groups included in the present analysis were based on a food grouping system developed specifically for the CHNS by researchers from the UNC-CH and INFS( Reference Popkin, Lu and Zhai 5 ); this system separates foods into nutritionally and behaviourally meaningful food groups. We did not include alcoholic beverages, as mostly males consume them, with females consuming very low amounts. Further description of the food group classification that we used is given in Table S1 (available online).
Statistical analyses
Because we included subjects who were 18–65 years old during each wave, it was possible for subjects to be excluded during certain waves (e.g. a subject aged 64 years in 2000 would be excluded in 2004 and afterwards or a subject aged 14 years in 1991 would be included only when he or she became 18 years in 1993). This exclusion criterion resulted in the inclusion of younger subjects in the later waves. In addition, the proportion of subjects in the sample residing in the North region had increased since 2000. This was because in 1997, a province in the North region was unable to participate and a substitute province was included in the study, and in 2000, both the original and substitute provinces were included again. Therefore, all the analyses were adjusted by geographical region and age in 1991 (equivalent to adjusting by birth year), so that the dietary trends found over time were not related to these sample distribution changes in age and region.
Most of the food groups had a high proportion of non-consumers, possibly because dietary intake was measured over a 3 d period. Therefore, we categorised consumption as a binary variable (non-consumers v. consumers) for food groups with < 25 % of consumers in all the waves or as a three-level variable (non-consumers, consumers with dietary intake below or above the median estimated using data collected during all waves).
We carried out an exploratory factor analysis for categorical variables using the robust weighted least-squares estimator in Mplus 6.1 (Muthén & Muthén) during each wave. Factor analysis on ordinal variables is carried out with a polychoric correlation matrix. Conceptually, ordinal variables have an underlying continuous normally distributed variable, so thresholds for the levels of the categorical variables are estimated. These thresholds are normal z-scores corresponding to the cumulative proportion of subjects in each category (i.e. for a binary variable (non-consumers v. consumers) with a 0·87 proportion of non-consumers, the threshold between the two categories would be equal to the corresponding normal z-score 1·13)( Reference Bollen 14 , Reference Maydeu-Olivares, García-Forero and Gallardo-Pujol 15 ).
Food groups with ≤ 5 % of consumers in all the waves were not included in the factor analysis. These food groups are uninformative because of a lack of variability in their intake in the population and also because they could produce bivariate tables with empty cells and affect the polychoric correlation.
Based on eigenvalues >1, inspection of the scree plot and interpretability, we retained two dietary patterns in each wave. Factors were rotated with the varimax procedure, because this method seeks to maximise the variability among the loadings in each factor and hence gives simpler and more easily interpreted factors( Reference Kim and Mueller 16 ). To evaluate the similarity between factor loadings across all the waves in each dietary pattern, we estimated a coefficient of congruence between each pair of waves. The coefficient of congruence is an index of factor similarity and is estimated as:
 $$\begin{eqnarray} \sum x _{ i } y _{ i }/\sqrt {\sum y _{ i }^{2} x _{ i }^{2},} \end{eqnarray}$$
where x i and y i are the factor loadings of food group i (i =1,…, n) on factor x and y (i.e. x =dietary pattern 1 in 1991 and y =dietary pattern 1 in 1993). A coefficient of congruence ranges from − 1 to 1, a value between 0·85 and 0·94 indicates that the factors are fairly similar, and a value greater than 0·95 indicates that the two factors can be considered equal( Reference Lorenzo-Seva and Ten Berge 17 ).
Because we found similarity between the factor loadings across all the waves, we computed applied scores as many studies with longitudinal dietary patterns had done previously( Reference Mishra, McNaughton and Bramwell 18 – Reference Elstgeest, Mishra and Dobson 21 ). The factor loadings from year 2000 were used to calculate the factor scores in all the other waves; we used the loadings of all the food groups included in the dietary pattern analysis, regardless of the loadings being high or low. We chose year 2000 because it was the mid-point of the studied period and the loadings were close to the mean of the loadings of all the other waves and therefore most representative of the entire period. Because this applied score measures the same dietary pattern across time, it allows meaningful temporal comparisons. To estimate the scores with the procedure implemented by Mplus 6.1 (similar to the regression method, but with an iterative technique for categorical variables( Reference Muthén 22 )), we carried out a confirmatory factor analysis in each wave specifying the factor loadings and thresholds estimated from year 2000. Because thresholds are z-scores of the intake variables and they are used in the estimation of the scores, it is important that they are not year specific; therefore, we also fixed them to the estimates of year 2000.
Pearson's correlation coefficients of the factor scores between each pair of waves were computed to assess the tracking (maintenance of a relative position or rank over time) of each dietary pattern. Additionally, we estimated a single tracking coefficient for the entire period. In a longitudinal model, the regression of the value of the score of one wave is performed simultaneously against the scores of all the other waves; the coefficient is standardised so that it can represent a correlation coefficient( Reference Twisk and Twisk 23 ). This coefficient can be interpreted as the average correlation between one wave and all the other waves. We first standardised the dietary pattern score independently in each wave and then used generalised estimating equations to account for the repeated measures (with an unstructured working correlation matrix and robust estimation of standard errors). Because the sample size was the largest in 2000, we performed the regression of the standardised dietary pattern scores of wave 2000 against the standardised dietary pattern scores of all the other waves. We tested for interactions of this tracking coefficient with sex, age, income and region. We present stratified results and specify when the P value of the interaction term is less than 0·10:
 $$\begin{eqnarray} Y _{ it } = \beta _{0} + \beta _{1} Y _{ it 2000} + \beta _{2} t + \beta _{3} X _{ it } + \beta _{4} Y _{ it 2000}\times X _{ it } + \varepsilon _{ it }, \end{eqnarray}$$
where Y it is the standardised dietary pattern score for subject i at wave t (1991, 1993, 1997, 2004, 2006 and/or 2009), Y it2000 is the standardised dietary pattern score for subject i at wave 2000, β1 is the tracking coefficient and X is sex, age, income or region.
We computed factor score means over time, adjusted by age and region, to examine trends in each dietary pattern. Finally, multiple linear regressions with each factor score as the outcome and sociodemographic variables as the predictors were carried out independently in each wave; the clustering at the household level was accounted for in the estimation of the variance. Except for the factor analysis, all the other analyses were conducted in Stata 12.1 (StataCorp).
Sensitivity analysis
To corroborate that the dietary patterns obtained during each wave were not affected by the sample changes in geographical region and age, we computed inverse probability weights and included them in the factor analysis. We fitted two logistic regressions: one to predict the probability of being in each wave and the other to predict the probability of being in each wave conditional on region and age in 1991. Then, stabilised weights were estimated as the ratio of these two probabilities. The application of these weights is an alternative to standardisation( Reference Hernán and Robins 24 ). We found that the dietary patterns were very similar to those that we found in our original analysis; the difference between the factor loadings of the two analyses was below 0·08 in all the food groups. Similarly, to assess whether changes in energy intake over time affected the dietary patterns, we created inverse probability weights to standardise the patterns by total energy intake in addition to region and age. We found that this standardisation did not affect the composition of the dietary patterns meaningfully.
In addition, because subjects belonging to the same household were more likely to consume the same type of food groups, we repeated the analysis using only a single member per household (selected randomly; n 4837). We found that the dietary patterns did not change meaningfully; all the loadings had a difference below 0·08. Also, the correlation coefficients between the scores remained basically unchanged (all the differences in the coefficients were below 0·03).
Results
There was a dramatic increase in the prevalence of overweight from 1991 to 2009 and in the proportion of subjects classified as medium- and high-income earners over the same period, which paralleled changes in urbanisation. The proportion of male smokers declined over time and that of female smokers remained low (Table 1).
General characteristics of the study sample by wave* (Mean values with their standard errors and percentages)
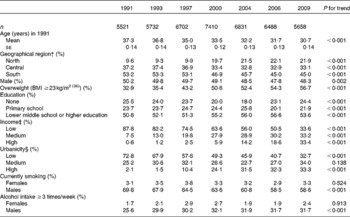
* All variables (except age in 1991 and geographical region) were adjusted by age in 1991 and geographical region.
† North, Heilongjiang and Liaoning provinces; Central, Shandong, Henan and Jiangsu provinces; South, Hubei, Guizhou, Hunan and Guangxi provinces.
‡ Estimated from per capita household income inflated to 2009, categories based on the cut-off values of tertiles in 2009.
§ Estimated from urbanicity index, a multi-component scale that considers population density, economic activity, modern markets, transportation, etc.( Reference Jones-Smith and Popkin 37 ), categories based on the cut-off values of tertiles in 2009.
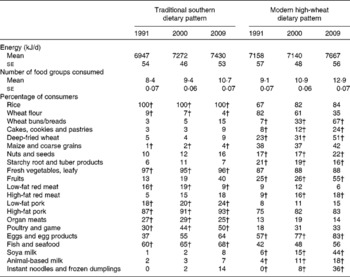
The mean total energy intake increased by 267 kJ/d (64 kcal/d) from 1991 to 2009 (Table 2). In general, it can be seen that dietary diversity increased over time, the mean number of food groups consumed increased over time and, for most of the food groups, the percentage of consumers also increased. The only food groups with a decline in the percentage of consumers from 1991 to 2009 were wheat flour, dried legumes, pickled/salted/canned vegetables and low-fat red meat. In contrast, starchy root/tuber products, fresh leafy vegetables, dried vegetables and organ meats had a stable percentage of consumers over time (difference ≤ 1 point between 1991 and 2009). In addition, for all the food groups that had an increase in the percentage of consumers, there was also an increase in the amounts consumed (g/capita), except for rice, maize/coarse grains and starchy roots/tubers, for which even if the percentage of consumers increased, the g/capita actually decreased over time (data not shown).
Energy intake, number of food groups consumed and percentage of consumers for different food groups by wave* (Mean values with their standard errors and percentages)
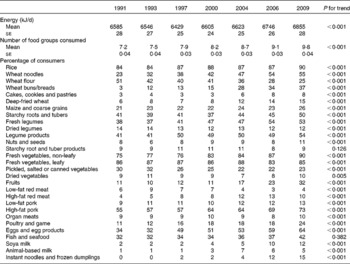
* All variables were adjusted by age in 1991 and region; data for food groups with ≤ 5 % of consumers in all the waves are not reported.
The following food groups had ≤ 5 % of consumers in all the waves (data not shown): deep-fried rice/legumes; dried fruits; preserved fruits with added sugar; seaweed; processed meats; dairy products; sweetened dairy products; Western-style fast foods; salty snacks; ready-to-eat cereals/porridge; sugar-sweetened beverages; low-energy beverages. Overall, these modern-type foods, over a 3 d period, were not yet widely consumed by 2009.
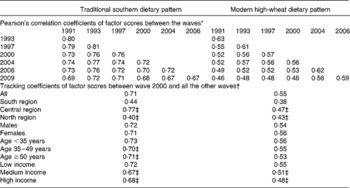
Using factor analysis for a total of twenty-nine food groups (excluding food groups with ≤ 5 % of consumers), we identified two dietary patterns, which we called ‘traditional southern’ and ‘modern high-wheat’ dietary patterns. These dietary patterns, despite the increase in dietary diversity, remained fairly similar (Table 3). The coefficient of congruence between each pair of waves was generally higher than 0·84, and it was below this value only between 1991 and 2009, 1993 and 2009, and 1997 and 2009 for the traditional southern dietary pattern (0·74, 0·78 and 0·81, respectively) and between 1991 and 2006 and 1991 and 2009 for the modern high-wheat dietary pattern (0·80 and 0·80, respectively) (data not shown). The coefficients of congruence between each wave and wave 2000 are given in Table 3. Across time, the traditional southern dietary pattern was positively associated with the intake of rice, fresh leafy vegetables, low-fat red meat, low-fat and high-fat pork, organ meats, poultry and fish/seafood and inversely associated with that of wheat flour and maize/coarse grains. Interestingly, the factor loadings of rice, wheat flour and maize/coarse grains markedly declined over time, which was not related to the percentage of consumers (as described above, of these food groups, only wheat flour had a decrease in the percentage of consumers). These decreases in the factor loadings indicate that the influence or importance of these food groups in the traditional southern dietary pattern was decreasing over time. The modern high-wheat dietary pattern was positively associated, across time, with the intake of wheat buns/breads, cakes/cookies/pastries, deep-fried wheat, nuts/seeds, starchy root/tuber products, fruits, eggs/egg products, soya milk and animal-based milk. In the earlier years, this pattern was associated with the intake of high-fat red meat, high-fat pork, organ meats and poultry/game. In 1991 and 1993, there were no consumers of instant noodles/frozen dumplings, so this food group was not included in the factor analysis during these years, but when these foods began to be consumed in 1997, they became prominent in the modern high-wheat dietary pattern.
Factor loadings for dietary patterns derived with exploratory factor analysis during each wave*
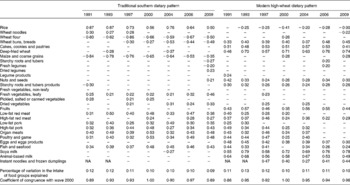
NA; not applicable.
* Loadings < |0.20| are not shown; for a table with all loadings, see Table S2 (available online).
Because overall we found a similarity between dietary pattern structures over time, we computed applied scores, and hence the rest of the results refer to these applied scores. The tracking coefficient of factor scores between wave 2000 and all the other waves was considerably higher for the traditional southern dietary pattern than for the modern high-wheat dietary pattern (0·71 v. 0·55, respectively; Table 4). This means that the tracking of the traditional southern dietary pattern was higher or, in other words, that individuals strongly maintained their relative position over time. However, the tracking of the traditional southern dietary pattern decreased over time; between 1991 and 1993, Pearson's correlation coefficient was 0·79, whereas in more recent years, with a similar 2-year or 3-year interval in between, the correlations were lower (0·71 in 2004–6 and 0·67 in 2006–9). Interestingly, we found that the tracking varied importantly by sociodemographic variables. The tracking was much higher in the Central region, particularly for the traditional southern dietary pattern. The tracking coefficient was also slightly higher among the younger subjects (traditional southern dietary pattern) and those with lower income (both the dietary patterns), whereas it did not vary by sex.
Tracking of dietary patterns
* Pearson's correlation coefficients were estimated for all the available subjects for each pair of waves; therefore, sample size for each coefficient is different. Sample size ranges from n 2888 (1991–9) to n 5884 (2000–4).
† Sample size: n 7410.
‡ P for interaction term < 0·10.
The mean dietary pattern score increased over time for both the dietary patterns; however, the slope was considerably higher for the modern high-wheat dietary pattern (Fig. 1(a)). To understand how much of the increase in the scores of both the dietary patterns was related to the increase in dietary diversity, we adjusted the scores by the number of food groups consumed (Fig. 1(b)). After adjustment, the traditional southern dietary pattern had a flat trend over time and the modern high-wheat dietary pattern had only a slight increase in trend. This means that for the modern high-wheat dietary pattern, to increase the score while holding the number of food groups constant, individuals were either substituting other foods with food groups related to this pattern or consuming higher amounts of these foods.
Mean factor scores over time. (a) Adjusted by geographical region and age in 1991. (b) Additionally adjusted by the number of food groups consumed. Difference between slopes was statistically significant (P< 0·01) in both (a) and (b). ○, Traditional southern; ●, Modern high-wheat.
To examine how the trends in scores were translated into changes in dietary intake, we estimated the percentage of consumers among those in the fourth highest quartile of the scores in each dietary pattern in each wave (Table 5). The trends in consumption observed in the entire sample (i.e. increases in the consumption of most of the food groups) were equally found in subjects with high scores for either pattern. However, the increase in the percentage of consumers of the food groups positively related to the modern high-wheat dietary pattern, among the followers of this pattern, was dramatic. For example, from 1991 to 2009, the intake of wheat buns/breads increased from 7 to 67 %; cakes/cookies/pastries from 8 to 24 %; deep-fried wheat from 23 to 51 %; fruits from 25 to 55 %; soya milk from 6 to 44 %; and instant noodles/frozen dumplings from 0 to 36 %. This large increase in the consumption of key food groups associated with the modern high-wheat dietary pattern can explain the upward trend observed in the scores of this pattern. Although we only present data for food groups relevant for the dietary patterns in Table 5, we also examined food groups excluded from the dietary pattern analysis due to a low proportion of consumers (not shown); we found that none of these food groups had a higher percentage of consumers in one of the dietary patterns, with the exception of deep-fried rice/legumes (5–6 % of consumers in the fourth highest quartile in the traditional southern dietary pattern v. 1–2 % of consumers in the modern high-wheat dietary pattern).
Energy intake, number of food groups consumed and percentage of consumers for relevant food groups, among those in the fourth highest quartile of the factor scores in each dietary pattern and year* (Mean values with their standard errors and percentages)
* All variables were adjusted by age in 1991 and region.
† Percentage of consumers for relevant food groups in each dietary pattern (loadings ≥ |0·20| in all the waves); percentage of consumers for food groups not relevant for any dietary pattern are not reported.
Finally, we ran multiple linear regressions in each wave and examined how sociodemographic factors were related to the traditional southern and modern high-wheat dietary patterns (Table 6). Geographical region was strongly associated with the traditional southern dietary pattern, with lower scores observed in the Central and North regions than in the South region. Interestingly, the difference in scores between the regions decreased over time, mainly due to a slight increase over time in the scores in the North and Central regions and a slight decrease in the scores in the South region. Urbanicity was strongly associated with the modern high-wheat dietary pattern, with higher scores being obtained for those living in more urbanised areas. Males had a slightly higher score for the traditional southern dietary pattern and slightly lower score for the modern high-wheat dietary pattern than females. Higher education, income and urbanicity levels, and alcohol intake were associated with higher scores in both the dietary patterns; however, the strength of the association decreased over time. Adjusting by the number of food groups consumed did not affect the estimates, although differences for education, income and urbanicity levels were largely attenuated (data not shown).
Factor score differences by sample characteristics in each wave
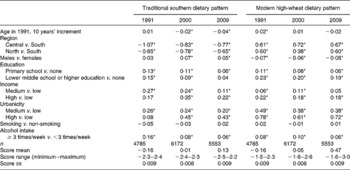
* P< 0·05; score differences based on a multiple linear regression that included all the variables reported in the table.
Discussion
In the present longitudinal study that analysed dietary data collected in seven waves over the course of 18 years (from 1991 to 2009), we derived two dietary patterns using factor analysis: a traditional southern dietary pattern characterised by rice, vegetables, meat, poultry and fish and a modern high-wheat dietary pattern characterised by wheat products, nuts, fruits, eggs, milk and instant noodles/frozen dumplings. Despite the rapid increase in dietary diversity, the structure of these two dietary patterns remained stable over time, meaning that the type of foods that the population chose to eat in combination had not changed. However, compared with those of the traditional southern dietary pattern, the scores of the modern high-wheat dietary pattern exhibited lower tracking and had a steeper upward trend over time, indicating that this pattern is more dynamic and is becoming more popular over time. Higher education, income and urbanicity levels were related to higher scores in both the dietary patterns, but the difference in dietary pattern scores between these socio-economic groups became smaller over time, reflecting that foods belonging to this dietary pattern are being consumed more widely.
Although this is the first study to assess longitudinal trends in dietary patterns over time in China, previous studies have analysed dietary patterns at one time point. Although our findings differ from those of studies carried out in specific urban areas, such as Shanghai( Reference Zhang, Tan and Dai 25 – Reference Cai, Zheng and Xiang 28 ), they are most similar to findings of surveys of nationally representative samples, such as the China National Nutrition and Health Survey. Previously identified patterns are the ‘Yellow Earth’ or ‘traditional northern’ pattern high in wheat products, maize or sorghum and tubers; the ‘green water’ or ‘traditional southern’ pattern high in rice, vegetables, seafood, pork and poultry; and the ‘Western’ pattern high in beef, fruits, eggs, poultry, seafood, tofu, milk, cakes, fruit juice, beverages and nuts( Reference Li, He and Lai 11 , Reference Zhang, Dagevos and He 12 ). Our ‘traditional southern’ dietary pattern is comparable to the one previously described. However, our ‘modern high-wheat’ dietary pattern could be considered as a combination of the ‘traditional northern’ and ‘Western’ dietary patterns that these previous studies have found. This is reasonable because even in these studies, a considerably high intake of wheat, fried wheat and other cereals was observed in the ‘Western’ dietary pattern. In addition, in the Jiangsu Province, a pattern similar to our ‘modern high-wheat’ dietary pattern was found, in which the Western-type pattern was also related to the intake of fried wheat and cakes( Reference Zuo, Shi and Yuan 29 ). Taken together, it is clear that the regional tradition and availability of wheat in the North region and of rice in the South region are still the main drivers of food selection in the Chinese population. It is interesting that wheat patterns are more likely characterised by the intake of more varied and Western-type foods. Possibly, compared with rice, there is a wider range of foods that can be prepared with wheat, and a wider range of foods that can accompany a wheat-based food, therefore facilitating the incorporation of new foods in the dietary patterns of subjects used to consuming wheat.
Even if the general structure of both the dietary patterns remained stable over time, the tracking or, in other words, the stability of the relative position of each subject's factor score between time points was higher for the traditional southern dietary pattern than for the modern high-wheat dietary pattern, particularly in the South and Central regions. This finding is comparable to that of a study carried out in Japan( Reference Nanri, Shimazu and Ishihara 30 ), where among the prudent, traditional and Westernised patterns, the traditional dietary pattern had the highest tracking among men. The degree of tracking that we found for the traditional southern dietary pattern in the entire sample was remarkably high; the correlation coefficient of scores obtained 18 years apart (1991–2009) was 0·68, which is similar to what other studies carried out in the USA( Reference Hu, Rimm and Smith-Warner 31 ), Sweden( Reference Khani, Ye and Terry 32 ) and Japan( Reference Nanri, Shimazu and Ishihara 30 ) have found but in only 1 year apart (0·56–0·77). In studies carried out 4 or 10 years apart in England( Reference Northstone and Emmett 20 ) and Sweden( Reference Newby, Weismayer and Akesson 33 ), correlation coefficients have been found to be about 0·30–0·52. It is possible that the tracking was lower for the modern high-wheat dietary pattern because of the introduction of new food groups (e.g. instant noodles/frozen dumplings) and/or rapid increase in the intake of the food groups associated with this dietary pattern. It is worth noting that the high tracking of the traditional southern dietary pattern was actually driven by the Central region, whereas the South and North regions had tracking coefficients comparable to those of the modern high-wheat dietary pattern. The Central region had the lowest level of adherence to the traditional southern dietary pattern and the highest level of adherence to the modern high-wheat dietary pattern, and still it was the region with the highest degree of tracking for both the dietary patterns. Further research could explore why the stability of the dietary patterns is higher in this region.
In the present study, we confirmed that the increase in dietary diversity previously observed in 1989–97( Reference Popkin, Lu and Zhai 5 ) is a phenomenon still going on through 2009. Factor scores would be affected by dietary diversity, because they are similar to a weighted sum of several food groups, so with the exception of food groups with negative loadings, it is expected that the higher the number of food groups consumed, to a lesser or greater extent, the higher the factor scores. Therefore, in the context of increasing dietary diversity, the absolute factor score trend over time represents the degree of adherence to a certain dietary pattern as well as the overall number of food groups consumed. An alternative is to adjust by the number of food groups consumed, because the only way to increase the factor score while holding the number of food groups consumed constant is to substitute with food groups related to the dietary pattern and/or to increase the amount consumed of these food groups. The present results indicate that in comparison with those of the traditional southern dietary pattern, the factor scores of the modern high-wheat dietary pattern increased significantly over time and, that even after adjusting by the number of food groups consumed, these scores exhibited an upward trend. A clear indication of this trend is the remarkable changes in the diets of those following this pattern (subjects with scores in the highest quartile of their year); although the increase in the intake of food groups such as fruits and soya milk is beneficial, the sharp increase in that of items such as cakes/cookies/pastries, deep-fried wheat or instant noodles is worrisome. Indeed, the adherence to this dietary pattern might be associated with overweight and obesity; we found that for the entire follow-up period, one unit increase in the modern high-wheat dietary pattern was associated with a BMI ≥ 23 kg/m2 (OR 1·27, 95 % CI 1·24, 1·30), whereas that in the traditional southern dietary pattern was inversely associated (OR 0·94, 95 % CI 0·92, 0·97) (data not shown). In addition, it is of public health importance that with time, food groups of the modern high-wheat dietary pattern seem to be becoming more available to all urban/rural, income and education groups.
The key strength of the present study is the several repeated measures of diet in the same subjects, which allowed us to assess for the first time the stability and tracking of dietary patterns in the Chinese population. Although there were changes in the study sample because of there being subjects without complete dietary data in all the seven waves, we believe that our comparisons between years were not affected by this, not only because all the subjects were included in at least three waves but also because we adjusted all the results by age and geographical region.
A limitation of the present study is that dietary assessment captured dietary intake for only three consecutive days. Although the advantages of this method are important because dietary assessment is very detailed and precise, and the same method can remain constant over time, a disadvantage is that the intake of important food groups that are still only episodically consumed in this country could not be captured. Items such as dairy products, candies/other high-sugar foods, Western-style fast foods, salty snacks or sugar-sweetened beverages had a very low proportion of consumers in a 3 d period and hence we were not able to include these in the factor analysis. Therefore, we do not exclude the possibility that a new, separate Western pattern emerged within the studied period and we were not able to identify it.
In line with this, another important limitation common to all the countries is that the number of foods available in the food supply exceeds by far the number of those available in food composition tables. In the USA, for example, there are over 85 000 uniquely formulated products in the food system, whereas national food composition tables only have about 7600 unique foods( Reference Ng and Popkin 34 ). The fastest growth in supermarkets occurs in China than in other countries( Reference Hu, Reardon and Rozelle 35 ), and the present study, because of the inability to keep up with the rapidly changing food supply landscape, was unable to capture all the changes in dietary intake, particularly of processed packaged foods. In addition, in the present study, dietary assessment focused on the measurement of foods at the ingredient level and not at the dish level, and this is very advantageous because recipes vary considerably between households( Reference Popkin, Lu and Zhai 5 ) and few mixed dishes are available in the Chinese food composition table; however, we missed this important behavioural aspect of diet, and important changes in dish selection might be going on.
In summary, to the best of our knowledge, this is the first study to assess the stability and tracking over time of dietary patterns in the Chinese population. We found that the way foods are eaten in combination has not changed much between 1991 and 2009. The degree of adherence to a traditional southern dietary pattern has remained unchanged, and there is remarkable inter-individual consistency in the Central region in the intake of foods related to this pattern. On the other hand, the modern high-wheat dietary pattern has become more prominent in the population, and there is more within-subject variation in the adherence level. The trend observed for this modern high-wheat dietary pattern may as well reflect the global influence and economic rise in the last few decades in China. Close attention should be paid to this pattern because it is associated with many energy-dense foods that may affect diet quality. So far, the northern part of the country and subjects with better socio-economic position or in urban areas are more prone to follow this pattern, but it seems that the reach of this pattern is extending towards the general population. A willingness to diversify dietary intake and increase the intake of equally healthful foods such as fruits was evident among the followers of this modern high-wheat dietary pattern; therefore, a great opportunity also lies in the promotion of healthy foods and in the efforts to increase their intake in this population.
Supplementary material
To view supplementary material for this article, please visit http://dx.doi.org/10.1017/S0007114513003917
Acknowledgements
The authors thank the National Institute of Nutrition and Food Safety, Chinese Center for Disease Control and Prevention, the Carolina Population Center, the UNC-CH and all the people involved in the CHNS. They also thank Bo Qin for her helpful comments on the manuscript, Ms Frances L. Dancy for her administrative assistance and Mr Daniel Blanchette for his exceptional programming assistance.
The present study received funding from the NIH (R01-HD30880, DK056350, R24 HD050924, R01-HD38700 and R01-HL108427) and the Fogarty International Center. The NIH provided financial support for the collection of CHNS data from 1989 to 2011. C. B. was supported by a scholarship from the Mexican council Consejo Nacional para la Ciencia y Tecnologia (CONACYT). None of the funders, NIH, Forgarty International Center and CONACYT, had any role in the design and analysis of the study or in the writing of this article.
The authors' contributions are as follows: C. B. designed and conducted the analyses and wrote the manuscript; D. S.-A., P. G.-L, M. A. M, L. A. and B. P. contributed to the interpretation of the data and reviewed the manuscript.
None of the authors has any conflicts of interest to declare.


