





Highlights
-
• Cognate facilitation in L3 in a semantic task can occur through the L1, the L2 or both.
-
• Cognate facilitation remained stable and comparable for three consecutive years.
-
• Increases in source-language proficiency do not necessarily lead to increases in cross-language influences from that language.
1. Introduction
A consistent finding in the field of multilingualism is the non-selective nature of lexical access. Specifically, among bilinguals and multilinguals, the activation of alternatives from all languages occurs when producing and recognizing words in a single language (Kroll et al., Reference Kroll, Gullifer and Rossi2013), including in languages that do not share orthography (Allen et al., Reference Allen, Conklin and Miwa2021; Degani et al., Reference Degani, Prior and Hajajra2018; Miwa et al., Reference Miwa, Dijkstra, Bolger and Baayen2014). In this work, we examine the stability of such cross-language activation in trilinguals, specifically as a function of changes in proficiency.
1.1. Cross-language activation
Cross-language activation is often measured by the cognate facilitation effect in which cognate words, sharing form and meaning across two (or more) languages (e.g., the word “dolphin” is shared across Arabic /dolfi:n/, Hebrew /dolfi:n/ and English /dɒlfɪn/), are processed faster and more accurately compared to words that do not share form or meaning. Models such as the Bilingual Interactive Activation (BIA) model, the BIA+ model (Dijkstra & Van Heuven, Reference Dijkstra, Van Heuven, Grainger and Jacobs1998, Reference Dijkstra and Van Heuven2002) and the Multilink model (Dijkstra et al., Reference Dijkstra, Wahl, Buytenhuijs, Van Halem, Al-Jibouri, De Korte and Rekké2019) postulate cross-language activation, which is mostly mediated through orthographic overlap across languages. These models can easily explain observed cognate facilitation effects in same-script bilinguals (Dijkstra et al., Reference Dijkstra, Miwa, Brummelhuis, Sappelli and Baayen2010) and same-script trilinguals (Lemhöfer et al., Reference Lemhöfer, Dijkstra and Michel2004; Szubko-Sitarek, Reference Szubko-Sitarek2011). However, cognate facilitation effects have also been observed in different-script bilinguals (Allen et al., Reference Allen, Conklin and Miwa2021; Degani et al., Reference Degani, Prior and Hajajra2018; Jiang, Reference Jiang2019; Miwa et al., Reference Miwa, Dijkstra, Bolger and Baayen2014) and recently in different-script trilinguals (Elias et al., Reference Elias, Van Hell, Prior and Degani2025). Such cognate facilitation among different-script multilinguals can only be the result of cross-language overlap in phonological representations (e.g., Dijkstra et al., Reference Dijkstra, Grainger and Van Heuven1999). Degani et al. (Reference Degani, Prior and Hajajra2018) observed cognate facilitation when different-script Arabic–Hebrew bilinguals performed a visual semantic relatedness task in Hebrew (their L2) in which primes could be cognate or noncognate control. Based on their findings, they proposed a bilingual model capturing the role of phonological overlap in cross-language activation. The model suggests that orthographic representations activate shared phonology, through which the semantic representations are accessed.
In our recent work, we examined whether these predictions can be extended to the case of different-script trilinguals (Elias et al., Reference Elias, Van Hell, Prior and Degani2025). In particular, we tested cognate facilitation in Arabic–Hebrew–English trilinguals across three different L3 (English) tasks. Whereas no cognate facilitation effect was observed in lexical decision (or in a sentence reading eye tracking task), a robust cognate effect was found in a semantic relatedness task, replicating the findings of Degani et al. (Reference Degani, Prior and Hajajra2018) with bilinguals. These results suggest that in the case of different-script multilinguals, cross-language activation is more prominent in tasks that require access to meaning, which cannot be performed solely on the basis of orthographic information. Interestingly, in that same study (Elias et al., Reference Elias, Van Hell, Prior and Degani2025), L3 (English) processing was facilitated by overlap with both Arabic and Hebrew (L1 and L2), and more importantly, the degree of facilitation was similar from the L1 and the L2 in the double cognate (L1–L3 and L2–L3 overlap) conditions, and in the triple cognate condition (L1–L2–L3 overlap). Such results provide evidence that both L1 and L2 representations are activated during L3 processing (cf. Kroll et al., Reference Kroll, Gullifer and Rossi2013, see also Sherkina, Reference Sherkina2003; Van Hell & Tanner, Reference Van Hell and Tanner2012).
The current study continues this line of research by asking how stable these findings are across different timepoints in trilinguals’ language development and specifically following changes in proficiency. Cross-language influences may be modulated by the level of activation of representations in each language (e.g., sub-lexical and lexical representations, Degani et al., Reference Degani, Prior and Hajajra2018; see also Elias et al., Reference Elias, Van Hell, Prior and Degani2025), which in turn is believed to be modulated by language proficiency (Duñabeitia et al., Reference Duñabeitia, Perea and Carreiras2009). Thus, within the framework of the BIA/BIA+ models, word nodes in more proficient languages have higher resting-activation levels than those in less proficient languages, rendering them more accessible and more easily activated. Hence, the degree of cross-language activation may vary as a function of language proficiency.
1.2. Language proficiency and cross-language activation
Language proficiency is a complex multidimensional construct that includes linguistic abilities spanning both comprehension and production (De Bruin, Reference De Bruin2019). Importantly, proficiency modulates cross-language activation such that greater nontarget language activation (resulting in stronger cognate facilitation) is observed when bilinguals perform a task in the less proficient language (for a review, see Van Hell & Tanner, Reference Van Hell and Tanner2012). Specifically, among bilinguals, a greater imbalance between language proficiencies leads to stronger activation of the more proficient language in comparison to the less proficient language, resulting in stronger cross-language activation when bilinguals perform the task in the less proficient language. For instance, using a naming task, Rosselli et al. (Reference Rosselli, Ardila, Jurado and Salvatierra2014) found similar cognate effects in both languages for balanced English-Spanish bilinguals, but a more pronounced effect in the less proficient language of unbalanced bilinguals. Moreover, as proficiency in the target language increases, the cognate effect decreases (Bultena et al., Reference Bultena, Dijkstra and Van Hell2014; Nativ et al., Reference Nativ, Nov, Ordan, Wintner and Prior2024). In a study conducted by Nativ et al. (Reference Nativ, Nov, Ordan, Wintner and Prior2024), bilinguals with higher L2 proficiency tended to use fewer cognates in spontaneous L2 writing than less proficient bilinguals, suggesting again reduced cross-language influences in a more proficient language. Similarly, utilizing a sentence reading eye tracking paradigm in L2, Dutch–English bilinguals who rated their L2 reading proficiency as higher showed weaker cognate facilitation effects (Bultena et al., Reference Bultena, Dijkstra and Van Hell2014). Vargas and García Mayo (Reference Vargas and García Mayo2022) found a similar pattern for Tagalog-English early bilinguals with Spanish L3 in a written production task in their L3, whereby improvement in L3 proficiency resulted in decreased cross-language influences.
The studies reviewed above focused on changes in proficiency in the less proficient language of bilingual speakers. In most of these studies, that language was deemed the target language of the task, such that increases in target language proficiency were associated with weaker cognate effects. A smaller number of studies also examined cross-language activation when the less proficient language is the nontarget language. For instance, Van Hell and Dijkstra (Reference Van Hell and Dijkstra2002) tested Dutch–English–French trilinguals and found influence from L3 French on L1 Dutch processing only among participants who were relatively more proficient in L3 French (though L2 affected L1 processing across all participants). Further, Brenders et al. (Reference Brenders, Van Hell and Dijkstra2011) did not find cognate facilitation from L2 on L1 in younger, less proficient L2 learners. These findings suggest that a minimal proficiency level in the weaker (source) language appears to be necessary for the cognate facilitation to occur (Lago et al., Reference Lago, Mosca and Stutter Garcia2021; Van Hell et al., Reference Van Hell, Donnelly Adams, Abdollahi, Darquennes, Salmons and Vandenbussche2019; Van Hell & Dijkstra, Reference Van Hell and Dijkstra2002; van Hell & Tanner, Reference Van Hell and Tanner2012).
Interestingly, in the case of bilinguals, any expected changes in proficiency would most likely be improvements in the L2. Such a change would result in reduced proficiency imbalance between the L1 and L2 (see the Bilingual Index Score, Gollan et al., Reference Gollan, Weissberger, Runnqvist, Montoya and Cera2012), leading to a similar magnitude of cross-language activation in both languages. In trilinguals and multilinguals, however, the interactions among the proficiencies in the three (or more) languages of the speaker may be more complex, and these may further modulate cross-language activation. Specifically, whereas in most cases trilinguals’ L1 proficiency is not expected to change, the L2 or the L3 proficiencies, or both, may improve. To date, there is only scant empirical evidence on cross-language activation across L2 and L3 in the lexical domain, and even fewer studies examine the impact of changes in proficiency on such activation.
Lemhöfer et al. (Reference Lemhöfer, Dijkstra and Michel2004) and Szubko-Sitarek (Reference Szubko-Sitarek2011) demonstrated cognate facilitation using L1–L3 double cognates and L1–L2–L3 triple cognates among Dutch–English–German and Polish–English–German trilinguals, respectively, who performed a lexical decision task in their L3. In both studies, the effect was more pronounced for the triple cognates. Lijewska and De Louw (Reference Lijewska and de Louw2024) had Polish–English–Dutch trilinguals perform a lexical decision task in their L3 and observed cognate facilitation in the L2–L3 double cognate and in triple cognate conditions (only in RTs), suggesting L2 cross-language activation during L3 processing. Surprisingly, in that study, there was no evidence for L1 activation as the effect was not statistically significant for L1–L3 double cognates. Other evidence for the effect of L2 in L3 processing comes from the two same-script languages of trilinguals whose L1 had a different script. Specifically, Zhu and Mok (Reference Zhu and Mok2020) used L2–L3 double cognates and demonstrated the presence of cognate facilitation from English (L2) to German (L3) among Cantonese–English–German unbalanced trilinguals (with beginner to intermediate proficiency in German) when performing a lexical decision task in their L3 (German), but only when the stimuli list included interlingual homographs.
While demonstrating robust cognate effects in trilinguals, these studies did not directly test the influence of L2 and L3 proficiency on cross-language activation. Recently, Foryś-Nogala et al. (Reference Foryś-Nogala, Silva, Ambroziak, Broniś, Janczarska, Jastrzębski and Otwinowska2025) tested Polish–English–Italian trilinguals in both a vocabulary knowledge scale and lexical decision in the L3. When testing the effect of proficiency on performance in the L3 lexical decision task, they observed that better L2 proficiency boosted the recognition accuracy of L2–L3 double cognates but not of L1–L2–L3 triple cognates or noncognates. At the same time, the cognate effect was not modulated by L3 proficiency. The current study aimed to extend the existing research by testing different-script trilinguals and directly asking how changes in L2 and L3 proficiency within the same speakers might affect cross-language activation when processing the L3. In this study, we used a large battery of objective and subjective measures to thoroughly assess changes in proficiency and proficiency balance among trilinguals.
1.3. The current study
The current study focuses on how lexical cross-language activation is modulated by changes in language proficiency (Van Hell & Tanner, Reference Van Hell and Tanner2012). In a longitudinal design, Arabic–Hebrew–English trilingual university students performed a semantic relatedness task in their L3, across 3 years of their university studies. We focused on the semantic relatedness task, which requires activation of shared semantics through shared phonology because our previous work demonstrated robust cognate facilitation effects in this task for the population of trilinguals we targeted (Elias et al., Reference Elias, Van Hell, Prior and Degani2025).
The focus of the current study is on the possible impact of changes in proficiency over time as well as individual differences in language proficiency, on cross-language activation. To capture proficiency, participants completed objective and subjective linguistic tasks in their L1, L2 and L3 at all three time points. Because these trilinguals were immersed in an L2 (Hebrew) speaking environment (the language of instruction at the university) and were gradually more heavily exposed to the L3 (English) during their academic studies, we expected to observe increasing proficiency in the L2 (one of the source languages), and a possible improvement in L3 proficiency (the target language) throughout their academic studies. Thus, tracking participants over time allowed us to tap into potential changes in proficiency balance across the three languages and its possible modulation of cross-language activation.
With this longitudinal design, we aimed to answer two main questions: (1) Does the cognate facilitation effect replicate across time among different-script trilinguals? (2) To what extent do participants’ L2 and L3 proficiencies, which might undergo changes due to immersion in the academic environment, affect L3 lexical processing? Specifically, because our study includes cognates which differ in their overlap across languages (L1–L3; L2–L3; L1–L2–L3 triple cognates), and at the first time point cognate facilitation was equivalent across these item types (reported in Elias et al., Reference Elias, Van Hell, Prior and Degani2025), we examine whether changes in L2 and L3 proficiencies may differentially affect processing of these items.
Different predictions can be drawn with respect to changes in L2 and L3 proficiencies. In particular, increases in L3 (target-language) proficiency are expected to attenuate the cognate facilitation effect overall, across all item types (Rosselli et al., Reference Rosselli, Ardila, Jurado and Salvatierra2014; Van Hell & Tanner, Reference Van Hell and Tanner2012). Complementarily, with respect to L2 proficiency, there are two alternative outcomes. First, increases in L2 (source-language) proficiency would lead to stronger cognate effects only for items that overlap across the L2 and the L3 (namely, L2–L3 and L1–L2–L3 cognate items). Second, it is possible that these adult trilinguals are already sufficiently proficient in L2 at Time 1, such that irrespective of further changes in L2 proficiency across the 3 years, comparable cognate effects would be observed across time. The current design allows us to examine these potential proficiency modulations simultaneously.
2. Method
The participants who took part in the current study were a subset of those reported in Elias et al. (Reference Elias, Van Hell, Prior and Degani2025), which described data from a single timepoint (Time 1) during participants’ first year of academic studies. In this study, we focused on participants who completed all three timepoints of this study, namely those tested during their first (Time 1), second (Time 2), and third (Time 3) year of academic studies, and for whom measures of proficiency are available across the three timepoints.
2.1. Participants
For three consecutive years, 88 undergraduate students (13 males, 75 females, 4 left-handed, M age at Time 1 = 20.13, SD = 1.30) from a large academic institution in northern Israel, who were trilingual speakers of Arabic, Hebrew, and English, participated in this study. Their proficiency profile in all languages was predominantly the result of their social and educational context. Specifically, they were raised in Arabic-speaking communities and attended primary and secondary schools in which Arabic is the language of instruction, learned Hebrew and English through formal school instruction and were exposed to Hebrew to different extents, as this is the majority language spoken in the country. Of relevance, they were immersed in a Hebrew-speaking environment once they started their undergraduate studies. Previous research (Abbas et al., Reference Abbas, Degani and Prior2021; Degani et al., Reference Degani, Prior and Hajajra2018; Prior et al., Reference Prior, Degani, Awawdy, Yassin and Korem2017) indicates that this group is typically most proficient in Arabic (L1), followed by Hebrew (L2), with English (L3) being their least proficient language. However, each participant’s proficiency profile was determined using objective and subjective measures, administered at each time point of testing as some inter-individual variation is expected. None of the participants had attention disorders or learning disabilities, and they received either course credit or payment for their participation in the study after signing an informed consent for their participation. All the reported procedures were approved by the IRB of the University of Haifa.
2.2. Stimuli
2.2.1. Experimental cross-language activation task – semantic relatedness judgment
The stimuli used here are identical to those described in Elias et al. (Reference Elias, Van Hell, Prior and Degani2025) (All data are available in the Open Science Framework at https://osf.io/kuxwe/?view_only=29c73886e1834fffbe0d4639b7efbcd0). One hundred and sixty-eight prime-target pairs were included in the task. In particular, 84 cognate words were identified by two Arabic–Hebrew–English trilinguals, in three different conditions; 28 Arabic–English double cognates (L1–L3), 28 Hebrew–English double cognates (L2–L3) and 28 Arabic–Hebrew–English triple cognates (L1–L2–L3) (see Table 1 for examples). With a large sample of 88 participants, this provides sufficient data points per condition to support statistical power, following the recommendations of Brysbaert and Stevens (Reference Brysbaert and Stevens2018; for additional details see Elias et al., Reference Elias, Van Hell, Prior and Degani2025). Cognate words were matched across the three conditions on English length in letters (F(2, 81) = 1.60, MSE = 5.73, p = .21), and bigram frequency (F(2, 81) = 2.98, MSE = 0.00, p = .86) (Balota et al., Reference Balota, Yap, Hutchison, Cortese, Kessler, Loftis, Neely, Nelson, Simpson and Treiman2007; Marian et al., Reference Marian, Bartolotti, Chabal and Shook2012), but there was a marginal difference in Subtlex written frequency (F(2, 81) = 2.98, MSE = 0.66, p = .06), and significant differences in orthographic (F(2, 81) = 3.41, MSE = 65.59, p = .04) and phonological (F(2, 81) = 2.62, MSE = 196.84, p = .08) neighborhoods (Balota et al., Reference Balota, Yap, Hutchison, Cortese, Kessler, Loftis, Neely, Nelson, Simpson and Treiman2007; Marian et al., Reference Marian, Bartolotti, Chabal and Shook2012). Thus, all of these control measures were included as covariates in the analyses. For the full list of stimuli and matching analysis, see Elias et al. (Reference Elias, Van Hell, Prior and Degani2025), https://osf.io/kuxwe/?view_only=29c73886e1834fffbe0d4639b7efbcd0).
Examples of the double and triple cognates

Table 1. Long description
The table consists of four columns and four rows.
Column headers from left to right are: Critical conditions, Arabic, Hebrew, and English.
Row 1: L 1 – L 3 double cognate.
- Arabic: / ka ʕ ki / cake
- Hebrew: / ʕ uga / cake
- English: / ke ɪ k / cake
Row 2: L 2 – L 3 double cognate.
- Arabic: / mo:z / banana
- Hebrew: / banana / banana
- English: / b ə n æ n ə / banana
Row 3: L 1 – L 2 – L 3 triple cognate.
- Arabic: / balo:n / balloon
- Hebrew: / balon / balloon
- English: / b ə lun / balloon
For each cognate prime, a semantically related target word, which does not overlap in form or meaning across languages, was chosen based on association strengths from the Small World of Words project datasets (De Deyne et al., Reference De Deyne, Navarro, Perfors, Brysbaert and Storms2019). A control prime, which did not share form or meaning across the languages but was semantically related to the target word, was selected from the same database. Cognate and control prime words were matched for association strength with the target words, based on the Small World of Words database (t < 1). Further, cognate and control prime words were matched both overall and within the different conditions (L1–L3 double cognates, L2–L3 double cognates and L1–L2–L3 triple cognates) on English length, Subtlex written frequency, orthographic and phonological neighborhoods, and bigram frequency (Balota et al., Reference Balota, Yap, Hutchison, Cortese, Kessler, Loftis, Neely, Nelson, Simpson and Treiman2007; Marian et al., Reference Marian, Bartolotti, Chabal and Shook2012). The 84 selected control words, along with the target words, were also matched across the cognate conditions using these same variables (see Elias et al., Reference Elias, Van Hell, Prior and Degani2025 for a detailed matching analyses). Lastly, 84 semantically unrelated pairs were added to allow 50% “No” responses in the task. Their targets matched the targets of the critical pairs both overall and within each cognate condition (F < 1).
Using two lists, we created two counterbalanced versions of the task, each consisting of 168 trials (see Appendix B in Elias et al., Reference Elias, Van Hell, Prior and Degani2025 for list composition and matching within each cognate condition). Importantly, each target word was paired with both cognate and control primes for different participants, but each participant encountered each target word only once at each time point.
2.3. Procedure
Each participant was randomly assigned one of the two versions at Time 1 and Time 3, and the other version at Time 2, administered via E-Prime software (Psychology Software Tools, Pittsburgh, PA). Participants were visually presented with English prime-target word pairs and were instructed to determine, using a button press, whether the words were semantically related or not. Instructions and stimuli were displayed on a gray background, using Times New Roman font at size 30. They first completed eight practice trials under the supervision of the experimenter to get familiarized with the task.
On each trial, a fixation cross was displayed for 2000 ms, followed by the prime word for 200 ms, then a blank screen for 50 ms, after which the target word appeared. Participants were asked to decide whether the two words were semantically related by pressing “yes” (up arrow) or “no” (down arrow) on the keyboard as quickly and accurately as possible. Target words remained on the screen until the participant’s response or for a maximum of 8 seconds, after which a fixation cross signaling the next trial appeared on the screen. The experiment consisted of four blocks of 42 trials each, with three short optional breaks in between.
2.3.1. Proficiency tasks and measures
Each participant completed a large battery of objective and subjective proficiency tasks at each timepoint of their undergraduate studies (first, second, and third year), as detailed below, to thoroughly assess changes in L1, L2 and L3 language proficiency. Tasks were administered in language blocks, such that each language block contained tasks in a specific language (Arabic, Hebrew and English), with timed breaks between blocks. All participants performed the language blocks in this same order.
Semantic fluency task (Gollan et al., Reference Gollan, Montoya and Werner2002; Kavé, Reference Kavé2005): Participants were asked to name as many words as they could in a given language within one minute, for each of two fixed semantic categories per language (clothing and kitchen utensils for English, occupations and furniture for Arabic and fruits and sports for Hebrew). The categories for each language were chosen based on previous norming studies to ensure comparability between the number of responses across the languages. The category name was visually presented on a computer screen, followed by an animation of an hourglass marking the time limit for the task (60 seconds per category).
The Shipley Institute of Living - Vocabulary scale (Shipley, Reference Shipley1940; Zachary, Reference Zachary1991): Participants completed a multiple-choice test in which they were presented with a target word and then decided, by button press, which of the four words is closest in meaning to the target word. They completed this task nonsequentially both in English and in Hebrew (which is adapted, but not translated, from English, Gilboa, Reference Gilboaunpublished).
Multilingual Naming Test (MINT) Sprint (Garcia & Gollan, Reference Garcia and Gollan2022; adapted from Gollan et al., Reference Gollan, Weissberger, Runnqvist, Montoya and Cera2012): Participants were requested to name 80 pictures in a given language (Arabic, Hebrew and English, based on the language block of the task). The pictures were presented in an array on the computer screen ordered such that their names are of decreasing frequency, and participants were requested to name all the pictures as quickly and as accurately as possible within a time limit of 3 minutes. They were then given the option to come back to skipped items, with no time limit.
Multilingual Language Background Questionnaire in Hebrew (Abbas et al., Reference Abbas, Degani, Elias, Prior and Silawi2024, based on LEAP-Q questionnaire by Marian et al., Reference Marian, Blumenfeld and Kaushanskaya2007 and LSBQ by Anderson et al., Reference Anderson, Mak, Chahi and Bialystok2018): This detailed language background questionnaire provided information regarding participants’ first, second and third language proficiencies, acquisition history and use patterns.
3. Results
3.1. Cross-language activation: analysis approach
Data were analyzed in several steps, starting with a preliminary analysis of each timepoint separately, followed by a longitudinal analysis including participants’ performance at all timepoints. To further understand performance across time, we explored the extent to which participants’ proficiency changed over time. We then included the proficiency measures reflecting these changes as potential modulators of performance.
Data were analyzed using linear mixed-effects models as implemented in the lme4 (Baayen et al., Reference Baayen, Davidson and Bates2008) and lmerTest packages (Kuznetsova et al., Reference Kuznetsova, Brockhoff and Christensen2017) in R (Version 4.0.3, R Core Team, 2020; Version 4.4.3, R Core Team, 2025). Our analyses focused on the Reaction Time (RT) data for three reasons. First, in most cases, the accuracy models (following a binomial distribution in logistic mixed-effect models) failed to converge. Second, in our previous work (Elias et al., Reference Elias, Van Hell, Prior and Degani2025), an unexpected Prime Type effect was present in the accuracy analysis among native English speakers who performed the same task with the same stimuli. Given the fact that those participants reported no exposure to Arabic or Hebrew, the effect limits the reliability of the accuracy analysis. Finally, most models of multilingual processing (e.g., BIA, Dijkstra & Van Heuven, Reference Dijkstra, Van Heuven, Grainger and Jacobs1998) predict facilitation in RTs but not necessarily in accuracy. Hence, the models reported in this section predict RT but not accuracy data, which are reported in Appendix A.
As a first step, trials with very short (below 300 ms) and extremely long (above 4000 ms) RTs were excluded from the analysis (3.08% of the data). RTs for correct responses were then log-transformed to reduce skew in distribution. In each model, Condition (L1–L3 double cognates, L2–L3 double cognates and L1–L2–L3 triple cognates, with L1–L3 set as the reference), Prime Type (critical and control, with control set as the reference) and their interactions were included as fixed effects. A maximal model was constructed, including by-participant and by-item intercepts, by-participant slope for Prime Type and Condition and by-item slope for Prime Type, as well as the fixed effects and normalized control variables (word length, written frequency, bigram frequency, orthographic and phonological neighborhood). In each analysis, the maximal model was submitted to the buildmer function in the buildmer package (v. 1.3, Voeten, Reference Voeten2019, as used in e.g., Johns & Steuck, Reference Johns and Steuck2021) in R, which uses the (g)lmer function from the lme4 package (see Elias et al., Reference Elias, Van Hell, Prior and Degani2025 for more details). Fixed effects of interest (Condition, Prime Type and proficiency measures when relevant as detailed below) were forced to be included in the selected model, using the “include” subcommand. The selected model was then refitted using (g)lmer, followed by the testInteractions function from the phia package (v. 0.2–1, Martinez, Reference Martinez2015) to probe interactions and examine pairwise comparisons when needed. Significance of main effects was derived from the anova function (due to the dummy coding of our variables, see Elias et al., Reference Elias, Van Hell, Prior and Degani2025). Means and standard errors (SE) were derived from the emmeans function (v. 1.5. 2–1, Lenth, Reference Lenth2020).
All data files and analysis files can be found on the OSF platform (https://osf.io/w94aj/?view_only=29dd6aac8ee745e8a0a35b61e9807213).
3.2. Separate timepoint analyses
To test the cognate facilitation effect throughout the academic years, we analyzed performance for each timepoint separately. Indeed, a significant Prime Type effect was observed across all three time points such that target words preceded by cognate primes were responded to significantly faster than those preceded by control primes (see Figure 1, Table 2, and Appendix A for full analysis). No other effects or interactions were significant.
Effects of prime type and condition on RT at Time 1 (A), Time 2 (B) and Time 3 (C).

Figure 1. Long description
The figure consists of three vertically stacked boxplots labeled A, B, and C. All panels share the same axes: the Y-axis represents Response Times in m s ranging from 0 to 4000, and the X-axis represents Condition with three categories: L 1-L 3, L 1-L 2-L 3, and L 2-L 3. A legend indicates that dark maroon boxes represent the Control Prime Type and light pink boxes represent the Cognate Prime Type.
* Panel A (Time 1): Median R T for Control is consistently higher than Cognate across all conditions, hovering around 1100 m s. Cognate medians are approximately 1000 m s. Numerous outliers extend from 2000 to 4000 m s.
* Panel B (Time 2): Overall R T values are slightly lower than Time 1. The gap between Control and Cognate remains, with Control medians near 1000 m s and Cognate medians near 900 m s. Outlier density remains high above 2000 m s.
* Panel C (Time 3): Shows the lowest overall R T values. Medians for both prime types are below 1000 m s, with Cognate consistently lower than Control. The distribution of outliers is similar to previous time points but starts at a slightly lower threshold.
The effect of prime type across time points
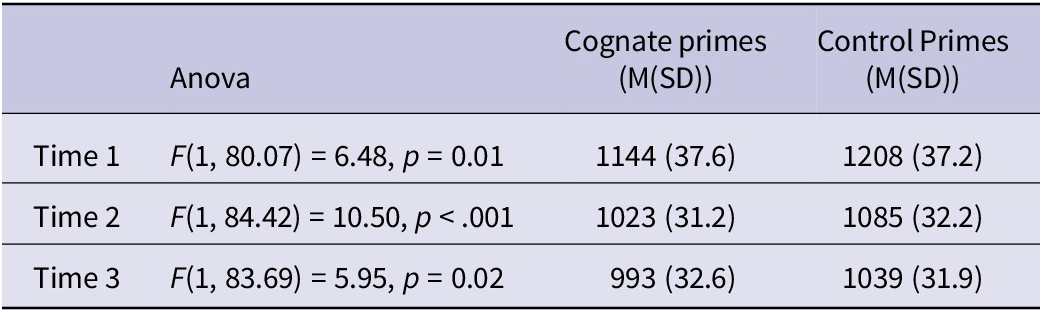
Table 2. Long description
The table consists of four columns: Time Point, A N O V A, Cognate Primes M S D, and Control Primes M S D.
* Time 1: A N O V A results are F (1, 80.07) equals 6.48, p equals 0.01. Cognate Primes mean is 1144 with a standard deviation of 37.6. Control Primes mean is 1208 with a standard deviation of 37.2.
* Time 2: A N O V A results are F (1, 84.42) equals 10.50, p is less than .001. Cognate Primes mean is 1023 with a standard deviation of 31.2. Control Primes mean is 1085 with a standard deviation of 32.2.
* Time 3: A N O V A results are F (1, 83.69) equals 5.95, p equals 0.02. Cognate Primes mean is 993 with a standard deviation of 32.6. Control Primes mean is 1039 with a standard deviation of 31.9.
A note at the bottom states that Time 1 data is based on a subset of participants reported in Elias et al., 2025.
Note: Time 1 data is based on a subset of the participants reported in Elias et al., Reference Elias, Van Hell, Prior and Degani2025.
Despite the overall similar pattern emerging in the separate analysis reported above, to more fully examine changes over time, we also conducted an analysis including Time as a fixed factor, along with its potential interactions with Prime Type or Condition. The analysis revealed a significant Prime Type effect (F(1, 90.0) = 8.87, p = 0.004) such that target words preceded by cognate primes (M = 1055, SE = 31.2) were responded to significantly faster than those preceded by control primes (M = 1115, SE = 30.8), and a significant effect of Time (F(2, 87.8) = 18.27, p < .001), such that RTs became progressively faster (M = 1177, SE = 34.6; M = 1060, SE = 31.3, M = 1023, SE = 31.7 for Time 1, Time 2 and Time 3 respectively). Critically, the interaction between Prime Type and Time was not significant (F(2, 16676.3) = 0.20, p = .82), nor were any other effects or interactions, suggesting a stable cognate priming effect over time.
To provide further evidence for the stability of the facilitation effect over time, we conducted a Bayes Factor analysis using the BIC approximation method (Wagenmakers, Reference Wagenmakers2007). Namely, we compared the BIC values of the model with and without the interaction with Time, yielding a Bayes Factor (BF01 > 100). This supports the absence of an interaction between Word Type and Time and confirms our suggestion that the priming cognate effect remained stable.
3.3. Analysis of proficiency
As was elaborated in the introduction, we expected longitudinal changes in language proficiency, namely, improvement in Hebrew and English proficiencies as participants progressed through their academic studies. To test this, we examined the effect of Time on each of the objective and subjective proficiency measures. We first created density plots (see Appendix B) using R commander package (Fox et al., Reference Fox, Marquez and Bouchet-Valat2024), which informed the exclusion of Hebrew and English Shipley accuracy and RT due to non-normal distributions and subjective Arabic proficiency ratings due to ceiling effects. A one-way ANOVA on the remaining measures (subjective proficiency and use ratings, verbal fluency and lexical retrieval MINT tasks), revealed significant improvements in subjective Hebrew proficiency (F(2,261) = 6.41, p = .002), Hebrew MINT (F(2,261) = 5.56, p = .004) and Hebrew fluency (F(2,261) = 12.20, p < .001) across time (See Figure 2 for changes in proficiency over time, Appendix C1 for the averages and SDs of each measure and Appendix C1 for correlations among proficiency measures in each language). Importantly, and contrary to our hypothesis, none of the measures of English proficiency showed changes over time (all p > .1). Thus, we examined whether the specific improvements in Hebrew (L2) proficiency were associated with changes in performance in the semantic relatedness task. To this end, we conducted analysis over the full longitudinal data including each proficiency measure as a fixed effect along with Prime Type and Condition and their interactions. Given the fact that proficiency measures predict changes over time, “Time” was included as a random rather than fixed factor, along with Participant and Item. Below, we report the significance of the proficiency measures and their interactions with the fixed effects of interest.
Subjective Hebrew proficiency (A), Hebrew MINT (B) and Hebrew fluency (C) measures at Times 1, 2 and 3.

Figure 2. Long description
A multi-panel figure with three box plots labeled A, B, and C. Each plot has Time on the x-axis (1, 2, and 3) and a specific Hebrew language metric on the y-axis. A legend on the right identifies Time 1 as teal, Time 2 as pink, and Time 3 as yellow.
* Panel A: Subjective Hebrew Proficiency. The y-axis ranges from 4 to 10. The median score increases from approximately 7.8 at Time 1 to 8.2 at Time 2 and remains stable at 8.2 for Time 3. The interquartile range narrows over time.
* Panel B: Hebrew M I N T score. The y-axis ranges from 10 to 60. There is a steady upward trend in median scores, starting around 23 at Time 1, rising to 27 at Time 2, and reaching approximately 29 at Time 3.
* Panel C: Hebrew fluency score. The y-axis ranges from 0 to 30. The median score shows a linear increase from 12 at Time 1, to 15 at Time 2, and approximately 16 at Time 3. The overall spread of data remains relatively consistent across the three time points.
3.3.1. Subjective Hebrew proficiency
The main effect of subjective Hebrew proficiency was significant (F(1, 11973.9) = 52.24, p < .001), such that higher ratings of subjective Hebrew proficiency were associated with faster RTs in the English semantic relatedness task. Notably, subjective Hebrew proficiency was positively correlated with subjective English (target language) proficiency (r = .284, p < .001), suggesting that it may reflect overall confidence in verbal abilities. We return to this issue in the Discussion. Critically, the interaction between Prime Type and Subjective Hebrew Proficiency was not significant. This absence of interaction was supported by a Bayes Factor analysis (BF01 > 100).
3.3.2. Hebrew MINT
Overall performance in the English semantic relatedness task was not significantly modulated by the Hebrew MINT Sprint score (F(1, 3246.9) = 0.90, p = .34), and there were no interactions with Prime Type or Condition. The findings were supported by a Bayes Factor analysis (BF01 > 100).
3.3.3. Hebrew fluency
Overall performance in the English semantic relatedness task was not significantly modulated by Hebrew fluency (F(1, 9134.0) = 1.74, p = .19), and there were no interactions with Prime Type or Condition. Again, this lack of interaction was supported by a Bayes Factor analysis (BF01 > 100).
4. Discussion
The current study adds to the limited available evidence on cross-language activation among different-script trilinguals. In a longitudinal design, we examined the stability of cross-language activation as measured by the cognate facilitation effect in the L3 among Arabic–Hebrew–English trilinguals. We also asked how changes in proficiency in both the source language (L2) and the target language (L3) might modulate this effect.
This work included a subset of the participants reported in Elias et al. (Reference Elias, Van Hell, Prior and Degani2025) (Time 1), as well as two additional data sets (Time 2 and 3). Specifically, for three consecutive years, each participant arrived at the laboratory and performed a semantic relatedness task in the L3, as well as subjective and objective linguistic tasks in each of their languages. Our results showed that the cognate facilitation effect remained significant and stable across the 3 years, and as observed in Elias et al. (Reference Elias, Van Hell, Prior and Degani2025), its magnitude was equivalent across the three types of cognates (L1-L3, L2-L3, L1-L2-L3 cognates) at all timepoints. Further, we observed significant improvements in subjective and objective proficiency measures across time in the L2 but not in the L3. Interestingly, these improvements in L2 proficiency were not accompanied by changes in cognate facilitation from L2 to L3. This pattern of results jointly suggests that source-language proficiency may have a nonlinear effect on the magnitude of cross-language influences in different-script trilinguals, as elaborated below.
4.1. The cognate facilitation effect
Extending the observed cognate facilitation effect present at Time 1 (reported in Elias et al., Reference Elias, Van Hell, Prior and Degani2025), the current study replicates the findings to Time 2 and Time 3 (including a subset of 88 out of the original 105 participants in Elias et al., Reference Elias, Van Hell, Prior and Degani2025). Because participants in the current study spoke languages that use different scripts, cross-language activation could not spread through orthographic overlap but only via phonology. Presumably, L3 orthography activated L1 and L2 phonological structures, which in turn activated the semantic representations needed to complete the semantic relatedness task (Degani et al., Reference Degani, Prior and Hajajra2018). The cognate facilitation effect was comparable across cognate types at all timepoints, such that cross-language activation appeared to have affected performance in the same way regardless of whether the overlap was between target language and one of the previously known languages (i.e., double cognates: L1–L3 or L2–L3) or between all known languages (i.e., triple cognates: L1–L2–L3).
Arguably, one could expect to observe greater cognate facilitation from the first strongest language L1 (L1–L3 double cognates) in comparison to the less proficient L2 (L2–L3 double cognates), with an added effect of both the L1 and the L2 in the triple cognate condition. Such an additive effect has indeed been reported in previous studies with same-script trilinguals, where triple cognates were processed more easily than double L1–L3 cognates (Lemhöfer et al., Reference Lemhöfer, Dijkstra and Michel2004; Szubko-Sitarek, Reference Szubko-Sitarek2011). The discrepancy between the current results and these previous findings might be ascribed to the fact that these studies utilized a lexical decision task with same-script trilinguals. In such a setup, a decision can be reached without accessing semantic representations but rather based on lexical and sub-lexical representations (Degani et al., Reference Degani, Prior and Hajajra2018; Elias et al., Reference Elias, Van Hell, Prior and Degani2025). This setup may also give rise to additive facilitation from cross-language orthographic overlap. Here, in contrast, semantic representations had to be accessed in order to complete the semantic-relatedness task appropriately. Our results suggest that L1 and L2 phonological representations were equally effective in accessing meaning, such that no measurable difference was observed across cognate types. Notably, L2 proficiency may modulate the efficacy with which L2 phonological representations allow access to meaning. We therefore examined how different types of cognates might be influenced by language proficiency.
4.2. Language proficiency modulations
In the current study, we incorporated a battery of subjective and objective measures to test participants’ proficiency in each of their languages at each timepoint. We expected that higher L3 (target language) proficiency would be associated with weaker cognate facilitation effects. Specifically, if the target language (L3, English) becomes proficient enough, semantic access through this language would become faster, such that spreading activation from the L1 and/or the L2 may no longer lead to facilitation. This can lead to decreased cross-language influences (Nativ et al., Reference Nativ, Nov, Ordan, Wintner and Prior2024; Vargas & García Mayo, Reference Vargas and García Mayo2022). However, in the current study, we observed no changes in L3 proficiency across time and thus were unable to test this prediction. Future studies tracking participants starting from an earlier point of L3 proficiency may be able to trace such changes more effectively and reveal their consequence for the cognate facilitation effect.
With respect to L2, we observed significant improvements in objective and subjective measures of proficiency. To the extent that increased L2 proficiency leads to more effective meaning activation, we would have expected stronger facilitation effects for cognates overlapping with the L2 (L2–L3, L1–L2–L3) as L2 proficiency increases. In contrast to this prediction, we found that cognate facilitation remained stable and comparable across the double and triple conditions throughout the years despite the improvement in L2. This pattern is more consistent with the suggestion that once participants are proficient enough in the L2, such that phonological representations can effectively activate meaning representations, there is no additive benefit of greater proficiency, at least in a semantic relatedness task.
In the current study, L2 proficiency appeared to have been strong enough from Time 1 to exert similar cross-language influences as L1 on L3 processing. This was reflected in the comparable cognate facilitation of L1–L3 and L2–L3 double cognates, already at Time 1. Interestingly, other research suggests that a certain level of proficiency may be needed in the weaker language in order to exert an influence on the stronger language (Brenders et al., Reference Brenders, Van Hell and Dijkstra2011; Van Hell & Dijkstra, Reference Van Hell and Dijkstra2002). However, in the current study, we measured the influences of L2 on L3, namely from a weak to a weaker language. In these circumstances it is yet unclear whether L2 would influence performance from the outset of L3 acquisition, or whether here as well, a certain L2 proficiency threshold needs to be surpassed. Because the current study targeted university students who have already been studying the L2 for several years, our current results cannot directly speak to this issue. Moreover, the population tested here was quite homogenous in terms of L2 proficiency. This limited our ability to determine which proficiency threshold needs to be reached in order to observe cross-language activation during L3 processing (for a recent account on proficiency threshold, see Yang et al., Reference Yang, Lai, Xu and He2026). Thus, future research targeting trilinguals with wider variability of L2 proficiency, including those with relatively minimal L2 proficiency, may help identify whether and where such a threshold exists.
Further, we observed that increased proficiency in the L2 did not strengthen an already observed cross-language activation in a semantic relatedness task with different-script trilinguals. At the same time, Foryś-Nogala et al. (Reference Foryś-Nogala, Silva, Ambroziak, Broniś, Janczarska, Jastrzębski and Otwinowska2025) found such modulations in a lexical decision task with same-script trilinguals. Thus, it is currently unclear which of the factors, namely task or trilingual population, underlies the different patterns across studies. Future research parametrically examining task characteristics across various trilingual populations, with a focus on script overlap, may reveal the conditions under which an increase in source-language proficiency results in greater cross-language activation.
Finally, we observed a significant correlation between self-reported L2 proficiency and L3 processing speed. Notably, no such association was observed for the objective measures of L2 proficiency (verbal fluency and MiNT picture naming). Tomoschuk et al. (Reference Tomoschuk, Ferreira and Gollan2019) argued that self-ratings could be misleading and biased, and that objective measures such as picture naming are more accurate in assessing language proficiency. The pattern observed here may be linked to a bias in participant’s self-report, which may reflect individuals’ evaluation of their overall verbal ability. Potentially, this verbal ability is what underlies the observed effect of L2 proficiency on L3 performance. Additional studies, applying multiple standardized objective measures and detailed subjective linguistic questionnaires are needed (De Bruin et al., Reference De Bruin, Carreiras and Duñabeitia2017; De Deyne et al., Reference De Deyne, Navarro, Perfors, Brysbaert and Storms2019) to continue characterizing the link between language proficiency and performance across languages of multilingual speakers.
5. Conclusions
The current study highlights the stability of cognate facilitation among different-script trilinguals across three timepoints. Importantly, the effect was comparable across double and triple cognates (Elias et al., Reference Elias, Van Hell, Prior and Degani2025) and was not modulated by increases in L2 proficiency following immersion. Specifically, our findings showed that changes in source-language proficiency (which is not the L1) did not affect cross-language activation, an understanding that cannot be revealed by bilingual studies alone. Critically, this study provides us with two major takeaways. First, in an L3 semantic paradigm, where semantic activation is required for task completion, facilitation may occur through the L1, the L2 or both to a similar extent. Second and most importantly, the lack of proficiency modulations suggests that once sufficient proficiency is reached in any of the source languages, the semantic representations of the cognate words are efficiently activated through phonological representations, resulting in cognate facilitation. This suggests that the relation between source-language proficiency and the magnitude of cross-language influences is not linear, and that patterns of cross-language effects depend on the relative accessibility of representations in all three languages.
Acknowledgments
The research was funded by ISF grant 340/18 awarded to A.P. and T.D.
Appendix A. Analysis tables of the semantic relatedness task
Appendix A1: Full analysis of Time 1
RT model summary

Table A1. Long description
The table is divided into three main sections under the primary header R T in milliseconds.
1. Fixed Effects:
- Intercept: b = 7.09, S E = 0.04, t = 176.48 (significant at p < 0.001).
- Condition (L 1 minus L 2 minus L 3): b = minus 0.0004, S E = 0.05, t = minus 0.01.
- Condition (L 2 minus L 3): b = 0.01, S E = 0.05, t = 0.31.
- Primetype (crit): b = minus 0.04, S E = 0.04, t = minus 1.18.
- Interaction Condition (L 1 minus L 2 minus L 3) by PrimeType (crit): b = minus 0.02, S E = 0.05, t = minus 0.33.
- Interaction Condition (L 2 minus L 3) by PrimeType (crit): b = minus 0.02, S E = 0.05, t = minus 0.30.
2. Control variables:
- Log subtlex frequency: b = minus 0.06, S E = 0.01, t = minus 4.11 (significant at p < 0.001).
- Orthographic neighborhood: b = 0.04, S E = 0.01, t = 2.67 (significant at p < 0.01).
3. Random Effects (columns: Variance, S D, and Correlation):
- Subject (Intercept): Variance = 0.05, S D = 0.23.
- Target (Intercept): Variance = 0.02, S D = 0.16.
- Target (PrimeType crit): Variance = 0.03, S D = 0.17, Corr. = minus 0.35.
- Residual: Variance = 0.13, S D = 0.36.
Note: Data reported in Time 1 is a subset of 88 participants who completed the longitudinal design (Time 1, Time 2 and Time 3), out of 105 from Elias et al. (Reference Elias, Van Hell, Prior and Degani2025).
RT ANOVA table

Table A2. Long description
The table consists of two columns: Variable and Statistical Result.
* Condition: F(2, 82.50) = 0.07, p = .93.
* Prime Type: F(1, 80.07) = 6.48, p = .01 with one asterisk.
* Log Subtlex Frequency: F(1, 126.20) = 16.85, p < .001 with three asterisks.
* Orthographic Neighborhood: F(1, 148.03) = 7.15, p = .008 with two asterisks.
* Condition * Prime Type: F(2, 81.59) = 0.07, p = .94.
A footer note defines the significance levels: one asterisk for p < .05, two asterisks for p < .01, and three asterisks for p < .001.
Note: * p < .05, ** p < .01, ***p < .001.
Accuracy model summary

Table A3. Long description
The table is organized into four main sections under the primary heading of Accuracy.
1. Fixed Effects (Columns: b, S E, z):
* Intercept: b = 1.81, S E = 0.21, z = 8.57 (significant at p < .001).
* Condition (Arb-Heb-Eng): b = -0.28, S E = 0.27, z = -1.03.
* Condition (Heb-Eng): b = -0.27, S E = 0.27, z = -0.99.
* PrimeType (crit): b = -0.03, S E = 0.12, z = -0.27.
* Interaction Condition (Arb-Heb-Eng) by PrimeType (crit): b = 0.29, S E = 0.17, z = 1.67.
* Interaction Condition (Heb-Eng) by PrimeType (crit): b = 0.25, S E = 0.16, z = 1.54.
2. Control Variables (Columns: b, S E, z):
* Log Subtlex Frequency: b = 0.30, S E = 0.05, z = 5.66 (significant at p < .001).
* Orthographic Neighborhood: b = -0.14, S E = 0.06, z = -2.37 (significant at p < .05).
* Bigram Frequency: b = -0.14, S E = 0.05, z = -2.90 (significant at p < .01).
* Word Length: b = 0.17, S E = 0.06, z = 2.77 (significant at p < .01).
3. Random Effects (Columns: Variance, S D):
* Subject (Intercept): Variance = 0.56, S D = 0.75.
* Target (Intercept): Variance = 0.84, S D = 0.91.
4. Model Fit:
* A I C: 6412.5.
Note: * p < .05, ** p < .01, ***p < .001
Accuracy ANOVA table

Table A4. Long description
The table consists of three columns: Factor, F-value, and p-value.
* Condition: F equals 0.68, p equals .51.
* Prime Type: F equals 7.70, p equals .005.
* Frequency: F equals 11.32, p is less than .001.
* Orthographic Neighborhood: F equals 31.43, p is less than .001.
* Bigram Frequency: F equals 4.63, p equals .03.
* Length: F equals 9.22, p equals .002.
* Condition asterisk Prime Type interaction: F equals 1.69, p equals .18.
Appendix A2: Full analysis of Time 2
RT model summary

Table A5. Long description
The table presents R T (m s) model results across four columns: Fixed Effects, b, S E, and t.
Fixed Effects section:
- Intercept: b = 7.00, S E = 0.04, t = 185.07 (significant at 0.001 level).
- Condition (L 1 minus L 2 minus L 3): b = minus 0.03, S E = 0.04, t = minus 0.78.
- Condition (L 2 minus L 3): b = 0.004, S E = 0.04, t = 0.10.
- PrimeType (crit): b = minus 0.08, S E = 0.03, t = minus 2.58.
- Interaction Condition (L 1 minus L 2 minus L 3) by PrimeType (crit): b = 0.02, S E = 0.04, t = 0.51.
- Interaction Condition (L 2 minus L 3) by PrimeType (crit): b = 0.04, S E = 0.04, t = 0.88.
Control Variables section:
- Log Subtlex Frequency: b = minus 0.05, S E = 0.01, t = minus 3.86 (significant at 0.001 level).
- Phonological Neighborhood: b = 0.03, S E = 0.01, t = 2.45 (significant at 0.05 level).
- Averaged Bigram Frequency: b = 0.002, S E = 0.01, t = 0.22.
Random Effects section (columns: Variance, S D, and Corr.):
- Subject (Intercept): Variance = 0.05, S D = 0.23.
- Target (Intercept): Variance = 0.01, S D = 0.08.
- Target.1 (Intercept): Variance = 0.01, S D = 0.12.
- Target.1 (PrimeType crit): Variance = 0.02, S D = 0.13, Corr. = minus 0.44.
- Residual: Variance = 0.13, S D = 0.37.
The A I C is 5581.3.
RT ANOVA table

Table A6. Long description
The table contains two columns: Condition and statistical results.
* Condition: F(2, 84.66) = 0.70, p = .50.
* Prime Type: F(1, 84.42) = 10.50, p = .001 with two asterisks.
* Log Subtlex Frequency: F(1, 131.68) = 14.92, p < .001 with three asterisks.
* Phonological Neighborhood: F(1, 139.54) = 5.98, p = .02 with one asterisk.
* Averaged Bigram Frequency: F(1, 123.37) = 0.05, p = .83.
* Condition * Prime Type: F(2, 83.27) = 0.39, p = .68.
A footer note defines the significance levels: one asterisk for p < .05, two asterisks for p < .01, and three asterisks for p < .001.
Note: *p < .05; **p < .01; ***p < .001.
Accuracy model summary

Table A7. Long description
The table is divided into four main sections.
1. Fixed Effects:
- Intercept: b = 1.82, S E = 0.26, z = 7.03 (significant at p < .001).
- Condition (L 1-L 2-L 3): b = -0.15, S E = 0.35, z = -0.42.
- Condition (L 2-L 3): b = -0.33, S E = 0.35, z = -0.93.
- PrimeType (crit): b = 0.30, S E = 0.32, z = 0.94.
- Interaction Condition (L 1-L 2-L 3) and PrimeType (crit): b = 0.04, S E = 0.45, z = 0.10.
- Interaction Condition (L 2-L 3) and PrimeType (crit): b = 0.33, S E = 0.45, z = 0.75.
2. Control Variables:
- Word Length: b = 0.27, S E = 0.11, z = 2.43 (significant at p < .05).
- Log Subtlex Frequency: b = 0.34, S E = 0.12, z = 2.95 (significant at p < .01).
3. Random Effects (Variance, S D, Correlation):
- Subject (Intercept): 0.11, 0.33.
- Subject.1 (Intercept): 0.36, 0.60.
- Target (Intercept): 0.98, 0.99.
- Target (PrimeType crit): 2.23, 1.49, Correlation = -0.53.
- Target.1 (Intercept): 0.48, 0.69.
4. Model Fit:
- A I C: 6590.0.
Note: *p < .05; **p < .01; ***p < .001.
Accuracy ANOVA table

Table A8. Long description
The table consists of three columns: the first column lists the source of variation, the second column lists the F-statistic, and the third column lists the p-value.
* Condition: F equals 0.68, p equals .51.
* Prime Type: F equals 5.01, p equals .03.
* Word Length: F equals 2.14, p equals .14.
* Log Subtlex Frequency: F equals 9.24, p equals .002.
* Condition asterisk Prime Type interaction: F equals 0.33, p equals .72.
Appendix A3: Full analysis of Time 3
RT model summary

Table A9. Long description
A table titled R T model summary with columns for b, S E, and t.
Fixed Effects:
* Intercept: b = 6.94, S E = 0.04, t = 187.69.
* Condition L 1 minus L 2 minus L 3: b = minus 0.01, S E = 0.04, t = minus 0.33.
* Condition L 2 minus L 3: b = 0.03, S E = 0.04, t = 0.85.
* PrimeType crit: b = minus 0.07, S E = 0.03, t = minus 2.09.
* Interaction Condition L 1 minus L 2 minus L 3 and PrimeType crit: b = 0.03, S E = 0.05, t = 0.73.
* Interaction Condition L 2 minus L 3 and PrimeType crit: b = 0.03, S E = 0.04, t = 0.64.
Control Variables:
* Log Subtlex Frequency: b = minus 0.04, S E = 0.01, t = minus 3.57.
* Phonological Neighborhood: b = 0.01, S E = 0.02, t = 0.53.
* Averaged Bigram Frequency: b = 0.01, S E = 0.01, t = 0.91.
* Orthographic Neighborhood: b = 0.01, S E = 0.02, t = 0.63.
Random Effects (Variance, S D, Corr.):
* Subject Intercept: 0.06, 0.25.
* Target Intercept: 0.01, 0.12.
* Target.1 Intercept: 0.00, 0.03.
* Target.1 PrimeType crit: 0.02, 0.14, minus 0.84.
* Residual: 0.13, 0.36.
A I C: 5140.8.
RT ANOVA table

Table A10. Long description
The table consists of two columns: Condition/Variable and Statistical Results.
* Condition: F(2, 81.98) equals 0.91, p equals .40.
* Prime Type: F(1, 79.12) equals 5.55, p equals .02 (significant at the .05 level).
* Log Subtlex Frequency: F(1, 117.84) equals 11.91, p is less than .001 (significant at the .001 level).
* Phonological Neighborhood: F(1, 121.76) equals 0.25, p equals 0.62.
* Averaged Bigram Frequency: F(1, 118.26) equals 0.79, p equals .38.
* Orthographic Neighborhood: F(1, 133.83) equals 0.39, p equals .54.
* Condition multiplied by Prime Type: F(2, 79.04) equals 0.29, p equals .75.
Footnote indicates significance levels: one asterisk for p less than .05, two asterisks for p less than .01, and three asterisks for p less than .001.
Note: *p < .05; **p < .01; ***p < .001.
Accuracy model summary

Table A11. Long description
A table titled Accuracy model summary with four columns: Fixed Effects, b, S E, and z.
Fixed Effects section:
* Intercept: b = 1.74, S E = 0.21, z = 8.23 with three asterisks.
* Condition (L 1 minus L 2 minus L 3): b = minus 0.20, S E = 0.28, z = minus 0.73.
* Condition (L 2 minus L 3): b = minus 0.38, S E = 0.28, z = minus 1.38.
* PrimeType (crit): b = 0.10, S E = 0.12, z = 0.82.
* Condition (L 1 minus L 2 minus L 3) by PrimeType (crit): b = 0.26, S E = 0.17, z = 1.56.
* Condition (L 2 minus L 3) by PrimeType (crit): b = 0.23, S E = 0.16, z = 1.44.
Control Variables section:
* Log Subtlex Frequency: b = 0.27, S E = 0.05, z = 4.98 with three asterisks.
* Word Length: b = 0.21, S E = 0.05, z = 4.26 with three asterisks.
* Averaged Bigram Frequency: b = minus 0.12, S E = 0.04, z = minus 2.62 with two asterisks.
Random Effects section (columns change to Variance, S D, and Corr.):
* Subject (Intercept): Variance = 0.44, S D = 0.66.
* Target (Intercept): Variance = 0.89, S D = 0.94.
A I C is listed at 6526.2.
Note: one asterisk indicates p < .05, two asterisks indicate p < .01, and three asterisks indicate p < .001.
Note: *p < .05; **p < .01; ***p < .001.
Accuracy ANOVA table

Table A12. Long description
The table consists of three columns: Variable, F-value, and p-value.
* Condition: F equals 1.21, p equals .03.
* Prime Type: F equals 17.50, p is less than .001.
* Log Subtlex Frequency: F equals 10.87, p is less than .001.
* Word Length: F equals 16.51, p is less than .001.
* Averaged Bigram Frequency: F equals 9.74, p equals .0001.
* Condition asterisk Prime Type: F equals 1.45, p equals .24.
Appendix A4: Full analysis of all time points
RT model summary

Table A13. Long description
The table is titled R T model summary and reports values for R T in milliseconds. It is divided into two main sections: Fixed Effects and Random Effects.
Fixed Effects section columns are b, S E, and t. Key rows include:
* Intercept: b = 7.08, S E = 0.04, t = 184.21 with three asterisks.
* Condition L 1 minus L 2 minus L 3: b = 0.003, S E = 0.04, t = 0.09.
* Condition L 2 minus L 3: b = 0.04, S E = 0.04, t = 0.99.
* PrimeType crit: b = minus 0.04, S E = 0.03, t = minus 1.23.
* Time 2: b = minus 0.08, S E = 0.03, t = minus 3.28 with two asterisks.
* Time 3: b = minus 0.14, S E = 0.03, t = minus 5.11 with three asterisks.
* Interaction terms for Condition, PrimeType, and Time follow with b values ranging from minus 0.03 to 0.05 and t values from minus 1.42 to 1.54.
Random Effects section columns are Variance, S D, and Corr. Key rows include:
* Subject Intercept: Variance = 0.05, S D = 0.23.
* Subject Time 2: Variance = 0.04, S D = 0.20, Corr. = minus 0.40.
* Subject Time 3: Variance = 0.05, S D = 0.22, Corr. = minus 0.38 0.59.
* Subject PrimeType crit: Variance = 0.00, S D = 0.04, Corr. = 0.06 minus 0.36 0.11.
* Target Intercept: Variance = 0.02, S D = 0.15.
* Target PrimeType crit: Variance = 0.03, S D = 0.16, Corr. = minus 0.35.
* Residual: Variance = 0.13, S D = 0.36.
At the bottom, the A I C is 15074.1.
RT ANOVA table

Table A14. Long description
The table consists of two columns: Factor and Statistical Result.
* Condition: F(2, 83.3) = 1.09, p = .34.
* Prime Type: F(1, 90.0) = 8.87, p = .003, marked with two asterisks indicating significance at p < .01.
* Time: F(2, 87.8) = 18.27, p < .001, marked with three asterisks indicating significance at p < .001.
* Condition * Prime Type: F(2, 84.0) = 0.03, p = .98.
* Condition * Time: F(4, 16645.3) = 1.02, p = .39.
* Prime Type * Time: F(2, 16664.5) = 0.21, p = .81.
* Condition * Prime Type * Time: F(4, 16619.8) = 0.85, p = .49.
A footer note defines the significance levels: one asterisk for p < .05, two asterisks for p < .01, and three asterisks for p < .001.
Note: *p < .05; **p < .01; ***p < .001.
Appendix A5: Full analysis of all time points, by Hebrew Proficiency Level
RT model summary

Table A15. Long description
The table is divided into three main sections: Fixed Effects, Control Variables, and Random Effects.
1. Fixed Effects (Columns: b, S E, t):
- Intercept: b = 7.32, S E = 0.08, t = 96.26 (significant at p < 0.001).
- PrimeType (crit): b = -0.09, S E = 0.09, t = -1.01.
- Condition (L 1-L 2-L 3): b = -0.01, S E = 0.09, t = -0.06.
- Condition (L 2-L 3): b = 0.14, S E = 0.09, t = 1.51.
- Hebrew Proficiency Total: b = -0.04, S E = 0.01, t = -4.60 (significant at p < 0.001).
- Interaction PrimeType (crit) by Condition (L 1-L 2-L 3): b = -0.03, S E = 0.12, t = -0.27.
- Interaction PrimeType (crit) by Condition (L 2-L 3): b = -0.04, S E = 0.12, t = -0.36.
- Interaction PrimeType (crit) by Hebrew Proficiency Total: b = 0.002, S E = 0.01, t = 0.28.
- Interaction Condition (L 1-L 2-L 3) by Hebrew Proficiency Total: b = -0.0008, S E = 0.01, t = -0.08.
- Interaction Condition (L 2-L 3) by Hebrew Proficiency Total: b = -0.01, S E = 0.01, t = -1.25.
- Three-way interaction PrimeType (crit) by Condition (L 1-L 2-L 3) by Hebrew Proficiency Total: b = 0.004, S E = 0.01, t = 0.36.
- Three-way interaction PrimeType (crit) by Condition (L 2-L 3) by Hebrew Proficiency Total: b = 0.01, S E = 0.01, t = 0.54.
2. Control Variables:
- Averaged Bigram Frequency: b = -0.01, S E = 0.003, t = -4.12 (significant at p < 0.001).
3. Random Effects (Columns: Variance, S D, Corr.):
- Subject (Intercept): Variance = 0.04, S D = 0.20.
- Target (Intercept): Variance = 0.02, S D = 0.15.
- Target (PrimeType crit): Variance = 0.03, S D = 0.16, Correlation = -0.34.
- Residual: Variance = 0.15, S D = 0.38.
RT ANOVA table

Table A16. Long description
The table presents results for an Analysis of Variance (A N O V A) on Reaction Time (R T) across eight rows of variables and interactions:
* PrimeType: F(1, 3621.3) = 4.99, p = .03 (significant at the .05 level).
* Condition: F(2, 788.9) = 2.26, p = .11.
* Hebrew Proficiency Total: F(1, 11973.9) = 52.24, p < .001 (significant at the .001 level).
* Time: F(1, 16942.6) = 17.00, p < .001 (significant at the .001 level).
* Averaged Bigram Frequency: F(2, 3617.9) = 0.07, p = .93.
* PrimeType * Hebrew Proficiency Total: F(1, 16838.9) = 1.45, p = .322.
* Condition * Hebrew Proficiency Total: F(2, 16838.6) = 1.25, p = .29.
* PrimeType * Condition * Hebrew Proficiency Total: F(2, 16838.5) = 0.15, p = .86.
A footer note defines significance levels: * p < .05; ** p < .01; *** p < .001.
Note: *p < .05; **p < .01; ***p < .001.
Appendix A6: Full analysis of all Time points, by Hebrew MINT
RT model summary

Table A17. Long description
The table is divided into two main sections: Fixed Effects and Random Effects.
Fixed Effects Section:
Columns are labeled Fixed Effects, b, S E, and t.
- Intercept: b = 7.02, S E = 0.06, t = 112.72 (significant at 0.001 level).
- Prime Type (crit): b = -0.07, S E = 0.03, t = -2.32 (significant at 0.05 level).
- Condition (L 1 - L 2 - L 3): b = -0.01, S E = 0.05, t = -0.27.
- Condition (L 2 - L 3): b = 0.03, S E = 0.05, t = 0.70.
- Hebrew M I N T Total: b = -0.00, S E = 0.00, t = -0.66.
- Interaction Prime Type (crit) by Condition (L 1 - L 2 - L 3): b = 0.03, S E = 0.05, t = 0.64.
- Interaction Prime Type (crit) by Condition (L 2 - L 3): b = 0.04, S E = 0.05, t = 0.83.
- Interaction Prime Type (crit) by Hebrew M I N T Total: b = -0.00, S E = 0.00, t = -0.14.
- Interaction Condition (L 1 - L 2 - L 3) by Hebrew M I N T Total: b = -0.00, S E = 0.00, t = -0.25.
- Interaction Condition (L 2 - L 3) by Hebrew M I N T Total: b = 0.00, S E = 0.00, t = 0.18.
- Three-way interaction Prime Type (crit) by Condition (L 1 - L 2 - L 3) by Hebrew M I N T Total: b = 0.00, S E = 0.00, t = 0.19.
- Three-way interaction Prime Type (crit) by Condition (L 2 - L 3) by Hebrew M I N T Total: b = -0.00, S E = 0.00, t = -0.31.
- Control Variable Orthographic Neighborhood: b = 0.02, S E = 0.00, t = 4.22 (significant at 0.001 level).
Random Effects Section:
Columns are labeled Random Effects, Variance, S D, and Corr.
- Subject (Intercept): Variance = 0.04, S D = 0.20.
- Target (Intercept): Variance = 0.02, S D = 0.14.
- Time (Intercept): Variance = 0.00, S D = 0.07.
- Residual: Variance = 0.15, S D = 0.39.
RT ANOVA table

Table A18. Long description
The table consists of two columns and eight rows of data.
* Prime Type: F(1, 16916.6) = 7.53, p = .01 (significant at the .01 level).
* Condition: F(2, 139.9) = 0.97, p = .38.
* Hebrew M I N T Total: F(1, 3246.9) = 0.90, p = .34.
* Orthographic Neighborhood: F(1, 12024.7) = 17.79, p < .001 (significant at the .001 level).
* Prime Type * Condition: F(2, 16924.7) = 0.39, p = .68.
* Prime Type * Hebrew M I N T Total: F(1, 16911.5) = 0.11, p = .74.
* Condition * Hebrew M I N T Total: F(2, 16912.2) = 0.01, p = .99.
* Prime Type * Condition * Hebrew M I N T Total: F(2, 16911.1) = 0.12, p = .89.
A note at the bottom defines significance levels: * p < .05; ** p < .01; *** p < .001.
Note: *p < .05; **p < .01; ***p < .001.
Appendix A7: Full analysis of all Time points, by Hebrew Fluency
RT model summary

Table A19. Long description
The table is divided into three main sections: Fixed Effects, Control Variables, and Random Effects.
Fixed Effects section (columns: b, S E, t):
- Intercept: b = 6.97, S E = 0.06, t = 110.47 (significant at 0.001 level).
- PrimeType (crit): b = -0.07, S E = 0.04, t = -1.71.
- Condition (L 1–L 2–L 3): b = 0.004, S E = 0.05, t = 0.10.
- Condition (L 2–L 3): b = 0.07, S E = 0.05, t = 1.44.
- Hebrew Fluency: b = 0.002, S E = 0.001, t = 1.27.
- PrimeType (crit) by Condition (L 1–L 2–L 3): b = 0.02, S E = 0.06, t = 0.31.
- PrimeType (crit) by Condition (L 2–L 3): b = -0.02, S E = 0.06, t = -0.26.
- PrimeType (crit) by Hebrew Fluency: b = 0.00, S E = 0.001, t = 0.22.
- Condition (L 1–L 2–L 3) by Hebrew Fluency: b = -0.001, S E = 0.002, t = -0.74.
- Condition (L 2–L 3) by Hebrew Fluency: b = -0.002, S E = 0.002, t = -1.14.
- PrimeType (crit) by Condition (L 1–L 2–L 3) by Hebrew Fluency: b = 0.00, S E = 0.002, t = 0.14.
- PrimeType (crit) by Condition (L 2–L 3) by Hebrew Fluency: b = 0.002, S E = 0.002, t = 0.84.
Control Variables section:
- Averaged Bigram Frequency: b = 0.005, S E = 0.01, t = 0.58.
- Orthographic Neighborhood: b = 0.02, S E = 0.01, t = 1.60.
Random Effects section (columns: Variance, S D, Corr.):
- Subject (Intercept): Variance = 0.04, S D = 0.20.
- Target (Intercept): Variance = 0.02, S D = 0.15.
- Target (PrimeType crit): Variance = 0.04, S D = 0.16, Corr. = -0.33.
- Time (Intercept): Variance = 0.01, S D = 0.08.
- Residual: Variance = 0.14, S D = 0.38.
RT ANOVA table

Table A20. Long description
The table contains nine rows of statistical data.
* PrimeType: F(1, 264.3) = 8.37, p = .004. This result is marked with two asterisks indicating significance at the p < .01 level.
* Condition: F(2, 132.0) = 1.18, p = .31.
* Hebrew Fluency: F(1, 9134.0) = 1.74, p = .18.
* Averaged Bigram Frequency: F(1, 1199.2) = 0.33, p = .56.
* Orthographic Neighborhood: F(1, 147.6) = 2.55, p = .11.
* PrimeType * Condition: F(2, 260.9) = 0.16, p = .85.
* PrimeType * Hebrew Fluency: F(1, 16838.2) = 1.39, p = .24.
* Condition * Hebrew Fluency: F(2, 16836.7) = 0.50, p = .61.
* PrimeType * Condition * Hebrew Fluency: F(2, 16837.8) = 0.40, p = .67.
A footer note defines the significance levels: one asterisk for p < .05, two asterisks for p < .01, and three asterisks for p < .001.
Note: * p < .05, ** p < .01, ***p < .001.
Appendix B. Density plots including all time points, by L1, L2, L3

Table B1. Long description
The table consists of four rows, each representing a different proficiency measure for Arabic L 1 speakers.
* The first row, Subjective Proficiency Total, shows a density plot where the curve rises steadily from left to right, reaching its highest peak at the maximum value of 10.0.
* The second row, Use Average, displays a density plot with a rug plot along the x-axis. The distribution is relatively broad with a peak centered around the middle of the scale.
* The third row, Fluency, features a density plot with a prominent, symmetrical central peak, indicating a normal distribution of fluency scores.
* The fourth row, M I N T total, shows a density plot with a bimodal distribution, characterized by two distinct peaks occurring between the values of 60 and 65.

Table B2. Long description
The table consists of two columns: Proficiency Measure and Hebrew (L 2).
* Subjective Proficiency (Total): A density plot for Heb Prof Total showing a unimodal distribution with a sharp peak around the value of 8.
* Use Average: A density plot for Heb Use Avg showing a broad, slightly right-skewed distribution with a peak between 2 and 4, accompanied by a rug plot at the base.
* Fluency: A density plot for Heb underscore Flu showing a bimodal distribution with a primary peak near 8 and a secondary lower peak near 4, with a rug plot at the base.
* M I N T total: A density plot for Heb underscore M I N T underscore Total showing a wide, relatively flat distribution peaking between 50 and 60.
* Shipley Accuracy: A density plot for Heb underscore Ship underscore A C C showing a highly left-skewed distribution with a major peak near 40 and smaller fluctuations at lower values.
* Shipley R T: A density plot for Heb underscore Ship underscore R T underscore Mean showing a right-skewed distribution with a sharp peak around 1500 and a long tail extending toward 4000.

Table B3. Long description
The table consists of two columns: Proficiency Measure and English (L 3).
* Row 1: Subjective Proficiency (Total). The density plot shows a negatively skewed distribution with a sharp peak at approximately 7 on the x-axis.
* Row 2: Use Average. The density plot includes a rug plot at the base. The curve is bimodal with a primary peak around 5 and a secondary, lower peak around 17.
* Row 3: Fluency. The density plot shows a unimodal, slightly right-skewed distribution with a peak centered around 11.
* Row 4: M I N T total. The density plot shows a broad, relatively symmetrical distribution centered between 50 and 60.
* Row 5: Shipley Accuracy. The density plot shows a complex distribution with two very sharp, narrow peaks between 0.1 and 0.2, and a third broader, lower peak near 0.4.
* Row 6: Shipley R T. The density plot includes a rug plot and shows a unimodal distribution with a peak around 2000, followed by a long right tail extending toward 6000.
Appendix C. Proficiency measures Analysis
Appendix C1. Average, SD, and Anova of Proficiency measures across Language across Time

Table C1. Long description
The table contains 16 rows of data across five columns. Each data cell for Time 1, 2, and 3 includes an Average followed by the Standard Deviation in parentheses.
* L 1 Subjective Proficiency: Time 1 9.72 (0.43), Time 2 9.67 (0.57), Time 3 9.81 (0.35). Anova F(2,261) = 2.09, p = .13.
* L 1 Use: Time 1 42.88 (15.22), Time 2 41.60 (16.29), Time 3 43.34 (14.46). Anova F(2,261) = 0.31, p = .74.
* L 1 Fluency: Time 1 17.41 (4.16), Time 2 17.89 (4.02), Time 3 18.92 (4.5). Anova F(2,261) = 2.93, p = .06.
* L 1 M I N T: Time 1 59.89 (3.96), Time 2 59.99 (4.37), Time 3 59.60 (4.02). Anova F(2,261) = 0.21, p = .81.
* L 2 Subjective Proficiency: Time 1 7.74 (1.05), Time 2 8.12 (1.02), Time 3 8.27 (1.01). Anova F(2,261) = 6.41, p = .002 (Significant).
* L 2 Use: Time 1 28.42 (12.86), Time 2 27.39 (12.36), Time 3 26.29 (11.29). Anova F(2,261) = 0.67, p = .51.
* L 2 Fluency: Time 1 12.48 (4.59), Time 2 14.44 (4.99), Time 3 16.10 (5.03). Anova F(2,261) = 12.20, p < .001 (Significant).
* L 2 M I N T: Time 1 24.30 (8.78), Time 2 26.76 (8.34), Time 3 28.82 (9.17). Anova F(2,261) = 5.56, p = .004 (Significant).
* L 2 Shipley Accuracy: Time 1 0.08 (0.04), Time 2 0.09 (0.06), Time 3 0.09 (0.05). Anova F(2,261) = 1.74, p = .18.
* L 2 Shipley R T: Time 1 8232.76 (3048.37), Time 2 6134.63 (2288.25), Time 3 6259.59 (3303.43). Anova F(2,261) = 14.37, p < .001 (Significant).
* L 3 Subjective Proficiency: Time 1 6.56 (1.63), Time 2 6.70 (1.51), Time 3 6.77 (1.56). Anova F(2,261) = 0.43, p = .65.
* L 3 Use: Time 1 15.56 (11.03), Time 2 16.05 (11.38), Time 3 16.54 (12.44). Anova F(2,261) = 0.16, p = .85.
* L 3 Fluency: Time 1 10.57 (4.68), Time 2 11.16 (4.56), Time 3 12.00 (4.87). Anova F(2,261) = 2.06, p = .13.
* L 3 M I N T: Time 1 28.18 (9.35), Time 2 29.03 (8.97), Time 3 30.08 (1.04). Anova F(2,261) = 0.91, p = .40.
* L 3 Shipley Accuracy: Time 1 0.23 (0.13), Time 2 0.23 (0.13), Time 3 0.23 (0.14). Anova F(2,261) = 0.06, p = .94.
* L 3 Shipley R T: Time 1 7784.03 (2537.62), Time 2 5761.86 (1877.18), Time 3 5263.89 (1642.65). Anova F(2,261) = 37.14, p < .001 (Significant).
Note: * Marks significant ch ange across Time.
Appendix C2. Pearson correlations among the proficiency measures in each language
Pearson correlations in Arabic

Table C2. Long description
The table consists of four numbered rows and four corresponding numbered columns.
Row 1: Subjective Arabic Proficiency. It correlates with itself at 1.
Row 2: Arabic Use. It has a correlation of 0.06 with Subjective Arabic Proficiency and 1 with itself.
Row 3: Arabic Fluency (Average per minute). It has a correlation of 0.01 with Subjective Arabic Proficiency, 0.06 with Arabic Use, and 1 with itself.
Row 4: Arabic M I N T. It has a correlation of minus 0.04 with Subjective Arabic Proficiency, minus 0.11 with Arabic Use, 0.21 with Arabic Fluency (marked with two asterisks indicating p is less than .01), and 1 with itself.
Note: ** p < .01.
Pearson correlations in Hebrew

Table C3. Long description
A lower triangular matrix presenting Pearson correlations for six variables. The columns are numbered 1 through 6, corresponding to the numbered rows.
1. Subjective Hebrew Proficiency: Correlates with itself at 1.
2. Hebrew Use: Correlates with Subjective Hebrew Proficiency at 0.37 (p < .01).
3. Hebrew Fluency (average per minute): Correlates with Subjective Hebrew Proficiency at 0.36 (p < .01) and Hebrew Use at 0.23 (p < .01).
4. Hebrew M I N T: Correlates with Subjective Hebrew Proficiency at 0.297 (p < .01), Hebrew Use at 0.27 (p < .01), and Hebrew Fluency at 0.596 (p < .01).
5. Shipley (Acc): Correlates with Subjective Hebrew Proficiency at 0.091, Hebrew Use at -0.03, Hebrew Fluency at 0.09, and Hebrew M I N T at 0.03.
6. Shipley (R T): Correlates with Subjective Hebrew Proficiency at -0.178 (p < .01), Hebrew Use at 0.02, Hebrew Fluency at -0.099, Hebrew M I N T at -0.05, and Shipley (Acc) at 0.11.
Note: Double asterisks indicate p < .01.
Note: ** p < .01.
Pearson correlations in English

Table C4. Long description
A correlation table with six numbered columns and six numbered rows.
Variables:
1. Subjective English Proficiency
2. English Use
3. English Fluency (Average per minute)
4. English M I N T
5. Shipley (Acc)
6. Shipley (R T)
Data points (Pearson r values):
- Row 1: Variable 1 correlates with itself at 1.
- Row 2: Variable 2 correlates with Variable 1 at 0.48**.
- Row 3: Variable 3 correlates with Variable 1 at 0.44** and Variable 2 at 0.498**.
- Row 4: Variable 4 correlates with Variable 1 at 0.54**, Variable 2 at 0.65**, and Variable 3 at 0.73**.
- Row 5: Variable 5 correlates with Variable 1 at 0.29**, Variable 2 at 0.30**, Variable 3 at 0.32**, and Variable 4 at 0.495**.
- Row 6: Variable 6 correlates with Variable 1 at minus 0.16*, Variable 2 at minus 0.15*, Variable 3 at minus 0.17**, Variable 4 at minus 0.17**, and Variable 5 at 0.21**.
Note: ** indicates p < .01 and * indicates p < .05.
Note: ** p < .01 ** p < .05.
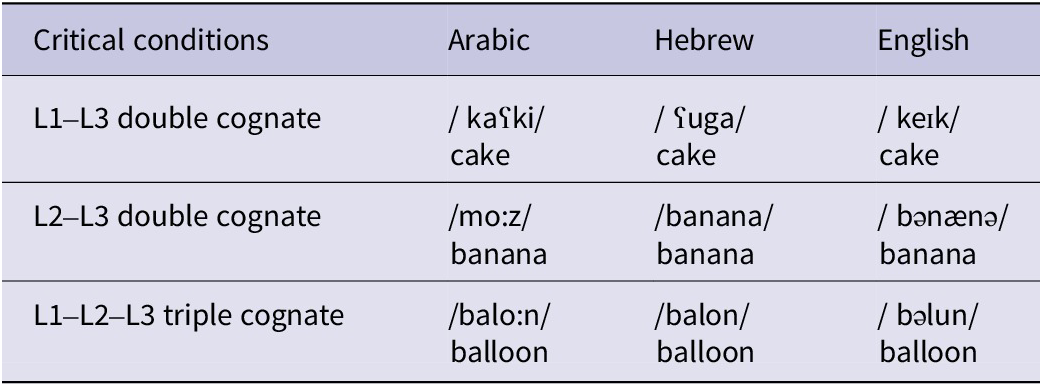

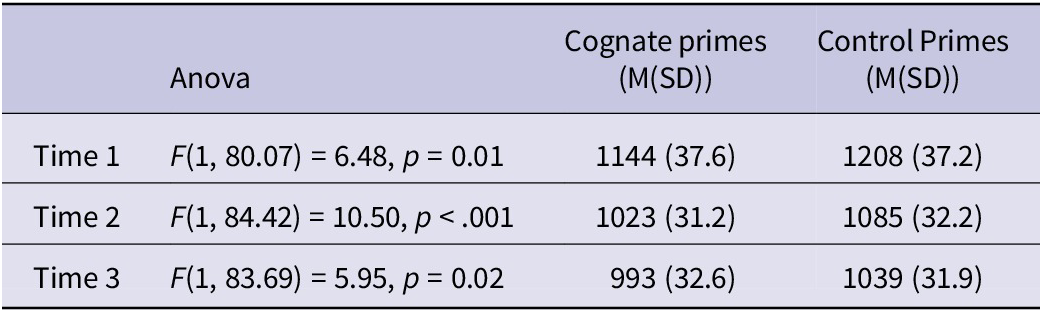
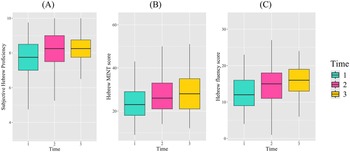
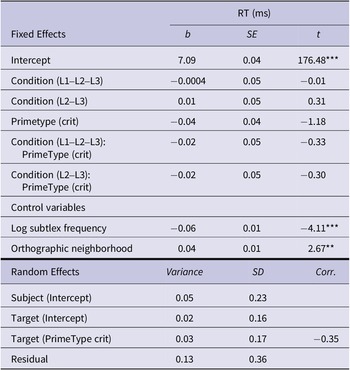
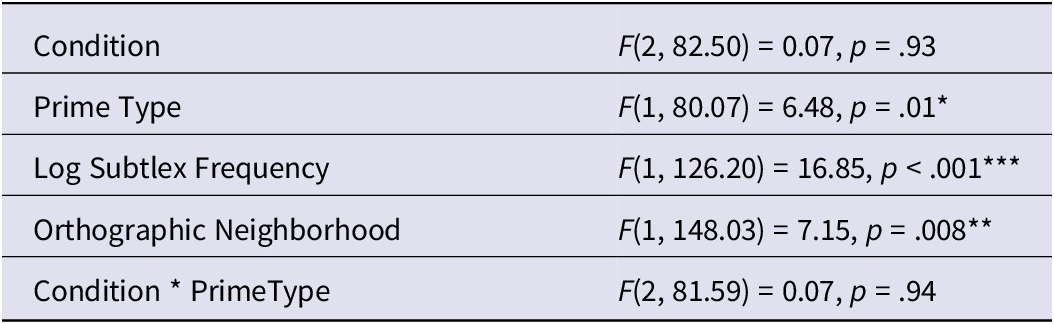
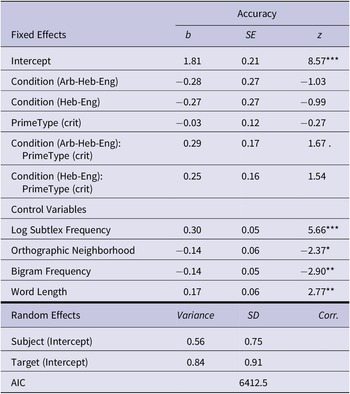
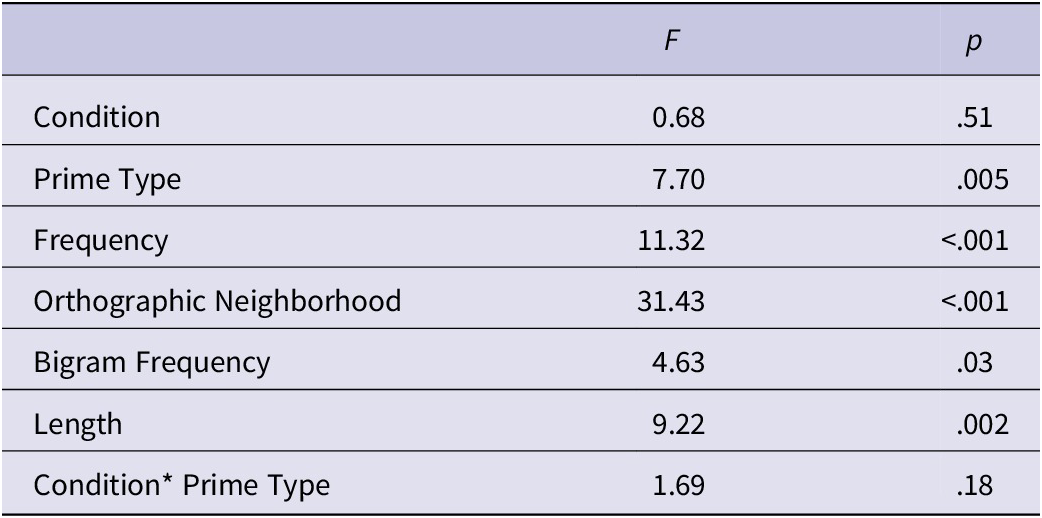
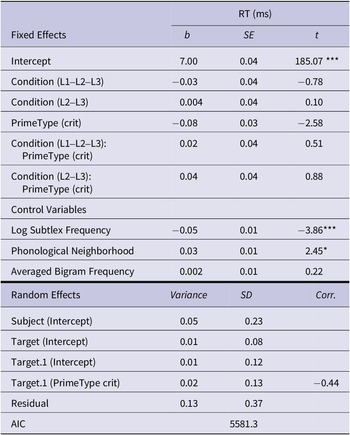
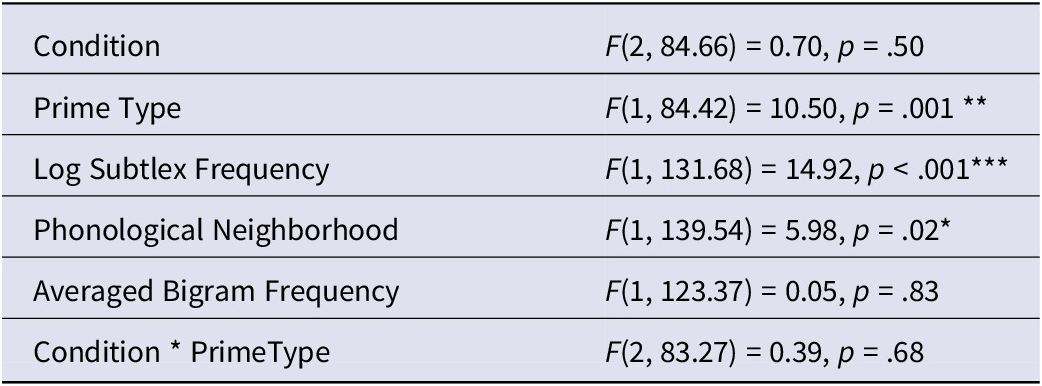
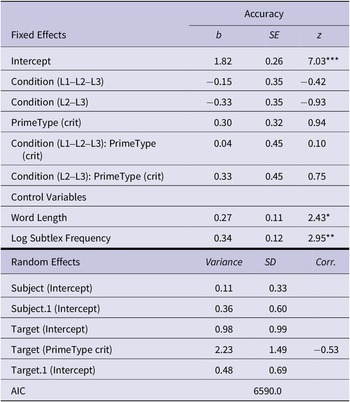
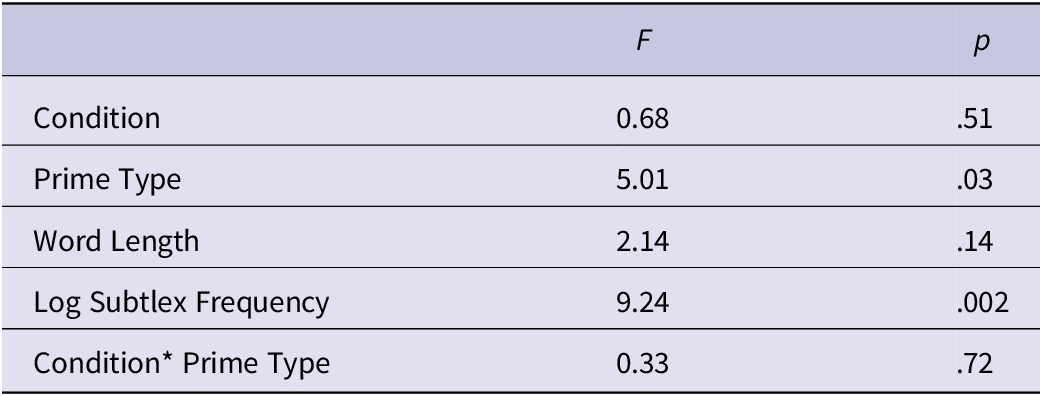
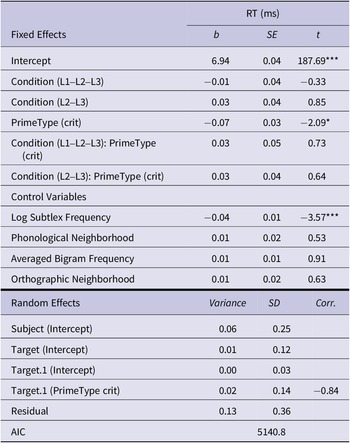
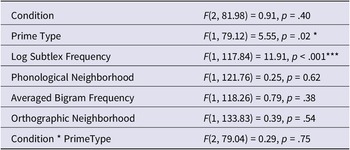

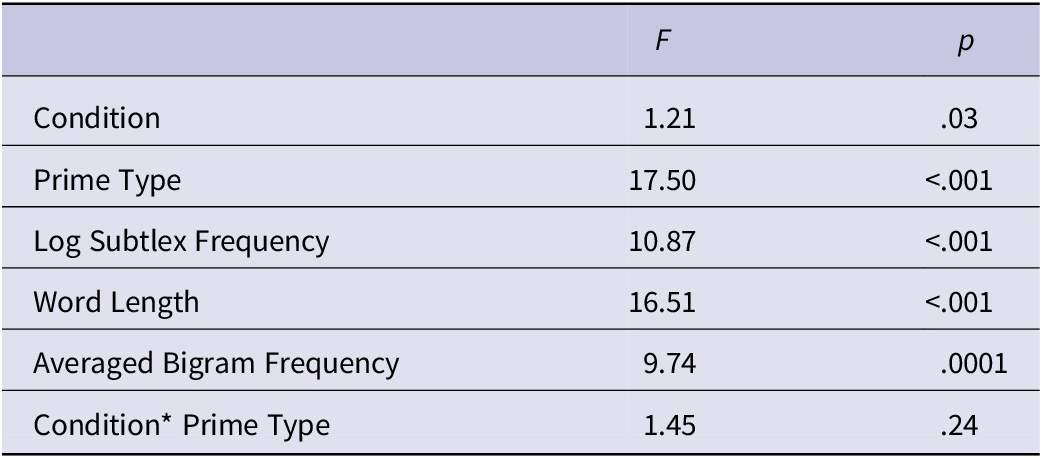

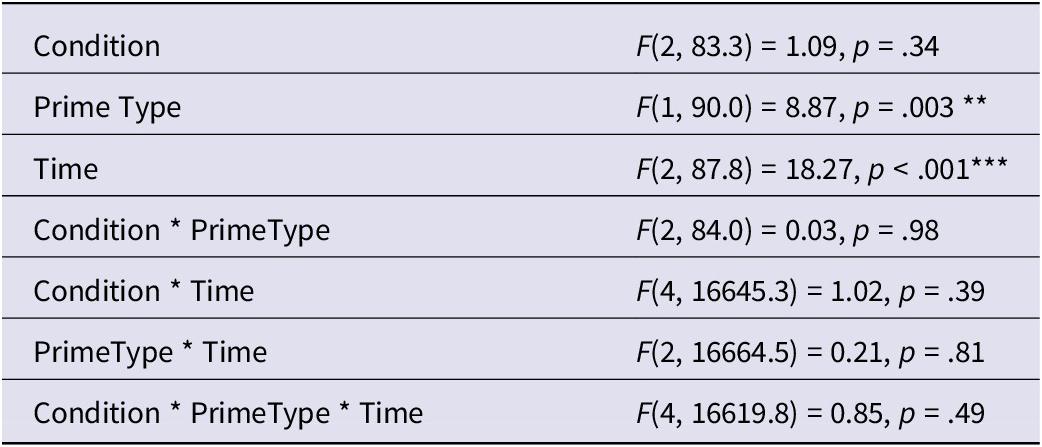
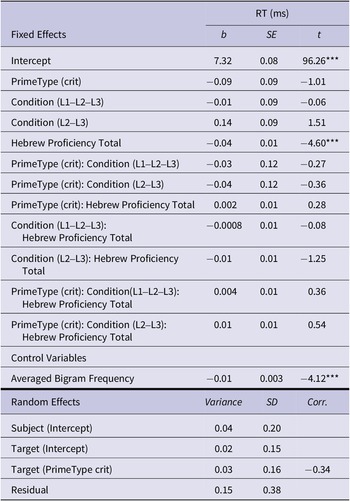
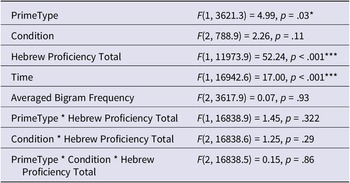
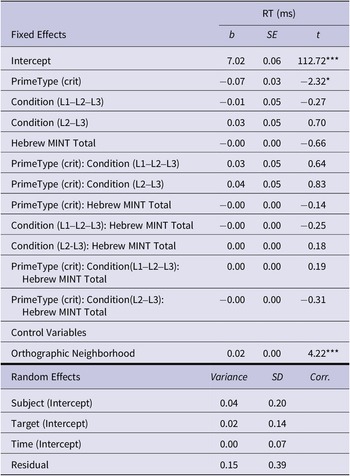

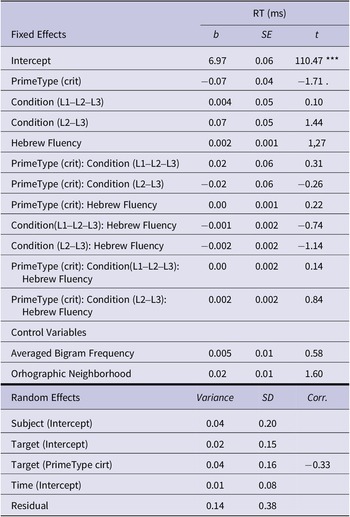
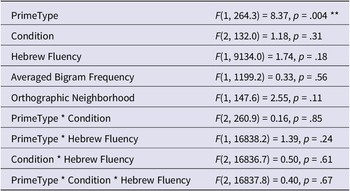


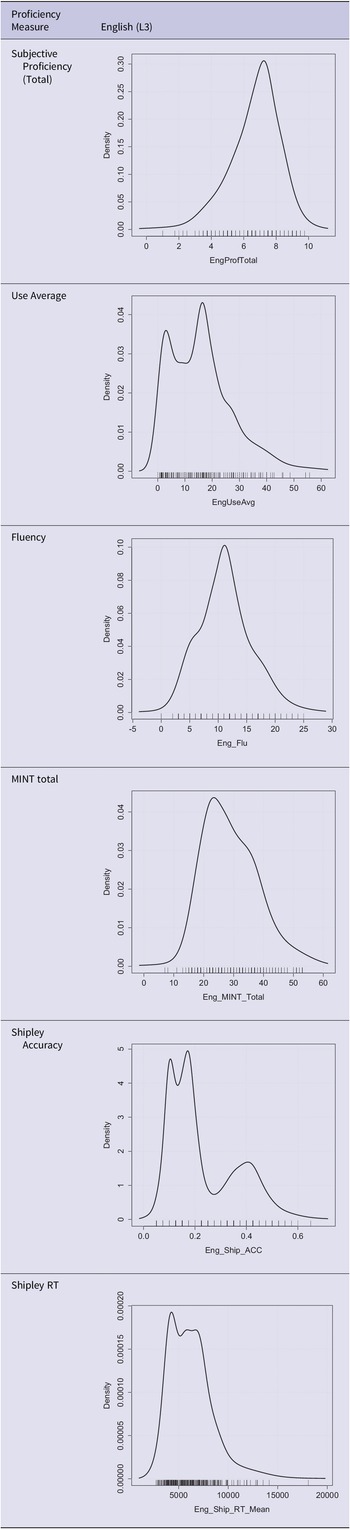


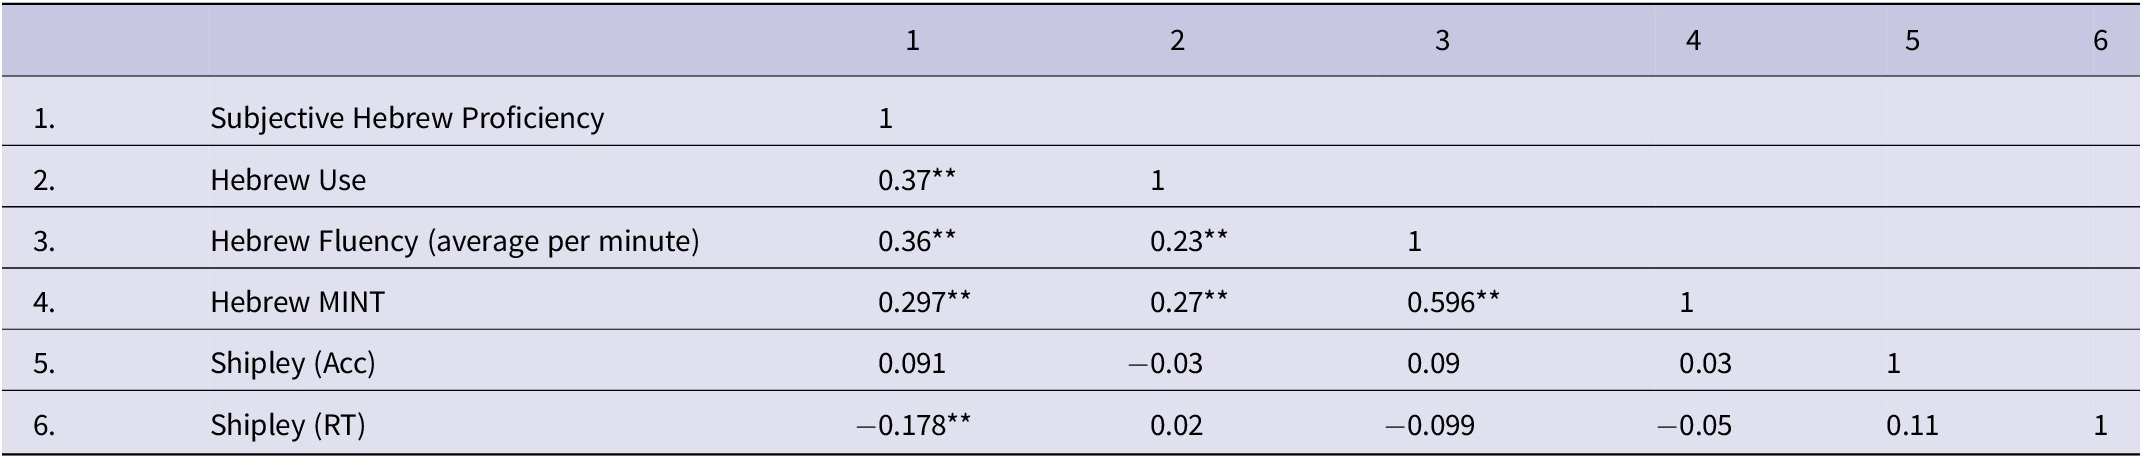
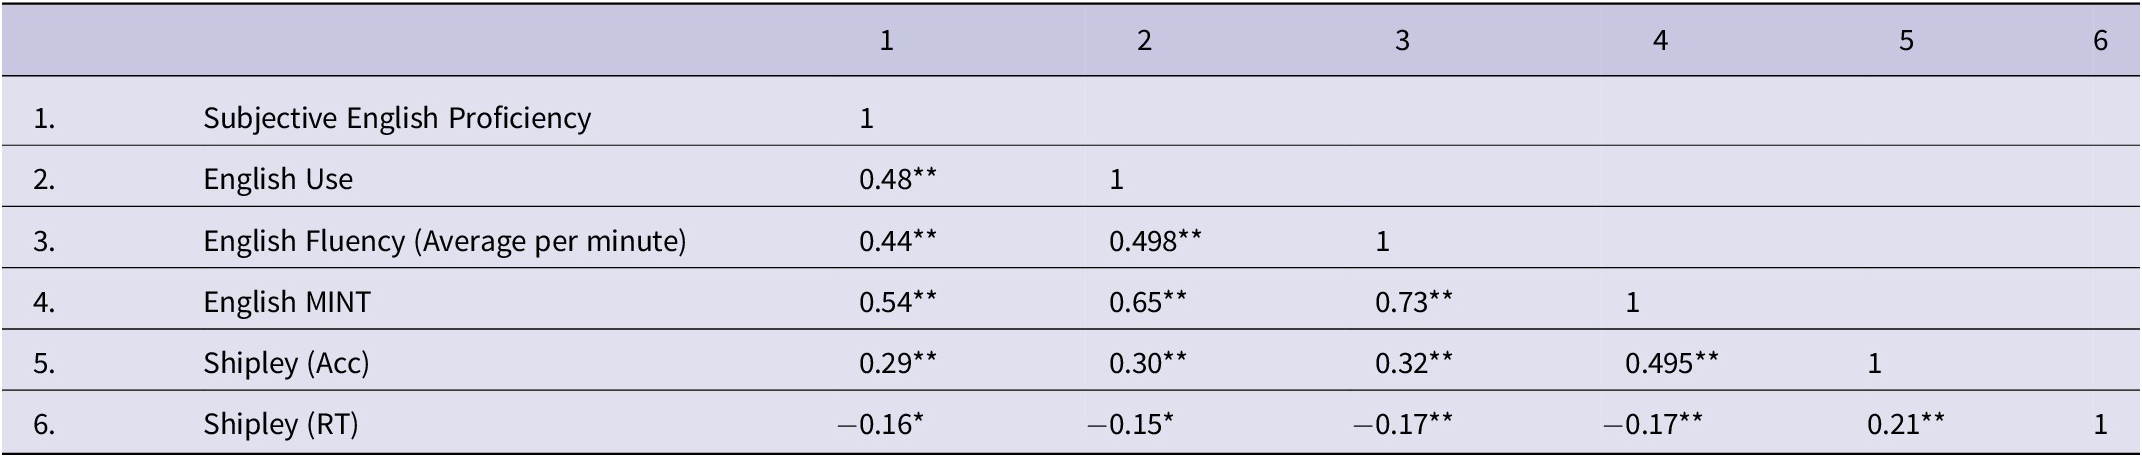

 Open access

