

1. Introduction
‘So, if introduced on a large scale, golden rice can exacerbate malnutrition and ultimately undermine food security.’ This statement by (Greenpeace, 2012: 3) is in strong contradiction to the reported impacts of vitamin A deficiency and the nutritional impacts of vitamin A enriched diets. More than 125 million children under five years of age suffer from vitamin A deficiency (VAD). Dietary VAD causes 250,000–500,000 children to go blind each year.
More than half of the children who lose their sight because of VAD die within a year of becoming blind. Additionally, VAD compromises the immune systems of approximately 40 per cent of children under the age of five in the developing world, greatly increasing the risk of severe illnesses from common childhood infections. Further health consequences include anemia, increased susceptibility to infection, and poorer growth (West and Darnton-Hill, Reference West, Darnton-Hill, Semba and Bloem2008). Additionally, early childhood malnutrition has long-lasting effects that are difficult to reverse by better nutrition in later life (World Health Organization, 2001). Addressing VAD and zinc deficiency in nutrition has been ranked by the Copenhagen Consensus (2008) as the number one problem in developing countries for sustainable economic development and was reemphasized in 2012 (Copenhagen Consensus, 2012).
There are two major channels through which nutrition may affect economic development. Malnutrition limits (labor) productivity and effects human capital accumulation. Firstly, there is convincing evidence from past experience that nutritional status affects labor outcomes, particularly productivity. While the exact mechanisms underlying these relationships are not entirely clear, experimental and observational studies have documented sizeable effects of nutrition on productivity indicators (Thomas and Frankenberg, Reference Thomas and Frankenberg2002). Fogel's (Reference Fogel1994) study of the economic and health history of Europe illustrates the aforementioned relationship. At the end of the 18th century in England and France, agricultural production, and therefore food provision, was so low that approximately 20 per cent of the population was incapable of working more than a few hours of light work per day due to lacking food resources. Many people were chronically malnourished and died young, which resulted in premature losses of their human capital. Only the agricultural productivity increases in the 19th century permitted an escape from this developmental trap, and enabled individual productivity gains as well as increases in productivity on a macroeconomic level (Deaton, Reference Deaton2003). Similarly, Doblhammer and Vaupel (Reference Doblhammer and Vaupel2001) investigate the relationship between month of birth and remaining life expectancy at age 50 in Austria, Denmark and Australia. Their results indicate that health appears to depend on factors like nutrition in utero or early childhood. These effects are attributed to the effects of intrauterine nutrition more than half a century ago, particularly to the seasonal availability of high-quality food like fresh fruit and vegetables (Deaton, Reference Deaton2003).
Secondly, malnutrition may also affect economic development indirectly via hampering cognitive abilities and human capital development. Richards et al. (Reference Richards, Hardy, Kuh and Wadsworth2002), for example, use birth weight and cognitive indicators of the British 1946 birth cohort and find that birth weight was positively associated with cognition up to age 26, and with the likelihood of obtaining advanced educational qualifications. Similarly, Currie and Hyson (Reference Currie and Hyson1999) find that malnutrition, measured by low birth weights, has significant long-term effects on health status, educational attainments and labor market outcomes. Moreover, Case and Paxson (Reference Case and Paxson2006) use stature of US and UK citizens as an indicator for their quality of diet during childhood and find that nutrition is positively associated with cognitive ability, which is rewarded in the labor market. They show that taller children have higher average cognitive test scores, and that these test scores explain a large portion of the height premium in earnings. In an historical study, Baten et al. (Reference Baten, Crayen and Voth2010) show that nutrition during early childhood mattered for labor market outcomes: individuals who grew up in times and places characterized by high food prices tended to acquire fewer cognitive skills and were more likely to pursue occupations with limited intellectual requirements.
Vitamin A enriched rice has the potential to address the problem of micronutrient deficiencies in early childhood. Rice produces β-carotene in the leaves but not in the grain, where the biosynthetic pathway is turned off during plant development. In Golden Rice, two genes have been inserted into the rice genome by genetic engineering, which would not have been possible by traditional breeding, to restart the carotenoid biosynthetic pathway leading to the production and accumulation of β-carotene in the grains. The intensity of the golden color is an indicator of the concentration of β-carotene in the endosperm. Since a prototype Golden Rice was developed in 1999, new lines with higher β-carotene content have been generated. The breeding goal is to provide the recommended daily allowance of vitamin A in 100–200 g of β-carotene containing rice. This corresponds to the amount of rice eaten daily by children living in rice-based societies, such as India, Vietnam and Bangladesh. In other countries, Golden Rice could still be a valuable complement to children's diets, thus contributing to the reduction of clinical and sub-clinical VAD-related diseases. The different forms of Golden Rice contain between 1.6 and 35 µg β-carotene per gram of rice. A recent study with children has shown that the bioavailability of provitamin A from Golden Rice is as effective as pure β-carotene in oil, and far better than spinach in providing vitamin A to children. A daily intake of 60 g of rice (half a cup) would provide about 60 per cent of the Chinese Recommended Nutrient Intake of vitamin A for 6–8-year-old children and be sufficient to prevent vitamin A malnutrition (Tang et al., Reference Tang, Qin, Dolnikoawski, Russell and Grusak2009, Reference Tang, Hu, Yin, Wang, Dallal, Grusak and Russell2012).
Despite the expected nutritional benefits of Golden Rice, the technology faces strong opposition. Opponents to the technology argue that a sufficient daily vitamin A supply would require a two-year-old child to eat about 3 kg of rice per day; alternative and cheaper strategies would exist to address VAD and in the end the project is only an industry ploy to open doors for other genetically modified (GM) crops (Greenpeace, 2005). The argument about the daily intake has been dismissed as this assumes Golden Rice would be the only source of vitamin A (Enserink, Reference Enserink2008). Suggested alternatives such as alternative diets, industrial fortification or supplements have been available for many years but have not solved the problem (Stein et al., Reference Stein, Sachdev and Qaim2008). Hence, the possibility exists that Golden Rice may reduce VAD and save millions of lives, while other strategies have not been so successful.
Proof of concept of enhancing the vitamin A content of rice has existed since the late 1990s and the expectation was that by 2002 the first commercial rice varieties would be available. Developing a commercial product has not been delayed by solving a number of intellectual property right issues. The major stumbling block was – and still is – the regulation of genetically engineered (GE) crops. In 2000, the Golden Rice project started a public–private partnership with Syngenta to use their expertise in developing dossiers for the approval requirements of GE crops to ease problems caused by national regulations. Ten years have passed and still Golden Rice has neither been approved for cultivation in India and Bangladesh, two of the target countries of the Golden Rice Humanitarian Project, nor in other countries where its varieties are under development (Potrykus, Reference Potrykus2010a, Reference Potrykusb).
Many argue that the additional regulations for approval required for GE crops compared with non-GE crops, and Golden Rice in particular, are not supported by science, and hence are overregulated. Justification for current regulation is based on the notion that the technology leads to ‘unpredictable and uncontrolled modification of the genome’; this argument ignores the fact that all traditional breeding has been and is doing exactly the same (Baudo et al., Reference Baudo, Lyons, Powers, Pastori, Edwards, Holdsworth and Shewry2006; Shewry et al., Reference Shewry, Baudo, Lovegrove and Powers2007; Batista et al., Reference Batista, Saibo, Lourenco and Oliveira2008; Herman et al., Reference Herman, Chassy and Parrott2009). Although there have been studies showing the safety consequences of GM crops for rats, a careful assessment of those studies did not confirm the claims being made. Further, extensive reviews found no support for adverse human health effects from GM crops (Bennett et al., Reference Bennett, Chi-Ham, Barrows, Sexton and Zilberman2013). Developing Golden Rice requires the use of selectable marker genes. Regulatory authorities prefer that antibiotic selectable marker genes be deleted (e.g., Committee on Agriculture, 2012). This is technically possible, but requires substantial time and effort despite the fact that there is a wealth of scientific literature documenting that the antibiotic marker genes in use have no effect on consumer and environmental safety (Ramessar et al., Reference Ramessar, Peremarti, Gomez-Galera, Naqvi, Moralejo, Munoz, Capell and Chritou2007). Furthermore, requests for additional regulation are often based on the precautionary principle, while a strong interpretation of the precautionary principle has been shown to be a logically inconsistent line of reasoning for extra regulation (van den Belt, Reference van den Belt2003),Footnote 1 while there is wide agreement among economists that optimal regulations related to food and environmental safety should be based on benefit-costs analyses (Arrow et al., Reference Arrow, Cropper and Eads1996). Even the definition of what constitutes a GE crop is controversial from a scientific point of view (Herring, Reference Herring2007).
Ex ante assessments have been done for Golden Rice in India (Stein et al., Reference Stein, Sachdev and Qaim2008) and the Philippines (Zimmermann and Qaim, Reference Zimmermann and Qaim2004). These studies show that in India the costs per disability-adjusted life year (DALY) saved between US$3.1 and US$19.4: much lower than for alternative intervention strategies. The net social benefits for the Philippines have been calculated to be in the range of US$16 to US$88 million per year. These numbers are now expected to be on the lower side of this range as only direct health impacts have been considered and improvements in vitamin A enhanced rice breeding since 2004 were not included.
Despite the wealth of information available about the health benefits of Golden Rice, national governments, which are bound by the rules and regulations on the use of GE crops, are reluctant to approve its introduction (Potrykus, Reference Potrykus2010a, Reference Potrykusb).
The objectives of this paper are to identify the costs and benefits of regulating Golden Rice, paying particular attention to possible overregulation, and to calibrate the model for Golden Rice in India. The simple model we present considers uncertainties related to the perceived costs by national governments of the technology and approval time, i.e., over time, additional information becomes available. This allows us to identify the costs of delaying the approval and in particular the perceived costs by national regulators equivalent to the costs imposed on society by the opposition to Golden Rice. Alternatively, ex ante assessments show substantial benefits of Golden Rice, but governments are still reluctant to approve the techno-logy. Hence, there must be additional perceived costs for governments not approving the technology. This is the first study calculating those costs for the case of India. These perceived costs have been treated as being irreversible for being cautious. Hence, the opportunity to introduce Golden Rice has been valued following the quasi-option-value approach introduced by Arrow and Fisher (Reference Arrow and Fisher1974). Arrow and Fisher, among others (e.g., Dixit and Pindyck, Reference Dixit and Pindyck1994; Wesseler, Reference Wesseler2009), show that decisions under uncertainty and irreversible benefits and costs either understate or overstate net benefits if irreversibility effects are ignored.
Results show that it pays to bring forward new arguments against the introduction of Golden Rice when the technology is close to being approved. The Indian case shows that the perceived costs by national governments are substantially larger than the costs of introducing Golden Rice, and has caused and continues to cause the death of thousands of children.
2. The real option model of perceived costs
The problem is described as follows. A benevolent developer of a vitamin A biofortification strategy in the form of Golden Rice, henceforth called the Golden Rice strategy (GRS) such as, for example, the ‘Humanitarian Golden Rice’ project, provides the technology for free. The benefits of the program are known to the developer as well as the national government and depend on the government's implementation strategy, the costs of which are known. The acceptance of the technology depends on national governments. The introduction of the GRS (the implementation strategy) costs the national government one-off administrative set-up costs and annual costs of running the strategy. This set-up serves as the reference model. If the benefits outweigh the costs of the GRS, a welfare maximizing regulator would implement the GRS. It is well known in the literature that regulators, other government agencies or governments in general do not follow this simple benefit-cost metric. Their objective function may not only be based on the direct benefits and costs of the GRS. A number of political economy models have been developed to analyze policies related to the introduction of GE crops in more detail considering two or more lobby groups (e.g., Graff et al., Reference Graff, Hochman and Zilberman2009; Swinnen and Vandemoortele, Reference Swinnen and Vandemoortele2010) and the role of media (Vigani and Olper, Reference Vigani and Olper2014). Apel (Reference Apel2010) has argued that an anti-genetically modified organism (GMO) strategy has been a successful fundraising strategy for environmental lobby groups such as Greenpeace or Friends of the Earth. The role of anti-GMO lobby groups and their strong influence on decision making, particularly in developing countries, has been well described by political scientists (e.g., Paarlberg, Reference Paarlberg2008; Herring, Reference Herring2010). Lobby groups with capital stocks at risk in the face of agricultural innovations use the political systems to protect their interests (Graff et al., Reference Graff, Hochman, Zilberman and Herring2013). Decision makers may consider the arguments raised by opponents for reasons of re-election, administrative power, budgetary power, side-payments and more. In the end, whatever the specific reasons might be and whatever the detailed political economy process may look like, the final result is that decision makers take additional costs into account that result in the delay of the approval.Footnote 2 These costs we call the perceived costs – a term we use as those costs cannot be observed directly, and are a result of the political economy process of the regulatory decision.
If the inclusion of the perceived costs results in the delay of an approval, benefits of the GRS are foregone. We call the foregone benefits caused by a delay in approval the economic power of the opposition to a GRS.
We now develop the model to assess the economic power in more detail.
The approval decision by the national government is exogenous to the developer as are the set-up and annual costs. At time t = 0 the government's view is that perceived costs, G c , of introducing the GRS exist and they are high, G c ≫0, while other benefits and costs discussed in more detail below are assumed to be known. This assumption is a simplification but can be justified by the studies investigating the costs and benefits of introducing the GRS. Hence, all remaining uncertainty is summarized under perceived costs. Over time, further information about the perceived costs arrive and at time κ either the strategy will be successful and perceived costs not be confirmed, G c = 0 with probability q, or confirmed to be high, G c ≫0 with probability (1 – q). Hence, the introduction mainly depends on the perceived costs of implementing the GRS. Based on that, the national government may decide the strategy will be introduced immediately (I) or postponed (P). Uncertainty about perceived costs will be resolved at some future point in time κ > 0. At κ > 0 the national government will know whether or not their perceived costs have been confirmed. At time t = 0 the arrival of κ > 0 is uncertain to the government and hence a random variable. k ∈ (0,∞) is the date at which uncertainty about perceived costs is resolved; it follows from the exponential distribution f(κ) = he −hκ (Taylor and Karlin, Reference Taylor and Karlin1984), with E(κ) = 1/h, where h is the hazard rate.Footnote 3
This specification is not that restrictive as it will allow identifying threshold levels for perceived costs as shown below. The specification of the model considers the inherent uncertainty decision makers face as well as the fact that new information arrives over time, but that the specific point in time when information will be available is uncertain.
The health benefits of introducing the GRS are in the form of improved vitamin A supply. These benefits increase over time via the distribution of the seeds. As commonly done, we assume a logistic functional form for the diffusion of the Golden Rice seed $\lpar t\rpar = {\rho_{max} \over 1 + exp \lpar -\alpha_{\rho} - \beta_{\rho}t\rpar }$
, where the slope parameter βρ is known as the natural rate of diffusion, as it measures the rate at which adoption ρ increases with time t. The parameter αρ is a constant of integration and the ceiling ρ
max
is the long-run upper limit on adoption. Benefits do follow a similar logistic pattern to the adoption curve ρ (t) with parameters α
b
, β
b
and ρ
max
. The health benefits are divided into annual irreversible, i
b
, and reversible, r
b
, health benefits with subscript b for benefits. Irreversible benefits refer to the benefits for children that in case of VAD could not be reversed in later life, such as premature death, blindness, stagnant growth, and cognitive capabilities, while reversible benefits refer to VAD symptoms that can be cured or at least reduced at every stage of life via an increase in vitamin A supply, such as diarrhea or infections like measles (West and Darnton-Hill, Reference West, Darnton-Hill, Semba and Bloem2008). We have for the annual irreversible benefits
$\lpar t\rpar = {\rho_{max} \over 1 + exp \lpar -\alpha_{\rho} - \beta_{\rho}t\rpar }$
, where the slope parameter βρ is known as the natural rate of diffusion, as it measures the rate at which adoption ρ increases with time t. The parameter αρ is a constant of integration and the ceiling ρ
max
is the long-run upper limit on adoption. Benefits do follow a similar logistic pattern to the adoption curve ρ (t) with parameters α
b
, β
b
and ρ
max
. The health benefits are divided into annual irreversible, i
b
, and reversible, r
b
, health benefits with subscript b for benefits. Irreversible benefits refer to the benefits for children that in case of VAD could not be reversed in later life, such as premature death, blindness, stagnant growth, and cognitive capabilities, while reversible benefits refer to VAD symptoms that can be cured or at least reduced at every stage of life via an increase in vitamin A supply, such as diarrhea or infections like measles (West and Darnton-Hill, Reference West, Darnton-Hill, Semba and Bloem2008). We have for the annual irreversible benefits $i_{bt}\lpar t\rpar = {i_{bmax} \over 1+exp\lpar -\alpha_{b}-\beta_{b}t\rpar }$
and annual reversible benefits
$i_{bt}\lpar t\rpar = {i_{bmax} \over 1+exp\lpar -\alpha_{b}-\beta_{b}t\rpar }$
and annual reversible benefits $r_{bt}\lpar t\rpar = {r_{bmax} \over 1+exp\lpar -\alpha_{b}-\beta_{b}t\rpar }$
. We get for the total irreversible benefits I
b
= ∫0
∞
i(t)e
−μt
dt and for the total reversible benefits R
b
= ∫0
∞
r(t)e
−μt
dt, where μ is the discount rate. From this we can deduct the average annual irreversible health benefits, i
b
= I
b
μ and the average annual reversible health benefits, r
b
= R
b
μ.
$r_{bt}\lpar t\rpar = {r_{bmax} \over 1+exp\lpar -\alpha_{b}-\beta_{b}t\rpar }$
. We get for the total irreversible benefits I
b
= ∫0
∞
i(t)e
−μt
dt and for the total reversible benefits R
b
= ∫0
∞
r(t)e
−μt
dt, where μ is the discount rate. From this we can deduct the average annual irreversible health benefits, i
b
= I
b
μ and the average annual reversible health benefits, r
b
= R
b
μ.
The present value of the GRS benefits can be written as
 $$B\lpar I_{b}\comma \; R_{b}\comma \; t\rpar = I_{b}\lpar i_{b}\comma \; t\rpar + R_{b}\lpar r_{b}\comma \; t\rpar = \vint_0^{\infty} i_{b} e^{-\mu t}dt + \vint_0^{\infty} r_{b} e^{-\mu t}dt.$$
The costs of introducing the GRS from the government perspective include irreversible one-time administrative set-up costs for starting the GRS campaign, I c , average annual reversible costs for running the campaign, r c , and additional irreversible perceived costs of the GRS, G c , with subscript c for indicating costs:
 $$C\lpar I_{c}\comma \; R_{c}\comma \; G_{c}\comma \; t\rpar = I_{c}+R_{c}+G_{c} = I_{c}+G_{c}+\vint_0^{\infty} r_{c} e^{-\mu t} dt.$$
The state of nature and related benefits and costs the government faces can be summarized as follows:
The net-present-value (NPV) of immediate introduction at t = 0 with subscript I for immediate:
 $$NPV\lpar GRS_{I}\rpar = I_{b} - I_{c} - G_{c} + \vint_0^{\infty} \lpar \lpar r_{b}-r_{c}\rpar e^{-\mu t}dt\rpar$$
 $$NPV\lpar GRS_{I}\rpar = I_{b} - I_{c} - {G}_{c} + {\lpar r_{b}-r_{c}\rpar \over \mu}.$$
Postponed introduction but perceived costs are not correct, valued at t = 0 with subscript P for postponed and subscript e for error:
 $$NPV\lpar GRS_{Pe}\rpar = q\vint_0^{\infty} \left(\lpar I_{b}-I_{c}\rpar e^{-\mu\kappa} + \vint_{\kappa}^{\infty} \lpar r_{b}-r_{c}\rpar e^{-\mu t} dt\right)f\lpar \kappa\rpar d\kappa\comma \;$$
 $$= q{\lpar B-I_{c}-R_{c}\rpar h \over \mu +h}.$$
Postponed introduction but perceived costs are correct with subscript ne for no error:
 $$NPV\lpar GRS_{Pne}\rpar = \lpar \lpar 1-q\rpar \lsqb 0\rsqb \vert B \lt C_{ne}\rpar = 0\comma \;$$
where subscript ne indicates that the perceived costs in this case are at least as high that B < C ne holds.
The value of a postponed GRS valued at t = 0 is
 $$NPV\lpar GRS_{P}\rpar = max\lsqb NPV\lpar GRS_{Pe}\rpar \comma \; 0\rsqb.$$
Considering this setting, the developer faces two possibilities: either the GRS will be introduced immediately or postponed until time κ has arrived. On the one hand, the immediate introduction bears the risk that the GRS results in high perceived costs G c . On the other hand, postponing the GRS might cause foregone benefits of saved lives and health, NPV(GRS I ) − NPV(GRS P ). If the decision is postponed, the regulator gains additional information about the perceived costs and will know the true costs of implementing the GRS. Hence, the net benefits depend on weighing the benefits and costs of immediate against postponed introduction. Under this setting, whether or not the GRS will be introduced at time κ provides the following option value of the GRS strategy:
 $$F\lsqb NPV\lpar GRE\rpar \rsqb = max \lsqb NPV\lpar GRS_{I}\rpar \comma \; NPV\lpar GRS_{P}\rpar \rsqb.$$
The set-up allows us to identify the threshold when a national government might immediately introduce the GRS, which is NPV(GRS I ) − NPV(GRS P ) > 0, and yields:
 $$B-C-q \left({\lpar I_{b}-I_{c}+R_{b}-R_{c}\rpar h \over \mu +h}\right)\gt 0.$$
Solving for B:
 $$B \gt \lpar I_{c} + R_{c}\rpar + {\mu +h \over \mu +\lpar 1 - q\rpar h} G_{c} = B^{\ast}.$$
And solving for G c :
 $$G_{c} \lt NPV_{G} {\mu +\lpar 1 - q\rpar h \over \mu + h} = G_{c}^{\ast}\comma \;$$
where NPV G = B − I c − R c .
According to the result of equation (9), immediate introduction of the GRS will be economical if the reversible and irreversible benefits are larger than the irreversible and reversible costs plus the irreversible perceived costs of introducing GRS weighted by the leverage factor ${\mu+h \over \mu + \lpar 1-q\rpar h} \gt 1$
. The first part of the right-hand side of equation (9) captures the standard costs as part of a benefit-cost analysis; the second part adds the perceived costs. One unit of perceived irreversible costs of introducing the GRS weighs more than one unit of other costs. This can be explained by the fact that G
c
is uncertain, and due to the uncertainty about the perceived costs those costs weigh more than the other costs. This is an effect well known within the real option literature on regulation (e.g., Hennessy and Moschini, Reference Hennessy and Moschini2006; Ansink and Wesseler, Reference Ansink and Wesseler2009).
${\mu+h \over \mu + \lpar 1-q\rpar h} \gt 1$
. The first part of the right-hand side of equation (9) captures the standard costs as part of a benefit-cost analysis; the second part adds the perceived costs. One unit of perceived irreversible costs of introducing the GRS weighs more than one unit of other costs. This can be explained by the fact that G
c
is uncertain, and due to the uncertainty about the perceived costs those costs weigh more than the other costs. This is an effect well known within the real option literature on regulation (e.g., Hennessy and Moschini, Reference Hennessy and Moschini2006; Ansink and Wesseler, Reference Ansink and Wesseler2009).
Equivalently, equation (10) shows that fewer perceived costs will be needed to outweigh the benefits minus the other reversible and irreversible costs for explaining a delay in approval. Using this equation, we can identify a minimum value for the economic power of the opposition towards the GRS.
We can compare these results with three alternative specifications for identifying the relative importance of uncertainty about perceived costs and uncertainty about the arrival date of information or date of decision: no uncertainty, uncertainty about approval date only, and uncertainty about perceived costs only. The first specification excludes any uncertainty, the approval will only be delayed, and at approval time a, G C will be zero. As in the previous specification, known benefits and costs remain constant over time. In this case the threshold value G cn * with subscript n for no uncertainty yields:
 $$G_{cn}^{\ast} = NPV_{G} \left({e^{\mu a}-1 \over e^{\mu a}}\right).$$
The second specification adds uncertainty over the delay of approval. In this case the threshold value G ch * with subscript h for uncertainty about approval date yields:
 $$G_{ch}^{\ast} = NPV_{G}\left({\mu \over \mu +h}\right).$$
The third specification includes uncertainty about perceived costs only, the approval decision will only be delayed to a future point in time a, but from today's perspective the perceived costs will not be confirmed with probability q. This yields, for the threshold value of G cq * with subscript q for uncertainty about the presence of perceived costs,
 $$G_{cq}^{\ast} = NPV_{G} \left({e^{\mu a}-q \over e^{\mu a}} \right).$$
Comparing equations (10) to (13) we can observe that including uncertainty about the approval date results in the lowest threshold value for perceived costs as long as $e^{\mu a} \gt {\mu +h \over h}$
followed by excluding any uncertainty, whereas considering uncertainty about perceived costs only results in a higher threshold than considering uncertainty about perceived costs in combination with uncertainty about the arrival time of additional information about whether or not the perceived costs will be confirmed. While the differences between equation (11) and (12), and (10) and (13) are substantial for q = 0.5, the differences between equation (10) and (13), and equation (11) and (12) are less pronounced and for some parameter values may even be reversed. In essence, ignoring any uncertainty substantially undervalues the perceived costs, while ignoring uncertainty about decision dates slightly overvalues the perceived costs. This will become more obvious in section 3 where the model will be calibrated for the case of India.
$e^{\mu a} \gt {\mu +h \over h}$
followed by excluding any uncertainty, whereas considering uncertainty about perceived costs only results in a higher threshold than considering uncertainty about perceived costs in combination with uncertainty about the arrival time of additional information about whether or not the perceived costs will be confirmed. While the differences between equation (11) and (12), and (10) and (13) are substantial for q = 0.5, the differences between equation (10) and (13), and equation (11) and (12) are less pronounced and for some parameter values may even be reversed. In essence, ignoring any uncertainty substantially undervalues the perceived costs, while ignoring uncertainty about decision dates slightly overvalues the perceived costs. This will become more obvious in section 3 where the model will be calibrated for the case of India.
2.1. Regulations and delay strategies
The result of equation (9) also provides economic insight into the success of delay strategies of opponents to the GRS. One might be surprised by the fact that technology of this kind will not immediately be introduced but delayed by several means. Many developing countries either have or are discussing additional regulations for the approval of GE seed varieties. Most countries including those targeted for VAD have stringent biosafety regulations for the approval of GM crops (Paarlberg, Reference Paarlberg2008). The compliance with those regulations costs additional time and delays introduction. Take as an example India, whose government implemented a working group to assess biotechnology, which recommended that the Indian Government ban all GM food crops from cultivation, thereby stirring a debate about the approval process of GM crops.
By looking at equation (9), an increase in $h \lpar \partial \lpar {\mu +h \over \mu + \lpar 1 - q\rpar h}\rpar /\partial h \gt 0\rpar $
, equivalent to availability of information about the perceived costs will soon become available, increases the weight of the perceived costs. In this sense, it pays for opponents to again raise concerns about perceived costs via different forms of protest or new but often unfounded claims about negative implications, when a decision to introduce the GRS is soon to be made. This is observed not only for Golden Rice, but in general for the approval of GE crops in many developing countries (e.g., Paarlberg, Reference Paarlberg2008 for Africa; Herring, Reference Herring2010, Reference Herring2012 for India) as well as the European Union (Herring, Reference Herring2007; Wesseler et al., Reference Wesseler, Leimgruber and Smart2012).
$h \lpar \partial \lpar {\mu +h \over \mu + \lpar 1 - q\rpar h}\rpar /\partial h \gt 0\rpar $
, equivalent to availability of information about the perceived costs will soon become available, increases the weight of the perceived costs. In this sense, it pays for opponents to again raise concerns about perceived costs via different forms of protest or new but often unfounded claims about negative implications, when a decision to introduce the GRS is soon to be made. This is observed not only for Golden Rice, but in general for the approval of GE crops in many developing countries (e.g., Paarlberg, Reference Paarlberg2008 for Africa; Herring, Reference Herring2010, Reference Herring2012 for India) as well as the European Union (Herring, Reference Herring2007; Wesseler et al., Reference Wesseler, Leimgruber and Smart2012).
3. Calibration of the model: the foregone benefits
The previous results will be used to quantify the foregone benefits of a delayed introduction of the GRS as well as the perceived costs by the Government of India. The model will be calibrated for India thanks to the study by Stein et al. (Reference Stein, Sachdev and Qaim2008), in which detailed information about potential benefits and costs of the GRS for India are available. We consider the time period from 2002 when the technology was available and could have been introduced. For the purpose of our analysis, irreversible and reversible benefits and costs have been calculated based on (Stein, Reference Stein2006; personal communication, 2013) and Stein et al. (Reference Stein, Sachdev and Qaim2008), while the numbers employed for the ‘pessimistic scenarios’ have been on the lower side.
The benefits of the GRS are the reduced health costs of VAD. Those benefits, similar to other health benefits, are commonly assessed by calculating the DALYs (Murray and Lopez, Reference Murray and Lopez1996). The current burden of VAD has been calculated with about 2.3 million DALYs per year (over a 10-year period: about 23 million DALYs ignoring changes in the Indian population) (Stein et al., Reference Stein, Sachdev and Qaim2008, table 4). These include the burden of night blindness, corneal scars, blindness caused by corneal scars, measles and mortality of children five years old and younger, and night blindness for pregnant and lactating women. Corneal scars and blindness caused by corneal scars of children five years old and younger are VAD-related burdens that cannot be reversed and are considered to be irreversible. Reducing those burdens through the GRS is an irreversible benefit. Further, reducing child mortality through the GRS has been considered an irreversible benefit too; according to the numbers provided by (Stein, Reference Stein2006, table A3), this amounts to about 71,600 child deaths annually.
The other health burdens can be reduced through the GRS. The benefits can be considered to be reversible as they normally do not result in health problems in later life. Using the information provided by Stein (Reference Stein2006), the share of irreversible and reversible health benefits can be calculated. About 74.4 and 25.6 per cent of the health benefits can be considered to be irreversible and reversible, respectively. Please note that the absolute numbers are on the lower side as a number of health effects for which a causal link has not yet been fully established have not been considered, such as stunted growth. Further, as an economic value of a DALY, a rather low value of US$500 has been used in the study. A low value can be justified in order not to overestimate the benefits of the GRS, but places a low value on the average statistical value of life and higher values would further increase the economic benefits of a GRS.Footnote 4
On the costs side, a number of cost items have been discussed within the literature. These include research and development costs at the international and national level but also costs for launching a media campaign to introduce the GRS and annual costs for maintenance breeding. While the costs for the media campaign will definitely arise and will be additional costs for the government, the annual costs for maintenance breeding are less obvious if they are additional. The media campaign, called social marketing, will be needed at the beginning when the GRS is introduced. The costs are treated as irreversible as they are sunk and will not matter at a later stage whether or not to continue the GRS, while the maintenance breeding costs still matter. Maintenance breeding by national agriculture research centers is a regular activity. If the Golden Rice trait were to be been introduced in Indian rice lines, they would be part of the ongoing maintenance breeding and additional costs would not arise. On the other hand, one can argue that the efforts for maintenance breeding might increase as the number of rice lines has increased. Therefore cost for maintenance breeding has been considered and treated as annual reversible costs. According to Stein (personal communication, 2013), these costs have been assessed to be about US$15,553,610 and about US$125,000 for the social marketing and the additional annual maintenance breeding costs, respectively. Table 1 summarizes the benefits and costs used for the assessment.
DALYs, benefits and costs of a Golden Rice Strategy to address Vitamin A deficiency in India, costs of delay, and minimum perceived costs

Notes: a DALY not discounted.
Using the benefits and costs provided under the ‘pessimistic scenario’, implying a low impact of the GRS, provides a net-present-value for NPV(GRS I ) (number in thousand US$):Footnote 5
 $$\eqalign{NPV\lpar GRS_{I}\rpar & = 2\comma \; 071\comma \; 601 - 15\comma \; 554 - G_{c} + 711\comma \; 999 - 4\comma \; 292 \cr & = 2\comma \; 763\comma \; 755 - G_{c}.}$$
The value for $NPV\lpar GRS_{P}\rpar = q{\lpar B-I_{c}-R_{c}\rpar h \over \mu+h}$
, using a value for h of 0.1, equivalent to an expected decision being made after 10 years, value for q of 0.5, and a discount rate of three per cent in discrete time (2.955 per cent in continuous time) as also used by Stein (Reference Stein2006) and commonly done for such kinds of health benefit assessments, provides the following result in US$:
$NPV\lpar GRS_{P}\rpar = q{\lpar B-I_{c}-R_{c}\rpar h \over \mu+h}$
, using a value for h of 0.1, equivalent to an expected decision being made after 10 years, value for q of 0.5, and a discount rate of three per cent in discrete time (2.955 per cent in continuous time) as also used by Stein (Reference Stein2006) and commonly done for such kinds of health benefit assessments, provides the following result in US$:
 $$\eqalign{NPV\lpar GRS_{P}\rpar & = 0.5\lpar 2\comma \; 071\comma \; 601 - 15\comma \; 554 + 711\comma \; 99 - 4\comma \; 292\rpar {0.1 \over 0.02955 + 0.1} \cr NPV\lpar GRS_{P}\rpar & = 1\comma \; 066\comma \; 602\comma \; 416.}$$
Using equation (10), the critical value G C * in US$:
 $$\eqalign{G_{c}^{\ast} & = \lpar B-I_{c}-R_{c}\rpar {\mu +\lpar 1-q\rpar h \over \mu+h}\cr & = 2\comma \; 763\comma \; 755 {0.02955+0.5\cdot 0.1 \over 0.03+0.1} = 1\comma \; 697\comma \; 152\comma \; 214.}$$
This threshold level of about US$1.7 billion is substantial, or if annualized over a 10-year period is about US$199 million per year, and is an indicator of the economic power of GMO opposition in India. This is a minimum value as this only indicates what perceived costs at least have to be in order to explain a delay in approval following the specification of the model.
A comparison with the two alternative specifications discussed in section 2 provides the following threshold value in case of no uncertainty by using equation (11):
 $$G_{cn}^{\ast} = NPV_{G}\left({e^{\mu a}-1 \over e^{\mu a}}\right)= 2\comma \; 763\comma \; 755 \left({e^{0.2955}-1 \over e^{0.2955}}\right)= 707\comma \; 261\comma \; 628$$
In case of uncertainty with respect to the approval date only provides the following threshold value in US$ by using equation (12):
 $$G_{ch}^{\ast} = NPV_{G} \left({\mu \over \mu +h}\right)= 2\comma \; 763\comma \; 755 \left({0.02995 \over 0.02995+0.1} \right)= 630\comma \; 549\comma \; 798.$$
In case of uncertainty with respect to the perceived costs only provides the following threshold value in US$ by using equation (13):
 $$G_{cq}^{\ast} = NPV_{G} \left({e^{\mu a} - q \over e^{\mu a}} \right)= 2\comma \; 763\comma \; 755 \left({e^{0.2955} - 0.5 \over e^{0.2955}} \right)= 1\comma \; 735\comma \; 508\comma \; 129.$$
The differences in the weighing factors between the four specifications are substantial when comparing the results of equation (16) to (19). The weighing factor in equation (17) is 0.26 and 0.23 in equation (18), while in equation (16) the factor is 0.61 and 0.63 in equation (19). The difference in the weighing factors between equation (17) and (18), and equation (16) and (19) is a factor ranging between 2.40 and 2.75; the difference between these sets of equations is less pronounced with a factor of 1.12 and 1.02, respectively. A summary and comparison of the results with respect to the different model specification is provided in table 2.
Results of different model specifications

Notes: a G ch *, alternative specification with uncertainty about approval date and no uncertainty about perceived costs; G cn *, alternative specification with no uncertainty about perceived costs and approval date; G c *, specification with uncertainty about perceived costs and uncertainty about arrival date of information about perceived costs; G cq *, alternative specification with uncertainty about perceived costs but certain arrival date of confirmation.
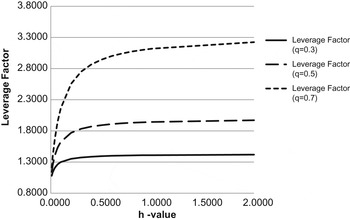
The results also illustrate the importance of information timing. The importance of perceived costs increases the sooner the date of new information arrives (figure 1). We can observe a sharp increase in the leverage effect for values of h below about 0.5 (two years). Figure 1 and equation (10) show that the leverage effect increases with an increase in q.
Increase in leverage factor with a decrease in arrival time of new information for different q-values (μ = 0.03)
The reported results are the minimum amount based on the pessimistic or worst case scenario reported by Stein et al. (Reference Stein, Sachdev and Qaim2008), who also report benefits and costs for an optimistic scenario. In that case the threshold level increases to about US$11.6 billion, or if annualized over a 10-year period to about US$1,360 million per year.Footnote 6
4. Discussion and conclusion
Nutritional and economic ex ante assessment studies of a GRS have shown that Golden Rice can reduce VAD-related mortalities and diseases at less cost than alternative strategies discussed in the literature. Previous studies for India have shown that about 204,000 life years can be saved annually. Golden Rice was expected to be introduced in 2002. Golden Rice has not yet been approved in any country, including India. According to our calculations, the delay over the last 10 years has caused losses of at least 1,424,680 life years for India, ignoring indirect health costs of VAD.
The differences in net present value from a 10-year delay are about US$707 million. This difference does not fully capture the minimum amount of perceived costs that the Government of India places on the introduction of a GRS. Considering uncertainty and irreversibility substantially increases the minimum amount of these perceived costs. Our calculation shows that the additional perceived costs by the Government of India are at least US$1.7 billion (about US$199 million annually).
This is a substantial amount and reflects the economic power of the opposition against the introduction of Golden Rice and explains why it is more difficult to convince regulators when a strong vocal opposition exists that mainly stirs uncertainty about the GRS.
The comparison with alternative specifications shows that uncertainty about the irreversible costs is economically substantially more important than uncertainty about a specific date. Understanding and quantifying the causes of uncertainty about irreversible costs seems to be economically more important for assessing decision making than uncertainty with respect to the timing of decision making or the arrival of new information in general. Uncertainty with respect to the arrival of new information κ has been modeled by using an exponential distribution, which is memoryless and hence constant with respect to time. Other functional forms such as a Weibull or log-normal distribution are not necessarily memoryless (Billingsley, Reference Billingsley2012). Nevertheless, we expect that the quality of the result will not change, but leave it for further research to assess the implications in more detail.
The size of the perceived costs is substantially larger, 85 times, than the cost of implementing the GRS. Having a better understanding of the political economy behind the perceived costs and how to reduce them seems to be economically much more important than additional investigations into the costs of social marketing and maintenance breeding.
The results further show that it pays for those opposing the GRS to raise concerns about the technology the sooner a decision by regulators is expected. The leverage factor of the perceived costs increases the closer the point of decision making is. This explains why the opposition to the GRS has substantial power and indicates that it will be difficult for those supporting the technology to change the view on perceived costs. In this context it is not so important to provide factual evidence, but to raise uncertainty. The opposition to GRS in India was able to link the GRS with the overall debate over GMOs in general (Enserink, Reference Enserink2008). Narratives about farmer suicides and dead sheep linked to GM cotton cultivation, environmental damages of Bt eggplant, and health damages linked to antibiotic marker genes are used to stir uncertainty among decision makers. Never mind that the narratives have not been correct (Herring, Reference Herring2010), keeping them alive is sufficient. It has also been argued that the GRS is only an industry public relations strategy as the multinational company Syngenta is involved in further developing the technology to convince a skeptical society about the benefits of GM crops. If Golden Rice receives approval, other GM crops can be introduced more easily. In this case uniform regulation – i.e., to ban the cultivation of all GM food crops – might be a cost-effective approach to avoid the introduction of potentially more ‘dangerous’ crops. While this argument has received support within the environmental economics literature (e.g., Kolstad, Reference Kolstad1987), as identifying the marginal benefits and damage costs of a technology can be very costly, an important difference needs to be considered. Real damages to the environment from technologies assessed within the environmental economics literature have been demonstrated, such as damages from sulfate dioxide emission from steel factories or nitrogen emissions from intensive agriculture, while in the case of GM crops, net environmental benefits have been reported (e.g., Wesseler et al., Reference Wesseler, Scatasta, Fall, Carter, Moschini and Sheldon2011; Bennett et al., Reference Bennett, Chi-Ham, Barrows, Sexton and Zilberman2013).
One may then ask how new technologies can be introduced, if it is so easy to block them. There will always be a small, vocal group opposing a new technology. On the one hand, this is correct. Introducing new technologies will become more difficult. The advances being made over the past decade in information and communication systems reduce the costs of organizing the opposition as well as the costs of communicating technology-related uncertainties. On the other hand, uncertainties over a new technology can be balanced by uncertainties over not having access to a new technology stressed by a group of stakeholders as powerful as the opposition. This seems to explain why transgenic crops have been introduced within the US but not in Europe (Graff et al., Reference Graff, Hochman, Zilberman and Herring2013).
A countervailing power supporting the GRS and stirring uncertainties about not introducing the GRS has not been explicitly considered within the model presented, as this is currently not present within the GRS debate. The GRS has been developed by scientists. Scientists have the tendency to argue based on facts and not fiction, making it more difficult to be a countervailing power against the opposition to Golden Rice. Also, uncertainties and irreversibilities about the benefits and the other costs of the GRS can be included in the model. As a worst case scenario has been employed with respect to those benefits and costs, modifications of the model in the aforementioned direction will increase the calculated perceived costs. Further, recent nutritional studies show the factors translating β-carotene of Golden Rice into vitamin A are larger than expected (Tang et al., Reference Tang, Hu, Yin, Wang, Dallal, Grusak and Russell2012).
One question that remains to be answered within this debate is: what are the incentives of the opposition to the GRS in India? This has not yet been well investigated empirically. Apel (Reference Apel2010) argues that this is driven by the financial support the opposition receives. A small industry has developed around the opposition to transgenic crops that survives mainly on donations and has to keep the debate about the risks of the technology alive. This strategy seems to be a successful strategy albeit, as the case of Golden Rice shows, at the cost of the lives of several thousand children.


 Open access