


Introduction
The relationship between colouration and phylogeny/natural history in organisms is an attractive topic in evolutionary biology, especially considering natural selection, adaptation and systematics (Olendorf et al., Reference Olendorf, Rodd, Punzalan, Houde, Hurt, Reznick and Hughes2006; Stevens & Merilaita, Reference Stevens and Merilaita2009; Bowen et al., Reference Bowen, Rocha, Toonen and Karl2013; Green et al., Reference Green, Duarte, Kellett, Alagaratnam and Stevens2019). In animals, body colouration has various functions, including camouflage (Stevens & Merilaita, Reference Stevens and Merilaita2009), social communication (Detto et al., Reference Detto, Backwell, Hemmi and Zeil2006, Reference Detto, Hemmi and Backwell2008), mimicry (Randall, Reference Randall2005), and thermoregulation (Silbiger & Munguia, Reference Silbiger and Munguia2008; Kronstadt et al., Reference Kronstadt, Darnell and Munguia2013). It can also be an indication of reproductive isolation by serving as a cue in mate recognition (Seehausen & van Alphen, Reference Seehausen and van Alphen1998). As a taxonomic tool, colouration can often be much more reliable than morphological data, when it comes to identifying the species boundaries of sister species and confirming the earliest stages of speciation in both vertebrates and invertebrates (Williams, Reference Williams2000; Mathews & Anker, Reference Mathews and Anker2008; DiBattista et al., Reference DiBattista, Waldrop, Bowen, Schultz, Gaither, Pyle and Rocha2012).
Intraspecific colour differences in animal species have often been recorded, such as ontogenetic colour changes, graphical/physiological differences, and plasticity in colouration, in a broad range of animal taxa (Strong, Reference Strong1975; Hill, Reference Hill1999; Hanlon, Reference Hanlon2007; Takeshita, Reference Takeshita2019). Moreover, there are various selective pressures inducing colour morphs. In the context of pattern matching, body colouration sometimes varies considerably depending on the substrate colour, the condition of environments, and season, and function as camouflage from visual predators (Russell & Dierssen, Reference Russell and Dierssen2018; Green et al., Reference Green, Duarte, Kellett, Alagaratnam and Stevens2019). In terms of mating success, conspicuous colouration increases the detectability and attractivity for the counter sex, because such colouration often is originally reflected by the nutritional and/or maturity condition of individuals (Kodric-Brown, Reference Kodric-Brown1989; Guilford & Dawkins, Reference Guilford and Dawkins1991; Hill, Reference Hill1999). Colour variation also helps in temperature regulation in various environmental conditions (Pearson, Reference Pearson1977; Bittner et al., Reference Bittner, King and Kerfin2002; Munguia et al., Reference Munguia, Levinton and Silbiger2013). Intraspecific variation has led to confusion due to the lack of knowledge of the cause of the variation and the boundaries between intraspecific and interspecific differences in their systematic study (Williams, Reference Williams2000; Mathews & Anker, Reference Mathews and Anker2008; Yoshikawa et al., Reference Yoshikawa, Nakano, Satoh and Asakura2018). Altogether, a study on intraspecific colour variation is an attractive theme in biology and helps in the understanding of the evolution, natural selection, speciation and environmental adaptation of animals. However, little is known about the intraspecific colour differences in intertidal hermit crabs.
Intraspecific variations in colouration have been documented in species of some intertidal hermit crabs. For example, the diogenid hermit crab (Calcinus morgani Rahayu & Forest, Reference Rahayu and Forest1999) typically possesses dark brown chelipeds and ambulatory pereopods, although a specimen from a middle region of Japan exhibited purple or reddish-purple colouration on those appendages (Asakura, Reference Asakura2002). Moreover, five colour patterns have been identified on the second and third pereopods in Clibanarius specimens that can be assigned to the species Clibanarius merguiensis de Man, 1888 (Rahayu & Forest, Reference Rahayu and Forest1993; Yoshikawa, personal observation). Colour difference is sometimes reflected by incipient speciation. For instance, an intertidal pagurid hermit crab (Pagurus minutus Hess, 1865) is a species that exhibits several colour variations on the lateral surfaces of its ambulatory legs which reflect genetically differentiated local populations; P. minutus are possibly separated into three groups at the species level (Jung et al., Reference Jung, Jung and Kim2018).
Distinguishing between intraspecific and interspecific colour variation in hermit crabs is often difficult and has led to misidentification. For instance, Calcinus areolatus Rahayu & Forest, Reference Rahayu and Forest1999 was later confirmed to be an early stage of C. morgani (Komai, Reference Komai2004); and Clibanarius symmetricus (Randall, 1840), resurrected through molecular analysis, was previously considered to be a colour variant of C. vittatus (Bosc, 1802) (Negri et al., Reference Negri, Lemaitre and Mantelatto2014). Following re-examination of the holotype of Clibanarius sachalinicus Kobjakova, 1955, it was revealed that C. sachalinicus was a junior synonym of Clibanarius virescens (Krauss, Reference Krauss1843) (Marin, Reference Marin2016). Regarding the colour variants of another intertidal hermit crab (Calcinus morgani), Asakura (Reference Asakura2002) suggested that environmental differences in its habitat could cause the colour variations in this species, as the colour-variant specimen was collected from the northern limit of this species' distribution.
Geographically widely distributed marine species often have genetically differentiated local populations or genetic structures, and the geographic differentiation pattern varies between animal taxa and even between closely related species (Paul et al., Reference Paul, Erdmann and Palumibi2006; Crandall et al., Reference Crandall, Frey, Grosberg and Barbaer2008; Bowen et al., Reference Bowen, Rocha, Toonen and Karl2013, Reference Bowen, Gaither, DiBattista, Iacchei, Andrews, Grant, Toonen and Briggs2016). Moreover, if the climatic conditions could be somewhat reflected in colouration, then detecting the cause of colour variation and frequency differences, especially in a species with a wide geographic range, might lead to good indicators for environmental research into global climatic changes. Knowledge of the genetic populations with the description of colour variants is, therefore, essential for conservation of local marine animal populations, as well as for understanding population differentiation and speciation.
Intraspecific variation in colouration has been documented in Clibanarius virescens; this species is geographically widely distributed in tropical and warm temperate areas in the Indo-West Pacific region (Krauss, Reference Krauss1843; Fize & Seréne, Reference Fize and Seréne1955; Morgan, Reference Morgan1987, Reference Morgan1989; Haig & Ball, Reference Haig and Ball1988; Forest, 1993; McLaughlin, Reference McLaughlin2002; Hirose et al., Reference Hirose, Osawa and Hirose2010; Poupin et al., Reference Poupin, Bouchard, Dinhut, Cleva and Dumas2013; Yoshikawa et al., Reference Yoshikawa, Nakano, Satoh and Asakura2018, Reference Yoshikawa, Ikeo, Imoto, Jaingam, Putri, Appukuttannair and Asakura2019), and, therefore, can be suitable for discussion of geographic differences. Yoshikawa et al. (Reference Yoshikawa, Nakano, Satoh and Asakura2018) reported individuals with whitish second and third pereopods (W–PCM; white propodus, carpus and merus) in this species from Nansei Island, Japan; the standard colour on the same surface is usually dark green or dark olive green. Yoshikawa et al. (Reference Yoshikawa, Nakano, Satoh and Asakura2018) did not classify the W–PCM colour type as juvenile colouration because the size of the W–PCM specimens was very similar to the size of ovigerous females of normal-coloured individuals. Moreover, Morgan (Reference Morgan1988) also reported three colouration patterns on the second and third pereopod dactyls of this species: Type A, a brown or bluish-black annular band present in the middle portion on a whitish-yellow background, which is the most common type for this species; Type B, dark dorsal and sometimes dark ventral patches present on a whitish-yellow background; and Type C, the absence of dark rings or dark patches on a whitish-yellow background (Figure 1). When we use the terminology ‘dactyl’ in the following section, it indicates the ‘dactyls of the second and third pereopods’, since we focus on the colouration of those segments in this study (Figure 2). However, factors inducing this colour variation have not yet been investigated considering genetic structure, sex, body size, growth stages and geographic distribution.
Diagrammatic figures of dactyl colour variation, as reported in Morgan (Reference Morgan1988): (A) A–type; (B) B–type; (C) C–type.

Diagrammatic figures of examined parts: (A) shield length (SL); and (B) names of segments on pereopods and dactyl length (DL).

Few descriptive studies, however, have been conducted into the factors inducing colour variations of hermit crabs, including genetic characters, sexual dimorphism, differences among the growth stages and inter-regional differences. Thus, the questions we consider in this study, using the widely geographically distributed species Clibanarius virescens, are: (1) how do local populations with different colouration in geographically widely distributed hermit crabs differ genetically? And (2) how do the colourations differ between populations in different geographical regions?
Materials and methods
Sample collection and examination
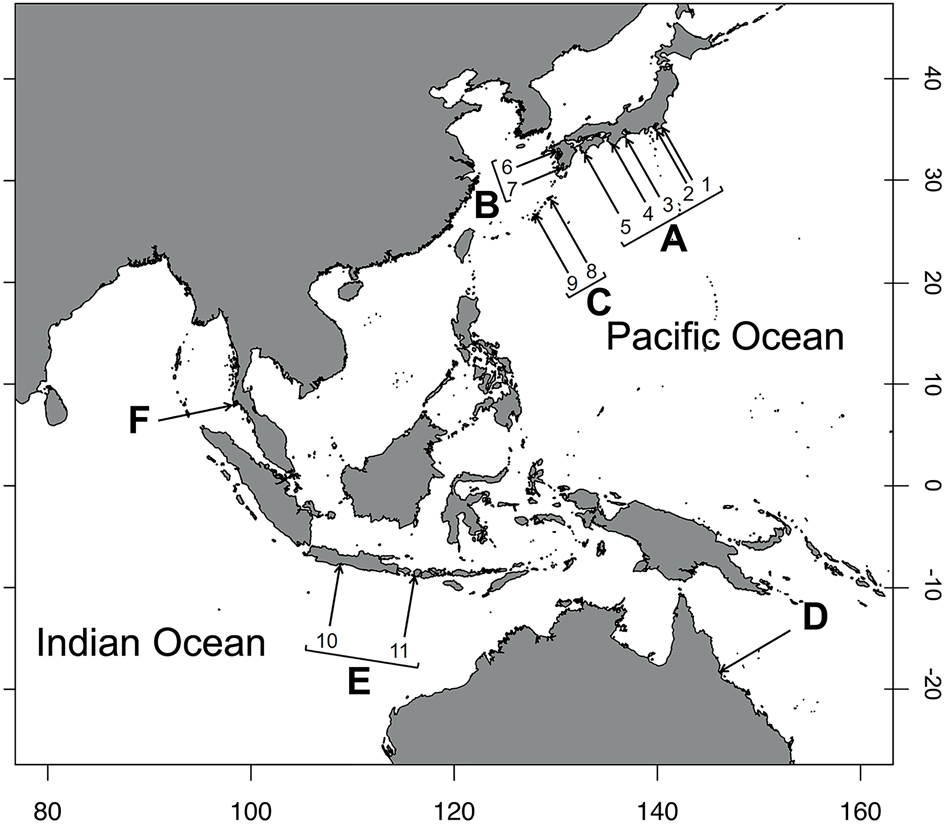
Field sampling of C. virescens was conducted on rocky intertidal shores of 14 Indo–West Pacific localities from April 2015 to August 2019 (Figure 3). Individuals of C. virescens were randomly collected by hand from rocky shores one hour before/after the lowest tidal time on each sampling day. After cracking their shells, we identified the species and measured the shield length (SL) and the dactyl length (DL) of the second and third pereopods of specimens using callipers or ImageJ software 1.38 (Abramoff et al., Reference Abramoff, Magelhaes and Ram2004) (Figure 2). The sex was determined by the position of the gonopores. In order to compare differences in the mature sizes of specimens of each colouration and sampling station, the shield size (SL) of ovigerous females was used as an indicator of mature body size.
Map displaying the study sites in the Indo–West Pacific (i.e. the area from the East China Sea to the Pacific Ocean): (A) Honshu and Shikoku, Japan (1. Katsuura, Chiba; 2. Miura, Kanagawa; 3. Shima, Mie; 4. Shirahama, Wakayama; 5. Tanoura, Kochi); (B) Kyushu Island, Japan (6. Amakusa, Kumamoto; 7. Hirakawa, Kagoshima); (C) Nansei Islands, Japan (8. Amami-Oshima, Kagoshima; 9. Okinawa); (D) a region from North Australia (Queensland, Australia); (E) a region from Indonesia (10. Jawa; 11. Lombok Island); and (F) a region from Thailand (Phuket).
The colouration of the pereopods was recorded following the abovementioned three-colour types, as defined by Morgan (Reference Morgan1988). Further, the combinations of the colour types in the dactyls of the second and third pereopods were categorized into seven groups (AA, AB, ABC, AC, BB, BC and CC; hereinafter referred to as ‘dactyl–colouration–groups, DCGs’). The AA, BB, and CC represent the individuals that were composed of only A–dactyl, B–dactyl and C–dactyl type on the pereopods, respectively. The AB, ABC, AC and BC represent the individuals with each respective dactyl type.
The general colour of the pereopods was also recorded. This species generally has dark green colouration on the propodi, carpi and meri of the second/third pereopods (G–PCM), so whitish ambulatory pereopods (W–PCM) were reported as the colour variation of this species (Yoshikawa et al., Reference Yoshikawa, Nakano, Satoh and Asakura2018). Moreover, during this survey, the blue-coloured propodi, carpi and meri (B–PCM), which were previously recognized by Asakura A. (unpublished), were also recorded as a colour variation of this species (Figure 4). In summary, we investigated the size difference and occurrence between G–PCM, B–PCM and W–PCM in the present study.
Comparison of pereopod colouration: (A) green pereopods (G–PCM); (B) blue pereopods (B–PCM). Scale bar: 5 mm.

The sampling stations were sorted into six regional groups to determine the geographic differences in the frequency of each dactyl colouration and the body size of hermit crabs. The groups are classified as follows: (A) Honshu, Japan (1, Katsuura, Chiba; 2, Miura, Kanagawa; 3, Shima, Mie; 4, Shirahama, Wakayama) and Shikoku (5, Tanoura, Kochi); (B) Kyushu, Japan (6, Amakusa, Kumamoto; 7. Hirakawa, Kagoshima); (C) Nansei Islands, Japan (8. Amami-Oshima, Kagoshima; 9. Uruma, Nanjo, and Nakagami, Okinawa); (D) North Australia (Townsville, Queensland); (E) Indonesia (10, Pangandaran, Jawa; 11, Lombok Island); (F) Thailand (Laem Panwa, Phuket) (Figure 3 and Table 1). Climate classification of the sampling sites followed the map of Kottek et al. (Reference Kottek, Grieser, Beck, Rudolf and Rubel2006).
The sampling station region, number of examined specimens from each station, and regional category in this study

In total, the ambulatory pereopods of 1209 C. virescens individuals were examined. These included 1139 and 1045 of the right second and third pereopod, and 1118 and 813 of the left second and third pereopod, respectively. Of these, 1164 individuals were used to investigate the body size difference between W–PCM and B/G–PCM pereopods colouration; this total included 237 W–PCM individuals, 99 B–PCM individuals and 828 G–PCM individuals. The pereopods colouration of 45 individuals could not be identified because these specimens had already been fixed in 99% ethanol in the field; three-colour types of dactyls could be identified even after being fixed in ethanol.
DNA extractions, polymerase chain reactions (PCR), sequencing and population genetics analysis
A total of 214 specimens of C. virescens were used for molecular analysis; Japan (including Honshu (Chiba, N = 5; Mie, N = 6; Kanagawa, N = 14; Wakayama, N = 32), Shikoku (Kochi, N = 12), Kyushu (Kumamoto, N = 44; Kagoshima, N = 4), and Nansei Island, Japan (Amami-Oshima, N = 3; Okinawa, N = 22)), North Australia (Townsville, Queensland, N = 8), Indonesia (Pangandaran, Jawa, N = 20; Lombok Island, N = 14) and Thailand (Phuket, N = 30). Total DNA was extracted from the tissue of the second/third or fourth pereopods using the High Pure PCR Template Kit (Roche) following the manufacturer's protocol. PCRs were used to amplify 600 bp of COI. Amplifications were performed in 25 μl reactions consisting of 5.0 μl of forward and reverse primers from Folmer et al. (Reference Folmer, Black, Hoeh, Lutz and Vrijenhoek1994) (LCO1490: 5′- GGT CAA CAA ATC ATA AAG ATA TTG G-3′, HCO2198: 5′-TAA ACT TCA GGG TGA CCA AAA AAT CA-3′) (2.5 μl each), 2.5 μl of ExTaq buffer, 2.0 μl of dNTPs (2.5 μl each), 0.13 μl of ExTaq polymerase (TaKaRa, Otsu, Japan), and 14.87 μl of distilled water. Thermal cycling conditions were set at 94°C for 3 min, followed by 35 cycles of 95°C for 45 s, 50°C for 90 s at COI-specific annealing temperatures and 72°C for 2 min, and final extension 72°C for 4 min. The PCR products were purified using a High Pure PCR Product Purification kit (Roche). The sequencing reaction was performed using PCR primers and a BigDye Terminator Cycle Sequencing Ready Reaction Kit (Applied Biosystems, Foster City, CA) on an ABI 3130 sequencer (Applied Biosystems). Some of the purified PCR products were also sent to Eurofins Genomics for sequencing.
The specimens used in this study were deposited in the Seto Marine Biological Laboratory, Kyoto University, Shirahama, Japan; the Crustacean Collection of the Lee Kong Chian Natural History Museum, Singapore; the Muséum National D'histoire Naturelle, Paris, France, and the Museum of Tropical Queensland, Queensland Museum (Supplementary Table S1). Later, the newly obtained sequences were registered in the DNA data bank of Japan (DDBJ); their accession numbers are shown in Table S1 with the specimens' locality data.
Phylogenetic analysis
Sequences of the COI genes were aligned using the program Crustal W (Thompson et al., Reference Thompson, Higgins and Gibson1994) implemented in MEGA version 7 (Kumar et al., Reference Kumar, Stecher and Tamura2016) with the default settings. Poorly aligned regions were excluded from the final alignments. Phylogenetic trees were constructed using maximum likelihood (ML) methods. ML analyses were performed using RAxML (Stamatakis, Reference Stamatakis2006) as implemented in raxmlGUI 1.31 (Silvestro & Michalak, Reference Silvestro and Michalak2012). The robustness of the ML tree was evaluated with 10,000 bootstrap replications. The datasets were partitioned by codon, and the GTRGAMMA model was implemented. The tree included an outgroup using the sequence of the most closely related species, C. englaucus, following previous studies (Tsang et al., Reference Tsang, Chan, Ahyong and Chu2011; Yoshikawa et al., Reference Yoshikawa, Nakano, Satoh and Asakura2018, Reference Yoshikawa, Ikeo, Imoto, Jaingam, Putri, Appukuttannair and Asakura2019).
DNA barcoding of mitochondrial COI region
Sequence data were aligned using Clustal W (Thompson et al., Reference Thompson, Higgins and Gibson1994) implemented in MEGA version 7 (Kumar et al., Reference Kumar, Stecher and Tamura2016) with the default alignment parameters and manually adjusted to minimize mismatches. The number of polymorphic sites (K), number of haplotypes (Nh), number of private haplotypes, haplotype diversity (h; Nei, Reference Nei1987), and nucleotide diversity (π; Nei & Li, Reference Nei and Li1979) for each geographic area were calculated using Arlequin version 3.5 (Excoffier & Lischer, Reference Excoffier and Lischer2010).
The following molecular diversity parameters (variable sites (S), nucleotide diversity (π), haplotype diversity (Hd), and the total number of mutations (Eta)) were calculated with DNAsp (Librado & Rozas, Reference Librado and Rozas2009) separately for each geographic area, sampling site, phylogenetic group (PG) and ocean. To test the neutrality of the mutations, Tajima's D (Tajima, Reference Tajima1989a, Reference Tajima1989b) and Fu's Fs (Fu, Reference Fu1997) for each population were calculated using Arlequin version 3.5 (Excoffier & Lischer, Reference Excoffier and Lischer2010). Finally, a median-joining haplotype network was built (Bandelt et al., Reference Bandelt, Forster and Röhl1999) using POPART (http://www.fluxus-engineering.com).
Statistical analysis of growth size and dactyl size
For statistical analysis, a pairwise t-test with Bonferroni adjustments was conducted to visualize the differences in hermit crab body size and dactyl size between each colour type and geographic region. Additionally, Welch's t-test was conducted to elucidate the sexual dimorphism of shield size and dactyl size. All statistical analyses were performed with R ver. 3.4.0 (R Development Core Team, 2017).
Results
Genetic identification and molecular analyses
Two hundred and fourteen specimens including all of the colour variations were genetically identified as C. virescens with GenBank similarities above 95% according to the resulting BLAST search. The sequences were deposited in the DDBJ with their accession numbers (Supplementary Table S1). Molecular analyses indicated that all of the DCGs sorted on the dactyl colour type (AA, AB, ABC, AC, B, BC and C) and all of the colour types of the pereopods (i.e. G–PCM, B–PCM) were included in the same clade as C. virescens (Figure 5). A total of 164 haplotypes were found in the C. virescens populations used in this study (Supplementary Table S1). In total, 179 variable sites and 203 mutations were found. Haplotype diversity (h) and nucleotide diversity (π) of the sampling stations ranged from 0.89 to 1.0 (mean = 0.98) and 0.01 to 0.02 (mean = 0.01), respectively. Additionally, haplotype diversity and nucleotide diversity of each phylogenetic clade ranged from 0.98 to 1.0 (mean = 0.99) and 0.01 to 0.03 (mean = 0.02), respectively. All of the molecular diversity parameters for C. virescens populations and each clade from the ML tree based on the COI region are shown in Table 2.
Maximum likelihood tree based on COI data (630 bp) with bootstrap values (based on 10,000 pseudoreplications). Only relatively high bootstrap values (BS > 85) are shown in the figure. The branch colours represent each sampling region (Black = Japan; Red = North Australia; Green = Indonesia; and Purple = Thailand).

Results of the analysis of molecular diversity parameters for Clibanarius virescens populations and each clade from the ML tree based on COI region: number of sequences analysed (N), variable sits (S), total number of mutations (Eta), average number of nucleotide differences (k), number of haplotypes (h), haplotype diversity (Hd), haplotype diversity standard deviation (SD Hd), nucleotide diversity (π), nucleotide diversity standard deviation (SDπ), Fu's Fs statistic (Fu's Fs) and Tajima's D value (D)
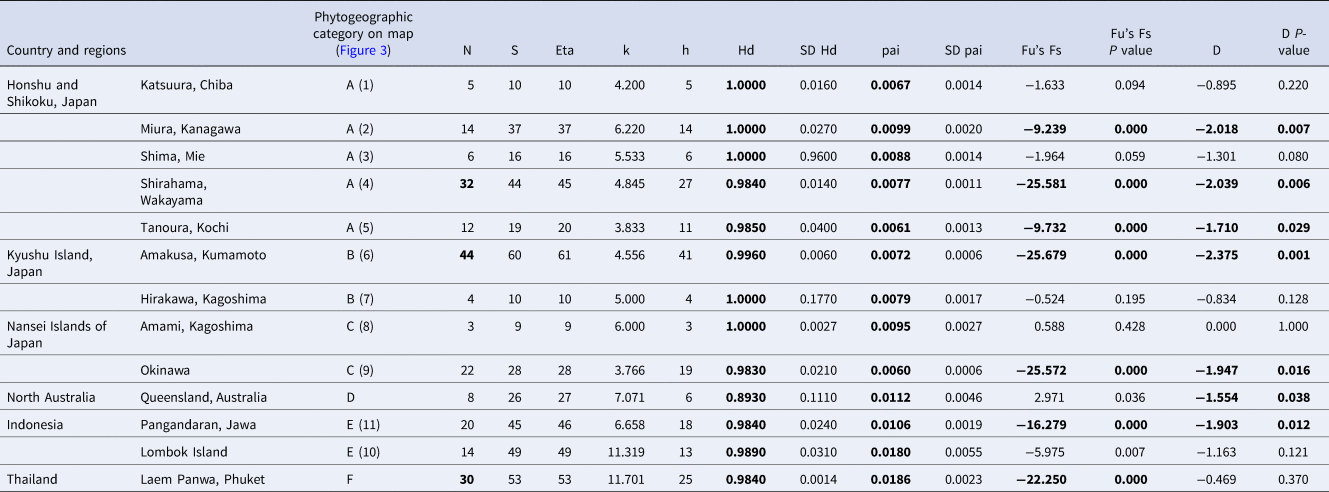
Significant values of neutrality statistics (Fu's Fs P < 0.02, D P < 0.05) and high molecular diversity values (Hd and π, according to Goodall-Copestake et al., Reference Goodall–Copestake, Tarling and Murphy2012) are in bold.
The median-joining network of C. virescens presented a complex haplotype network (Figure 6) but suggested the existence of three differentiated populations in C. virescens. This result coincides with the results of ML analysis, and we categorized those as clades A, B and C, respectively (BS = 100) (Figure 5). The central haplotype, PG–1, contained many unique haplotypes, with 18 of the 164 haplotypes sharing more than one haplotype or missing haplotype. The most common haplotype (H5) of PG–1 consisted of 16 individuals from all geographic regions (Supplementary Table S1). Closely related haplotypes generally consisted of individuals from distinct areas and did not reveal a clear geographic pattern. In contrast, 23 specimens from Phuket, Thailand, and one sample from Queensland, Australia, shared a unique haplotype distinct from the most common haplotype (PG–2, BS = 85). Moreover, three individuals from Lombok Island, Indonesia (PG–3, BS = 94), also had distinctive haplotypes from the central haplotype. Not all samples from North Australia, Indonesia and Thailand are included in PG–1, but some of them were included in PG–1. Regarding the ML tree, the haplotypes included in PG–1 were not located in the comparably close position of PG–2. Therefore, all of the haplotypes of PG–1 were essentially found in all of the sampling regions of this study. However, some unique haplotypes were found only from North Australia, Indonesia and Thailand.
The haplotype network of C. virescens. The colour of circles represents each ocean area (green = Japanese water; red = North Australia (Queensland); yellow = Indonesia (Jawa and Lombok Island); and navy blue = Thailand (Phuket)).

Description of the haplotype relationships
Three haplotype groups were detected, and these coincided with the result of the ML phylogenetic tree. Therefore, the significant components of haplotypes in these groups are described below. Haplotype number and accession number (DDBJ) are shown in Supplementary Table S1, and their relationships were defined using the median-joining haplotype network (Figure 6).
The main haplotype of PG–1 was H5 (N = 16, 7% of individuals of each haplotype), the second-highest frequency haplotypes were H8, and H9 (N = 7, 3% of individuals of each haplotype) and the third-highest frequency haplotype was H71 (N = 6, 3% of individuals of each haplotype). All of these main haplotypes were detected in PG–1. H5 (the main haplotype of PG–1) was found in Japanese (Kumamoto, SMBL-V0388, -V0301 and -V0314; Okinawa, -V0278; Wakayama, -V0345, -V0365 and -V0368; Kochi, -V0268 and -V0272), North Australian (QM-W29527: A10, A32 and A45), Indonesian (Lombok, SMBL-V0223 and -V0226) and Thailand samples (Phuket, SMBL-V0412). H8 consisted of Japanese (Kumamoto SMBL-V0297 and -V0325; Okinawa, SMBL-V0386; Kanagawa, SMBL-V0282; Wakayama, SMBL-V0339; Kochi, SMBL-V0273) and Indonesian (Lombok, SMBL-V0227). H9 consisted of Japanese (Kumamoto, SMBL-V0298; Okinawa, SMBL-V0210, -V0378 and -V0383; Kanagawa, SMBL-V0285; Kochi, SMBL-V0269) and Indonesian (Pangandaran, SMBL-V0250) and H71 included Japanese (Okinawa, SMBL-V0376 and -V0382) and Indonesian (Lombok, SMBL-V0233; Pangandaran, SMBL-V0238, -V0251 and -V0253). H8 had five mutations between H9 and only one mutation between H5. H9 had two mutations between H5. H76 (Kanagawa, SMBL-V0285) was located between these two haplotypes. H8 and H9 were continued through H71, which had three mutations between H8 and two mutations between H9.
PG–2 consisted of haplotypes from Thailand and North Australia. The major haplotypes of PG–2 were H122 (Phuket, SMBL-V0390, -V0396 and -V0403) and H123 (Phuket, SMBL-V0391, -V0413 and -V0418). Almost all haplotypes consisting of PG–2 were from Thailand samples. However, the haplotype that was the most closely related to PG–1 was H46 from North Australia (QM-W29527: A16). H46 has 13 mutations and one missing haplotype between H161 (Wakayama, SMBL-V0360).
In PG–3, three haplotypes (H69, H72 and H73) were found, and each of these had at least one missing haplotype and two mutations. The most closely related haplotypes from PG–1 were H90 (Mie, SMBL-V0337) and H112 (Pangandaran, SMBL-V0244) with 11 mutations and one missing haplotype. We presented the haplotype composition of each sampling station in Figure 6 with classification using three PGs from the results of the phylogenetic analysis using the ML method. It also showed that the haplotype of PG–2 appeared in North Australia and Thailand.
Tajima's D values and Fu's Fs indicated negative but non-significant values, which suggests the existence of many silent mutations (i.e. mutations that do not change the amino acid sequence), thus producing low heterozygosity as there were some synonymous mutations (Table 2). These negative values agreed with the high DNA sequence diversity and haplotype diversity of C. virescens (Figure 6; Table 2; Supplementary Table S1). Moreover, it generally indicated genetically mixed populations in which mutations were accumulated over long periods and, thus, allowed for the maintenance of these high levels of diversity. The presence of the most abundant haplotypes in PG–1, together with the high nucleotide diversity (π) in each station, suggested high gene flow and null population differentiation of the populations from the West Pacific Ocean.
The comparison of the DL among three colourations
The frequencies for each colouration are shown in Figures 7 and 8. The colourations appear in the order C–type, B–type and A–type from small to large crabs. The results of the Kruskal–Wallis χ2 test indicated that there were significant differences in DL between colourations in both sexes (Table 3). We then performed a pairwise t-test to visualize the size differences between A–type, B–type and C–type dactyls. Significant size differences were found in almost all of the combinations of DL, except the A–type and B–type of the females' left third pereopods (Table 3). These results also showed that the frequency of the three-colour variations of the dactyls depended on the growth stage. All juveniles (SL: 1.5–2.0 mm) had the C–type pattern. After reaching specific adult sizes (~2.5 mm in females and 2.0 mm in males), A–type and B–type patterns emerge. While the frequency of the C–type pattern decreased and the A–type increased with growth in both sexes, the rate of the B–type pattern remained at ~20–40%; the DL was in the range of 2.0–5.5 mm in females and 2.5–7.0 mm in males.
The percentage of each dactyl colour type (A–type, B–type, and C–type in Figure 1) according to dactyl size (DL) in females: (A) of the second right pereopod; (B) of the third right pereopod; (C) of the second left pereopod; and (D) of the third left pereopod. The black section of the illustration indicates the measured pereopods.

The percentage of each dactyl colour type (A–type, B–type, and C–type in Figure 1) according to dactyl size (DL) in males: (A) of the second right pereopod; (B) of the third right pereopod; (C) of the second left pereopod; and (D) of the third left pereopod. The black section of the illustration indicates the measured pereopods.

The results of the pairwise t-test with Bonferroni adjustments on DL of Clibanarius virescens among each colouration
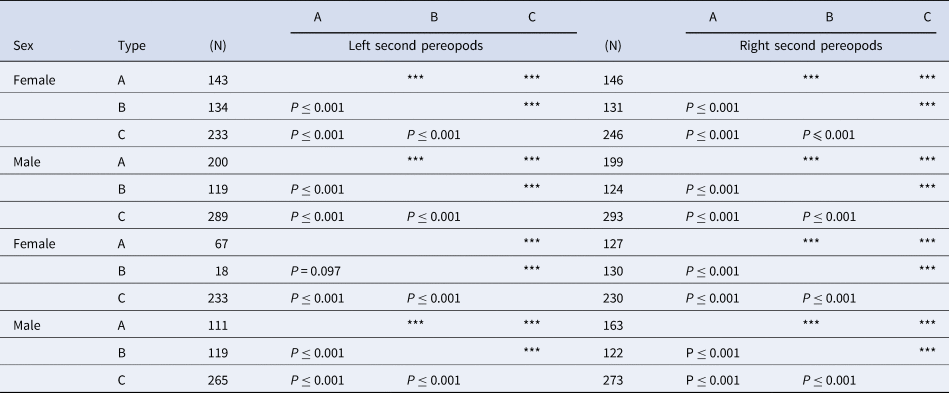
Numbers next to the colour type indicate the number of the dactyls of C. virescens investigated in the study. Triple asterisks (***) indicate P ≤ 0.001.
The body size differences among the seven DCG
Examined specimens included 275 specimens of AA, 111 of AB, 6 of ABC, 13 of AC, 201 of BB, 52 of BC and 551 of CC. The results of the Kruskal–Wallis χ2 test indicated that SL significantly differed among the seven categories AA, AB, ABC, AC, BB, BC and CC; and between females and males (Table 4). We performed a pairwise t-test to visualize the size differences among these colour categories, and the results are shown in Table 4. Significant differences in female body size were found between AA–BB, AA–BC, AA–CC, AB–BC, AB–CC and BB–BC (P ≤ 0.01). In males, significant differences in male body size were found, except between AB–AC, AC–BB, AA–BC and BB–BC.
The results of the pairwise t-test with Bonferroni adjustments on DL of Clibanarius virescens among each colouration
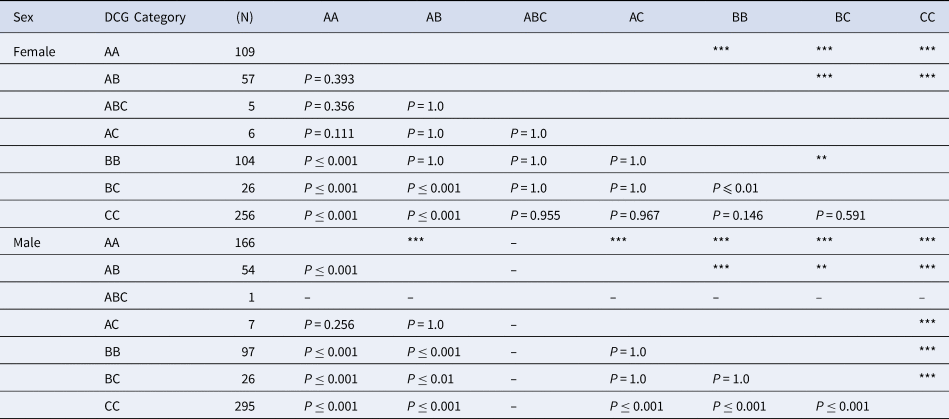
Numbers next to the colour type indicate the number of the dactyls of C. virescens investigated in the study. Double asterisks (**) and triple asterisks (***) indicate P ≤ 0.01 and P ≤ 0.001, respectively.
The body size difference and frequency of the seven colour DCGs among each region
The differences in the frequency of the seven colourations are shown in Figures 9 (female) and 10 (male). The percentages of the individuals that possess the B and/or C dactyls were higher in tropical regions than temperate regions in both sexes (female, 72% in temperate regions (A, B and C in Figure 3) and 100% in tropical regions (D, E and F in Figure 3); male, 66% in temperate regions and 99% in tropical regions) (Figures 9 and 10). Also, the body size tended to be relatively small in the tropical population (female, temperate regions = 3.36 ± 0.69 mm, tropical regions = 2.7 ± 0.52 mm; male, temperate regions = 3.82 ± 1.56 mm, tropical regions = 3.52 ± 0.86 mm) (Figures 9–11). To understand the differences in the mature sizes between each sampling station, the SLs of 189 ovigerous females were examined (Table 5). The minimum size and mean size of the SLs from tropical regions were smaller than in the temperate regions (Tropical regions: North Australia, minimum size = 2.0 mm, mean ± SD = 2.75 ± 0.74 mm; Indonesia, minimum size = 2.1 mm, mean ± SD = 2.8 ± 0.36 mm; Thailand, minimum size = 2.07 mm, mean ± SD = 2.68 ± 0.24 mm. Temperate regions: Honshu, minimum size = 2.56 mm, mean ± SD = 3.84 ± 0.74 mm; Kyushu, minimum size = 3.12 mm, mean ± SD = 4.04 ± 0.71 mm; Nansei Island of Japan, minimum size = 3.39 mm, mean ± SD = 3.79 ± 0.31 mm) (Figure 11; Table 5). The results of the Kruskal–Wallis χ2 test on the SL of ovigerous females also indicated that SL significantly differed among the sampling stations (Table 5). The pairwise t-test also indicated that the shield size of ovigerous females was significantly different between A–E, A–F, B–D, B–E, B–F, C–D, C–E and C–F sampling stations (Table 5). Therefore, mature females in the tropical population were smaller than those in the temperate region.
The percentage of each dactyl colour group (AA, AB, ABC, AC, BB, BC and CC) according to growth stage (shield size) in females: (A) from Honshu and Shikoku, Japan (region A); (B) from Kyushu, Japan (region B); (C) from the Nansei Island, Japan (region C); (D) from Townsville, Queensland, Australia (region D); (E) from Jawa and Lombok Island, Indonesia (region E); and (F) from Phuket, Thailand (region F). The regions' letters coincide with the map in Figure 3.

The percentage of each dactyl colour group (AA, AB, ABC, AC, BB, BC and CC) according to growth stage (shield size) in males: (A) from Honshu and Shikoku, Japan (region A); (B) from Kyushu, Japan (region B); (C) from the Nansei Island, Japan (region C); (D) from Townsville, Queensland, Australia (region D); (E) from Jawa and Lombok Island, Indonesia (region E); and (F) from Phuket, Thailand (region F). The regions' letters coincide with the map in Figure 3.

The percentage of ovigerous females and their shield sizes at each station.

The results of the pairwise t-test with Bonferroni adjustments on SL of ovigerous females among each colour pattern
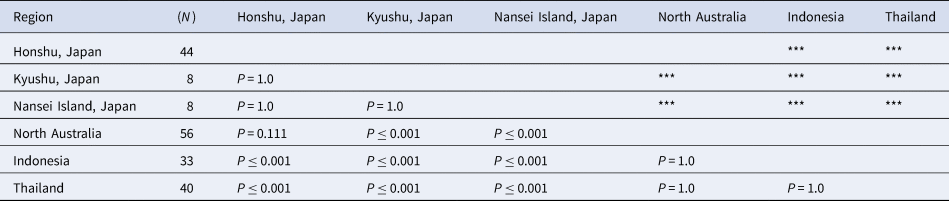
Numbers next to the colour type indicate the number of the dactyls of Clibanarius virescens investigated in the study. Triple asterisks (***) indicate P ≤ 0.001.
Body size difference between W–PCM and B/G–PCM pereopods colouration
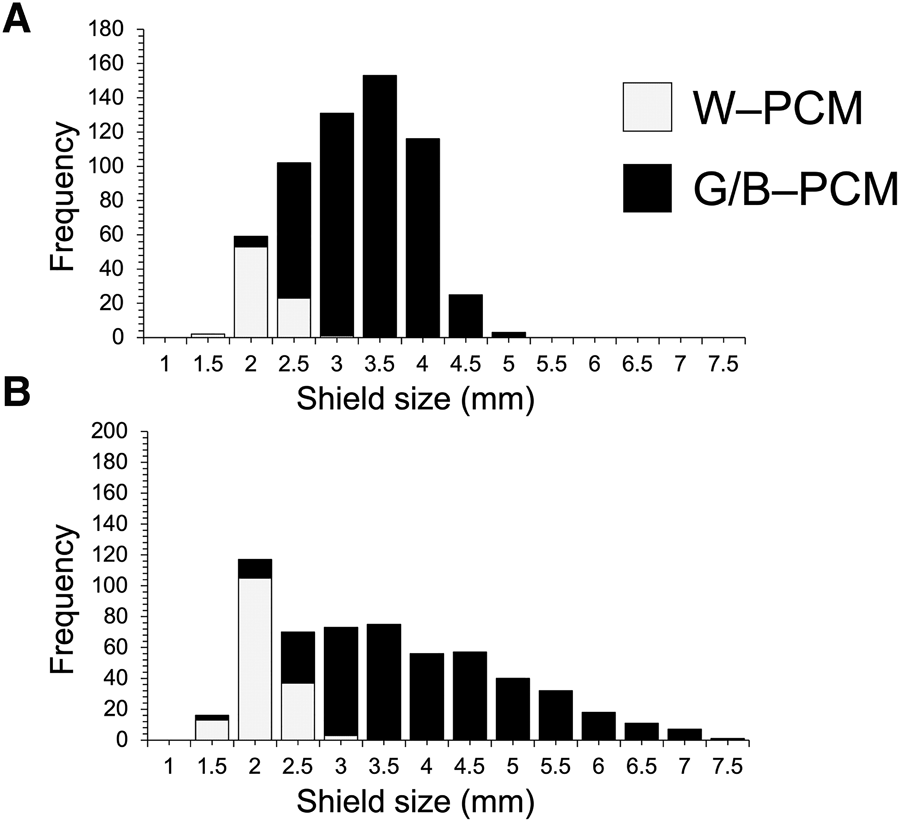
We investigated the size differences of B–PCM, G–PCM and W–PCM (Figure 12). A total of 1164 C. virescens individuals, which included 591 females and 573 males, were used. This total also included 99 B–PCM individuals, 828 G–PCM individuals and 237 W–PCM individuals (Table 6). Significant bias was detected by the Kruskal–Wallis χ2 test that was conducted on the SL between the three colourations of females and males, respectively. Significant differences in female body size were found between B/G–PCM, G/W–PCM and G/W–PCM. In males, significant differences in male body size were found between colourations, except for the comparison of B/W–PCM and G/W–PCM (Table 6). However, no significant difference was detected between male B/G–PCM patterns. Although the B–PCM and G–PCM colour types are mainly found in body sizes that are larger than 2.0 mm, the W–PCM type was only found between the range of ~1.5–2.5 mm (Figure 12). Our results indicated clear evidence which confirms that the W–PCM type is a juvenile colour type and, after reaching 2.5 mm, the colour changes to B–PCM or G–PCM (Figure 12).
Distribution of the shield size of white (W–PCM) and green/blue colouration (G/B–PCM): (A) females; (B) males.
The results of the pairwise t-test with Bonferroni adjustments on SL of Clibanarius virescens among each colour pattern

Numbers next to the colour type indicate the number of the dactyls of C. virescens investigated in the study. Triple asterisks (***) indicate P ≤ 0.001.
Regional difference on the body size and frequency of B/G–PCM
Regarding the regional difference in the frequency of B–PCM and G–PCM, since B–PCM type were not collected in Indonesian and North Australian regions during this study, the specimens from four areas, including Honshu, Shikoku, Nansei Islands, Japan, Indonesia and Thailand, were examined. First, we compared the size differences of each sampling site using t-tests. Significant size differences were detected between B–PCM and G–PCM of the female population from Thailand (P ≤ 0.05). However, no significance was detected in other populations of either sex.
To understand the relationships between the frequencies of the B/G–PCM and sampling regions, we used Fisher's Exact Test (B–PCM or G–PCM × Number of the sampling station). The results of Fisher's Exact Test (2 × 4) indicate that there is a significant bias in the occurrence of B/G and sampling regions in both sexes (female, P ≤ 0.001; male, P ≤ 0.001) (Figures 13 and 14). Therefore, considering our observations and the statistical analysis results, the frequency of the occurrence of B–PCM pereopods is higher in Phuket, Thailand.
Distribution of the shield size of green and blue colouration (G–PCM and B–PCM) in females: (A) the Nansei Islands, Japan; (B) Phuket, Thailand.

Distribution of the shield size of green and blue colouration (G–PCM and B–PCM) in males: (A) Honshu, Japan; (B) the Nansei Island, Japan; and (C) Phuket, Thailand.

Discussion
Differences in the occurrence of dactyl colour variations
Our results indicated that the frequency of the colour variation changed from C–type to A– and/or B–type depending on the growth stage. However, because the dactyls also exhibited varied colourations even in one specimen (categorized as AB, ABC, AC and BC) (Figures 7 and 8), the colour transformation of dactyls might depend on not only the growth stage but also the stages of dactyl after autotomy. Our assessment of the seven types (AA, AB, ABC, AC, BB, BC and CC) based on their dactyl colouration indicated that the occurrence of the AA–type was different depending on the geographic area. We, therefore, concluded that there were regional differences in the frequency of the colour variations of the dactyls. This regional difference might be related to the difference in the growth/matured rate between tropical and template regions since the mean maturity size of the population inhabiting the tropical areas was significantly smaller than that of the temperate region (Figure 11 and Table 5).
These growth/maturity patterns might follow the temperature-size rule, which has been empirically supported in many ectotherms (Kingsolver & Huey, Reference Kingsolver and Huey2008; Forster et al., Reference Forster, Hirst and Atkinson2012). In crustacean species, the growth rate, mean size and maturity size are also different depending on the optimal environmental temperature of the species. For example, the mean size and maturity size of the fiddler crab Tubuca arcuata (De Haan, 1835) is smaller in tropical/subtropical areas than in temperate areas (Aoki et al., Reference Aoki, Watanabe, Imai, Kamada and Wada2010). As another example, the sandy beach isopod Excirolana braziliensis Richardson, 1912 experiences a decrease in lifespan and an increase in natural mortality from temperate to subtropical beaches, but increases their mass at size (length–mass relationship) from subtropical to temperate beaches (Cardoso & Defeo, Reference Cardoso and Defeo2004). The study hypothesized that isopods in temperate regions (at higher latitudes) achieve larger sizes by delaying maturity; therefore, they may be able to invest more resources in reproduction and body growth than individuals in tropical water. In C. virescens, the growth and maturity rate of individuals inhabiting tropical regions may be faster than those inhabiting temperate regions (as shown in Figure 11), and populations in tropical regions might have a higher mortality rate or a shorter lifespan. Moreover, the frequency of the A– and B– dactyl types, which were mostly exhibited on larger individuals, were lower in tropical regions. Therefore, we suggest that the transformation of dactyl colour depends entirely on their body size and not on their maturity. It is known that under global climatic changes, geographic range of species are gradually moving towards higher latitudes. The land hermit crab Coenobita purpureus Stimpson, 1858, has been shown to increase its northern limits on the Pacific coast of Japan (Sanda et al., Reference Sanda, Hamasaki, Dan and Kitada2019). It is possible that the frequency of the colour variation of C. virescens may follow the same pattern. Under the effect of global warming, the colour composition in southern locations might be gradually detected in more northern areas. The geographic difference in the colour morph could be the indicator for global climatic changes and, therefore, further continuous time-series monitoring will be needed.
Another possibility for this regional difference of dactyl colouration is the restricted growth size of C. virescens through limited shell resources, due to the high-pressure interspecific competition for snail shells. The potential preference of shell use pattern (species-specific shell preferences) varies between hermit crab species (Reese, Reference Reese1969; Imazu & Asakura, Reference Imazu and Asakura1996), and the shell usage patterns tend to restrict growth rate and reproductive potential. Interspecific competition seemed relatively low in temperate regions, since, in Clibanarius species, only one species (C. virescens) has been reported in rocky shores in the temperate regions of Japan (Honshu, Shikoku and Kyushu) (Imazu & Asakura, Reference Imazu and Asakura1996 and in this study). In contrast, more than two species of Clibanarius sympatrically inhabit the tropical area, in general. Therefore, interspecific competition may be higher in tropical regions. In this study, six Clibanarius species (C. corallinus, C. englaucus, C. eurysternus, C. humilis, C. snelliusi and C. striolatus) were collected in tropical regions of the northern hemisphere Pacific ocean (e.g. Amami-Oshima and Okinawa Island). One species, C. taeniatus was collected at the sampling station of Townsville, Queensland, Australia. Six species, C. corallinus, C. englaucus, C. eurysternus, C. humilis, C. merguiensis and C. striolatus, were collected from the sampling stations of Jawa and Lombok Island of Indonesia. And two species, C. cruentatus and C. merguiensis, were collected from Laem Panwa, Phuket, Thailand. Since competitive pressure might be higher in tropical regions, the growth ability of C. virescens may be restricted. Thus, the regional differences in the frequency of dactyl colourations may have occurred due to limited shell resources as a result of high interspecific competition for snail shells.
Differences in the occurrence of colour variations of pereopods
Yoshikawa et al. (Reference Yoshikawa, Nakano, Satoh and Asakura2018) suggested that W–PCM was not a juvenile colour. However, no quantitative investigation was conducted in Yoshikawa et al. (Reference Yoshikawa, Nakano, Satoh and Asakura2018). Thus, it was not clear whether the W–PCM type was a juvenile colour type or whether the colour type of C. virescens changes depending on its growth stage. In this study, our results confirmed that this colour type is frequently seen in the juvenile stage, as it was only found with an SL size range of 1.0–2.5 mm. The colouration changes to green or blue from white as the individual grows. As Yoshikawa et al. (Reference Yoshikawa, Nakano, Satoh and Asakura2018) mentioned, ovigerous females were also found close to this size (2.0–2.5 mm) (Figure 11), and the typical colouration (dark olive green) was also found for individuals with an SL size of 1.0–2.5 mm; no W–PCM individuals were found with more than a 3.0 mm SL size for both sexes (Figure 12). Also, ovigerous females with W–PCM colouration were not found in this study, and all ovigerous females exhibited either B–PCM or G–PCM colouration. Therefore, we conclude that the W–PCM type is a juvenile C. virescens colour, and the typical colours for this species are usually found in those individuals with ~2.5 mm in SL size.
Body colour is sometimes different between juveniles and adults of other hermit crab species, for example, Rahayu & Forest (Reference Rahayu and Forest1999) described a new species, Ca. areolatus, which superficially resembles Ca. morgani Rahayu & Forest, Reference Rahayu and Forest1999, but with small dots on the dactyls and propodi of the second and third pereopods. However, Komai (Reference Komai2004) revealed that Ca. areolatus is a juvenile stage of Ca. morgani. Because the distinctively different juvenile colourations can cause hermit crab taxonomic confusion, quantitative investigation of the colour transition of hermit crabs is very important for future taxonomic and ecological studies.
In this study, we also observed a B–PCM colouration on the pereopods, which was previously recognized by Asakura A. (unpublished) (Figure 4). Clibanarius virescens was described based on specimens obtained from the coast of Natal, South Africa (Krauss, Reference Krauss1843), and the colouration was originally described by Krauss (Reference Krauss1843) as ‘dark olive-green’. Crustacean body colour sometimes differs in the stage immediately following moulting (Kurup, Reference Kurup1964; Reaka, Reference Reaka1975). In some Anomura species, the carapace and chelipeds are completely hardened after ~20 and 7 days, respectively, following moulting (Kurup, Reference Kurup1964). Moreover, it is also known that colouration develops best during the post-moulting stages in other crustaceans, such as stomatopod species (Reaka, Reference Reaka1975). However, in C. virescens, it seemed as though the colour difference does not only depend on the moulting stages. If the colour type of C. virescens did indeed depend on those stages, the B–PCM ought to have been found at every SL size at a constant rate.
Although the occurrence of the B–PCM type was very low for both sexes in Japanese and Indonesian waters, the frequency of this pattern was relatively high in Phuket, Thailand (Figures 13 and 14). Excluding females, no significant SL size difference was found between green–pereopod and B–PCM individuals from Phuket, Thailand; only females with B–PCM were significantly smaller than the green–pereopod individuals (Figure 13B; Table 6). As a result, it was difficult to conclude whether the B–PCM colouration was caused by growth stages or not. Therefore, we could not ascertain the reason for this geological difference or the significance of this colour variation. This colour type might be related to the feeding habits of the Phuket, Thailand population. Clibanarius virescens is known to climb out of tidal pools onto rock surfaces exposed to air during low tide; it experienced a peak at ~3.0–4.0 mm shield size (Yoshikawa et al., Reference Yoshikawa, Goto, Yasuda and Asakura2020). Thus, it is also possible that the colour formation might change depending on the intensity of sunlight in each environment. Otherwise, negative frequency-dependent selection may have occurred on B–PCM and G–PCM to maintain the genetic variation in their population. Therefore, the frequency of these two colourations may be dynamically changing on a long timescale.
Genetic differences linked to colouration
Our molecular analyses suggest that the monophyly of all colour DCGs sorted following the dactyl's colour type (AA, AB, ABC, AC, B, BC and CC) and colour types G–PCM and B–PCM were included in the same clade (PG–1) of C. virescens. Although PG–2 and 3 are composed of only CC specimens, it may be biased since almost all specimens used in molecular analysis exhibited BB, BC or CC colour types. Therefore, we concluded that all of these DCGs and the colour variations of the pereopods (G–PCM and B–PCM) are the result of intraspecific variations of C. virescens, but not interspecific differences. Although no genetic differences between the G–PCM, B–PCM and each DCG were detected, the ML analyses and haplotypes network analyses showed three genetically differentiated populations (PG–1, 2 and 3) (Figures 5 and 6). PG–2 was composed of some North Australian and Thailand samples, and PG–3 was only composed of some of the samples from Lombok Island, Indonesia.
DNA barcoding and phylogeographic pattern
Clibanarius virescens was originally described based on specimens obtained from the coast of Natal, South Africa (Krauss, Reference Krauss1843), and has been documented on many rocky shores and coral reef localities of the Indo–West Pacific region, such as Mayotte Island (Poupin et al., Reference Poupin, Bouchard, Dinhut, Cleva and Dumas2013), Indonesia (Rahayu & Forest, Reference Rahayu and Forest1993), Vietnam (Fize & Seréne, Reference Fize and Seréne1955), Thailand (McLaughlin, Reference McLaughlin2002), Guam (Haig & Ball, Reference Haig and Ball1988), Somalia (Lewinsohn, Reference Lewinsohn1982), Australia (Morgan, Reference Morgan1987, Reference Morgan1989) and Japan (Hirose et al., Reference Hirose, Osawa and Hirose2010; Yoshikawa et al., Reference Yoshikawa, Nakano, Satoh and Asakura2018, Reference Yoshikawa, Ikeo, Imoto, Jaingam, Putri, Appukuttannair and Asakura2019). Although C. virescens has been recognized as one of the most geographically widely distributed hermit crabs, its geographic differentiation pattern has not yet been elucidated using molecular methods. Further, the demographic history and existence of cryptic species or populations have not been discussed yet.
In our molecular analysis, PG–1 consisted of the samples from all localities, and these haplotypes were connected by some mutations with or without several missing haplotypes and showed a more complex haplotype network than other PGs. As a factor of speciation and population deviation, the sea-level fluctuation during the Pleistocene era that made the land between the Indian and the Pacific Ocean is a well-known factor for many organisms of tropical marine biota (Smith & Sandwell, Reference Smith and Sandwell1997; Williams & Benzie, Reference Williams and Benzie1998; Voris, Reference Voris2000). Therefore, C. virescens might have also experienced the bottleneck effect of removing the ancestral polymorphisms of the COI gene around Phuket, Thailand.
Moreover, according to our ML phylogenetic reconstruction, the haplotype from Thailand, which was in PG–1, was not located in the nearest position to PG–2 (purple branches of Figure 5). This result indicated that the Thailand haplotypes in PG–1 are not closely related to PG–2. Since some haplotypes that belonged to PG–1 (major haplotype) were also detected in Phuket, Thailand, a second genetic inflow to Phuket from the West Pacific regions might have occurred during the planktonic larvae stage by using ocean currents or by being introduced via a ship's ballast water. One North Australian haplotype that belonged to PG–2 might support this hypothesis. Endemic haplotypes (PG–3) were also found in Lombok Island, Indonesia. Near Lombok Island, the Malacca Strait is a geographic barrier that separates the genetic population of tropical marine biota on Jawa–Bali Island and Lombok Island (Williams & Benzie, Reference Williams and Benzie1998; Reid et al., Reference Reid, Lal, Dodds, Kaligis, Littlewood and Williams2006). Therefore, it may also work as a geographic barrier to induce the deviation of C. virescens populations. Otherwise, if PG-2 and PG-3 represent the early stages of speciation in Phuket, Thailand and Lombok Island, it would be difficult to see how they are reproductively isolated from the PG-1 individuals, although they occur sympatrically. Behavioural experiments on mate choice and/or more detailed population genetic analysis in these two fields, respectively, may answer the above question.
Another possibility is that the actual population might have more haplotypes connecting with the haplotypes of PG–2 and PG–3; the haplotypes belonging to PG–2 and –3 may also have been distributed between the Coral Sea to the East China Sea. The core–periphery hypothesis (da Cunha et al., Reference da Cunha, Burla and Dobzhansky1950; Brussard, Reference Brussard1984) and the abundant-centre (Antonovics, Reference Antonovics1976; Hengeveld & Heack, Reference Hengeveld and Heack1982) hypothesis are well known as expected outcomes of high genetic diversity in a geographically widely distributed cosmopolitan species. There is still the possibility that there is more genetic diversity in tropical C. virescens populations, as our molecular population analysis shows. To confirm this possibility, both the analysis of other DNA regions (e.g. several nucleus DNA markers in addition to COI) and comprehensive sampling between each survey region is necessary.
Summary and conclusion of the present study
Our research focused on the colour variants of the intertidal hermit crab C. virescens, and we investigated the factors and genetic characters impacting on colouration. The investigation was conducted with particular emphasis on speciation (e.g. detecting cryptic species/populations), phylogenetic/genetic relationships, growth stages, sex and regional differences in specimens from tropical/subtropical to warm temperate areas in the Indo–West Pacific. We, then, confirmed that the colouration on the pereopod dactyls gradually changed from a solid colour (yellow or white) to having dark-coloured area(s) or transverse band(s) as a result of the growth stage. The frequency of occurrence of the solid colour dactyls was higher than those of other colour types in tropical regions. Moreover, it was also confirmed that the white ambulatory leg type was a part of the colouration frequently seen in the juvenile stage. None of these colour variants were genetically differentiated in our phylogenetic analysis with the mitochondrial cytochrome oxidase subunit I (COI) gene. In summary, the latitudinal/growth-stage difference in the occurrence of colour variation was found in C. virescens, without a genetic distinction; the genetic structure was detected in the geographic population, not on each colour morph. To the best of our knowledge, this study is the first investigation of the factors influencing the colour variation of C. virescens, and it emphasizes the necessity for further investigations on colour variations of morphologically similar marine species linked with taxonomic and ecological studies.
Supplementary material
The supplementary material for this article can be found at https://doi.org/10.1017/S002531542000106X
Acknowledgements
We are grateful to Ms Chie Iwamoto for assisting our experiments and to Dr Norikazu Kitamura for improving our manuscript and supporting our analysis, and also to all staff members of the Centre for Information Biology, National Institute of Genetics. We are also grateful to Mr Ryo Nakayama (Kyoto University), Mr Hisanori Kohtsuka, Dr Masanori Okanishi (University of Tokyo), Dr Asuka Sentoku (University of the Ryukyu), Dr Seiji Arakaki (Kyushu University), Ms Vararin, and all of the staff of the Phuket Marine Biological Centre, Thailand (PMBC) for their help with sample collection. We are especially thankful to Dr Niel L. Bruce (Museum of Tropical Queensland, Townsville, Queensland) and Dr Laure Corbari (Muséum national d'Histoire naturelle, Paris, France), who allowed us the opportunity to examine the Clibanarius specimens held in their respective museums. The authors would like to thank Enago (www.enago.jp) for the English language review.


 Open access

