


Introduction
An earlier version of this paper was presented at the 54 European Microwave Conference (EuMC 2024) and was published in its Proceedings [Reference Negri, Ballarini, Fuscaldo, Burghignoli and Galli1] where we preliminarily analyzed the evolution of leaky modes in Fabry–Perot cavity antennas (FPCAs) based on thin and thick partially reflecting sheets (PRSs). The content of [Reference Negri, Ballarini, Fuscaldo, Burghignoli and Galli1] is extended in this paper by deeply investigating a field-matching-technique (FMT) approach to analyze and describe this kind of radiating structures. Moreover, a realistic implementation of the considered leaky-wave antenna has been designed with a rectangular-waveguide feeder, impedance-matched through an efficient semi-analytical approach.
As previously discussed in [Reference Negri, Ballarini, Fuscaldo, Burghignoli and Galli1], FPCAs provide a simple yet effective solution to the long-standing problem of a simultaneously highly directive and low-profile radiating device [Reference Burghignoli, Fuscaldo and Galli2]. These characteristics are crucial in different application contexts, such as advanced terrestrial [Reference Kim, Ju and Choi3, Reference Hussain, Jeong, Park and Kim4] and satellite communications [Reference Muhammad, Sauleau and Legay5].
Fabry–Perot cavity antennas share a common architecture that consists in a grounded dielectric slab with a PRS on top [Reference Fuscaldo, Tofani, Zografopoulos, Baccarelli, Burghignoli, Beccherelli and Galli6]. Such devices can simply be fed by vertical electric/magnetic dipoles (VEDs/VMDs), which excite an azimuthally symmetric transverse magnetic/electric (TM/TE) leaky mode. In this manner, an omnidirectional conical beam with scanning capabilities is achieved although it is not possible to radiate at broadside due to the null enforced by the source symmetry [Reference Burghignoli, Fuscaldo and Galli2, Reference Fuscaldo, Jackson and Galli7]. For this reason, in order to obtain a pencil beam at broadside, FPCAs are excited with a horizontal electric or magnetic dipole (HED or HMD), which is constituted by a bent coaxial cable (L-probe) [Reference Guo, Chia, Chen and Luk8, Reference Mateo-Segura, Feresidis and Goussetis9] or a quasi-resonant slot on the ground plane [Reference Feresidis and Vardaxoglou10], respectively. However, in this case, an omnidirectional conical beam can no longer be guaranteed, unless specific metasurfaces or metamaterials are used [Reference Burghignoli, Lovat, Capolino, Jackson and Wilton11, Reference Burghignoli, Lovat, Capolino, Jackson and Wilton12]. Due to the fragility of coaxial cables as the frequency increases [Reference Tumbaga13], (sub)millimeter-wave FPCAs are preferably fed by a rectangular slot on the ground plane excited by a rectangular waveguide [Reference Fuscaldo, Tofani, Zografopoulos, Baccarelli, Burghignoli, Beccherelli and Galli6] (such a solution can be extended up to the THz frequency range [Reference Negri, Fuscaldo, Burghignoli and Galli14–Reference Taillieu, Pascual, Pakovic, Morvan, Fuscaldo, Ettorre and González-Ovejero16]). In this paper, moreover, an efficient semi-analytical matching technique has been exploited to design two capacitive irises inside the rectangular-waveguide feeder of the proposed leaky-wave antenna [Reference Negri, Fuscaldo, Tofani, Burghignoli and Galli17].
As concerns the PRS implementation, the typical solution is given by a thin isotropic metasurface, i.e., a patterned metal sheet whose periodicity is much smaller than the operative wavelength [Reference Tretyakov18]. Common examples are metal strip gratings and patch arrays [Reference Luukkonen, Simovski, Granet, Goussetis, Lioubtchenko, Raisanen and Tretyakov19], although it has recently been proven that a fishnet unit cell provides more degrees of freedom and is more suitable for high-frequency (viz., THz) designs [Reference Fuscaldo, Tofani, Zografopoulos, Baccarelli, Burghignoli, Beccherelli and Galli6]. Such structures are usually realized through low-cost, large-area, photolithographic techniques with a resolution down to  $3\,\mu\mathrm{m}$. The latter ensures the repeatability and accuracy of the PRS physical implementation up to THz frequencies [Reference Fuscaldo, Maita, Maiolo, Beccherelli and Zografopoulos20]. By assuming an ideal metal, i.e., a perfect electric conductor (PEC), a thin PRS can be represented through a scalar, purely imaginary, equivalent impedance sheet $Z_s=jX_s$ [Reference Fuscaldo, Tofani, Zografopoulos, Baccarelli, Burghignoli, Beccherelli and Galli6, Reference Tretyakov18, Reference Luukkonen, Simovski, Granet, Goussetis, Lioubtchenko, Raisanen and Tretyakov19] (such hypothesis has been experimentally demonstrated also in the THz band [Reference Fuscaldo, Maita, Maiolo, Beccherelli and Zografopoulos20]).
As is well-known [Reference Zhao, Jackson, Williams and Oliner21], FPCAs become more directive (with the drawback of a lower bandwidth) as the reflectivity of the PRS increases and, thus, as  $X_s\to0$. In particular, for an air-filled cavity with a thin PRS on top, it is seen that the figure of merit given by the product of the directivity and the fractional bandwidth is constant and equal to 2.47 [Reference Jackson, Caloz and Itoh22]. This aspect is related to the resonance condition of FPCAs (see, e.g., [Reference von Trentini23]), which is exactly satisfied for a single frequency due to the Foster-like behavior [Reference Foster24] of a thin PRS [Reference Negri, Ballarini, Fuscaldo, Burghignoli and Galli1]. Such a narrowband characteristic has been mitigated by optimizing the PRS design with different approaches, such as genetic algorithms [Reference Kim, Ju and Choi3], double-layer PRS metasurfaces [Reference Lv, Ding and Wang25], and multi-layer structures [Reference Hosseini, Capolino, De Flaviis, Burghignoli, Lovat and Jackson26, Reference Al-Tarifi, Anagnostou, Amert and Whites27].
One of the most promising solutions is given by thick PRSs [Reference Hosseini, De Flaviis and Capolino28] which are constituted by an isotropic metallic metasurface with a dielectric superstrate on top. By properly designing the superstrate height h sup, it is possible to achieve a non-Foster-like response of the thick PRS which is related to the presence of a positive slope of the phase of the reflection coefficient of the PRS,  $\Gamma_{\rm PRS}$ [Reference Almutawa, Hosseini, Jackson and Capolino29]. In this manner, it is possible to properly design the PRS to closely fulfill the cavity resonance condition over a wider frequency region with respect to the thin PRS case, and thus improve the FPCA gain-bandwidth figure of merit [Reference Almutawa, Hosseini, Jackson and Capolino29].
In the literature, the design of thick PRSs has been addressed through a combined leaky-wave and full-wave approach. In particular, the contribution of the PRS in the transverse equivalent network (TEN) of the FPCA – which is used for retrieving the leaky-mode dispersion curves through the transverse resonance technique [Reference Sorrentino and Mongiardo30] – has been described through the evaluation of its reflection coefficient with commercial solvers [Reference Almutawa, Hosseini, Jackson and Capolino29]. Here, as in the previous version of this paper [Reference Negri, Ballarini, Fuscaldo, Burghignoli and Galli1], a FMT is exploited for retrieving the variation of the behavior of leaky modes when the device changes from a thin to a thick PRS with different superstrate thicknesses. This analysis demonstrates that the bandwidth enhancement in these radiating devices occurs because of an additional resonance of the leaky mode in the superstrate. Moreover, in this paper, the considered FPCA based on a thick PRS has been simulated and fed through a realistic rectangular-waveguide source matched by means of a semi-analytical approach [Reference Negri, Fuscaldo, Tofani, Burghignoli and Galli17].
The paper is organized as follows. In second section, the theoretical background related to FPCAs based on thick PRS is briefly reported by showing the optimal choice of the cavity height h sub, the TEN of the device, and the dispersion analysis of the leaky modes. In Section “Field matching technique”, the FMT is presented and exploited to describe how the leaky-mode field distributions change as the cavity parameters vary. In Section “Full-wave analysis”, the model of the proposed device is implemented on a full-wave solver with a realistic feeder to corroborate the far-field results. Conclusions are finally drawn in last section.
Theoretical background
Fabry–Perot cavity antennas have been studied with different approaches, such as the ray-optics model [Reference von Trentini23], the application of the reciprocity theorem on their equivalent transmission line [Reference Zhao, Jackson, Williams and Oliner21], and the leaky-wave perspective [Reference Burghignoli, Fuscaldo and Galli2]. Regardless the considered method, the most important design rule in FPCAs is related to the proper choice of the cavity height h as a function of Xs and the working frequency f with the aim of maximizing the radiated power on a certain direction θ 0. For an air-filled cavity pointing at broadside, i.e., with  $\theta_0=0$, it results [Reference von Trentini23]:
 \begin{equation}
h(f) = \frac{\lambda_0}{4\pi}\left[\phi_{\rm PRS}(f)-\pi(2n-1)\right], \; n = 0,\pm 1, \dots,
\end{equation}
\begin{equation}
h(f) = \frac{\lambda_0}{4\pi}\left[\phi_{\rm PRS}(f)-\pi(2n-1)\right], \; n = 0,\pm 1, \dots,
\end{equation} where λ 0 is the vacuum wavelength at the frequency f and ϕ PRS is the phase of the reflection coefficient seen from the ground plane, i.e.,  $\Gamma_{\rm PRS} = |\Gamma_{\rm PRS}|e^{j\phi_{\rm PRS}}$ (see Fig. 1). The evaluation of the $\Gamma_{\rm PRS}$ value can be addressed in any commercial solver by considering the simulation of the unit cell in a periodic environment (see e.g., [Reference Fuscaldo, Tofani, Zografopoulos, Baccarelli, Burghignoli, Beccherelli and Galli6, Reference Almutawa, Hosseini, Jackson and Capolino29] for further details).
In this paper, a metal strip grating with periodicity  $p=\lambda_0/6$ and strip width $w=0.125p$ is considered (see Fig. 1), obtaining $X_s\simeq100\;\Omega$ (in good agreement with homogenization formulas in [Reference Luukkonen, Simovski, Granet, Goussetis, Lioubtchenko, Raisanen and Tretyakov19]). The reflection coefficient $\Gamma_{\rm PRS}$ at the substrate-air interface has been retrieved for three different examples in the 45–75 GHz frequency range through a frequency-domain simulation on CST Microwave Studio [31]: the case of the simple thin PRS, and a pair of thick-PRS configurations realized through the same metal strip grating with a lossless superstrate on top whose relative permittivity is $\varepsilon_r=6.15$ and whose heights are $h_{\rm sup}=0.5$ mm or $h_{\rm sup}=1.3$ mm. This dielectric choice is representative of a realistic Rogers TC600 laminate which presents the same relative permittivity ɛr with a negligible, loss-tangent value of $\tan\delta=0.002$.
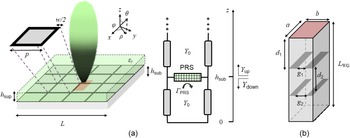
(a) Schematic representation of a Fabry–Perot cavity antenna, its thin-PRS unit cell, and its broadside pencil-beam radiation pattern. While the gray solid describes the air-filled cavity, the black color shows the perfect electric conductor which is used to implement the thin-PRS metallic pattern. The semi-transparent green solid box describes the dielectric superstrate which is present only for Fabry–Perot cavity antennas based on thick PRSs. The red rectangular area shows the slot on the ground plane fed by the rectangular waveguide. On the right, the TEN of the device is reported. The PRS contribution, both in the thin and in the thick cases, is described by the reflection coefficient  $\Gamma_{\rm PRS}$ of the PRS looking upwards from the cavity. (b) Rectangular-waveguide feeder and its matching network constituted by two capacitive irises with their relevant design parameters. The red area on top represents the section at which the source is connected to the Fabry–Perot cavity antenna.

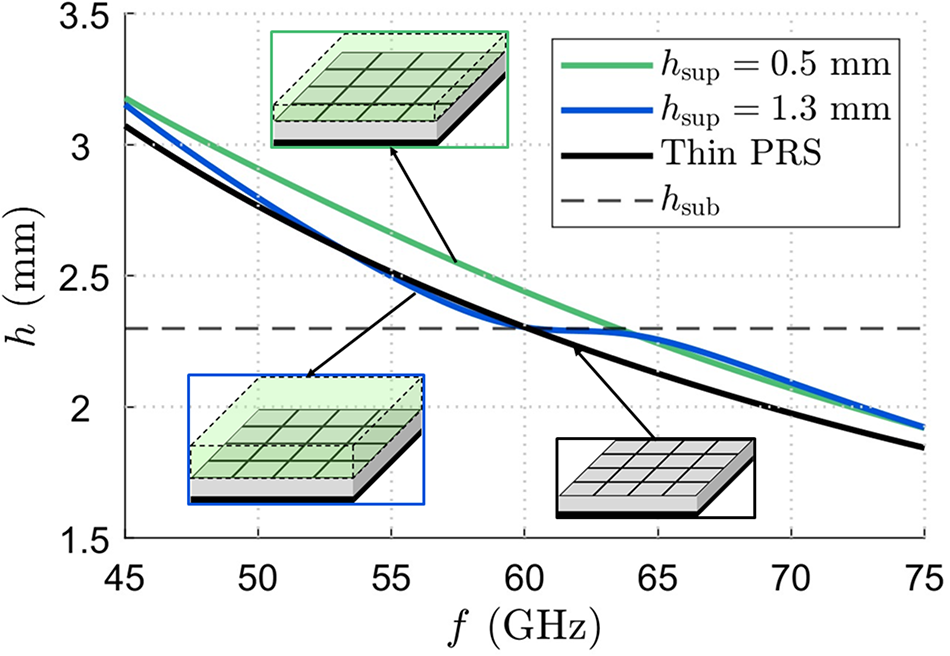
As one can infer from Fig. 2, the curve of the optimal substrate height h in the case of the thin-PRS case and the case of a thick PRS with  $h_{\rm sup}=0.5$ mm intersects the design substrate height $h_{\rm sub}=2.3$ mm only at a single frequency. This condition results from the Foster-like behavior of the phase of the reflection coefficient ϕ PRS, viz. $\partial\phi_{\rm PRS}/\partial f \lt 0$. In order to enhance the device working bandwidth, the condition (1) has to be satisfied over a wide frequency range. For this reason, a thicker superstrate (viz., $h_{\rm sup}=1.3$ mm) has been placed above the thin PRS, obtaining a thick PRS with a non-Foster behavior. Interestingly, this phase envelope is present only near the condition $h_{\rm sup}\simeq\lambda_d/2$ (with λd being the operative wavelength in the dielectric superstrate) and not for a thinner or thicker superstrate. As shown in Fig. 2, equation (1) is now satisfied over a wide frequency range for a substrate height ${h=h_{\rm sub}=2.3}$ mm (the relevant curve of h has a flat behavior vs. f around 60 GHz), leading to the desired wide bandwidth.
Cavity height h which satisfies the resonance condition (1) vs. frequency f in the presence of a thin PRS (black solid line) or of a thick PRS with  $h_{\rm sup}=0.5$ mm (green solid line) or $h_{\rm sup}=1.3$ mm (blue solid line). The thin, black, dashed horizontal line represents the substrate height $h_{\rm sub}=2.3$ mm chosen in this work. The insets pictorially show the device for each configuration.
At this point, it is worth noting that in FPCAs based on thin [Reference Burghignoli, Fuscaldo and Galli2] or thick [Reference Almutawa, Hosseini, Jackson and Capolino29] PRS, the radiating features – such as the radiation pattern, the directivity, and the bandwidth – can be predicted through the evaluation of the leaky radial wavenumber  $k_\rho = \beta-j\alpha$ (with β and α being the leaky phase and attenuation constants, respectively). This task can be addressed by numerically solving the dispersion equation [Reference Galdi and Pinto32] obtained by applying the transverse resonance technique [Reference Sorrentino and Mongiardo30] to the TEN of the device. For the considered structures the dispersion equation reads (see Fig. 1):
 \begin{equation}
Y_{\rm up}+Y_{\rm down}=Y_{\rm up}-jY_0\cot(k_zh_{\rm sub})=0,
\end{equation}
\begin{equation}
Y_{\rm up}+Y_{\rm down}=Y_{\rm up}-jY_0\cot(k_zh_{\rm sub})=0,
\end{equation} where Y 0 is the wave admittance of the substrate transmission line and  $k_z=\sqrt{k_0^2-k_\rho^2}$ its propagation constant (being k 0 the vacuum wavenumber). The value Y up represents the admittance of the PRS looking upwards from the cavity, thus, it can easily be retrieved through the full-wave evaluation of the reflection coefficient $\Gamma_{\rm PRS}$ for a normal incidence (which represents with a good approximation the PRS behavior for low-angle oblique incidences):
 \begin{equation}
Y_{\rm up} = Y_0\frac{1-\Gamma_{\rm PRS}}{1+\Gamma_{\rm PRS}}.
\end{equation}
\begin{equation}
Y_{\rm up} = Y_0\frac{1-\Gamma_{\rm PRS}}{1+\Gamma_{\rm PRS}}.
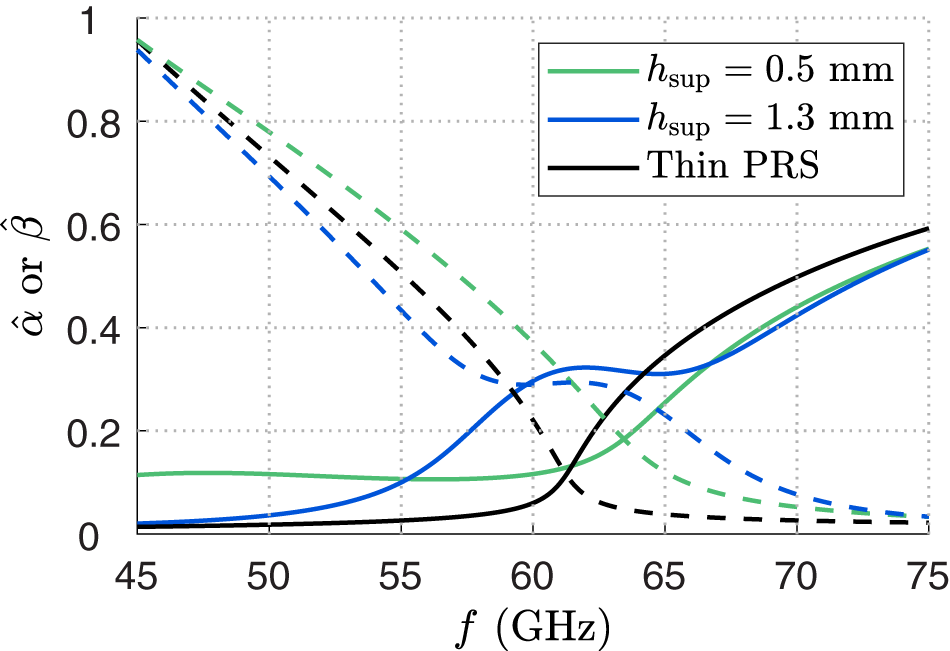
\end{equation} The results of the proposed analysis are shown in Fig. 3, where the leaky phase and attenuation constants are reported normalized with respect to the vacuum wavenumber with  $\hat{\beta}=\beta/k_0$ and $\hat{\alpha}=\alpha/k_0$, respectively. It is worthwhile to point out that, as theoretically expected from the ray-optics approximation in (1) and shown in Fig. 2, the condition for which occurs the maximum radiated power at broadside, i.e., $\beta\simeq\alpha$ [Reference Lovat, Burghignoli and Jackson33], is verified just at a single frequency for the case of a thin PRS and the case of a PRS which is not thick enough ( $h_{\rm sup}=0.5$ mm). On the other hand, for a properly designed thick PRS with $h_{\rm sup}=1.3$ mm, the leaky phase β and attenuation α constants are very similar to each other over a wider frequency range, thus obtaining a theoretically wider −3 dB gain bandwidth.
Dispersion curves vs. frequency f of the leaky-wave phase (solid lines) and attenuation (dashed lines) constants normalized with respect to the vacuum wavenumber k 0, i.e.,  $\hat{\beta}=\beta/k_0$, and $\hat{\alpha}=\alpha/k_0$, respectively. The cases of a thin PRS, a thick PRS with $h_{\rm sup}=0.5$ mm, and a thick PRS with $h_{\rm sup}=1.3$ mm are reported in black, green, and blue curves, respectively.

Field matching technique
In this section, the leaky modes in an FPCA transitioning from a thin- to a thick-PRS case are investigated through an FMT approach. Without loss of generality, we assume the FPCA excited by an HMD source aligned with the x-axis, and we obtain the tangential electromagnetic fields over the E-plane,  $\phi=90^\circ$. We recall that this source excites a purely $\mathrm{TM}_z$ ( $\mathrm{TE}_z$) electromagnetic field over the E-plane (H-plane) [Reference Ip and Jackson34]. Thanks to the geometry of the problem, as shown in [Reference Negri, Ballarini, Fuscaldo, Burghignoli and Galli1], the electric-field modal solution for an FPCA based on a thin PRS can be written as:
 \begin{equation}\left\{\begin{array}{lcl}
E_\rho(z)&=A_2e^{-jk_z(z-h_{\mathrm s\mathrm u\mathrm b})},& z \gt h_{\mathrm s\mathrm u\mathrm b}\\
E_\rho(z)&=A_1\sin{(k_zz)},& z \leq h_{\mathrm s\mathrm u\mathrm b}\end{array}\right.
\end{equation}
\begin{equation}\left\{\begin{array}{lcl}
E_\rho(z)&=A_2e^{-jk_z(z-h_{\mathrm s\mathrm u\mathrm b})},& z \gt h_{\mathrm s\mathrm u\mathrm b}\\
E_\rho(z)&=A_1\sin{(k_zz)},& z \leq h_{\mathrm s\mathrm u\mathrm b}\end{array}\right.
\end{equation} where A 1 and A 2 are complex amplitude coefficients. This is due to the propagative nature of the electric field above the PRS (for  $z\ge h_{\rm sub}$) and its resonant behavior in the FPCA (for $z\le h_{\rm sub}$) with a null on the ground plane at z = 0. At this point, from Maxwell’s equations, the magnetic field reads:
 \begin{equation}\left\{\begin{array}{lcl}H_\phi(z) & = Y_0A_2e^{-jk_z(z-h_{\rm sub})},& z \gt h_{\rm sub}\\H_\phi(z) & = jY_0A_1\cos{(k_zz)},& z \le h_{\rm sub}\end{array}\right.\end{equation}
 By applying the boundary conditions at  $ z=h_{\rm sub}$ related to the homogenized metasurface representing the PRS (viz., $E_\rho(z=h_{\rm sub}^-)=E_\rho(z=h_{\rm sub}^+)$ and $H_\phi(z=h_{\rm sub}^+)-H_\phi(z=h_{\rm sub}^-)=Y_sE_\rho(z=h_{\rm sub})$), the problem can be recast in the following matrix form:
 \begin{equation}
\begin{bmatrix}
\sin{(k_zh)} & -1\\
-jY_0\cos{(k_zh)}+Y_s\sin{(k_zh)} & Y_0
\end{bmatrix}
\begin{bmatrix}
A_1 \\ A_2
\end{bmatrix}=0,
\end{equation}
\begin{equation}
\begin{bmatrix}
\sin{(k_zh)} & -1\\
-jY_0\cos{(k_zh)}+Y_s\sin{(k_zh)} & Y_0
\end{bmatrix}
\begin{bmatrix}
A_1 \\ A_2
\end{bmatrix}=0,
\end{equation} with  $Y_s=1/Z_s$ being the equivalent admittance sheet of the PRS. A nontrivial solution for (6) is obtained by enforcing the determinant to zero, which yields the determinantal equation (note that the analogous formula, i.e. (7) of [Reference Negri, Ballarini, Fuscaldo, Burghignoli and Galli1], has an incorrect sign of the second addend):
 \begin{equation}
Y_0+Y_s-jY_0\cot{(k_zh)}=0,
\end{equation}
\begin{equation}
Y_0+Y_s-jY_0\cot{(k_zh)}=0,
\end{equation} which is equivalent to (2), since  $Y_{\rm up}=Y_0+Y_s$, but a full-wave simulation is not needed for the evaluation of $\Gamma_{\rm PRS}$. It is worthwhile to note that, assuming an Ys dependent on θ, this approach is valid for any angle of incidence. Moreover, by considering PRS unit-cell configurations that are almost spatially nondispersive [Reference Fuscaldo, Tofani, Zografopoulos, Baccarelli, Burghignoli, Beccherelli and Galli6], a constant Ys value for different incident angles can be assumed, still providing a valid antenna model. Equation (7) can then be numerically solved [Reference Galdi and Pinto32], obtaining the same leaky wavenumbers of “Theoretical background” section. In addition, the leaky-wave fields can be determined by solving for the unknown coefficients in (6). (The two equations are linearly dependent, so one of the two coefficients is arbitrarily set to unity and the reduced system solved for the other coefficient.)
A similar FMT approach can be repeated to obtain the leaky-wave fields for the thick-PRS case. By following the same procedure of the thin-PRS structure but assuming the presence of an additional layer, one has the following magnetic-field distribution:
 \begin{equation}
\begin{cases}
H_\phi(z) &= A_1e^{-jk_{z0}(z-h_{\rm tot})}, \;\; z\ge h_{\rm tot}\\
H_\phi(z) &= A_2\cos{\left[k_{zd}(z-h_{\rm sub})\right]}+\\
&A_3\sin{\left[k_{zd}(z-h_{\rm sub})\right]}, \;\; h_{\rm sub} \lt z \lt h_{\rm tot}\\
H_\phi(z) &= A_4\cos{\left(k_{z0}z\right)}, \;\; 0\le z\le h_{\rm sub},
\end{cases}
\end{equation}
\begin{equation}
\begin{cases}
H_\phi(z) &= A_1e^{-jk_{z0}(z-h_{\rm tot})}, \;\; z\ge h_{\rm tot}\\
H_\phi(z) &= A_2\cos{\left[k_{zd}(z-h_{\rm sub})\right]}+\\
&A_3\sin{\left[k_{zd}(z-h_{\rm sub})\right]}, \;\; h_{\rm sub} \lt z \lt h_{\rm tot}\\
H_\phi(z) &= A_4\cos{\left(k_{z0}z\right)}, \;\; 0\le z\le h_{\rm sub},
\end{cases}
\end{equation} where  $h_{\rm tot}=h_{\rm sub}+h_{\rm sup}$ is the total device height, ${k_{z0}=\sqrt{k_0^2-k_\rho^2}}$, and $k_{zd}=\sqrt{\varepsilon_rk_0^2-k_\rho^2}$ are the propagation constants in the vacuum and dielectric, respectively.
By applying Maxwell’s equation for this TM-polarized field, one can retrieve the electric-field distribution as:
 \begin{equation}
\begin{cases}
E_\rho(z) &= Z_0A_1e^{-jk_{z0}(z-h_{\rm tot})}, \;\; z\ge h_{\rm tot}\\
E_\rho(z) &= jZ_d\{A_3\cos{\left[k_{zd}(z-h_{\rm sub})\right]}-\\ & A_2\sin{\left[k_{zd}(z-h_{\rm sub})\right]}\}, \;\; h_{\rm sub} \lt z \lt h_{\rm tot}\\
E_\rho(z) &= -jZ_0A_4\sin{\left(k_{z0}z\right)}, \;\; 0\le z\le h_{\rm sub},
\end{cases}
\end{equation}
\begin{equation}
\begin{cases}
E_\rho(z) &= Z_0A_1e^{-jk_{z0}(z-h_{\rm tot})}, \;\; z\ge h_{\rm tot}\\
E_\rho(z) &= jZ_d\{A_3\cos{\left[k_{zd}(z-h_{\rm sub})\right]}-\\ & A_2\sin{\left[k_{zd}(z-h_{\rm sub})\right]}\}, \;\; h_{\rm sub} \lt z \lt h_{\rm tot}\\
E_\rho(z) &= -jZ_0A_4\sin{\left(k_{z0}z\right)}, \;\; 0\le z\le h_{\rm sub},
\end{cases}
\end{equation} where  $Z_0=k_{z0}/(\omega\varepsilon_0)=1/Y_0$ and $Z_d=k_{zd}/(\omega\varepsilon_r\varepsilon_0)$.
At this point the boundary conditions have to be enforced. In particular, while the continuity of the tangential components of the electric and magnetic field has to be considered in  $z=h_{\rm tot}$, only the tangential electric field is invariant at $z=h_{\rm sub}$. As for the ‘thin’ case, this aspect is due to the presence of the PRS which enforces the discontinuity of the tangential magnetic field components caused by an induced current as $\mathbf{J}_s=Y_s\mathbf{E}_\rho=\mathbf{z}\times(\mathbf{H}^+-\mathbf{H}^-)$. In this manner, a system with four equations and four unknowns is obtained and reported in its matrix form:
 \begin{equation}
\begin{aligned}
\left[\begin{matrix}
1 & -\cos{\left(k_{zd}h_{\rm sup}\right)} &-\sin{\left(k_{zd}h_{\rm sup}\right)} \\ Z_0 & jZ_d\sin{\left(k_{zd}h_{\rm sup}\right)} & -jZ_d\cos{\left(k_{zd}h_{\rm sup}\right)}\\
0 & 0 & jZ_d\\
0 & 1 & jZ_dY_s\\
\end{matrix}\right. \quad\dotsm \\
\dotsm\quad\left.\begin{matrix}
0\\
0\\
jZ_0\sin{(k_{z0}h_{\rm sub})}\\
-\cos{(k_{z0}h_{\rm sub})}
\end{matrix}\right]
\begin{bmatrix}
A_1 \\ A_2 \\ A_3 \\ A_4
\end{bmatrix}=0
\end{aligned}
\end{equation}
\begin{equation}
\begin{aligned}
\left[\begin{matrix}
1 & -\cos{\left(k_{zd}h_{\rm sup}\right)} &-\sin{\left(k_{zd}h_{\rm sup}\right)} \\ Z_0 & jZ_d\sin{\left(k_{zd}h_{\rm sup}\right)} & -jZ_d\cos{\left(k_{zd}h_{\rm sup}\right)}\\
0 & 0 & jZ_d\\
0 & 1 & jZ_dY_s\\
\end{matrix}\right. \quad\dotsm \\
\dotsm\quad\left.\begin{matrix}
0\\
0\\
jZ_0\sin{(k_{z0}h_{\rm sub})}\\
-\cos{(k_{z0}h_{\rm sub})}
\end{matrix}\right]
\begin{bmatrix}
A_1 \\ A_2 \\ A_3 \\ A_4
\end{bmatrix}=0
\end{aligned}
\end{equation} This system has a nontrivial solution only if the determinant is set to zero. As for the thin PRS case, it is thus possible to retrieve the dispersion equation of the structure without full-wave simulations. After few mathematical steps and by indicating  $Y_d=1/Z_d$, the determinantal equation reads:
 \begin{equation}
Y_s+Y_d\frac{Y_0+jY_d\tan{(k_{zd}h_{\rm sup})}}{Y_d+jY_0\tan{(k_{zd}h_{\rm sup})}}-jY_0\cot{(k_{z0}h_{\rm sub})}=0.
\end{equation}
\begin{equation}
Y_s+Y_d\frac{Y_0+jY_d\tan{(k_{zd}h_{\rm sup})}}{Y_d+jY_0\tan{(k_{zd}h_{\rm sup})}}-jY_0\cot{(k_{z0}h_{\rm sub})}=0.
\end{equation}It is worth noting that equation (11) is crucial for further studies and optimization procedures in FPCAs since it provides for the first time the dispersion analysis of these structures without requiring a full-wave simulation of the thick-PRS behavior.
When (11) is satisfied, all the equations in (10) are not independent. It is thus possible, for instance, to remove the first row and assume  $A_1=1$. In this way, one has:
 \begin{equation}
\begin{aligned}
\left[\begin{matrix}
jZ_d\sin{\left(k_{zd}h_{\rm sup}\right)} & -jZ_d\cos{\left(k_{zd}h_{\rm sup}\right)}\\
0 & jZ_d\\
1 & jZ_dY_s
\end{matrix}\right. \quad\dotsm \\
\dotsm\quad\left.\begin{matrix}
0\\
jZ_0\sin{(k_{z0}h_{\rm sub})}\\
-\cos{(k_{z0}h_{\rm sub})}\\
\end{matrix}\right]
\begin{bmatrix}
A_2 \\ A_3 \\ A_4
\end{bmatrix}=
\begin{bmatrix}
-Z_0 \\ 0 \\ 0
\end{bmatrix}
\end{aligned}
\end{equation}
\begin{equation}
\begin{aligned}
\left[\begin{matrix}
jZ_d\sin{\left(k_{zd}h_{\rm sup}\right)} & -jZ_d\cos{\left(k_{zd}h_{\rm sup}\right)}\\
0 & jZ_d\\
1 & jZ_dY_s
\end{matrix}\right. \quad\dotsm \\
\dotsm\quad\left.\begin{matrix}
0\\
jZ_0\sin{(k_{z0}h_{\rm sub})}\\
-\cos{(k_{z0}h_{\rm sub})}\\
\end{matrix}\right]
\begin{bmatrix}
A_2 \\ A_3 \\ A_4
\end{bmatrix}=
\begin{bmatrix}
-Z_0 \\ 0 \\ 0
\end{bmatrix}
\end{aligned}
\end{equation}By inverting the matrix in (12), the coefficient are determined as shown in (13), thus achieving the complete field-distribution evaluation.
 \begin{equation}
\begin{cases}
A_4 &= \{-j\sin{\left(k_{z0}h_{\rm sub}\right)}\cos{\left(k_{zd}h_{\rm sup}\right)} + \\
&+\frac{Z_d}{Z_0} \sin{(k_{zd}h_{\rm sup})}[-j\cos{\left(k_{z0}h_{\rm sub}\right)}+\\
&+Z_dY_s\sin{\left(k_{z0}h_{\rm sub}\right)}]\}^{-1}\\
A_3 &= -A_4\frac{Z_0}{Z_d}\sin{\left(k_{z0}h_{\rm sub}\right)}\\
A_2 & = A_4\left[\cos{\left(k_{z0}h_{\rm sub}\right)}+jZ_0Y_s\sin{\left(k_{z0}h_{\rm sub}\right)}\right]
\end{cases}
\end{equation}
\begin{equation}
\begin{cases}
A_4 &= \{-j\sin{\left(k_{z0}h_{\rm sub}\right)}\cos{\left(k_{zd}h_{\rm sup}\right)} + \\
&+\frac{Z_d}{Z_0} \sin{(k_{zd}h_{\rm sup})}[-j\cos{\left(k_{z0}h_{\rm sub}\right)}+\\
&+Z_dY_s\sin{\left(k_{z0}h_{\rm sub}\right)}]\}^{-1}\\
A_3 &= -A_4\frac{Z_0}{Z_d}\sin{\left(k_{z0}h_{\rm sub}\right)}\\
A_2 & = A_4\left[\cos{\left(k_{z0}h_{\rm sub}\right)}+jZ_0Y_s\sin{\left(k_{z0}h_{\rm sub}\right)}\right]
\end{cases}
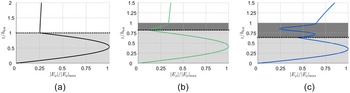
\end{equation} Some representative results of the FMT analyses are reported in Fig. 4. The tangential electric-field components, normalized with respect to their maxima, are plotted vs. z, normalized with respect to h tot ( $h_{\rm sup}=0$ for the FPCA based on a thin PRS). As expected, for a thin-PRS case (see Fig. 4(a)) the tangential electric field follows a sine-like envelope inside the cavity and a typical leaky pattern outside. We note that the value assumed by $|E_\rho|$ at the air-substrate interface strongly depends on the reactance value: a lower Xs generates a lower $|E_{\rho}(z=z_{\rm sub})|$ (for the limit case $X_s\to0$, the tangential electric field tends to zero as in the asymptotic case of a parallel-plate waveguide). It is even more interesting to observe the thick-PRS cases. As preliminarily discussed, a superstrate thickness $h_{\rm sup}=0.5$ mm is not enough to achieve a PRS non-Foster behavior (see Fig. 2 and Fig. 3) and, in turn, a bandwidth enhancement. This condition occurs, instead, for $h_{\rm sup}=1.3$ mm. This difference is present also for the modal-field distribution obtained through the FMT. As can be inferred by Fig. 4(b) and Fig. 4(c), the bandwidth enhancement in thick PRS is appreciable only for superstrate modes that properly resonate above the cavity. It is worthwhile to point out that this effect occurs only for superstrate thicknesses in the order of $h_{\rm sup}=\lambda_d/2$.
Results of the FMT analysis when (a) a thin PRS, (b) a thick PRS with  $h_{\rm sup}=0.5$ mm, or with (c) $h_{\rm sup}=1.3$ mm are considered. While the grey and dark-grey areas represent the substrate and superstrate, respectively, the black dotted line is the thin-PRS discontinuity represented by Xs. The absolute value of the electric-field leaky-wave mode is reported normalized with respect to its maximum $|E_\rho|_{\rm max}$ through a solid line vs. z normalized with respect to h tot.

Full-wave analysis
In order to corroborate the proposed analysis and observe the simulated radiating features of the device, the entire three-dimensional (3-D) model of the FPCA based on the thick PRS with  $h_{\rm sup}=1.3$ mm has been implemented on CST Microwave Studio [31] assuming a lateral dimension of the device $L=10\lambda_0$. The latter provides a radiation efficiency of about 99% through the typical formulas of leaky-wave antennas $\eta_r=1-e^{-2\pi\hat\alpha L/\lambda_0}$ [Reference Burghignoli, Fuscaldo and Galli2], with L being the lateral dimension of the Fabry–Perot cavity (see Fig. 1). (It is worth noting that the considered expression is an underestimation of the actual radiation efficiency due to the effect of the cylindrical radial spreading in 2-D leaky-wave antennas, which is not present in their 1-D counterpart).
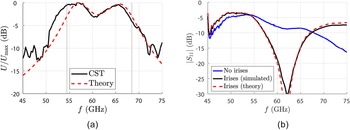
Figure 5(a) shows how the normalized far-field radiation pattern at broadside, evaluated through both a theoretical and a simulative approach, evolves for different working frequencies f. By exploiting the leaky-wave theory in [Reference Almutawa, Hosseini, Jackson and Capolino29], it is indeed possible to find the far-field radiation intensity at broadside as a function of the leaky phase and attenuation constants as follows:
 \begin{equation}
U(\omega,\theta=0)=\frac{4\sqrt{\varepsilon_r}U_0}{k_0h_{\rm sub}}\left[\frac{\hat{\alpha}\hat{\beta}}{\left(\hat{\alpha}^2+\hat{\beta}^2\right)^2}\right],
\end{equation}
\begin{equation}
U(\omega,\theta=0)=\frac{4\sqrt{\varepsilon_r}U_0}{k_0h_{\rm sub}}\left[\frac{\hat{\alpha}\hat{\beta}}{\left(\hat{\alpha}^2+\hat{\beta}^2\right)^2}\right],
\end{equation}(a) Radiation pattern of a Fabry–Perot cavity antenna based on a thick PRS. Simulated results (black solid line) and theoretical results (red dashed line) are in a good agreement. The vertical solid lines represent the −3 dB power limits. (b) Reflection coefficient of a realistic truncated Fabry–Perot cavity antenna based on a thick PRS and fed through a rectangular waveguide by means a quasi-resonant slot on the ground plane. By considering a waveguide of length  $L_{\rm WG}=\lambda_0$ (see Fig. 1(b)), the simulated magnitude of the S 11 parameter is reported when a matching network is not considered (blue solid line) or two optimized capacitive irises are introduced (black solid line). The red dashed line represents the S 11 parameter predicted by the feeding-network optimization procedure proposed in [Reference Negri, Fuscaldo, Tofani, Burghignoli and Galli17].

where U 0 is a multiplicative excitation constant related to the amplitude of the leaky-wave mode. It is worthwhile to point out that the slight disagreement between theoretical and full-wave results in terms of radiation pattern in Fig. 5(a) are due to the edge effects which are present when a realistic, finite-size antenna is considered. In this regard, it is worthwhile to point out that it is also possible to further enlarge the radiation-pattern bandwidth by properly truncating the device (see, e.g., [Reference Baba, Hashmi and Esselle35, Reference Baba, Hashmi, Esselle and Weily36]).
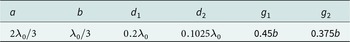
As concerns the source, in order to realize a realistic counterpart of an HMD on the ground plane [Reference Negri, Fuscaldo, Burghignoli and Galli14], a quasi-resonant slot fed by a rectangular waveguide – with transverse dimensions given by the width a and height b reported in Table 1 – has been considered (see Fig. 1). However, by simply connecting a rectangular-waveguide feeding scheme to the antenna, the device is mismatched in the theoretical bandwidth (see the blue curve in Fig. 5(b)). For this reason, a matching network constituted by two capacitive irises has been designed and implemented on the 3-D model of the device. The choice of the geometrical parameters – i.e., the iris gaps g 1 and g 2 and the distances d 1 and d 2 (see Fig. 1(b)) – has been carried out through an efficient semi-analytical matching technique based on a transmission-line equivalent model. The latter, as shown in [Reference Negri, Fuscaldo, Tofani, Burghignoli and Galli17], only requires a single full-wave simulation of the device by de-embedding the waveguide port of a distance  $L_{\rm RW}=\lambda_0$ (without the guide discontinuities). In particular, once the reflection coefficient and, thus, the device input impedance at the ground-plane level are known, they can be exploited in a transmission-line model to find the best configuration of the considered capacitive irises in a fast numerical manner (since such waveguide discontinuities are represented through well-known closed formulas [Reference Collin37, Reference Marcuvitz38]). By defining the capacitive-irises design parameters as in Fig. 1, the matching network has been implemented on CST Microwave Studio [31] with the feeder dimensions in Table 1. Simulated results obtain a very good reflection-coefficient profile which is in an impressive agreement with the S 11 theoretically predicted with the approach shown in [Reference Negri, Fuscaldo, Tofani, Burghignoli and Galli17] (see Fig. 5(b)). In this manner, the impedance bandwidth, viz., the working frequencies for which the reflection coefficient is lower than −10 dB, covers almost the overall theoretical bandwidth.
Design parameters of the feeding network used for matching the thick-PRS-based Fabry–Perot cavity antenna.

Conclusion
The analysis of Fabry–Perot cavity antennas based on thin and thick partially reflecting sheets has been addressed through a field-matching-technique approach in this paper. A three-dimensional model of the leaky-wave antenna, implemented with the best superstrate height in terms of bandwidth enhancement, has been realized on a full-wave solver and matched through a semi-analytical technique. Theoretical results are in a very good agreement with full-wave simulations, corroborating the effectiveness of the different design steps proposed in this work. As a consequence, this paper lays the groundwork for rapidly optimizing the design parameters of Fabry–Perot cavity antennas based on thick partially reflecting sheets through a simple yet effective approach based on a field matching technique.
Acknowledgements
W. F. acknowledges the support of the CNR-CNPq biennial (2025–2026) bilateral project METASURFANT “Metasurface antennas for high data-rate sub-THz wireless indoor communications”. A. G. thanks for the support of the European Union under the Italian National Recovery and Resilience Plan (NRRP) of NextGenerationEU, partnership on “Telecommunications of the Future” (PE00000001 – program “RESTART”). The Authors wish also to thank E. Ballarini for her help in the numerical simulations.
Competing interests
The authors declare none.

Edoardo Negri was born in Orvieto, Italy, in 1997. He received the B.Sc. and M.Sc. degrees (cum laude) in electronic engineering, with honorable mention for the academic curriculum, from Sapienza University of Rome, Rome, Italy, in July 2019 and 2021, respectively, where he received, in January 2025, the Ph.D. degree (cum laude and the ‘Doctor Europaeus’ label) in Information and Communications Technologies (applied electromagnetics curriculum). From March to May 2023, he was a Visiting Ph.D. Student with the Institut d’Électronique et de Télécommunications de Rennes (IETR), Université de Rennes 1, Rennes, France. From September to November 2023, he was a visiting Ph.D. Student in Ferdinand-Braun-Institut, Leibniz-Institut fchstfrequenztechnik (FBH), Berlin, Germany. Since July 2024, Dr. Negri has been a Research Fellow at the Institute for Microelectronics and Microsystems (IMM) of the National Research Council (CNR), Rome, Italy. His main research interests include leaky waves, metasurfaces, focusing devices, wireless near-field links at high frequencies (ranging from microwaves to terahertz), and THz devices. Dr. Negri received the “Antonio Ventura” Award as one of the best engineering students at the Sapienza University of Rome in 2022, the IEEE Antennas and Propagation Society (APS) Fellowship Award in 2023, the European Microwave Association (EuMA) Internship Award in 2023, an honorary mention in the “Barzilai Award” at the “Riunione Nazionale di Elettromagnetismo (RiNEm)” 2024, the second prize for the industrial call for ideas “Huawei TechArena”, and the first prize at the “Best Student Paper Award” at the International Symposium on Antennas and Propagation (ISAP) in 2024. He is currently a Guest Editor of the journal Symmetry (MDPI).

Walter Fuscaldo received the M.Sc. (cum laude) degree in Telecommunications Engineering from Sapienza University of Rome, Rome, in 2013. In 2017, he received the Ph.D. degree (cum laude and with the Doctor Europaeus label) in Information and Communication Technology (Applied Electromagnetics curriculum) from both the Department of Information Engineering, Electronics and Telecommunications (DIET), Sapienza University of Rome, and the Institut d’Électronique et de Télécommunications de Rennes (IETR), Université de Rennes 1, Rennes, France, under a cotutelle agreement between the institutions. In 2014, 2017, 2018, he was a Visiting Researcher and in 2023 a Visiting Scientist with the NATO-STO Center for Maritime Research and Experimentation (CMRE), La Spezia, Italy. In 2016, he was a Visiting PhD student with the University of Houston, Houston, TX, USA. From July 2017 to June 2020, he was a Research Fellow at Sapienza University of Rome, and in July 2020, he joined the Institute for Microelectronics and Microsystems (IMM), Rome of the National Research Council of Italy as a Researcher, where he is currently a Senior Researcher since 2023. His current research interests include propagation of leaky, surface, and plasmonic waves, analysis and design of leaky-wave antennas, generation of electromagnetic localized waves, THz technology and spectroscopy, graphene electromagnetics, and metasurfaces. Dr. Fuscaldo was awarded several prizes, among which is the prestigious EuRAAP Leopold B. Felsen Award for Excellence in Electrodynamics in 2025. Since 2021 he has been included in the World’s Top 2% Scientists’ list by Stanford University. He is currently an Associate Editor of the journals Nature – Scientific Reports, IET – Microwaves, Antennas and Propagation, and IET – Electronics Letters.

Paolo Burghignoli was born in Rome, Italy, on February 18, 1973. He received the Laurea degree (cum laude) in electronic engineering and the Ph.D. degree in applied electromagnetics from the La Sapienza University of Rome, Rome, in 1997 and 2001, respectively. In 1997, he joined the Electronic Engineering Department and is currently with the Department of Information Engineering, Electronics and Telecommunications, La Sapienza University of Rome. From January 2004 to July 2004, he was a Visiting Research Assistant Professor with the University of Houston, Houston, TX, USA. From November 2010 to October 2015, he was an Assistant Professor with the La Sapienza University of Rome, where he has been an Associate Professor since November 2015. In March 2017, he received the National Scientific Qualification for the role of a Full Professor of electromagnetic fields in Italian Universities. He is currently teaching courses of electromagnetic fields, advanced antenna engineering, and analytical techniques for wave phenomena for the B.Sc., M.Sc., and Ph.D. programs in the ICT area with La Sapienza University. He has authored about 250 articles in international journals, books, and conference proceedings. His research interests include the analysis and design of planar antennas and arrays, leakage phenomena in uniform and periodic structures, numerical methods for integral equations and periodic structures, propagation and radiation in metamaterials, electromagnetic shielding, transient electromagnetics and graphene electromagnetics. Dr. Burghignoli was a recipient of the “Giorgio Barzilai” Laurea Prize from 1996 to 1997 presented by the former IEEE Central and South Italy Section, the 2003 IEEE MTT-S Graduate Fellowship, and the 2005 Raj Mittra Travel Grant for junior researchers presented at the IEEE AP-S Symposium on Antennas and Propagation, Washington, DC. He is a coauthor of the “Fast Breaking Papers, October 2007” in EE and CS, about metamaterials (paper that had the highest percentage increase in citations in Essential Science Indicators). He was a Secretary of the 12th European Microwave Week (EuMW 2009) and a member of the Scientific Board and Local Organizing Committee of the 41st PhotonIcs and Electromagnetics Research Symposium (PIERS 2019). In 2017, 2020, and 2021 the IEEE Antennas and Propagation Society recognized him as an outstanding reviewer for the IEEE TRANSACTIONS ON ANTENNAS AND PROPAGATION. He is currently serving as an Associate Editor of the Electronics Letters (IET) the International Journal of Antennas and Propagation (Wiley). He is a Senior Member of the IEEE

Alessandro Galli received the Laurea degree in Electronics Engineering and the Ph.D. degree in Applied Electromagnetics from Sapienza University of Rome, Rome, Italy. Since 1990 he has been with the Department of Information Engineering, Electronics and Telecommunications at Rome Sapienza. He became an Assistant Professor and an Associate Professor in the sector of Electromagnetic Fields in 2000 and 2002, respectively. In 2013 he obtained the National Scientific Qualification, and later he definitively achieved the role of Full Professor in the same sector. His research interests concern various topics of guided-wave and radiation theory and applications, ranging from microwaves to terahertz. His activities also include topics of geoelectromagnetics, bioelectromagnetics, and plasma heating. He is the author of over 300 papers in international journals, books, and conference proceedings. Prof. Galli was elected Italian Representative in the Board of Directors of the European Microwave Association (EuMA) from 2010 to 2015. He was General Co-Chair of the 2014 European Microwave Week. Since 2024 he has been elected representative of Sapienza University of Rome Unit of the Italian Society of Electromagnetism (SIEm). He received various awards and recognitions for his research activity: in 2017 he was elected Best Teacher of the courses of the European School of Antennas (ESoA).


 Open access