Introduction
The European Project for Ice Goring in Antarctica (EPICA) focuses on two deep ice-core drillings in two regions of Antarctica-the Dome G(Concordia) area in the Indian/Pacific sector and Dronning Maud Land (DML) in the Atlantic sector of Antarctica The inland ice of DML remains a little-explored part of the Antarctic ice sheet An intensive pre-site survey program was therefore set up comprising ice-thickness measurements by airborne radio-echo sounding surveys ice-flow measurements by global positioning system (GPS) and glaciological investigations on shallow firn cores and 100 m ice cores These core studies will reveal the accumulation distribution across Amundsenisen and the accumulation and climate history during the last millennium Germany, Norway, Sweden The Netherlands and the United Kingdom have been engaged in traverse work and airborne surveys since the 1995-96 field season This paper deals with the German traverse work starting at Neumayer station at the coast and leading to Amundsenisen Results of the airborne radio-echo sounding surveys are described by Reference Steinhage, Nixdorf, Meyer and MillerSteinhage and others (1999).
Area Under Investigation
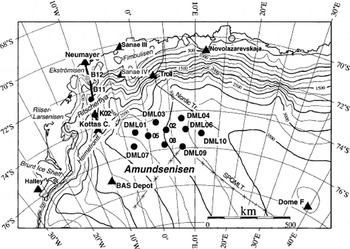
The area for the EPICA pre-site survey in DML is Amundsenisen (Fig. 1) which includes the region between 72° and 78° S, and between 15° W and 20° E. The local summit of DML lies outside the area under investigation to the east It is Dome F (77°19.02’ S, 39°42.2’ E; 3810 m a.s.l), where a 2503 m long ice core was recovered in 1995-96 by the Japanese Antarctic Research Expedition (JARE) (Dome-F Deep Coring Group, 1998). Two triple points on the main ice divide, approximately located at 75° S and the Greenwich meridian and at 75° S, 15° E, separate the ice flowing towards the Filchner-Ronne Ice Shelf and towards the smaller ice shelves between 25° W and 20° E. Within the area under investigation the surface elevation of Amundsenisen is 2000-3500 m a.s.l. The 2000 m contour line follows approximately a series of mountain ranges (starting with Heimefrontfjella in the west) which separate Amundsenisen from the lower inland ice regions to the north, such as Ritscherflya. Major outlets from Amundsenisen in the west are Stancomb-Wills Ice Stream, draining into the Brunt Ice Shelf, and jutulstraumen, draining into Fimbulisen. The catchment areas of the main ice streams feeding the Filchner Ice Shelf extend as far north as the main ice divide at 75° S.
Map of DML. The area of the EPICA pre-site survey on Amundsenisen includes the region between 72° and 78° S, and between 15° Wand 20° E. The map shows the locations visited by German expeditions (filled circles) The traverse route from Neumayer southwards to Kottas camp is indicated by a thick line In addition the map shows the route of the SPQML traverse 1964-68 (line with crosses; see text)and the route of a Nordic traverse in 1996-91’ passing the Troll station Stations and camp sites are marked by filled triangles. Elevation data based on European Remote-sensing Satellite (ERS-1) altimeter by courtesy of J. Bamber, University of Bristol UK
Until the beginning of the EPICA pre-site survey, Amundsenisen was a little-known part of Antarctica. The Antarctic folio of Reference DrewryDrewry (1983) reveals only a few points where measurements were available to enable maps of ice thickness, surface and bedrock topography to be drawn. The South Pole-Queen Maud Land traverse (SPQMLT; 1964-68) started with a reconnaissance of DML (e.g. Reference Picciotto, Crozaz, de Breuck and CraryPicciotto and others, 1971). The northernmost point reached by this traverse was 75°56’ S, 7°13’E at 3210 ma.s.l, in the south of the EPICA area; the southernmost German point DML09 (Fig. 1) was established here. Reference Picciotto, Crozaz, de Breuck and CraryPicciotto and others (1971) reported a mean annual temperature of-48.5°C (a value 0.6 K lower than recent measurements; cf. Table 3) and an accumulation rate of 51 kg m−2 a−1 (AD 1955-68) based on radio-isotope measurements (a value not significantly higher than the present-day value). Reference Rundle and CraryRundle (1971) had previously determined a much higher value of 91 kg m–2a−1 by evaluating only snow-pit stratigraphy. Values of near-surface density reported by Reference Picciotto, Crozaz, de Breuck and CraryPicciotto and others (1971) and Reference Rundle and CraryRundle (1971) are 357 and 340 kg m−3, respectively.
During the 1991-92 field season a Swedish traverse crossed Ritscherflya towards Amundsenisen, and a 20.1m deep firn core was recovered at 75° S, 2° E at 2900 ma.s.l. (Reference Isaksson, Karlen, Gundestrup, Mayewski, Whitlow and TwicklerIsaksson and others, 1996). This covered the period 1865-1991 and yielded an accumulation rate of 77 kg m–2a–1, a 10 m firn temperature of-43.8°C and a mean 5180 value of -44.8‰. The drill location lies approximately halfway between the German points DML05 and DML02 (Fig. 1). In 1993-94 another Swedish traverse operated a ground-based snow radar on Amundsenisen along a 400 km long east-west profile, 50 km south of 75° S, finishing at the same longitude as the above-mentioned Swedish firn-core site (Reference Richardson, Aarholt, Hamran, Holmlund and IsakssonRichardson and others, 1997). The study aimed to reveal recent accumulation variations. A tentative value for the mean accumulation rate on the plateau of 61 kg m-2a−1 is reported.
East of the EPICA region is the investigation area of JARE. The glaciological folio published by the National Institute of Polar Research (1997) contains a map sheet with snow-accumulation data.
The German EPICA traverse route starts at Neumayer station (70°39.0’ S, 8° 15.4’ W) and leads across Ekstromisen and Ritscherflya. The Kottas base camp (74° 12.3’S, 9°44.8’W) was established in front of Kottasberge, Heimefrontfjella, during the 1995-96 and 1996-97 field seasons. From there the two Dormer Do-228-100 aircraft Polar 2 and Polar 4 were used to carry out airborne surveys as well as to give support for glaciological fieldwork on Amundsenisen. It was only in the 1997-98 field season that a ground traverse ascended from the base camp across a small ice stream in the east of Heimefrontfjella to Amundsenisen, traversing as far as 75° S, 7.5° E.
In 1986-87 a traverse group travelled 270 km south from Neumayer station drilling shallow firn cores (Reference Miller and OerterMiller and Oerter, 1990; Reference MoserMoser, 1991). Data from this expedition (Table 1), supplemented by more recent results, allow us to link the findings from Amundsenisen and from the coastal area. Co-ordinates of the locations visited in 1995-96 and 1996-97 are compiled inTable 2.
Coordinates for locations on Ekströmisen and Ritscherflya visited and sampled during the German Ekstrom traverse in 1986-87
Coordinates for locations visited and sampled during EPICA DML field seasons 1995-96 and 1996-97
In general, the snow surface on Amundsenisen looks smooth, and wind-formed structures seldom jut out of the surface more than 10-15 cm. This indicates that the mean wind velocities are moderate. The snow surface is very suitable for operating small aircraft, but over wide areas it is too soft to carry heavy sledges. Around DML01 and westward the surface is rougher than to the east. In general, the appearance of the surface suggests that the snow layers are not reworked heavily by wind action, and that the annual snow layers will be detectable.
Snow-Pit Samples and Firn Gores
The results presented in this paper are based on snow-pit studies and shallow firn cores recovered during the 1995-96 and 1996-97 field seasons. As access to all points on Amundsenisen was possible only by aircraft, the time available at each point was limited to 4-5 hours. Each point was marked by an aluminium stake used for GPS measurements, a 10-12 m deep firn core was drilled and a snow pit 1-1.5 m deep was excavated and sampled. After the drilling, a thermistor string was inserted into the borehole and left behind for re-readings in subsequent years. To ensure that the thermistors were completely adjusted to the surrounding firn temperature, only the re-readings of the 1997-98 season (Table 3) are used in this paper.
The snow pits (Table 3) were used for density measurements and sampled for measurements of 2H and 1 80 content as well as major-ions analysis Unfortunately, the depth resolution for some pit samples was too coarse to resolve annual layers
For the firn cores (Table 3) the electrical properties were determined by non-destructive methods; dielectric profiling (DEP) (Reference Wilhelms, Kipfstuhl, Miller, Heinloth and FirestoneWilhelms and others 1998) and electrical conductivity measurements (ECMs) in the cold laboratory. Density was measured from the weight and volume of single core pieces averaging over 30-80 cm lengths and for some cores in high depth resolution by applying gamma-density measurements (Reference Gerland, Oerter, Kipfstuhl, Wilhelms, Miller and MinersGerland and others 1999) After the non-destructive measurements the cores were cut for further analysis of tritium δ2R and δ18O and major ions The remaining parts of the cores are stored at the Alfred Wegener Institute (AWI).
Results
Snow pits
The snow-pit studies reveal the structure of the firn layering on Amundsenisen. One finds characteristic crusts 1-2 mm thick which separate single firn layers with a typical spacing of 10-25 cm These crusts may represent a former wind-pressed snow surface and probably indicate the late-winter snow surface They can also be recognized in the shallow firn cores A detailed stratigraphic description of the firn layers is difficult time-consuming and not always unambiguous and the results available so far are insufficient for precise dating of the pits The chemistry of the firn layers is a more helpful tool for dating than the isotope content From direct atmospheric observations at Neumayer station it is known that the aerosol biogenic sulfur components non-sea-salt sulfate and methanesulfonate, show a distinct seasonal cycle with maximum concentrations in the austral summer months (Reference MinikinMinikin and others 1998) In coastal Antarctic areas this is clearly reflected in the chemical profiles of firn cores On Amundsenisen, in spite of the relatively low accumulation rates sulfate concentrations still show a regular pattern with peak’s in summer layers which allows for annual layer counting. The baseline concentration of total sulfate is 40-100 PPb (Figs 2 and 3) In all sampled snow pits a snow layer with peak values of 180-250 ppb is observed which was assigned to precipitation in the years 1991-93 It may correspond to enhanced summer non-sea-salt sulfate aerosol concentrations at Neumayer station reported for the summers 1991 92 and particularly 1992-93 (Reference MinikinMinikin and others 1998) The accumulation rates for snow pits given in Table 3 were derived from stratigraphical information including the sulfate profiles Figure 2 gives an example for a snow pit displaying the stratigraphy density sulfate concentration and 180 content at DML05. ’
Snow-pit studies on Amundsenisen at DML05. Results from two hits sampled in January and December 1997 are shown with 18O content (dashed line January 1997; solid line December 1997) sulfate concentration (dashed line January 1997; full line December 1997) and density (December 1997) In addition, stratigraphic features for the December 1997 pit (personal communication from G. Patzelt, 1998) are plotted, cr.: crust.
Firn core at DML02, January 1996: profiles of non-sea-salt sulfate concentrations (total sulfate dotted), chloride and 18O content in the depth interval 9.5-10.8m, corresponding to the period 1919-28 Each sample was 25 cm Ion,. Annual layers are indicated
From this study the mean near-surface (≤2m) density on Amundsenisen (Table 3) yields a value of 338 ±12 kg m−3 much lower then on the ice shelf (432 ±21 kgm−3) and on Ritscherflya (387 ± 35 kg m"3) Taking only the density values on Amundsenisen no strong correlation was found with the measured 10 m firn temperature.
Dating of the firn cores
For dating firn cores one can use seasonal stratigraphy or absolute time markers produced for example by volcanic events or by the fallout of radioisotopes in the course of nuclear weapons tests Dating by seasonal signals requires subsamples with high depth resolution For Amundsenisen seasonal signals for stable isotopes could not be detected in 2 5 cm Ion. subsamples but clear seasonal non-sea-salt sulfate peaks were evident (Fig. 3) It should therefore be possible to date firn cores with high-resolution analysis methods like continuous flow analysis or continuous measurements based on electrical properties which vary with changing acidity. One major problem with these methods affecting the accuracy of the determined accumulation rates, is the quality of firn cores in the upper 3-4 m depth. Losses of core material within soft, coarse-grained layers and breaks at depth-hoar horizons cause errors in core length and a hiatus in the record. For the cores reported here the core length had to be extended by 5-12% down to 5 m depth to adapt the recovered core to the measured borehole depth.
Tritium measurements
A first method for dating which has also been used on the Filchner-Ronne Ice Shelf (Reference Graf, Reinwarth, Oerter, Mayer and LambrechtGraf and others, 1999), is based on depth profiles of the tritium content These can be used to date firn cores because the time series of artificial 3H concentrations in precipitation are quite similar throughout the Southern Hemisphere This means for example that the typical distribution at Kaitoke, New Zealand must also be preserved in the snow cover on Amundsenisen. Best-fit depth-time scales were searched by trial and error in order to transform the measured depth profiles to time series similar to that at Kaitoke (Table 3) An example of this method is given for DML.07 in Figure 4
Firn core at DML07,1996-97: example of dating of firn cores by means of tritium content (TU,tritium units) The tritium contents of precipitation at DML07 are calculated from the profile data with an accumulation rate of 57 m2 a4 For comparison the tritium contents of precipitation at the station Kaitoke, New Zealand are given (dashed line) The data for Kaitoke are taken from the International Atomic Energy Agency global network of isotopes in precipitation (GNIP) at http://www.iaea.or.at.
Because of the higher accumulation rates on the Filchner-Ronne Ice Shelf (Reference Graf, Reinwarth, Oerter, Mayer and LambrechtGraf and others 1999) the results there are somewhat better than on Amundsenisen.
DEP measurements
Besides radio isotopes volcanic horizons are absolute time markers in the firn cores which can be detected by chemical analysis and EGMs. For this study we used DEP (Reference Wilhelms, Kipfstuhl, Miller, Heinloth and FirestoneWilhelms and others 1998) and focused on a characteristic peak which could be ascribed to the Agung eruption in 1963 Such a peak (Fig 5) was detected in all cores except one (site DML03), and appears 41-5 7 m below the surface The interpretation of this peak as being caused by a volcanic horizon has still to be confirmed by chemical analysis However using the depth-time scale of the tritium dating the peak coincides with snow layers from 1964 and 1965 which was when the sulfuric acid attributed to the Agung eruption was deposited in central Antarctica (Reference Legrand and DelmasLegrand and Delmas, 1987) Despite the low annual accumulation rate the high resolution of the DEP measurements also allows us over long sections of the core to interpret the variations seen in Figure 5 as seasonal signals The annual layer boundaries which were used to establish a depth-time scale for each core and to calculate annual mean values of isotope content and accumulation rates, were determined by the peak values of the DEP profile. The mean accumulation rates deduced from the tritium dating for each core agree with the averaged annual accumulation rates determined by the DEP profile.
Firn core at DML05,1996-97: DEP record and 18O content plotted vs depth. Annual layers are indicated by lines.
Spatial distribution of temperature, accumulation rates and isotopic content of near-surface layers
The mountain range Heimefrontfjella forms a steep step in the landscape and causes changes of the gradients of all parameters investigated in this paper. For example, the 10 m firn temperature decreases from -16.5°C at the coast to -25.4°C at Kottas camp at 1440 m a.s.l., an altitude gradient of 4.8 K km"1; from Kottas camp to DML01 with a gradient of 13.9 K km"1; and across Amundsenisen with a gradient of 7.7 K km"1 (Fig. 6).
Snow-accumulation rates deuterium content of the near-surface layers and 10 m firn temperatures at the measuring sites from Neumayer station towards Amundsenisen. The surface elevation of the sites is also plotted.
After dating of the cores, accumulation rates were calculated (Fig. 6) Accumulation rates on Ekstromisen decrease continuously from 360 kg m–2 a–1 at the former Georg von Neumayer (GvN) station to 2 5 0 kg m–2a−1 at kml43 in the hinge zone area of the ice shelf (Table 1) Ascending towards Ritscherflya the accumulation rates increase again to coastal values then fall to a minimum with values around 50 kg m–2 a−1 on Ritscherflya 200-280 km south of Neumayer station corresponding to the elevation interval 900-1050 m a.s.l. From field observations and isotope analysis (see below) it is clear that these low values are due to erosion by wind activity not to lower precipitation This low-accumulation area is also revealed by measurements with a ground-based snow radar (Reference Richardson, Aarholt, Hamran, Holmlund and IsakssonRichardson and others 1997) From km270 to Heimefrontfjella accumulation increases to values of 140 kg m–2a−1 with strong variations due to surface undulations South of Heimefrontfjella on the Amundsenisen plateau the accumulation rates show a mean value of 57 ± 15 kg m–2a−1, with a tendency to decrease from west to east However the accumulation rate at DML01, 41 kg m–2a−1, does not fit in with this trend. The reason for this low-accumulation area is not yet clear. Most probably it is caused by wind erosion and not by low precipitation rates. This is indicated by the close relationship between temperature and accumulation rates (dA/dT = 4.8 kg m-2a–1K–1, r =0.85) and the exceptional nature of the values at site DML01.
Like the accumulation rates, the isotopic contents of the near-surface layers decrease inland, as would be expected based on many other investigations and the temperature distribution. The 2H content decreases from -159‰ at Neumayer to -212% at km270 and drops further to -386‰ at DML10 on Amundsenisen. The deuterium excess values vary only in the small range 6-10%, The decrease in 2H from kml80 to Bll may be reduced by a different build-up of the snow cover at these sites. From the calculated tritium inventory we have some evidence that at Bll in the last 30 years the winter precipitation is less preserved than the summer precipitation, probably due to the interplay of wind scouring and surface topography. The lowest inventory in the years 1960-77 (57 TU) was determined at this site compared with investigations on the Filchner-Ronne Ice Shelf and the recent study in DML.
Modelling the 2H and 18O contents
The temperature gradient of the 2H contents between Neumayer station and Heimefrontfjella (9 6 ± 2.5‰o KT1) is comparable to the findings on the Ronne Ice Shelf (103% K1 ; Reference Graf, Reinwarth, Oerter, Mayer and LambrechtGraf and others, 1999). Including the value at Kottas camp site, the temperature gradient decreases for the area south of Heimefrontfjella on the Amundsenisen plateau (5 5 ± 0 3% K−1) and almost equals the value reported by Reference Lorius and MerlivatLorius and Merlivat (1977) for the area between Dumont d’Urville and Dome C (6.0‰ K−1) Reference Isaksson, Karlen, Gundestrup, Mayewski, Whitlow and TwicklerIsaksson and others (1996) used a δ18O temperature gradient of 1.16%K–1 (corresponding to 93 δ2H%K-1) to convert isotope variations to temperature variations for two firn cores one on Ritscherflya and one on Amundsenisen (75° S 2° E) This is comparable with the gradient found in this study for the area between the coast and Heimefrontfjella but might not be valid for the eastern plateau of Amundsenisen. Reference StenbergStenberg and others (1998) determined a gradient of 074‰K−1 (corresponding to 59 δ5H% K−1) for the area above 2000 m a s 1 which fits into our dataset The δ18O temperature gradient of 1,31‰ K-11 (105 δ2H‰K−1) determined by Reference OrheimOrheim and others (1986) for the Riiser-Larsenisen and Vestfjella area is very similar to the one reported by Reference Hermichen, Kowski and VaikmäeHermichen and others (1990) with a value of 1 33% K−1 Both values compare well with the gradient across Ekstromisen and Ritscherflya from this study.
The Rayleigh model can be used to understand the temperature gradient To model both the 2H and 18O contents we followed the idea of Reference Jouzel and MerlivatTouzel and Merlivat (1984) that the isotope fractionation between the water vapor and the condensate is governed not only by isotopic equilibrium but also by kinetic processes Kinetic processes counterbalance the depletion in the heavier isotopes and avoid an unrealistic increase of the deuterium excess values Starting with the values at Neumayer station it is possible to calculate the values at Ritscherflya assuming isobaric cooling of the air masses and that the condensation temperature is represented by the 10 m firn temperature Further inland these assumptions are no longer justified From Ritscherflya to Amundsenisen the temperature above the inversion layer will be a proper measure for the condensation temperature (Reference Robin, Johnsen and RobinRobin and Johnsen, 1983). In addition, the air masses cool adiabatically (rather than isobarically) when ascending to >3000m a.s.l. Taking these assumptions into account it is possible to model the δ2H and δ18O values as well as deuterium excess values (Fig. 7).
Relationship between 10 m firn temperature and 2H content of the near-surface layers in the area of Ekströmisen Ritscherflya and Amundsenisen.
Time series of accumulation rates and isotope content
Time series of yearly accumulation rates were calculated for nine cores from sites DML02-10 (Fig. 8). The firn core from DML01 was not used, as the core quality did not allow us to reconstruct time series based on annual values. The time series of accumulation rates are limited in extent, because detailed stratigraphic information is sometimes lacking within the first 2 m below the surface. The longest record (at DML.09) covers a period of 100 years. The accumulation values at the different locations vary with a standard deviation of 10-29 kg m-2a-1. None of the time series shows a significant trend. The same finding is valid for the core drilled on Amundsenisen by Reference Isaksson, Karlen, Gundestrup, Mayewski, Whitlow and TwicklerIsaksson and others (1996). Snow-pit and firn-core results (Table 3) fit with each other within the interannual variation of accumulation rates. At three locations (DML03, DML05 and DML07) it is already possible to compare the accumulation rates with preliminary results from the 1997-98 season, when longer firn cores were recovered, and the volcanic signal caused by the Tambora eruption in 1815 is clearly recognizable in the DEP profiles. The accumulation rates determined with reference to the Tambora peak at DML03 and DML07 agree with those for the shorter cores (Table 3) At DML05 the value for the longer period 1816-1997 is 15% lower than the value calculated with the shorter firn cores covering only the period 1930-96 This discrepancy can be judged when the annual time series of core B32 becomes available.
8 Time series of annual accumulation rates at sites DML02-10.
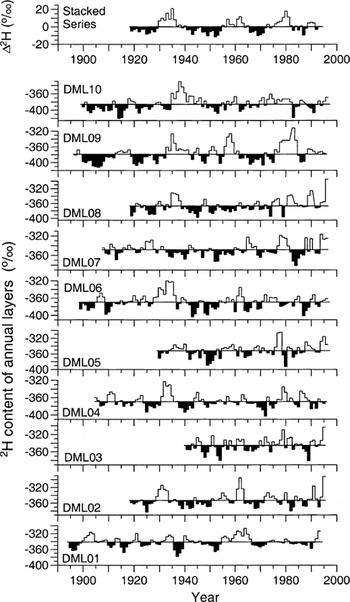
The time series of the δ2H values were also calculated in depth intervals where only the approximate layering from the 3H dating is known; the series deduced from each of the ten cores are shown in Figure 9 They are correlated to some extent; 9 of the 45 possible cross-correlations between the time series are significant (Table 4). The individual series were stacked to enhance the signal-to-noise ratio, assuming that the individual series contain common information. The stacked series looks smoother, and its variance is reduced by one-third compared to the single series. The high-frequency part of the variance spectrum is also reduced. The stacked series characterizes the three periods around AD 1935,1960 and 1980 as periods with higher δ2H values (possibly higher temperatures). The regression analysis of the stacked time series revealed no statistically significant trend. The same is true for five of the ten individual series, but in the other five series (DML03, DML05, DML08, DML09 and DML10) the δ2H values tend to become higher in the younger layers; the trend is statistically significant at the 95% confidence level. The rate of increase of the isotopic content, 0.1-0.2 δ2H% a−1, is 2-4 times higher than the rate of change that Reference Isaksson, Karlen, Gundestrup, Mayewski, Whitlow and TwicklerIsaksson and others (1996) found since AD 1865 in their core drilled between DML05 and DML02 (0.006 δ18O‰ a−1, corresponding to 0.048 δ2H% a−1).
Time series of annually resolved deuterium contents at sites DML01-10 and the stacked time series.

Matrix of correlation coefficients derived from time series of2H contents offirn cores at ten sites (DML01-10)
Do these results indicate a warming of the lower troposphere in DML in the last 100 years, such as was observed in the Weddell Sea sector of Antarctica (Reference Peel and ClausenPeel and Clausen, 1982)? Certainly, the increase in δ2H values cannot be caused by temperature alone, for two reasons. First, the δ2H increase is not evident at all sites (not even in groups of neighboring cores) and is not observed in the stacked series. Second, the δ2H increase is large and would imply an unrealistic temperature rise of up to 3 6 K using the above isotope-temperature relationship. Besides a warming of the troposphere, which cannot be ruled out, several other processes may be involved, such as a change of the source region for the atmospheric water vapor or changing ratios of the amount of winter and summer snow in the layers. It is not yet possible to say which processes are dominant. Further chemical analysis of the cores needs to be undertaken to provide more information on the structure of the deposited firn layers. Also analysis of the deuterium excess will help to detect changing source regions for the precipitation.
Conclusions
The first results of glaciological investigations by means of 10 m firn cores in western DML yield a coherent dataset for the distribution of accumulation rate and isotope content The distribution of the tritium content in the upper firn layers due to fallout during the period of nuclear weapons tests is a good tool for dating the firn cores In combination with high-resolution DEP measurements it is possible to reconstruct the annual layering in the firn for the last 70-100 years even at locations where the accumulation rate is as low as 45 kg m-2a−1. The spatial distribution of accumulation across Amundsenisen depends on the temperature at the drilling site and indicates values generally decreasing from west to east The time series of the accumulation rates show no significant trend for the 20th century. Therefore it is possible to use datasets covering different periods to construct an accumulation map for the area of the EPIC A pre-site survey. Some of the time series of stable isotopes show increasing values since the turn of the century, which cannot be caused by temperature changes alone At the present state of investigations a climatic warming in DML cannot be inferred with certainty. Chemical analysis and checks of the deuterium excess as well as some longer time series (from cores which were already drilled and for which the Tambora eruption in 1815 provides a reliable time marker) and circulation models for air-mass transport are needed to improve understanding of the climatic regime in this region.
Acknowledgements
We thank A Ebbeler, A Frenzel and F.Valero-Delgado (AWI) for assistance in the cold laboratory and A Olfmann and P. Seibel (GSF) for performing isotope measurements Thanks go to all members of the German EPICA traverses in 1995-97 for assisting with the fieldwork
Financial support by Deutsche Forschungsgemeinschaft (project Re-762/2) is gratefully acknowledged This work is a contribution to the "European Project for Ice Coring in Antarctica" (EPICA), ajoint European Science Foundation/ European Commission (EC) scientific program, funded by the EC under the Environment and Climate Programme (1994-98) contract ENV4-CT95-0074 and by national contributions from Belgium, Denmark, France, Germany, Italy, The Netherlands, Norway, Sweden, Switzerland and the U.K.This is EPICA publication No. 2 and AWI publication No. 1497.