Dietary habits and Western lifestyles have been studied because they may be the influential factors for a variety of metabolic diseases( Reference Steele, Baraldi and Louzada 1 – Reference Leech, Timperio and Livingstone 3 ). The consumption of diets with high energy density and high levels of fat, cholesterol and saturated and trans-fatty acids has been associated with several metabolic disorders, such as dyslipidaemia, which are the main risk factors for CVD( Reference Gomez-Smith, Karthikeyan and Jeffers 4 , Reference Liska, Cook and Wang 5 ).
Dyslipidaemia, which is characterised by altered levels of circulating lipids and lipoproteins in organisms, may have a genetic or environmental aetiology and mainly affects sedentary individuals with inadequate eating habits( Reference Udenigwe and Rouvinen-Watt 6 ). These changes in lipid levels may also affect pregnant women and infants, by whom predisposition to disease may be acquired before or during pregnancy( Reference Nascimento, Sales and Fleig 7 ) as well as be a consequence of maternal overweight( Reference Crew, Waddell and Mark 8 , Reference Morrison and Regnault 9 ).
Although the modulation of gut microbiota in newborns has been believed to occur through breast-feeding and the inclusion of other foods in the post-weaning diet, there has been strong evidence indicating that the gut colonisation of infants may have already occurred before birth( Reference Romano-Keeler and Weitkamp 10 – Reference Mueller, Bakacs and Combellick 12 ). Dyslipidaemia may promote intestinal villi wear and in the long-term, alterations in gut microbiota composition( Reference Hu, Wang and Li 13 – Reference Batista, Alves and Lima 15 ). Populations of Enterococcus spp., Lactobacillus spp. and Bifidobacterium spp. have been positively associated with HDL serum levels and negatively associated with total cholesterol (TC), LDL and VLDL-cholesterol serum levels as well as with the extension of atherosclerotic lesions( Reference Cavallini, Suzuki and Abdalla 16 ).
The available literature reports remarkable sensitivity of the offspring to nutritional, hormonal and environmental changes in both the prenatal and postnatal periods, modulating the risk for the development of metabolic diseases in adulthood( Reference Castrogiovanni and Imbesi 17 , Reference Guimarães, De Araújo and Aquino 18 ). Diet has been considered an important influential factor in the health/disease state( Reference Lee 19 , Reference Tain, Lin and Sheen 20 ). Although the mechanisms are not fully understood, previous studies have suggested that metabolic dysfunction in adult offspring exposed to nutritional insults during early life may be sex-specific( Reference Langley-Evans, Bellinger and McMullen 21 – Reference Dudele, Hougaard and Kjolby 23 ). Primarily, this sex difference has been related to female hormones, which are thought to protect against the development of metabolic disorders( Reference Tain, Lin and Sheen 20 , Reference Davis, Hecht and Jasarevic 24 ).
Some studies have been performed using rats to ascertain the effect of maternal diets and treatments on the offspring( Reference Porras, Nistal and Martínez-Flórez 25 , Reference Gray, Vickers and Segovia 26 ), being a well-recognised and widely used experimental model, considering the levels of evidence in health and scientific investigations( Reference Chalvon-Demersay, Blachier and Tomé 27 ). Based on the fact that high levels of saturated fats and cholesterol may be harmful to the body, this study investigated whether the consumption of a dyslipidaemic diet affects the lipid metabolism, microbial counts in faeces and intestinal and hepatic morphology of dams during pregnancy and lactation as well as of their male and female pups from lactation to adulthood, since previous studies are limited to the follow-up of male pups of a pre-established age and usually without follow-up of the potential changes in different life phases.
Methods
Animals and experimental design
The experimental protocol was submitted and approved by the institutional animal care and use committee (CEUA-UFPB protocol 017/2017) of Federal University of Paraíba (Brazil). All experiments were carried out in agreement with the guidelines of the Brazilian Society of Science in Laboratory Animals (SBCAL).
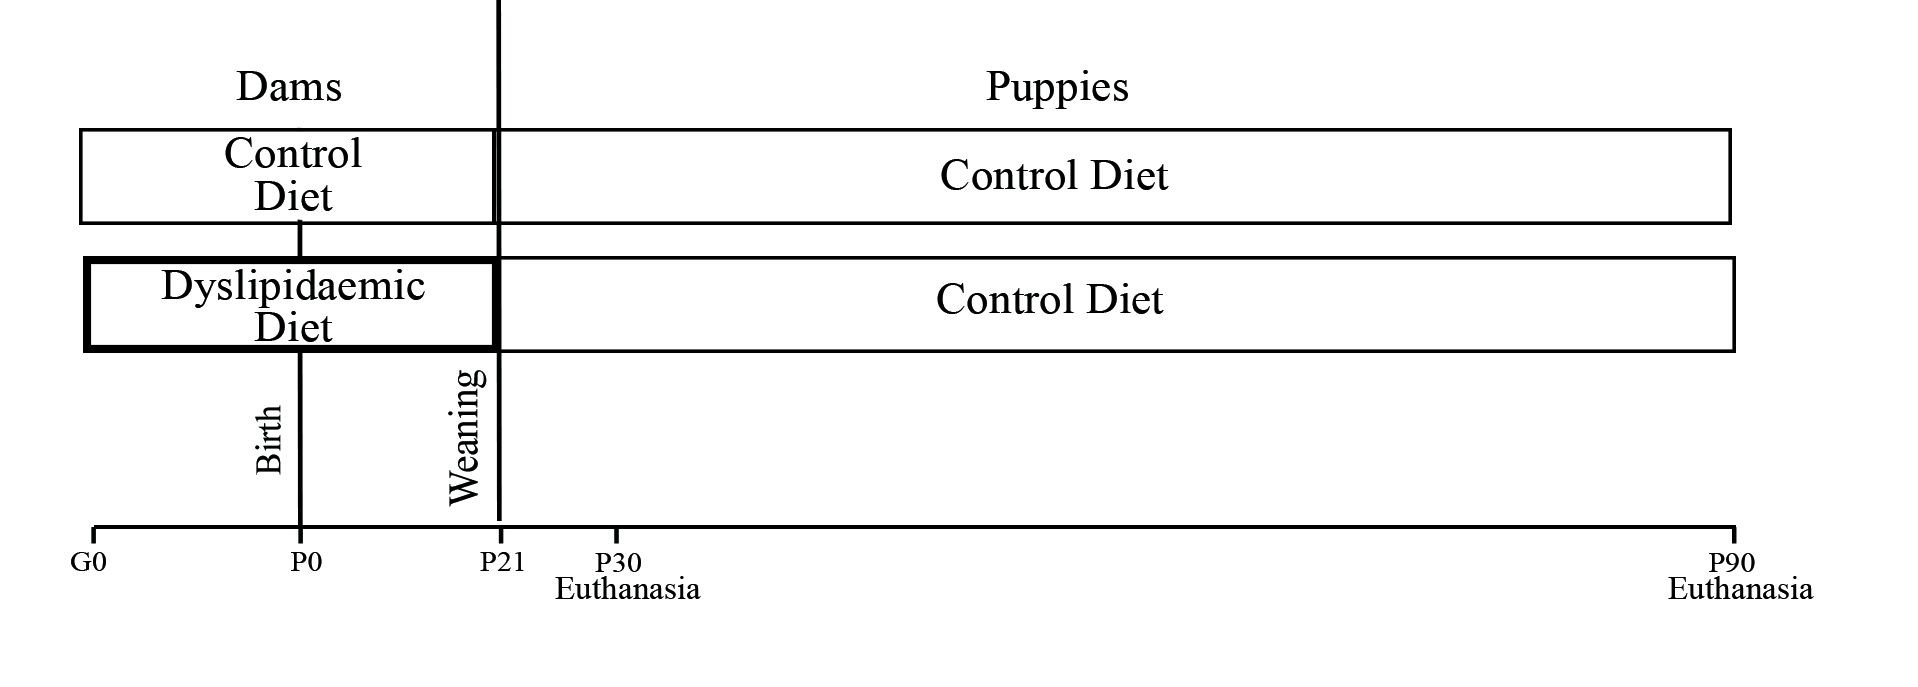
All animals used in the experiment received water and diet ad libitum and were maintained at a temperature of 21±1°C, with humidity between 50 and 55 % and a 12-h alternation of light–dark cycles. Primiparous Wistar (Rattus norvegicus) rats ±90 d of age and weighing over 200 g (n 12) were mated to 4:1 fertile male rats (n 3). The presence of sperm in the vaginal smear was used to define the 1st day of pregnancy. Subsequently, the dams were placed in single cages and randomly allocated into two groups: control (CTL, n 6) and dyslipidaemic (DLP, n 6). The CTL group was fed a CTL diet for growth with soyabean oil as the fat source (AIN-93G; 15·92 % fat)( Reference Reeves, Nielsen and Fahey 28 ), and the DLP group was fed a dyslipidaemic diet with 31·11 % fat, containing soyabean oil, cholesterol, lard and non-hydrolysed vegetable fat as fat sources (Tables 1 and 2).
Composition of control and dyslipidaemic diets offered to dams during pregnancy and lactation (AIN-93G)
t-BHQ, tert-butylhydroquinone.
* Adapted from Reeves et al.(28).
† Rhoster – Industry and Trade Ltd.
Fatty acid composition of control and dyslipidaemic diets offered to dams during pregnancy and lactation (AIN-93G) (Mean values and standard deviations)

* Adapted from Chalvon-Demersay et al.( Reference Chalvon-Demersay, Blachier and Tomé 27 ).
After the determination of pregnancy, the body weight of dams was measured weekly. Food intake during gestation (time G0, G1, G2 and G3) and lactation (time L0, L1, L2 and L3) was also measured. After birth, the weight of the litters (weight of pups divided by the number of pups), number of pups per dam and sex were assessed.
On the 2nd day of life, the pups were reduced to eight per litter (four males and four females)( Reference Gray, Vickers and Segovia 26 ). After weaning, on the 21st day of life, all pups were separated by sex and group in box-type group housing and were fed a commercial diet (Presence Purina®) and water ad libitum. Body weight and food intake of dams and pups were measured weekly during the experimental period using a digital electronic scale (prix III; Toledo). Lipid and total energy intake were calculated based on the composition of the diet consumed by the groups. Euthanasia and collection of faeces, blood, the liver and the intestines were performed after lactation for dams and on the 30th and 90th day of life for the pups during the light phase (online Supplementary Fig. S1).
Fat and microbial counts in faeces
Faecal samples were collected on the three consecutive days before euthanasia for quantification of excreted fat or counting of the faecal microbiota population in both dams and offspring on the 30th and 90th days. Part of the faecal samples from dams and pups was used to quantify total lipids by cold extraction using a previously described procedure( Reference Folch, Lees and Sloane Stanley 29 ). The other part of the faecal samples was homogenised in peptone water (100 mg/ml) and serially diluted in the same diluent. In all, 20 µl aliquots of the respective dilutions were inoculated using a microdrop technique( Reference Miles and Misra 30 ) in Bifidobacterium agar (HiMedia) to count Bifidobacterium spp.; agar Man, Rogosa and Sharpe (HiMedia) to count Lactobacillus spp.; agar MacConkey (HiMedia) to count Enterobacteriaceae and agar Bacteroides Bile Esculina (Acumedia) to count Bacteroides spp. (Acumedia). Incubation was performed under anaerobic conditions (Anaerobic System Anaerogen; Oxoid Ltd) for counting Bifidobacterium spp., Lactobacillus spp. and Bacteroides spp. and under aerobic conditions for counting Enterobacteriaceae. After an incubation period of 24–48 h, the number of colonies on each selective medium was counted, and the results were expressed as log colony-forming units/g( Reference Batista, Alves and Lima 15 ).
Euthanasia, evaluation of murinometric parameters and quantification of visceral and hepatic fat
At the end of the pregnancy and lactation period, the dams and eight pups (30 d old) from each group were euthanised. The remaining eight animals were maintained until 90 d after birth. After 8 h of fasting, the animals were anaesthetised with intraperitoneal administration of ketamine–xylazine solution (75 and 5 mg/kg, respectively) and euthanised by aortic transection.
Murinometric parameters, such as chest circumference (immediately before the hind paw), abdominal circumference (immediately behind the front leg), body weight and naso-anal length, all measured in cm using a metric tape, were evaluated in anaesthetised rats. BMI was calculated using the formula body weight (g)/length2 (cm2)( Reference Novelli, Diniz and Galhardi 31 ) and the Lee index divided by the nasal length (cm)( Reference Bernardis and Patterson 32 ).
After euthanasia, the visceral fat was collected for direct weighing on an analytical balance, and its quantification was normalised by the weight of the respective animal. Liver samples were collected for quantification of total lipids using a previously described procedure( Reference Folch, Lees and Sloane Stanley 29 ). Samples of liver and intestinal colon were collected, weighed and used for histological analysis.
Lipid profile
After collection, blood was centrifuged (58 136 g for 15 min at 25°C), and the serum was collected for analysis of TC, TAG and HDL, LDL and VLDL. The analyses were performed using commercial kits (Labtest) following the recommendations of manufacturers and an automatic analyser LabMax 240 premium (Labtest) calibrated to read at 505 nm (TAG), 500 nm (TC) or 600 nm (HDL).
Histological evaluation of liver and intestine
For histological evaluation of the intestine and liver, fragments of the major lobe of the liver and medial portion of the large intestine, viz. the colon (2 cm), were removed from dams and offspring (30 and 90 d), washed in saline solution (0·9 % NaCl) and fixed in 10 % buffered formalin for 24 h. The tissues were subjected to a histological procedure for obtaining blocks from which semi-serial 4-µm sections were cut. The slides were hydrated, stained with haematoxylin–eosin (HE), dehydrated, diaphanised in xylol and mounted with ‘entellan’ for optical microscopic analysis (Motic BA 200). Hyperaemia, inflammatory exudate, haemorrhage, vasodilation, necrosis, epithelial preservation, hypertrophy and hyperplasia of the smooth muscle layer were evaluated in intestinal histological sections( Reference Batista, Alves and Lima 15 ). Inflammatory exudate, hyperaemia, haemorrhage, necrosis, preservation of the hepatic parenchyma (cell integrity, centralised nuclei and highly evident nucleoli) and degenerative processes (e.g. fat degeneration) were evaluated in liver histological sections( Reference Batista, Alves and Lima 15 ).
Quantitative analyses of the intestinal morphometry of animals were also performed. Morphometric analyses to quantify the ratio of villus and intestinal crypt using HE were performed using an image analyser with Zeiss Imaging Processing Software (KS 300, Zeiss; licensed to the Department of General Pathology, Institute of Biological Sciences, Federal University of Minas Gerais)( Reference Erben, Loddenkemper and Doerfel 33 ). From each specimen, twenty-five fields of each histological slide were randomly selected using the 10× objective and captured through the image analyser. In the liver, a semi-quantitative analysis was performed by creating a score related to the distribution of the main lesion (i.e. hepatic steatosis) ranging from 0 to 3, where 0–1 indicates animal with absence of the lesion; 1–2 indicates discrete lesion distribution (light focal); 2–3 indicates moderate distribution (pronounced focal to diffuse light) and 3–4 indicates sharp (multifocal accentuated to diffuse accentuated). Reading of slides was performed randomly by two pathologists. A 10× objective and 40× photomicrograph of the colon and liver were used to obtain the images.
Statistical analysis
Statistical power of 0·80 (80 %) was obtained by estimating twelve adult female Wistar rats (six females per group), sixteen 30-d-old pups (eight pups per group) and sixteen 90-d-old pups (eight pups per group). The minimally detectable effect size was 1·0, and the significance level was 0·05. Statistical analyses were performed using GraphPad Prism 6.0 (GraphPad Software Inc.) with the application of two-way repeated-measures ANOVA or Student’s t test. For the multiple comparison test between the groups, the Bonferroni post hoc test was used. For correlation analysis, Pearson’s correlation test was performed, in which correlations were classified as low (r 2 0·10–0·29), moderate (r 2 0·30–0·49), significant (r 2 0·5–0·69) or very high (r 2 0·70)( Reference Kozak 34 ). A significance level of 5 % (P≤0·05) was considered for all tests.
Results
Food intake and body weight
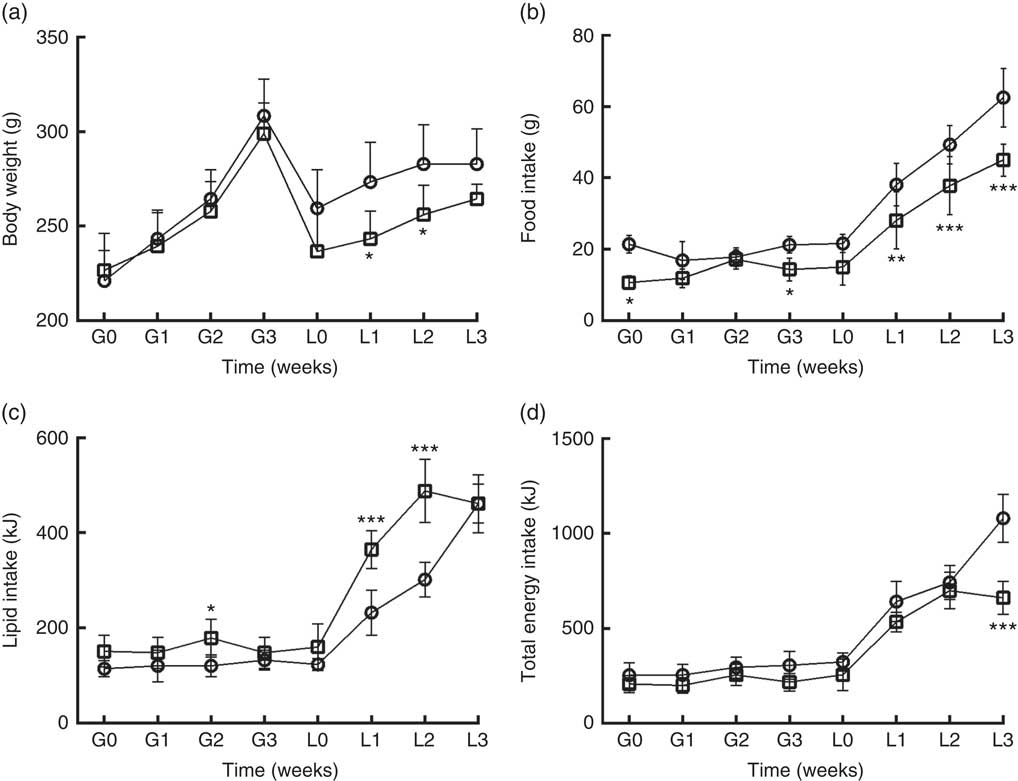
DLP dams had lower body weight (Fig. 1(a)) during the lactation period (L1 and L2) (P≤0·05) compared with the CTL dams. DLP dams also had lower food intake (Fig. 1(b)) during two periods of gestation (G0 and G3) and all lactation period (L1–L3), but no differences were observed in lipid intake between DLP and CTL dams (Fig. 1 (c)) throughout the experiment (P>0·05), in spite of the lower total energy intake by DLP dams at L3 time (Fig. 1(d)) (P≤0·001).
Body weight (a) of dams that consumed the control (CTL, ![]() ) or dyslipidaemic (DLP,
) or dyslipidaemic (DLP, ![]() ) diet during pregnancy (G1, G2, G3) and lactation (L1, L2, L3); food intake (b), lipid intake (c) and total energy intake (d). Values are means, with standard deviations represented by vertical bars. * P≤0·05, ** P≤0·01, *** P≤0·001. Two-way ANOVA followed by Bonferroni post hoc test.
) diet during pregnancy (G1, G2, G3) and lactation (L1, L2, L3); food intake (b), lipid intake (c) and total energy intake (d). Values are means, with standard deviations represented by vertical bars. * P≤0·05, ** P≤0·01, *** P≤0·001. Two-way ANOVA followed by Bonferroni post hoc test.
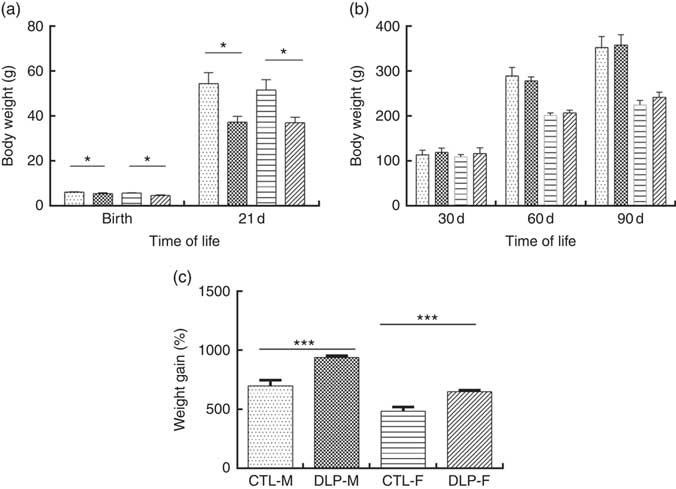
As shown in Fig. 2(a), the pups from DLP dams had low birth weight (LBW) and low weight at 21 d of age for both sexes (P≤0·01), but no difference was observed in weight gain at 30, 60 and 90 d of age (Fig. 2(b)). Considering the percentage of total weight gain from birth to 90 d of age (Fig. 2(c)), pups from DLP dams had a higher percentage of weight gain than pups from CTL dams in both sexes (P≤0·05).
Body weight of offspring from dams that consumed the control diet (CTL) or dyslipidaemic (DLP) diet at birth, 21st (weaning) (a), 30th, 60th and 90th days of age (b) and total percentage of weight gain (from birth up to the 90th day of age) (c). Values are means, with standard deviations represented by vertical bars. * P≤0·05, *** P≤0·001. Two-way ANOVA followed by Bonferroni post hoc test. CTL-M (![]() ), male pups fed by dams that consumed a control diet; DLP-M (
), male pups fed by dams that consumed a control diet; DLP-M (![]() ), male pups fed by dams that consumed a dyslipidaemic diet; CTL-F (
), male pups fed by dams that consumed a dyslipidaemic diet; CTL-F (![]() ), female pups fed by dams that consumed a control diet; DLP-F (
), female pups fed by dams that consumed a control diet; DLP-F (![]() ), female pups fed by dams that consumed a dyslipidaemic diet.
), female pups fed by dams that consumed a dyslipidaemic diet.

Murinometric parameters and organ and tissue weights
The murinometric parameters of dams measured at the end of the lactation period as well as those of pups at 30 and 90 d of age were similar for both the CTL and DLP groups (P>0·05). Liver weight was higher (P≤0·001) in DLP dams than in CTL dams. At 30 d of age, pups from DLP dams had higher wet weight liver (P≤0·05) than pups from CTL dams, but no difference was observed in relative wet weight (g/100 g) of visceral fat or gut, which followed the same pattern seen in the dams. At 90 d of age, pups of both sexes from DLP dams had higher liver and intestinal weight than pups from CTL dams (P≤0·01); however, only males from DLP dams had greater visceral fat weight (P≤0·001) (Table 3).
Murinometric parameters and normalised weight of organs of dams fed a control diet (CTL) or dyslipidaemic diet (DLP) and of their respective pups at 30 and 90 d of age (Mean values and standard deviations)

CC, chest circumference, AC, abdominal circumference; CTL-M, male pups fed by dams that consumed a control diet; DLP-M, male pups fed by dams that consumed a dyslipidaemic diet; CTL-F, female pups fed by dams that consumed a control diet; DLP-F, female pups fed by dams that consumed a dyslipidaemic diet.
Results obtained from two-way ANOVA followed by the Bonferroni post hoc test: * P≤0·05, ** P≤0·01, *** P≤0·001.
Hepatic and faecal fat
The percentage of liver fat was higher in DLP dams than in CTL dams (P≤0·05) (Fig. 3 (a)). In addition, a higher percentage of fat was observed in the liver of pups of both sexes at 30 d of age whose dams had been fed the DLP diet (P≤0·05) (Fig. 3 (c)). However, only female pups from DLP dams at 90 d of age had higher levels of liver fat (P≤0·05) than pups from the CTL dams (Fig. 3(c)).
Percentage of liver and faecal fat of dams (a) fed the control (CTL, ![]() ) or dyslipidaemic diet (DLP,
) or dyslipidaemic diet (DLP, ![]() ) and their respective offspring (b) and (c). Two-way ANOVA followed by the Bonferroni post hoc test. Values are means, with standard deviations represented by vertical bars. * P≤0·05, *** P≤0·001. Data are expressed as a percentage (%). CTL-M (
) and their respective offspring (b) and (c). Two-way ANOVA followed by the Bonferroni post hoc test. Values are means, with standard deviations represented by vertical bars. * P≤0·05, *** P≤0·001. Data are expressed as a percentage (%). CTL-M (![]() ), male pups fed by dams that consumed a control diet; DLP-M (
), male pups fed by dams that consumed a control diet; DLP-M (![]() ), male pups fed by dams that consumed a dyslipidaemic diet; CTL-F (
), male pups fed by dams that consumed a dyslipidaemic diet; CTL-F (![]() ), female pups fed by dams that consumed a control diet; DLP-F (
), female pups fed by dams that consumed a control diet; DLP-F (![]() ), female pups fed by dams that consumed a dyslipidaemic diet.
), female pups fed by dams that consumed a dyslipidaemic diet.
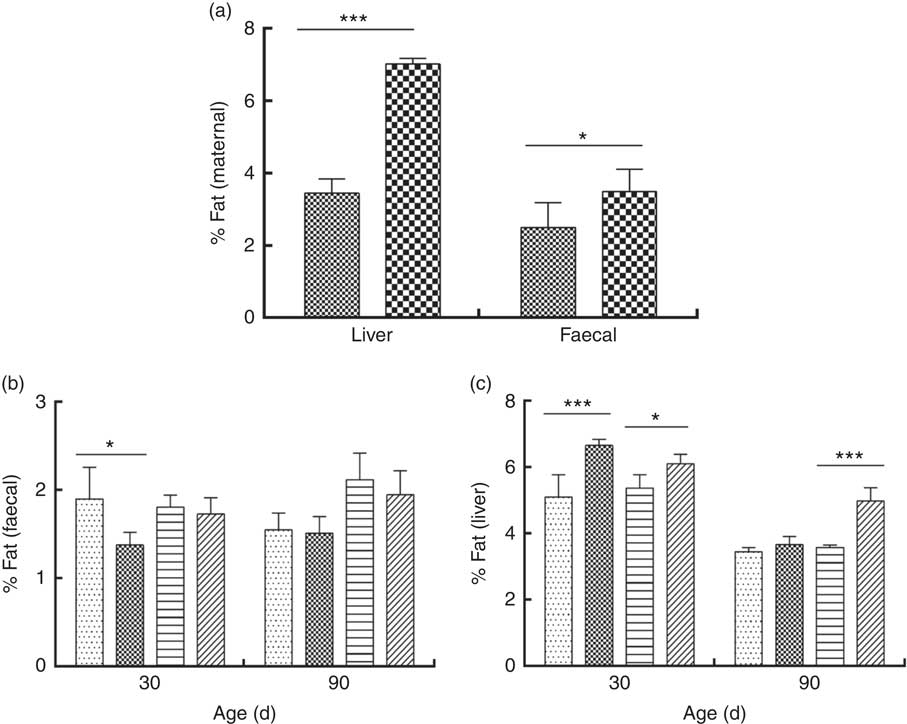
Faecal fat excretion was higher in DLP dams (Fig. 3(a)), and it was lower in male pups from DLP dams at 30 d of age (P≤0·05) when compared with pups from CTL dams (Fig. 3(b)); however, no effect of the diet on faecal fat excretion was observed in pups at 90 d of age.
Microbial counts in faeces
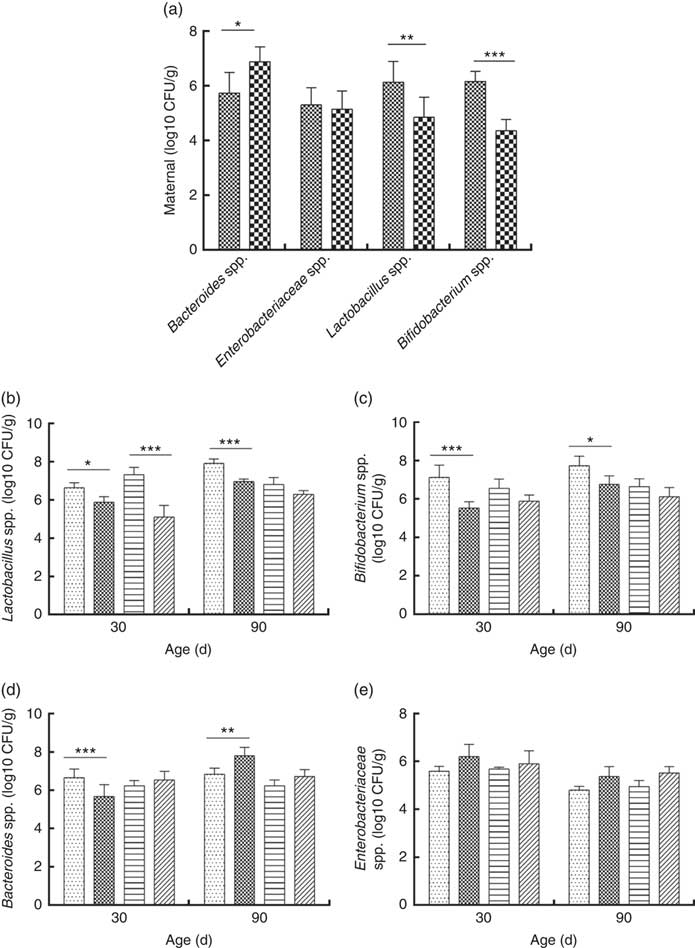
Consumption of a dyslipidaemic diet caused a reduction in the counts of Lactobacillus spp. and Bifidobacterium spp. as well as an increase in counts of Bacteroides spp. in faeces of DLP dams after the pregnancy period (P≤0·05) compared with those of CTL dams (Fig. 4(a)).
Counts of Enterobacteriaceae, Bacteroides spp., Lactobacillus spp. and Bifidobacterium spp. in faeces of dams (a) fed a control diet (CTL, ![]() ) or dyslipidaemic diet (DLP,
) or dyslipidaemic diet (DLP, ![]() ) and in their respective offspring (b–e). Two-way ANOVA followed by the Bonferroni post hoc test. Values are means, with standard deviations represented by vertical bars. * P≤0·05, ** P≤0·01, *** P≤0·001. CFU, colony-forming units. CTL-M (
) and in their respective offspring (b–e). Two-way ANOVA followed by the Bonferroni post hoc test. Values are means, with standard deviations represented by vertical bars. * P≤0·05, ** P≤0·01, *** P≤0·001. CFU, colony-forming units. CTL-M (![]() ), male pups fed by dams who consumed a control diet; DLP-M (
), male pups fed by dams who consumed a control diet; DLP-M (![]() ), male pups fed by dams that consumed a dyslipidaemic diet; CTL-F (
), male pups fed by dams that consumed a dyslipidaemic diet; CTL-F (![]() ), female pups fed by dams that consumed a control diet; DLP-F (
), female pups fed by dams that consumed a control diet; DLP-F (![]() ), female pups fed by dams that consumed a dyslipidaemic diet.
), female pups fed by dams that consumed a dyslipidaemic diet.
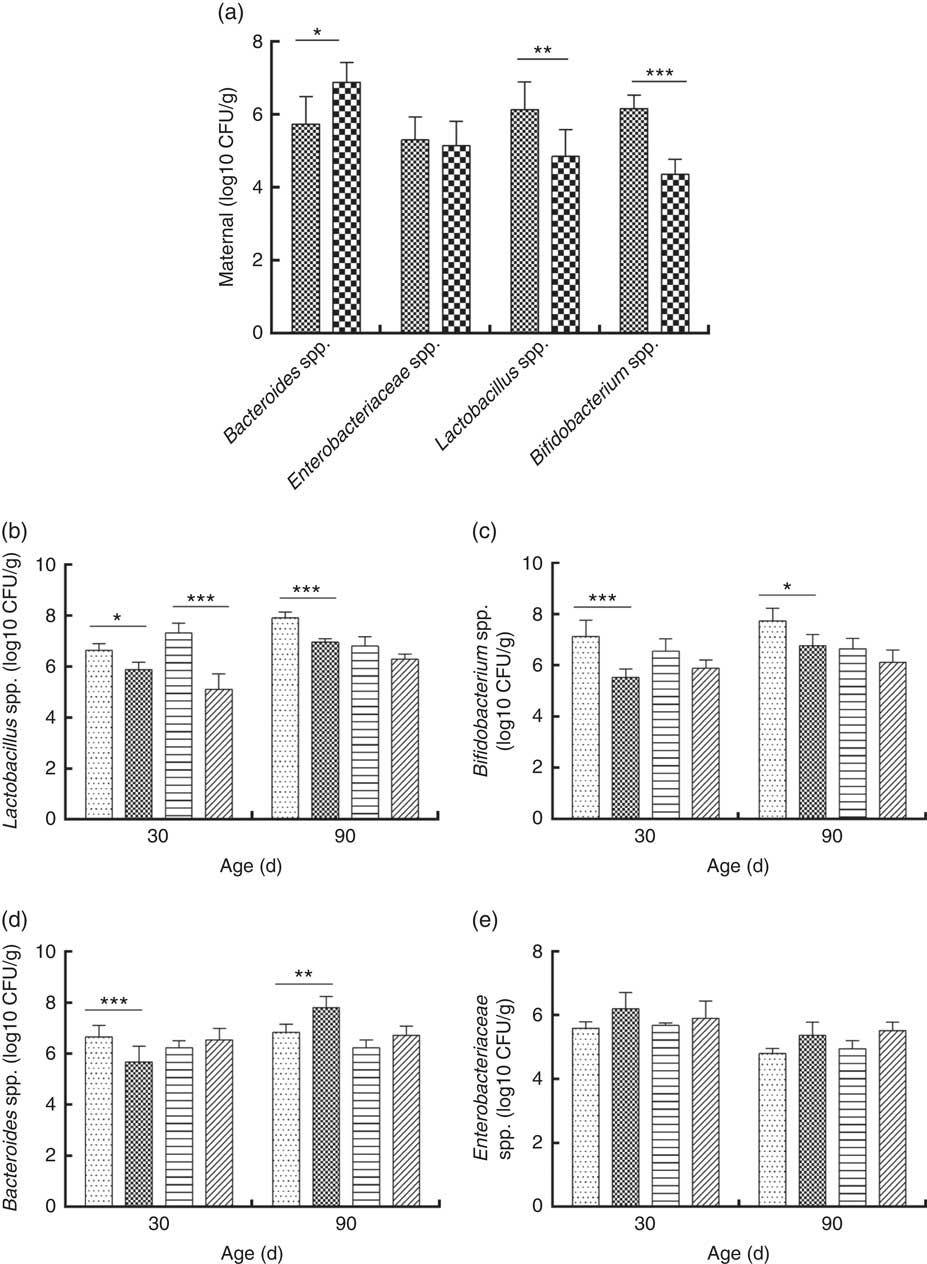
Male and female pups from DLP dams had lower Lactobacillus spp. faecal counts at 30 d of age compared with pups from CTL dams (P≤0·001) (Fig. 4(b)). However, only the male pups from DLP dams presented lower Lactobacillus spp. faecal counts compared with pups from CTL dams at 90 d of age (P≤0·05). The lowest faecal counts of Bifidobacterium spp. were observed in male pups from DLP dams either at 30 or 90 d of age (P≤0·05) (Fig. 4(c)).
Male pups from DLP dams had lower faecal counts of Bacteroides spp. than male pups from CTL dams at 30 d of age (P≤0·001); however, these counts increased in male pups from DLP dams at 90 d of age, which were higher than those in male pups from CTL dams (P≤0·05). Interestingly, these differences were not observed in female pups (Fig. 4(d)). No difference was observed in faecal Enterobacteriaceae counts between groups or sexes at any time points evaluated (P>0·05) (Fig. 4(e)).
Lipid profile
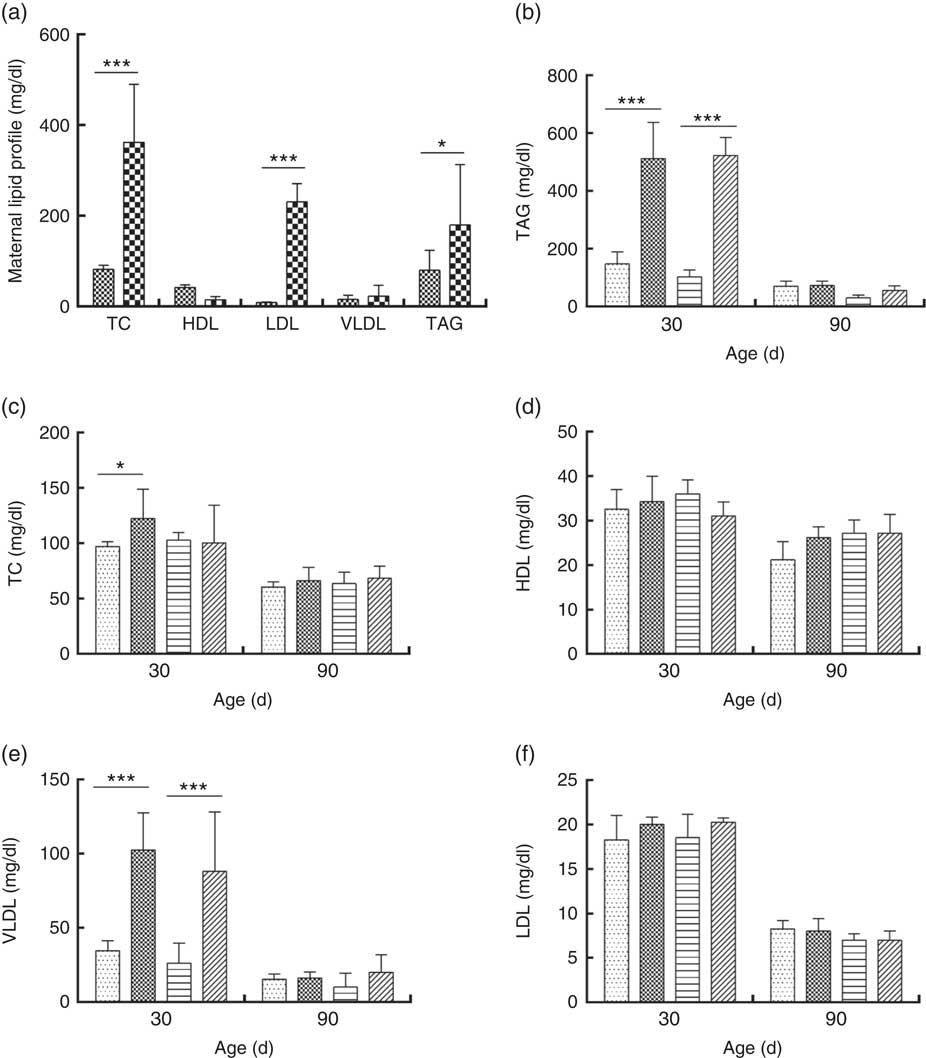
DLP dams showed higher levels of TC, LDL and TAG compared with CTL dams (Fig. 5(a)). Similarly, higher TAG (Fig. 5(b)) and VLDL levels (Fig. 5(e)) were observed in male and female pups from DLP dams at 30 d of age (P≤0·001) compared with those in pups from CTL dams (P≤0·05). No differences were observed in the other measured lipid profile parameters at 30 d of age (P>0·05), and no alteration was observed in the lipid profile in offspring at 90 d of age.
Lipid profile of dams fed a control diet (CTL, ![]() ) or dyslipidaemic diet (DLP,
) or dyslipidaemic diet (DLP, ![]() ) (a) and their respective offspring (b–f) at 30 and 90 d old. Two-way ANOVA followed by the Bonferroni post hoc test. Values are means, with standard deviations represented by vertical bars. * P≤0·05, *** P≤0·001. TC, total cholesterol. CTL-M (
) (a) and their respective offspring (b–f) at 30 and 90 d old. Two-way ANOVA followed by the Bonferroni post hoc test. Values are means, with standard deviations represented by vertical bars. * P≤0·05, *** P≤0·001. TC, total cholesterol. CTL-M (![]() ), male pups fed by dams that consumed a control diet; DLP-M (
), male pups fed by dams that consumed a control diet; DLP-M (![]() ), male pups fed by dams that consumed a dyslipidaemic diet; CTL-F (
), male pups fed by dams that consumed a dyslipidaemic diet; CTL-F (![]() ), female pups of dams that consumed a control diet; DLP-F (
), female pups of dams that consumed a control diet; DLP-F (![]() ), female pups form dams that consumed a dyslipidaemic diet. To convert TAG in mg/dl to mmol/l, multiply by 0·0113; to convert TC, HDL, VLDL and LDL to mmol/l, multiply by 0·0259.
), female pups form dams that consumed a dyslipidaemic diet. To convert TAG in mg/dl to mmol/l, multiply by 0·0113; to convert TC, HDL, VLDL and LDL to mmol/l, multiply by 0·0259.
Pearson correlation analyses showed a significant negative correlation between HDL and Bacteroides spp. counts in DLP dams (P≤0·05) (online Supplementary Fig. S2(a)). A strong negative correlation was observed between TAG and VLDL levels and Bacteroides spp. counts (P≤0·05) in DLP male pups at 30 d of age (online Supplementary Fig. S2(b) and (c)). A significant negative correlation was observed between TAG levels and Lactobacillus spp. counts (P≤0·05) in DLP female pups at 30 d of age (online Supplementary Fig. S2(d)), but a significant positive correlation between HDL levels and Lactobacillus spp. counts was also found (P≤0·05) (online Supplementary Fig. S2(e)).
Histopathological evaluation of the intestine and liver
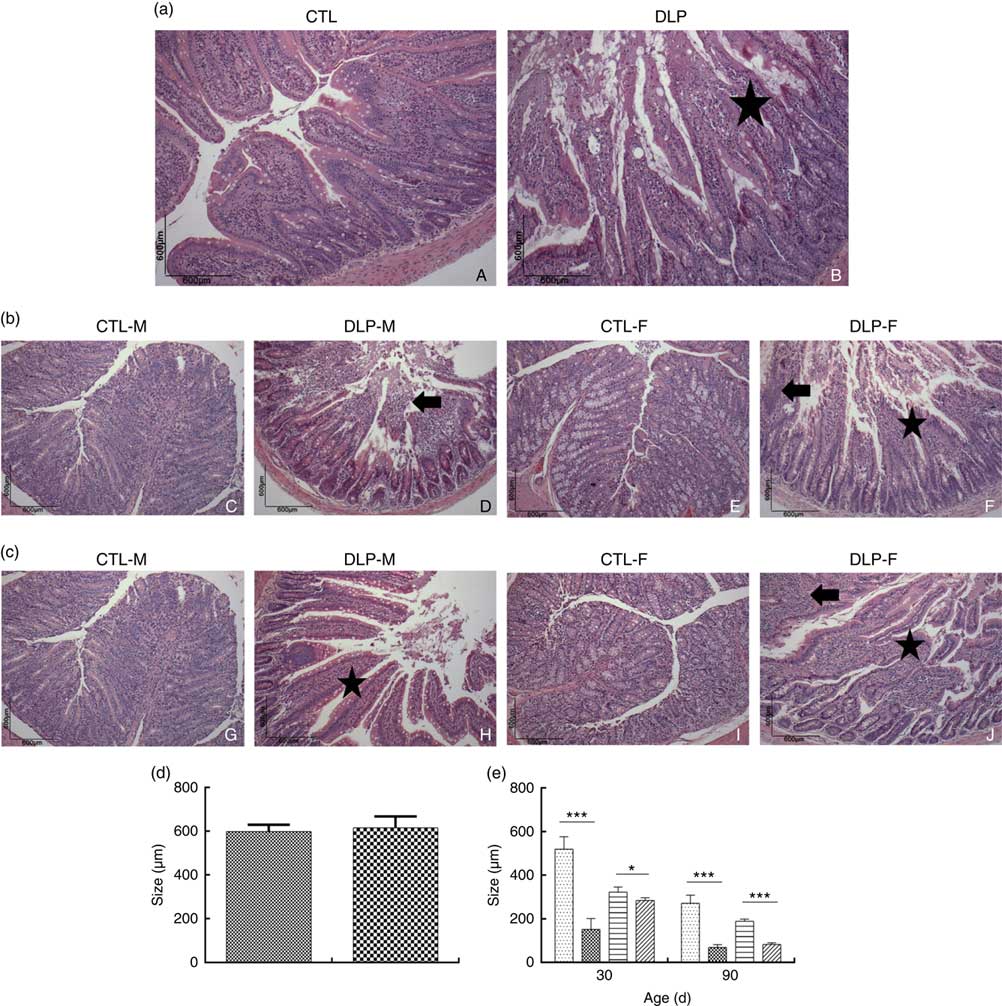
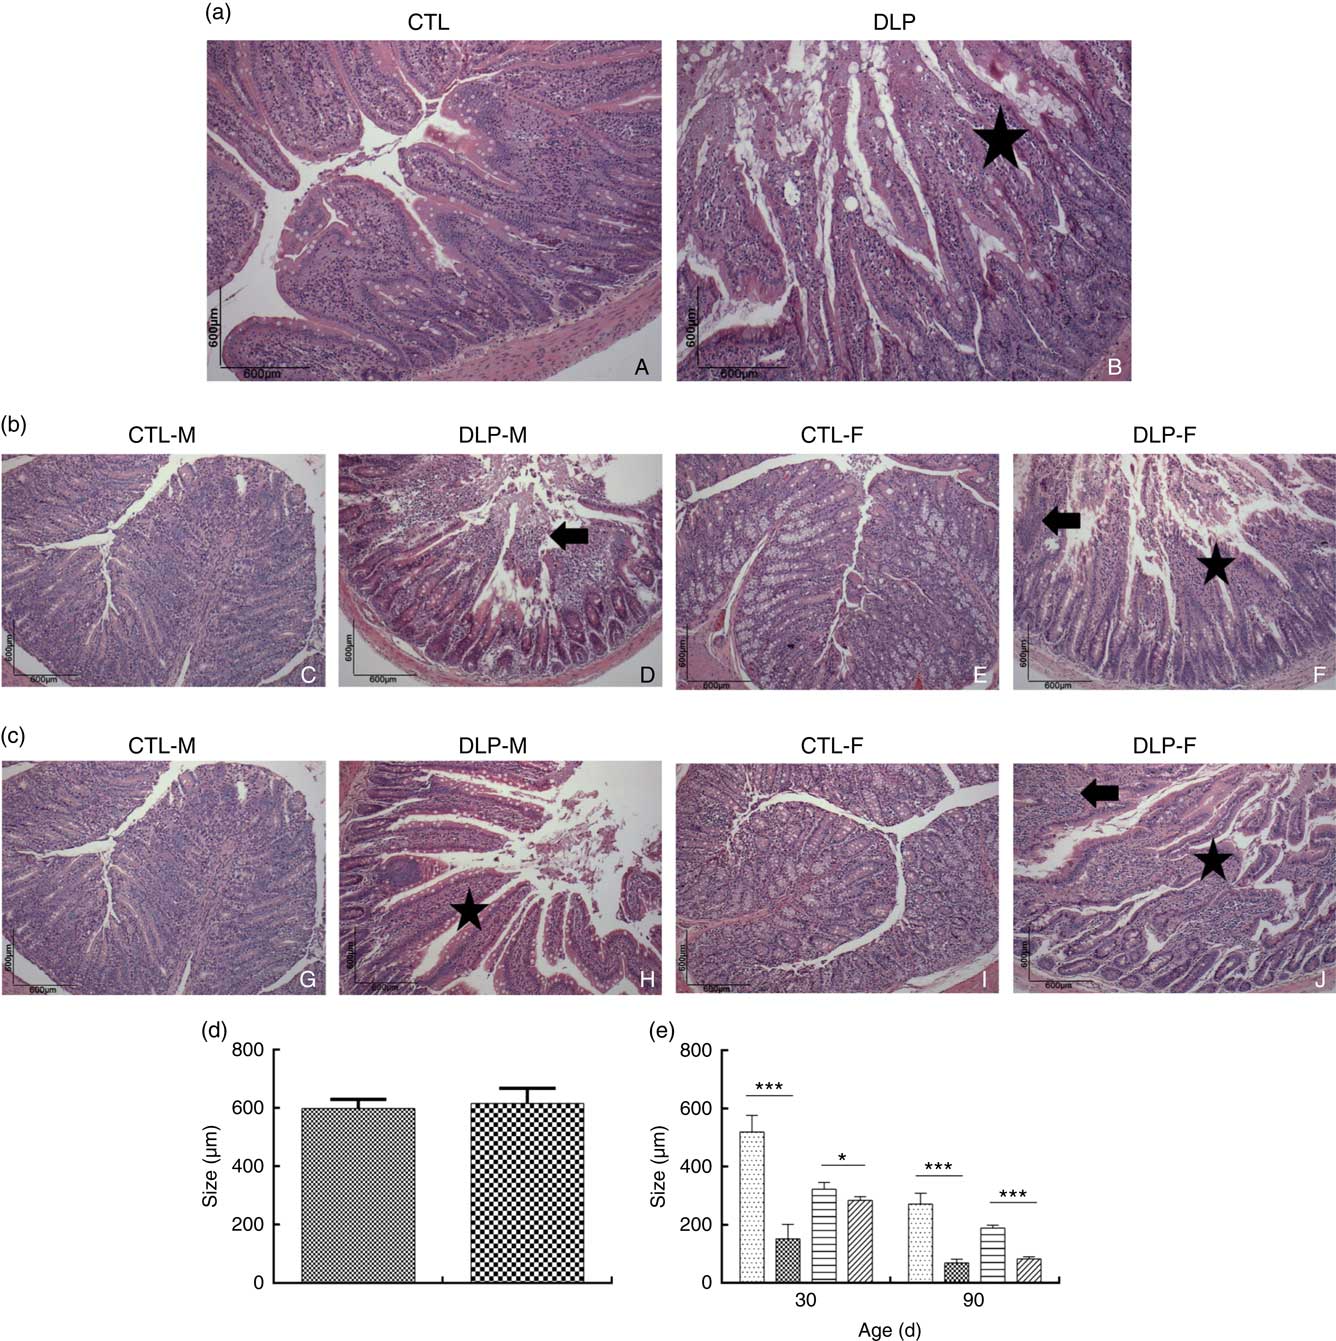
Morphological assessment was performed by a histological analysis of intestinal cells as well as by morphometric analysis of the colon (Fig. 6). These analyses revealed that the DLP dams had villous atrophy (Fig. 6(a)). Similar results were observed in pups from DLP dams at 30 (Fig. 6(b)) and 90 d of age (Fig. 6(c)); both male and female pups showed inflammation, and only female pups presented epithelial villus atrophy. These findings were in accordance with the results of the morphometric analysis, which showed a decreased distance between the crypt and villi in pups from DLP dams (Fig. 6(d) and (e)).
Histology (a) of dams fed a control diet (CTL, ![]() ) or dyslipidaemic diet (DLP,
) or dyslipidaemic diet (DLP, ![]() ) and their respective offspring at 30 (b) and 90 d of age (c) and morphometry of the colon of dams (d) and their respective pups (e) at 30 and 90 d of age. Arrow=mononuclear infiltrate. Star=villous atrophy. t test. Values are means, with standard deviations represented by vertical bars. * P≤0·05, *** P≤0·001. CTL-M (
) and their respective offspring at 30 (b) and 90 d of age (c) and morphometry of the colon of dams (d) and their respective pups (e) at 30 and 90 d of age. Arrow=mononuclear infiltrate. Star=villous atrophy. t test. Values are means, with standard deviations represented by vertical bars. * P≤0·05, *** P≤0·001. CTL-M (![]() ), male pups fed by dams that consumed a control diet; DLP-M (
), male pups fed by dams that consumed a control diet; DLP-M (![]() ), male pups fed by dams that consumed a dyslipidaemic diet; CTL-F (
), male pups fed by dams that consumed a dyslipidaemic diet; CTL-F (![]() ), female pups fed by dams that consumed a control diet; DLP-F (
), female pups fed by dams that consumed a control diet; DLP-F (![]() ), female pups fed by dams that consumed a dyslipidaemic diet.
), female pups fed by dams that consumed a dyslipidaemic diet.
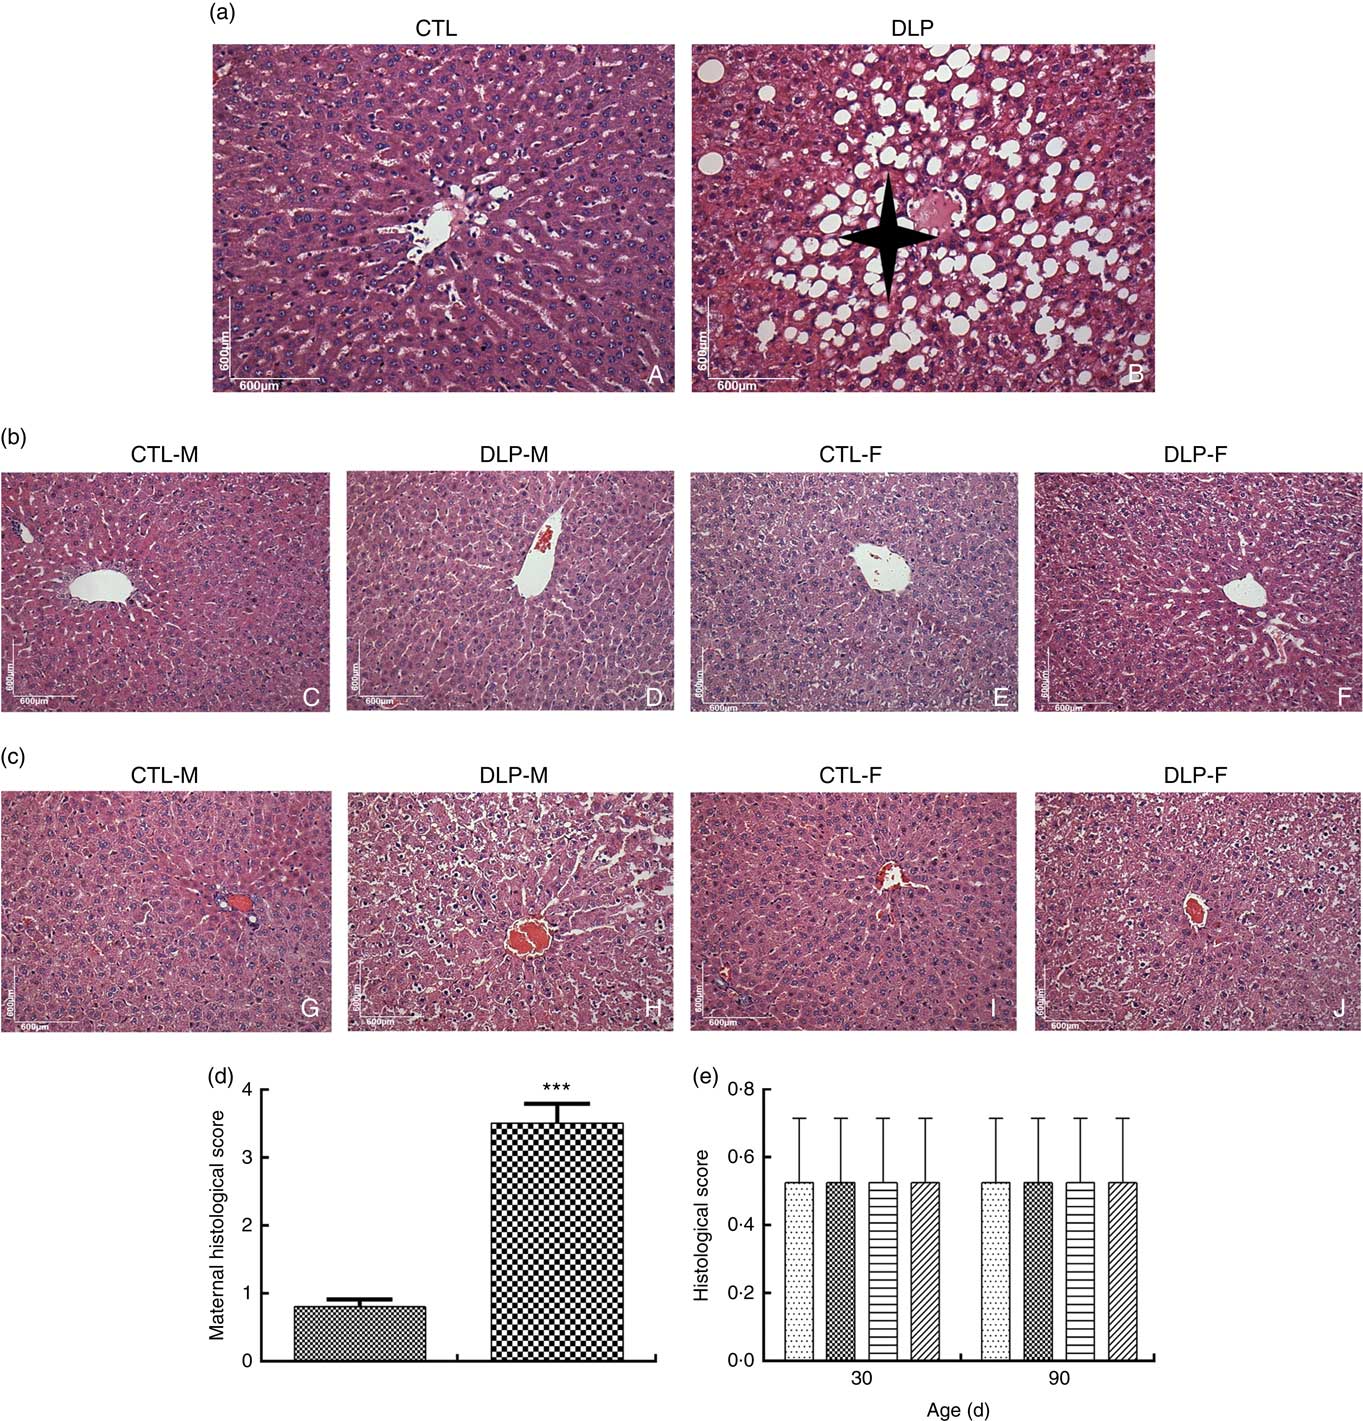
DLP dams showed fatty liver (Fig. 7(a)), which was confirmed by the higher histological scores of hepatic steatosis in this group (Fig. 7(d)). There was no change in the hepatic parenchyma of pups from either DLP or CTL dams at 30 and 90 d of age (Fig. 7(b) and (c)).
Liver histology of dams (a) fed a control diet (CTL, ![]() ) or dyslipidaemic diet (DLP,
) or dyslipidaemic diet (DLP, ![]() ) and their pups at 30 (b) and 90 d of age (c), and histological scores of hepatic steatosis of the livers of dams (d) and their respective pups (e) at 30 and 90 d of age. t test. Values are means, with standard deviations represented by vertical bars. *** P≤0·001. Four-pointed star = hepatic steatosis. CTL-M (
) and their pups at 30 (b) and 90 d of age (c), and histological scores of hepatic steatosis of the livers of dams (d) and their respective pups (e) at 30 and 90 d of age. t test. Values are means, with standard deviations represented by vertical bars. *** P≤0·001. Four-pointed star = hepatic steatosis. CTL-M (![]() ), male pups fed by dams that consumed a control diet; DLP-M (
), male pups fed by dams that consumed a control diet; DLP-M (![]() ), male pups fed by dams that consumed a dyslipidaemic diet; CTL-F (
), male pups fed by dams that consumed a dyslipidaemic diet; CTL-F (![]() ), female pups fed by dams that consumed a control diet; DLP-F (
), female pups fed by dams that consumed a control diet; DLP-F (![]() ), female pups fed by dams that consumed a dyslipidaemic diet.
), female pups fed by dams that consumed a dyslipidaemic diet.
Discussion
The influence of a DLP diet rich in SFA and cholesterol on weight gain, lipid metabolism and liver and intestinal function of dams and their offspring was demonstrated in this study. The investigations focused on how this diet may influence physiological changes in each sex simultaneously from birth to adulthood, since the available literature has focused on only male pups, possibly in an attempt to avoid hormonal influence in female pups. The results of this study showed how maternal nutrition may modulate an array of metabolic parameters in offspring, reinforcing the idea that an adequate nutritional environment during pregnancy and lactation is critical for satisfactory offspring development( Reference Liska, Cook and Wang 5 , Reference Castrogiovanni and Imbesi 17 ).
The DLP diet used in these experiments did not induce weight differences in the dams at the beginning and at the end of the pregnancy, although the DLP diet is more energetic than that of the CTL. These results may be justified by the lower consumption of DLP diet in most of the periods, possibly due to the satietyogenic effect caused by the higher fat content of this diet, indicating that a dyslipidaemic diet does not necessarily induce obesity( Reference Batista, Alves and Lima 15 , Reference Guimarães, De Araújo and Aquino 18 ). Pups from DLP dams of both sexes had LBW, probably because of the imbalance in the fatty acid ratio( Reference Mayor, Finch and Zehr 35 ) and the reduction in energy content from protein, which is typical of a dyslipidaemic diet, and consequently, the low consumption of this nutrient from the indicated diet( Reference Zinkhan, Zalla and Carpenter 36 ). Regarding weight gain, from weaning to adulthood, there was a higher percentage of weight gain in pups from DLP dams compared with that in pups from CTL dams, which could be one of the negative impacts of dyslipidaemic diet consumption by dams( Reference Kruse, Seki and Vuguin 37 – Reference Simino, Fante and Fontana 39 ). Despite the higher weight gain throughout the experiment, both male and female pups from DLP and CTL dams presented similar Lee indexes and BMI. These findings were probably related to the fact that weight gain was proportional to animal length in both sexes during a specific growth phase( Reference Mayor, Finch and Zehr 35 ).
The results of this study also demonstrated that a dyslipidaemic diet during pregnancy and lactation negatively affects maternal hepatic function, causing alterations in liver parenchyma, accumulation of TAG, non-alcoholic fatty liver disease and hepatic injury. A maternal dyslipidaemic diet caused a higher percentage of liver fat in male and female pups from the DLP dams at 30 d of age. However, the maternal dyslipidaemic diet did not induce damage to liver parenchyma in the offspring of either sex over the short- or long-term. This fact may be related to the withdrawal of the negative stimulus exerted by the dyslipidaemic diet, since other studies showed that pups continuing to receive the same dyslipidaemic diet as their dams presented histological changes in the liver( Reference Ji, Dai and Jiang 40 , Reference Perić Kačarević, Grgié and Snajder 41 ). These results suggest that pups may have developed additional complications (other than hepatic steatosis) in the liver, such as the development of hypertension, which causes weight gain in this organ. A previous study observed that male pups from DLP dams presented increased blood pressure and probably increased hydrostatic pressure, causing vascular oedema and vasodilation in hepatic veins( Reference Mayor, Finch and Zehr 35 ).
The percentage of liver fat decreased throughout the life of the pups from DLP and CTL dams, which may be directly associated with hepatic steatosis going undetected in the histological analysis as well as with the similar faecal fat excretion among pups at 90 d of age. These results may also be associated with the fact that offspring from DLP dams returned to a normal diet with lower saturated fat and cholesterol intake or even that a maternal dyslipidaemic diet may not influence the long-term fat storage and excretion in offspring. However, the developmental-associated events occurring between 30 and 90 d of age may have masked the possible alterations that occurred at 30 d, which should also be considered. Apparently healthy rats at 90 d of age could be more sensitive to developing metabolic disorders later in life( Reference Guimarães, De Araújo and Aquino 18 , Reference Venci, Ramos and Martins 42 ), as shown in studies in which maternal malnutrition( Reference Venci, Ramos and Martins 42 – Reference Parlee and MacDougald 44 ) and maternal dyslipidaemia( Reference Guimarães, De Araújo and Aquino 18 ) have impacted health complications in the young adult period, in addition to showing a relationship between fetal nutrition and central control of energy balance and propensity for obesity in adult life, which is associated with an increase in the development of adipose tissue and hypertension( Reference Guimarães, De Araújo and Aquino 18 , Reference Venci, Ramos and Martins 42 , Reference Parlee and MacDougald 44 ).
The pregnancy period alone causes alterations in various systems, including the maternal microbiome, with impacts on the composition of intestinal microbiota of offspring( Reference Rodríguez, Panader and Rodrigo 11 , Reference Mueller, Bakacs and Combellick 12 ). Diet, as an external environmental factor, could also influence these alterations. The available literature reports that a diet rich in saturated fat may induce changes in intestinal microbiota, primarily dysbiosis, in mice( Reference Porras, Nistal and Martínez-Flórez 25 , Reference Wang, Zhao and Gui 45 ). The maternal DLP diet increased Bacteroides spp. faecal counts in dams. The Bacteroides genus has been shown to have affinity for substrates rich in saturated fat and animal origin proteins( Reference Wu, Chen and Hoffmann 46 , Reference De Filippis, Pellegrini and Laghi 47 ). A high faecal population of Bacteroides spp. has also been associated with diarrhoea episodes( Reference Ramamurthy, Pazhani and Sarkar 48 ). The highest counts of Bacteroides spp. were observed in the pups from DLP dams at 90 d of age. However, the maternal DLP diet did not increase the counts of Enterobacteriaceae in offspring throughout the monitored experimental period, probably because the intestine of these animals did not provide an ideal environment (pH 6–7) for the growth of these bacteria. An early study reported that rats fed a DLP diet present an intestinal pH between 8 and 9( Reference Batista, Alves and Lima 15 ).
DLP diet consumption caused a reduction in faecal counts of Lactobacillus spp. and Bifidobacterium spp. in dams and male pups at both 30 and 90 d of age. Our results indicate that male pups were more sensitive to changes in the counts of Bifidobacterium spp. and Bacteroides spp. induced by a maternal DLP diet compared with female pups. Testosterone, oestradiol and progesterone have been shown to influence metabolic pathways of gut microbiota, and these alterations could be related to sexual dimorphism, since males are typically more susceptible to these effects than females. A study relating sex to intestinal microbiota showed that testosterone modulated the faecal populations of Lactobacillus spp. in mice, where non-castrated males had higher counts compared with female or castrated male rats( Reference Yurkovetskiy, Burrows and Khan 49 ). However, possible protective mechanisms in female rats to decrease this sensitivity have not been clarified( Reference García-Gómez, González-Pedrajo and Camacho-Arroyo 50 ).
DLP consumption during pregnancy and lactation caused intestinal dysbiosis in dams and offspring of both sexes both at 30 and 90 d of age. This change in faecal microbiota composition possibly compromised intestinal epithelial integrity and caused a reduction in villi size that could induce complications in nutrient absorption( Reference Sears, Geis and Housseau 51 ). Such damage possibly occurred because the DLP diet increases the production of pro-inflammatory cytokines (IL-6 and TNF-α) involved in the onset of damage to intestinal parenchymal tissue( Reference Chen, Lai and Zhang 52 ).
Offspring of Japanese macaque primates (Macaca fuscata) fed a high-fat maternal diet showed persistent changes in gut microbiota composition, with possible effects on offspring metabolism for up to 1 year( Reference Ma, Prince and Bader 53 ). Other studies have shown that high-fat diets are likely to stimulate the growth of pathogenic bacteria in the intestine (e.g. Bacteroides spp.), causing alterations in fatty acid metabolism and infection in the peritoneal cavity( Reference De Filippis, Pellegrini and Laghi 47 , Reference Higashimura, Nailto and Takagi 54 ).
Another interesting finding of this study was the tendency for offspring to restore the desired composition of intestinal microbiota altered by a maternal DLP diet. Notably, pups from DLP dams that received the CTL diet reconstituted their intestinal microbiota throughout life. The intestinal microbiota of younger pups were probably affected by their consumption of breast milk from DLP dams, which was possibly unbalanced in lipid composition due to maternal ingestion of a dyslipidaemic diet during gestation and lactation( Reference Priego, Sánchez and García 55 ).
The increase in TAG levels and VLDL in offspring was age-specific but not sex-specific, as these parameters were altered at 30 d but not at 90 d of age in both male and female pups. These results indicate that DLP diet consumption alters the lipid composition of breast milk in rats( Reference Rodríguez-Cruz, Sánchez and Bernabe-Garcia 56 , Reference Purcell, Sun and Pass 57 ) and induces alterations in the serum lipid profile of pups in the short-term but not in the long-term( Reference Kojima, Catavero and Rinaman 58 ). This observation could be a consequence of the replacement of a DLP diet with a normal diet or of body homoeostatic regulation, as demonstrated in previous studies in which offspring from dyslipidaemic dams presented normal levels of TC, HDL, LDL and TAG from 90 d of age( Reference Guimarães, De Araújo and Aquino 18 , Reference Gray, Vickers and Segovia 26 ). Another study showed that pups from dams that received a diet rich in saturated fat and nursed up to 14 d had LBW and elevated LDL-cholesterol levels due to the increase in levels of LDL receptor protein, a receptor responsible for the metabolism of LDL-cholesterol; its high levels are linked directly to cases of familial hypercholesterolaemia( Reference Zinkhan, Zalla and Carpenter 36 ).
The altered lipid profile and dysbiosis most prominently observed at 30 d but not 90 d of age reinforces the potential influence of an altered microbiome on host lipid metabolism( Reference Tang, Kitai and Hazen 59 ). The composition of gut microbiota has been reported to affect different molecular pathways associated with cardiovascular and cardiometabolic diseases, for example, trimethylamine/trimethylamine N-oxide pathway, SCFA pathway and primary and secondary bile acid pathways. Nevertheless, bacterial translocation could contribute to the presence of bacterial products in systemic circulation, affecting the inflammatory state( Reference Tang, Kitai and Hazen 59 , Reference Lippi, Danese and Mattiuzzi 60 ).
In addition, a normal lipid profile and greater resistance to changes in faecal microbiota in female pups from DLP dams at 90 d of age were probably influenced not only by dietary factors but also by the action of hormones (e.g. oestrogen) capable of increasing the expression of lipase-sensitive hormone and consequently, the lipolysis and stimulation of lipid oxidation with effects on lipid metabolism( Reference Cooke and Naaz 61 , Reference Jelenik and Roden 62 ).
The results of Pearson’s correlation supported the hypothesis that the maternal diet during the perinatal period impacts not only the maternal faecal lipid profile and microbiota but also the offspring in a sex- and age-specific manner. These positive correlations were particularly observed in offspring at 30 d of age.
Due to the nutritional transition in the world population, studies with animal models involving fetal programming that were initially performed with nutrient-deficient diets( Reference Castrogiovanni and Imbesi 17 , Reference Barros, Manhães-De-Castro and Lopes-De-Souza 63 ) are now directed to evaluate the effect of dyslipidaemic and obesogenic diets and their metabolic repercussions throughout life( Reference Guimarães, De Araújo and Aquino 18 , Reference Venci, Ramos and Martins 42 , Reference Parlee and MacDougald 44 ). It is important to emphasise that studies carried out to evaluate the impact of maternal dyslipidaemia in children and throughout their life are scarce because either ethical and temporal limitations or biochemical assessments of lipid profiles are often not part of the routine antenatal visits( Reference Geraghty, Alberdi and O’Sullivan 64 ). In this sense, for a more complete understanding of the mechanisms related to developmental programming and with respect to the levels of scientific evidence in animal models as well as in clinical and epidemiological studies, the results of the present study may contribute to future recommendations addressed to maternal dyslipidaemia in the context of public health.
In conclusion, the results of this study demonstrate that the consumption of a dyslipidaemic diet during the gestational and lactational period is a preponderant factor for the appearance of alterations that negatively impact lipid metabolism, intestinal parenchyma and faecal microbiota in dams and offspring, especially in males over the short-term. These effects could be a consequence of a possible hormonal protective effect of females. Further studies are required to verify and explain how this hormonal action affects the short-term/long-term health/disease status of offspring from dams fed a DLP diet.
Acknowledgements
The authors thank the Coordination for the Improvement of Higher Education Personnel (Coordenação de Aperfeiçoamento de Pessoal de Nível Superior – CAPES, Brazil) for a scholarship awarded to R. O. P. and CAPES (Brazil) and National Council for Scientific and Technological Development (Conselho Nacional de Desenvolvimento Científico e Tecnológico – CNPq, Brazil) for funding this study (grant no. 552098/2011-6).
R. O. P., J. L. d. B. A., E. L. d. S. and J. d. S. A. designed the study, conducted research in the literature, wrote the manuscript and reviewed the final version. R. O. P., P. P. L., A. F. A., R. d. A. P., J. L. P. d. C., L. T. T. and A. S. S. carried out the biological assay and research in the literature. R. O. P. and J. L. d. B. A. performed statistical analysis of the data.
The authors declare that there are no conflicts of interest.
Supplementary material
For supplementary material/s referred to in this article, please visit https://doi.org/10.1017/S0007114519000011