

Implications
Free-range production systems vary in the amount of outdoor space provided per individual hen but few studies have assessed the impacts on range use. Radio-frequency identification (RFID) tracking of hens from ages 22 to 36 weeks showed individuals with more outdoor space per bird (2000 hens/ha), used the range area for longer than hens housed at 10 000 or 20 000 hens/ha. During weeks 27 to 36, hens within the highest stocking density spent the least time outdoors. Outdoor stocking density affected range use which has implications for free-range system management and developing legislative standards that optimise hen welfare.
Introduction
Consumer concern for animal welfare is driving changes in the laying hen (Gallus gallus domesticus) industry both within Australia and globally leading to growth in alternative housing to the conventional cage such as free-range production systems which are viewed as more natural and ethical (Schröder and McEachern, Reference Schröder and McEachern2004). Free-range systems provide hens with the choice between indoor and outdoor areas and, thus, the opportunity to access fresh air, variable weather and exhibit behaviour such as foraging, sun bathing and eating insects (Fanatico, Reference Fanatico2006; Knierim, Reference Knierim2006). Within Australia, free-range eggs are growing in popularity (Rault et al., Reference Rault, van de Wouw and Hemsworth2013), but considerable variation in current housing parameters, including outdoor stocking density, has sparked consumer dissatisfaction and public debate (Consumer Affairs Australia and New Zealand, 2015). The current Australian Model Code of Practice for the Welfare of Animals – Domestic Poultry (Primary Industries Standing Committee, 2002) states a density of 1500 hens/ha outdoors (at maximum occupancy) with higher hen densities requiring regular range rotation and no maximum density is stated. Thus, free-range systems within Australia currently span from a few hundred hens per hectare to several thousand hens per hectare. Subsequently, the Australian Consumer Affairs Ministers released a new free-range egg labelling information standard on 31 March 2016 requiring hens to have ‘meaningful and regular access to the outdoors, with outdoor stocking of no more than one hen per square metre (maximum 10 000 hens/ha)’. In addition to the national information standard on egg labelling, the Australian Egg Corporation Limited will be releasing new Australian Poultry Standards and Guidelines during 2016. However, there are currently a lack of scientific data available from both Australian and international free-range systems on impacts of outdoor range stocking density on hen range-use behaviour (Pettersson et al., Reference Pettersson, Freire and Nicol2016), thus negating objective determination of optimal outdoor space requirements for free-range laying hens.
The free-range system is a dynamic environment where hens have a daily choice of whether to access the outdoor resource. Therefore, to determine the preferred space requirements outdoors, it is imperative to measure how frequently individual hens choose to access the range. Previous studies using group-level live counts across commercial free-range farms within the UK, with flock sizes encompassing ~100 to 16 000 individuals housed at indoor stocking densities from 4 to 12 birds/m2, showed on average, 12% of the flock was seen on the range simultaneously, with fewer birds ranging as flock size and indoor stocking density increased (outdoor stocking density not stated; Gilani et al., Reference Gilani, Knowles and Nicol2014). This inverse relationship between range use and/or indoor stocking density and flock size has been further supported by group-level direct observational studies within the UK and EU with similar low percentages of birds seen on the range simultaneously (e.g. Bubier and Bradshaw, Reference Bubier and Bradshaw1998; Harlander-Matauschek et al., Reference Harlander-Matauschek, Felsenstein, Niebuhr and Troxier2001; Hegelund et al., Reference Hegelund, Sørensen, Kjaer and Kristensen2005).
To document individual-level patterns of outdoor access, researchers have employed the use of RFID technology to track range use of individual microchip-tagged hens (e.g. Richards et al., Reference Richards, Wilkins, Knowles, Booth, Toscano, Nicol and Brown2011; Gebhardt-Henrich et al., Reference Gebhardt-Henrich, Toscano and Fröhlich2014). Recent research in European commercial systems incorporating a covered veranda and a free-range area, compared flocks sizes of ~2000 to ⩾9000 hens housed at an outdoor stocking density of 4000 hens/ha and showed 47% to 90% of tagged birds (5% to 10% of total flock) visited the free-range area at least once (Gebhardt-Henrich et al., Reference Gebhardt-Henrich, Toscano and Fröhlich2014). Similar to previous group-level observations, birds from smaller or medium-sized flocks visited the range more often and spent a longer time ranging, but many birds did not use the range every day (Gebhardt-Henrich et al., Reference Gebhardt-Henrich, Toscano and Fröhlich2014). Richards and colleagues also evaluated individual range usage across the flock cycle in commercial laying hens within the UK with an outdoor stocking density of 1000 birds/ha (Richards et al., Reference Richards, Wilkins, Knowles, Booth, Toscano, Nicol and Brown2011). Approximately 80% of tagged birds (10% of flock; 1500 hens/flock) were registered as using the pop holes frequently, ~8% accessed the range on <10% of available days and a similar proportion were never registered on the RFID system at all (Richards et al., Reference Richards, Wilkins, Knowles, Booth, Toscano, Nicol and Brown2011). Finally, previous studies in the same experimental facility as the current research showed 39% of hens in flock sizes of 300 birds at an outdoor stocking density of 2400 hens/ha used the range on a daily basis, with 13% never venturing outdoors (Hinch and Lee, Reference Hinch and Lee2014).
RFID tracking with varying flock sizes and range area is consistently showing that not all hens choose to visit the range area daily, with some hens never venturing outside at all, including a wide variation in daily time spent outside. The objective of this experiment was to use RFID tracking of individual hens in an experimental free-range system to measure the impact of three different outdoor range stocking densities (2000, 10 000 and 20 000 hens/ha) on average daily time spent outside, average number of daily visits outside, maximum visit durations and percentage of available ranging days that individual hens ventured outside, including video decoding of total numbers of hens outside and present in different areas of the range across the day.
Material and methods
Animals and housing
In total, 900 ISA Brown pullet laying hens (Gallus gallus domesticus) were placed at 16 weeks of age (May 2015) into the University of New England’s Laureldale experimental free-range facility located in Armidale, Australia. Floor-raised pullets were obtained from a commercial supplier. Birds were IR beak-trimmed at 1-day old with a hot-blade re-trim at 11 weeks of age.
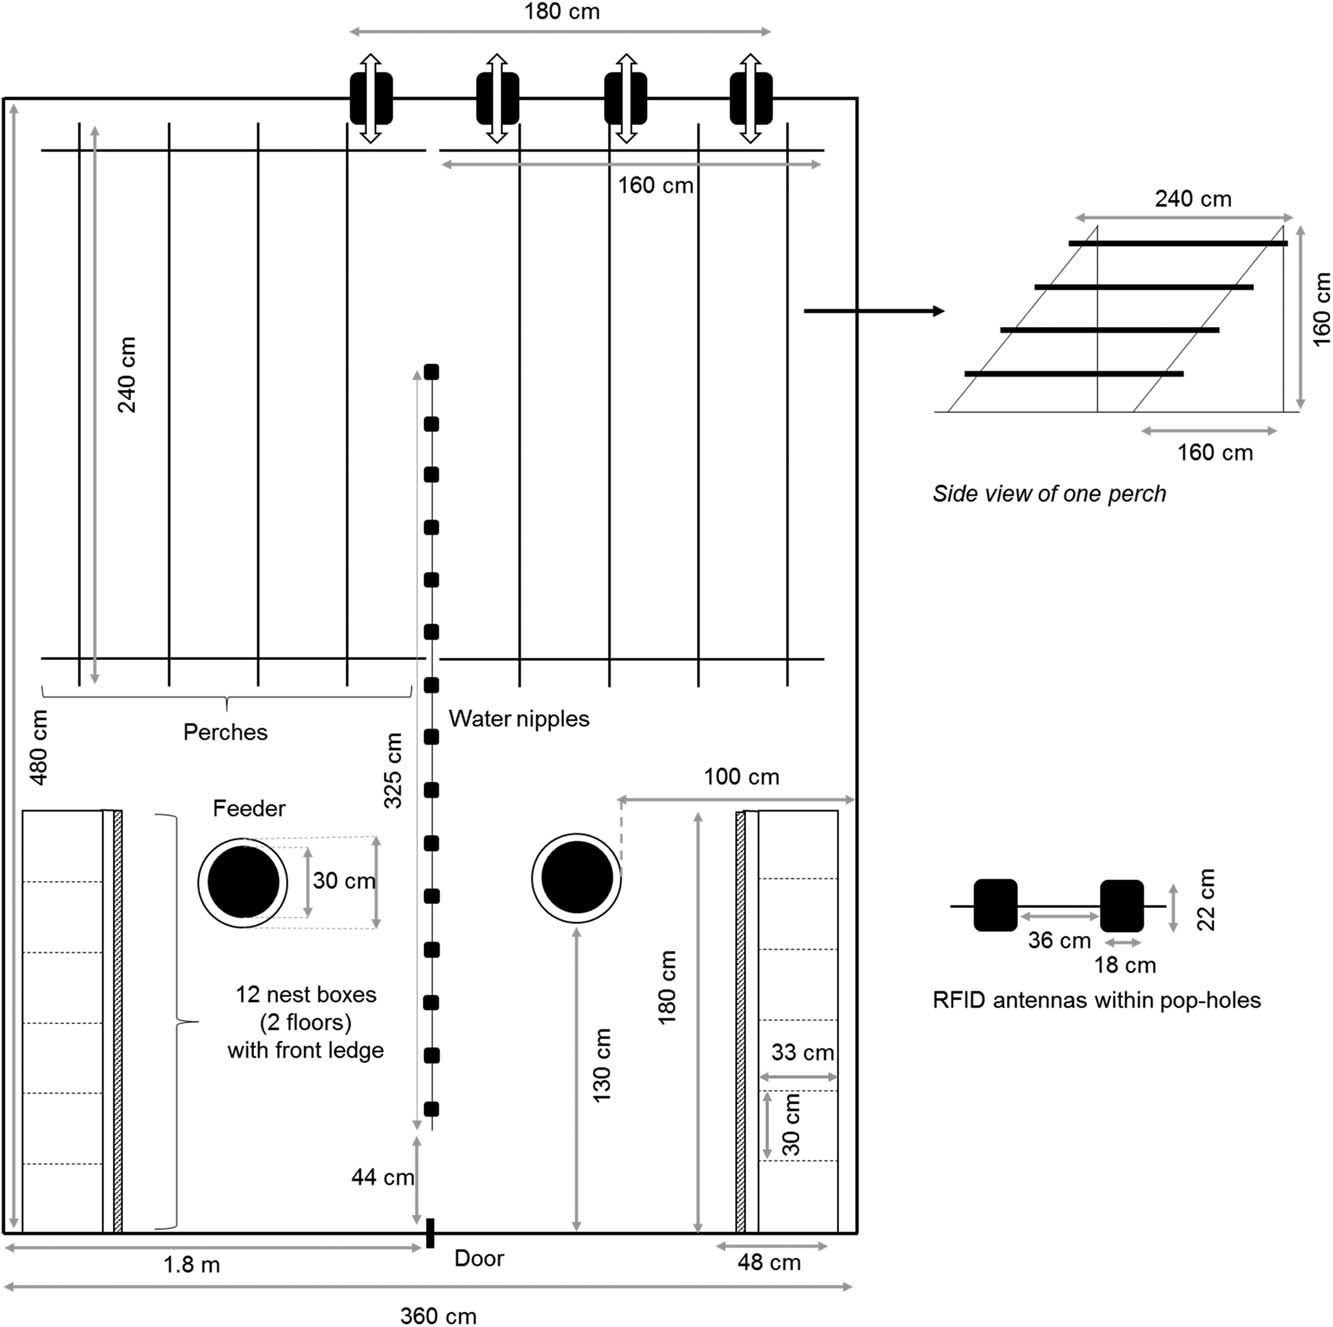
The hens were evenly distributed between six indoor floor pens (150 birds/pen) with equal indoor stocking densities of 9 birds/m2 (Figure 1). Indoor resources per bird were provided to meet or exceed the Australian Model Code of Practice for the Welfare of Animals – Domestic Poultry (Primary Industries Standing Committee, 2002) (Figure 1). Birds were fed a commercial layer mash (Barastoc – Premium Top Layer Mash, Melbourne, VIC, Australia) available ad libitum. Rice hulls at an initial depth of ~4 cm were provided as a litter substrate.
A top-down schematic of the hens’ indoor pen set-up showing location of the range pop holes (including radio-frequency identification (RFID) antennas), perches (side view included), nest boxes, feed and water. Each indoor pen had identical resources and configuration.
The shed was fan-ventilated but not temperature or humidity controlled with an average indoor temperature of 8.8°C±4.09 (range: −2.2°C to 19.4°C) across the trial period, as measured at bird height. Incandescent lighting gradually increased from 15 to 16 h of light by 20 weeks of age (lights on at 0400 h, lights off at 2000 h). The lux (Lutron Light Meter, LX-112850; Lutron Electronic Enterprise CO., Ltd, Taipei, Taiwan) inside the pen when the pop holes were closed, measured at bird height in three locations within the pen (front, middle and back), ranged from 4 to 21 lux. This range increased to 5 to 190 lux when the pop holes were open as measured on one cloudy and one sunny day.
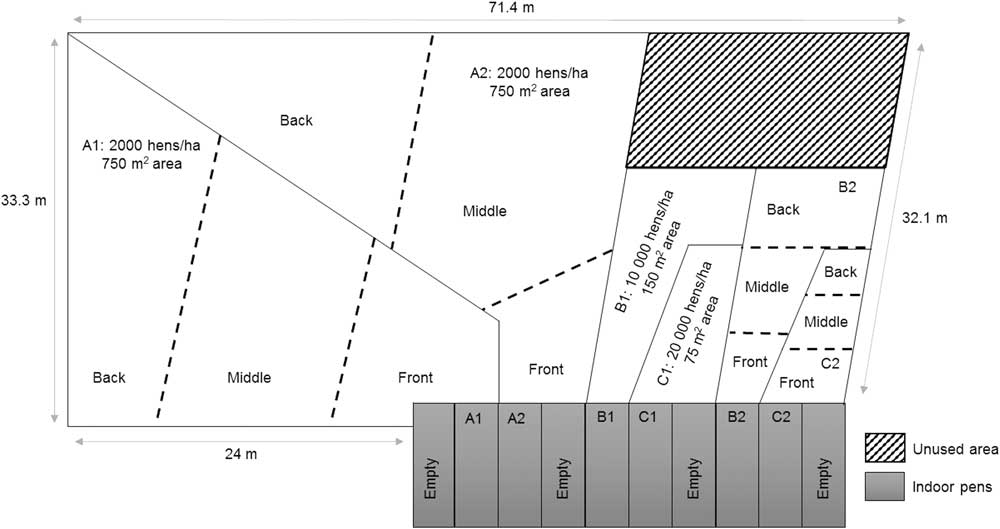
Each indoor pen was associated with a designated fenced (2 m high to prevent birds flying over but birds were not visually isolated between ranges) outdoor area which was initially 100% covered (before bird access) with a variety of grass and weeds typical to the region. To minimise the variables associated with birds accessing the outdoor areas, no shade or shelter structures that have been shown to encourage range use were present (Hegelund et al., Reference Hegelund, Sørensen, Kjaer and Kristensen2005; Nagle and Glatz, Reference Nagle and Glatz2012). The impact of three outdoor stocking density treatments were assessed with two replicates per treatment (maximum replicates able to fit within the experimental range area) (Figure 2). The pop holes containing four RFID passageways (Figure 1) that provided range access were first opened at 21 weeks of age (~20% production) with subsequent daily access from 0900 to 1630 h across 15 weeks over winter. Birds were not forced onto the range as measuring natural range usage (per commercial practice) was the objective of this research. Assessing outdoor access over the winter period provided ideal conditions for frequent range usage as days were typically dry (sunny/cloudy with rain on 12% and snow on 2% of days) and outdoor temperatures generally mild (average outdoor temperatures during range access hours were 14.3°C±5.34; range: −3.5°C to 27.9°C). Photos of each range were taken weekly to document hen degradation of ground cover with visual estimations made each week on percentage of ground cover remaining (green v. brown area). Hens were encouraged to return inside each afternoon using 350 g of poultry grain mix per pen (Barastoc – Poultry Grain Mix, Melbourne, VIC, Australia) and all birds were held inside each night.
A map of the six indoor pens and their designated outdoor range areas for the three outdoor stocking density treatments (2000, 10 000, 20 000 hens/ha), including the front, middle and back range delimitations used for describing range area usage by all hens (range delimitations were equal between both ‘B’ and both ‘C’ pens, respectively).
Radio-frequency identification tracking
All birds were leg-banded (plastic numbered split-ring; Roxan Developments Ltd, Selkirk, Scotland) at 17 weeks of age with 75 randomly selected birds in each pen (50%) also fitted with an adjustable leg band (Roxan Developments Ltd) containing a glued RFID microchip (Trovan® Unique ID 100 (FDX-A): operating frequency 128 kHz; Microchips Australia Pty Ltd, Keysborough, VIC, Australia). All microchips within leg bands were tested before being fitted to hens, and all microchips that were never registered on the system during the trial were re-tested to confirm their functionality. Three RFID systems were purchased from Microchips Australia Pty Ltd with equipment developed and built by Dorset Identification B.V. (Aalten, The Netherlands) using Trovan® technology. Each RFID system consisted of four passageways (36 cm H×18 cm W) situated within the pop holes (Figure 1), each with paired optical beam sensors at either side of an RFID antenna plate and all connected to an RFID decoder downloading directly to a USB flash drive. Each passageway registered and recorded the date and time each tagged bird passed through and in which direction (onto the range, or into the pen) with a precision of 0.024 s (maximum detection velocity 9.3 m/s). These passageways were situated at a height ranging from 17 to 23 cm inside the pens and at heights ranging from 33 to 42 cm outside the pens depending on litter build-up depth inside or ground topography outside (as measured at 24 weeks). The RFID system used was previously configured in this experimental setting with width of pop hole passageways designed to allow one bird to pass through, and height above ground to encourage the bird to land onto the antenna with both feet (Hinch and Lee, Reference Hinch and Lee2014). Previous video validation showed 100% detection rate, but the system also registered ‘false’ readings such as a bird jumping onto the antenna and jumping back off, triggering only one set of sensor beams (Hinch and Lee, Reference Hinch and Lee2014). These false readings were filtered out with custom-designed software (see ‘Data and statistical analyses’). The RFID systems were placed in the indoor pens 2 weeks before pop holes first opened and RFID tracking occurred daily from 22 to 36 weeks (1 week permitted to acclimate to the pop hole passageways and the range). However, due to having three RFID systems only, one replicate from each stocking density was recorded for 2 weeks, then the three RFID units were swapped to record the second replicate for 2 weeks. In total (excluding days of system failure), daily tracking data were recorded for each stocking density as follows: 2000 hens/ha: 91 days; 10 000 hens/ha: 91 days; 20 000 hens/ha: 88 days.
Range video recordings and decoding
A series of hand-held video cameras (Panasonic HC-V110, Panasonic HDC-SD40 (Panasonic Australia Pty Ltd); Sony HDR-XR260E, Sony HDR-XR550 (Sony Electronics Inc., San Diego, CA, USA)) were used to record each range between 26 and 28 weeks (peak production period) with 7 sampling days per range (with the equipment available, only three ranges could be recorded on 1 day, one range from each treatment replicate). On each sampling day, the entire range was video recorded from 0900 h (pop hole opening) to 1630 h (pop hole closing). Resulting videos were used to count the total number of birds outside in three different parts of the range (Figure 2): one close to the pop holes (front), one in the middle (middle) and one at the back of the range (back). Sampling occurred 10 min after pop hole opening, and every 20 min thereafter until pop hole closing (three observers decoded videos, inter-observer reliability 93%). These range delimitations were designed to describe how the hens used the available outdoor area between different-sized ranges, but due to the size variation between and within pens, it was not possible to make any statistical comparisons between the areas.
Ethical statement
All research was approved by the University of New England Animal Ethics Committee (AEC14-100) before the start of data collection.
Data and statistical analyses
Discounting any data from birds that died part way through the trial, the individual hen sample sizes for daily RFID tracking data were as follows: 2000 hens/ha: n=148; 10 000 hens/ha: n=149; 20 000 hens/ha: n=150. RFID data were separated into individual hens’ daily range use from weeks 22 to 26, weeks 27 to 31 and weeks 32 to 36. These periods incorporated ~2 weeks of RFID tracking from each replicate within the three stocking densities. Although individual range use may be affected by activities of the group, space requirements are typically stated per bird, and it was the variation at the individual level within the group environment that was the focus for this study. All RFID data were run through a custom-built software program written in the ‘Delphi’ language that filtered out any unpaired false readings, such as if a bird sat in the pop hole and triggered continuous readings, or jumped into the pop hole but never completed a full transition either onto the range or back into the pen. The program then summarised the daily data per hen from within the three sampling time blocks across the experimental period to provide the daily time spent outdoors, the number of daily visits, maximum time per visit, and overall, how many days the range was accessed by each tagged hen (converted to percentage of total available days that each hen visited the range).
The daily time outdoors, and maximum time per visit were log10 transformed to normality with number of daily visits square-root transformed. Data were analysed in JMP 12.1.0 (SAS Institute Inc., Cary, NC, USA) using GLM with α set at 0.05. GLMs were first used to compare the changes in range-use parameters between the three sampling week periods by all stocking densities combined. GLMs were then used to compare the effects of individual hens nested within pen replicate nested within stocking density, pen replicate nested within stocking density and stocking density on range-use parameters (daily hours outside, daily visits, maximum time per visit), separately within each sampling time period (weeks 22 to 26, weeks 27 to 31 and weeks 32 to 36). The main effects were still present when the interaction term of ‘sampling weeks’ was fitted to the model. We chose to analyse the sampling periods separately to focus on the differences between stocking density treatments within specific time periods as per the main objective of the study. Where significant differences were present between stocking densities, Student’s t tests were applied to the least squares means with a Bonferroni correction applied to the α level to account for multiple post-hoc comparisons. The percentages of available days that hens accessed the range could not be transformed to normality, thus, non-parametric Kruskal–Wallis tests were used to compare percentages of days outside between stocking densities separately for each sampling week period, and to compare all stocking densities combined across sampling weeks. Post-hoc comparisons for significant effects were made using the Bonferroni–Dunn method. Spearman’s ρ for non-parametric data were used to compare the relationship between average daily hours spent outdoors and total percentage of available days the range was accessed across the entire trial period, separately for each stocking density (excluding those birds that never went outside).
Total hen counts per day from the video decoding were converted to percentages of birds on the range simultaneously. These percentages were then averaged across all sampling times of day to provide average daily values for 26, 27 and 28 weeks of age for each stocking density. A GLM with repeated measures was used to compare the effect of sampling week and stocking density on the average percentage of hens out on the range. Where significant differences were present between stocking densities, Student’s t tests were applied to the least squares means with a Bonferroni correction applied to the α level to account for multiple post-hoc comparisons. Data from video decoding were also compiled graphically (only) to show the average percentages of hens out on the range within the three different range divides (front, middle, back) at each hour across the day, averaged across all sampling weeks, separately for each stocking density.
Results
All birds were in good visible health throughout the trial with flock-level mortality at 1%, no instances of feather loss (bar one bird with head feather loss at trial conclusion) and only five birds (n=3 RFID tagged, n=2 untagged) showed signs of footpad dermatitis.
Ground cover
Weekly photos taken of the range showed ground cover decreased from 100% to 0% coverage within 5 weeks in the 20 000 hens/ha ranges, within 6 weeks in the 10 000 hens/ha ranges, and only dropped as low at 20% in the 2000 hens/ha ranges by 8 weeks. Data collection occurred over the winter period where minimal pasture growth would be expected.
Range use
RFID tracking
Within all stocking densities combined, hours spent outdoors increased across trial duration (P<0.001, weeks 22 to 26: raw values mean 3.44±SE 0.03; weeks 27 to 31: 4.01±0.03; weeks 32 to 36: 4.20±0.03, Figure 3). Within each sample period, there were differences in the daily hours outdoors between individual hens within each replicate of each stocking density treatment (P<0.001) and differences between replicates within stocking densities (P<0.001).These differences in replicates might be expected given ranging changed across time and replicates were assessed separately. There were also differences between stocking densities with hens in the 2000 hens/ha density treatment spending more time outside than hens from both the 10 000 hens/ha and 20 000 hens/ha densities during weeks 22 to 26 (P<0.001, Figure 3). Within weeks 27 to 31 and weeks 32 to 36, hens from the 2000 hens/ha density spent the most time outdoors and hens from the 20 000 hens/ha density spent the least (P<0.001, Figure 3).
The average time (hours)±SE (of the raw values) spent outdoors per day for hens from the three stocking density treatments (2000, 10 000, 20 000 hens/ha) within the three sample periods (weeks 22 to 26, weeks 27 to 31 and weeks 32 to 36). Dissimilar letters indicate differences between stocking densities within sample weeks.

Across all stocking densities combined, the number of daily visits outdoors differed between sample weeks with the fewest visits during weeks 22 to 26 and the most visits during weeks 32 to 26 (P<0.001, weeks 22 to 26: raw values mean 11.39±SE 0.10; weeks 27 to 31: 12.30±0.10; weeks 32 to 36: 13.91±0.10, Figure 4). Within each sample period, there were differences in the number of daily visits between individual hens within each replicate of each stocking density treatment (P<0.001) and differences between replicates within stocking densities (P<0.001). There were also differences between stocking densities, with hens in the 2000 hens/ha density showing the most visits outdoors during weeks 22 to 26 (P<0.001, Figure 4). Within weeks 27 to 31, hens in the 2000 hens/ha densities showed the fewest visits outdoors (P<0.001, Figure 4). During weeks 32 to 36 hens from the 2000 hens/ha density showed the fewest visits outdoors and hens from the 20 000 hens/ha density the most (P<0.001, Figure 4).
The average number±SE (of the raw values) of daily visits outdoors by hens from the three stocking density treatments (2000, 10 000, 20 000 hens/ha) within the three sample periods (weeks 22 to 26, weeks 27 to 31 and weeks 32 to 36). Dissimilar letters indicate differences between stocking densities within sample weeks.

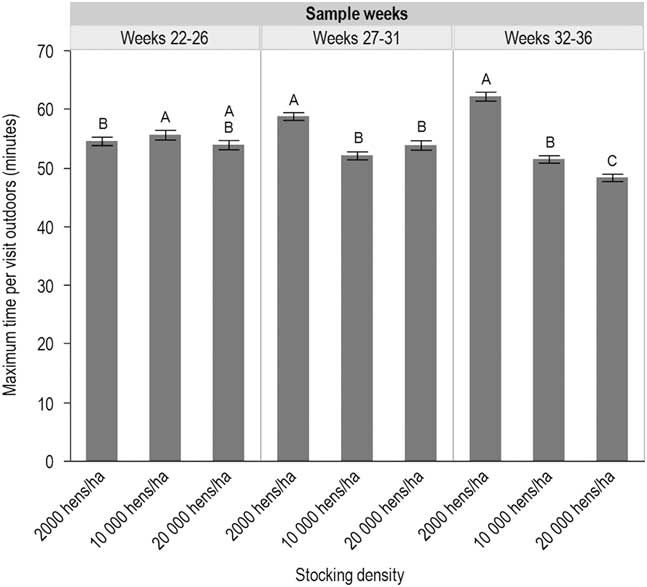
Across all stocking densities combined, the maximum time (minutes) per visit did not differ between sample weeks (P=0.29, Figure 5). Within each sample period, there were differences in the maximum time per visit between individual hens within each replicate of each stocking density treatment (P<0.001) and differences between replicates within stocking densities (P<0.001). There were also differences between stocking densities with hens in the 10 000 hens/ha density showing longer maximum times per visit than hens from the 2000 hens/ha density during weeks 22 to 26, but neither density group differed from the 20 000 hens/ha density (P<0.03, Figure 5). Within weeks 27 to 31, hens from the 2000 hens/ha density spent the longest time per visit outdoors (P<0.001) and within weeks 32 to 36, hens from the 2000 hens/ha density spent the longest time per visit outdoors and hens from the 20 000 hens/ha stocking density treatment spent the shortest (P<0.001, Figure 5).
The average maximum time (minutes)±SE (of the raw values) spent outdoors per visit for hens from the three stocking density treatments (2000, 10 000, 20 000 hens/ha) within the three sample periods (weeks 22 to 26, weeks 27 to 31 and weeks 32 to 36). Dissimilar letters indicate differences between stocking densities within sample weeks.
Within all stocking density treatments within all sampling periods the individual hens varied in the percentage of total available days they accessed the range (Figure 6), but there were no differences between stocking densities within each sampling period in the percentage of available days that individual hens accessed the range (all P⩾0.14, Figure 6). Across the trial duration, there was a very small percentage of hens from each density that never went outdoors (although most did trigger false readings on the RFID system indicating functional tags; all treatments: 2% of tagged hens) and a small percentage that visited the range on 1% to 10% of available days (2000 hens/ha: 1.3%; 10 000 hens/ha: 1.3%; 20 000 hens/ha: 6%) (Figure 6). However, there were a large proportion of hens that visited the range on a daily basis across the entire trial period (2000 hens/ha: 80.5%; 10 000 hens/ha: 66.5%; 20 000 hens/ha: 71.4%; Figure 6). Within all stocking densities combined, there were differences across the sampling periods with more hens using the range during the final 32 to 36 weeks sampling period (P<0.001, Figure 6).
The percentage of available days that individual hens from each of the three stocking density treatments (2000, 10 000, 20 000 hens/ha) accessed the range within the three sample periods (weeks 22 to 26, weeks 27 to 31 and weeks 32 to 36) where differences between sampling weeks are indicated by ‘*’.
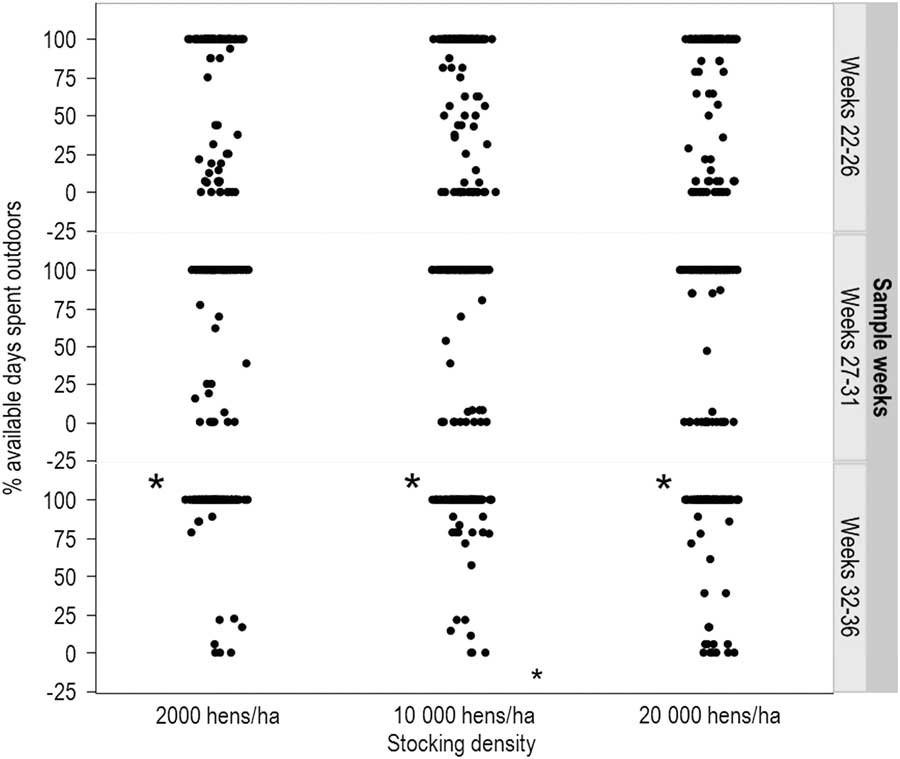
Finally, there were positive relationships within all stocking densities between average time spent outdoors and the percentage of available days the range was accessed (2000 hens/ha: r s =0.45, P<0.001; 10 000 hens/ha: r s =0.43, P<0.001; 20 000 hens/ha: r s =0.42, P<0.001).
Video observations
Total counts of all hens on the range at 26 to 28 weeks showed the highest percentage of hens used the range in the 2000 hens/ha stocking density and the lowest percentage of birds in the 20 000 hens/ha stocking density but neither of these densities differed from the 10 000 hens/ha density treatment (P<0.001, 2000 hens/ha: least squares mean (LSM) 48.87±SE 1.72; 10 000 hens/ha: 41.81±1.79, 20 000 hens/ha: 36.88±1.76). On average, less than half of the birds were on the range at any point in time within each stocking density (range of all individual sampling counts 2000 hens/ha: 2.67% to 78%; 10 000 hens/ha: 10% to 74.67%; 20 000 hens/ha: 2.67% to 64%). There tended to be an effect of sampling week (P=0.05) but no interaction between stocking density and sampling week (P=0.69). Hens within each stocking density used all areas of the range across all times of day (Figure 7).
The average percentage (±SE) of hens in different locations on the range (front, middle, back) for each stocking density treatment (2000, 10 000, 20 000 hens/ha) within each hour across the day from 0900 h until 1500 h. See Figure 2 for map of range delimitations.

Discussion
The RFID tracking of individual free-range laying hens housed with access to different-sized ranges that simulated three different outdoor stocking densities, showed a linear relationship between stocking density and range use through most of the trial. Hens housed in the lowest outdoor stocking density (2000 hens/ha), spent more time outdoors with fewer visits of longer maximum duration and hens housed at the highest stocking density spent less time outdoors with more visits of shorter duration. Within all stocking densities individual hens showed great variation in the percentage of days they accessed the range, including hens that never went outside and hens that used the range daily with on average, <50% of birds on the range simultaneously.
The average daily time outdoors of ~3 to 5 h across all densities (see Figure 3) is comparable with other studies of hens in wintergardens (covered ranges) showing either 2 to 8 h/day (Thurner and Wendl, Reference Thurner and Wendl2005) or on uncovered ranges showing between 3 h 25 min and 5 h 25 min/day outside (Thurner et al., Reference Thurner, Stefanie, Wiebke, Wendle and Preisinger2010), although these times were highly dependent on weather and season. Hens in the lowest stocking density may have spent longer outdoors as they had the greatest amount of space available to them, not just on a per bird basis (5 m2), but a larger-sized area overall (750 m2 compared with 150 or 75 m2) and, thus, the furthest available distance to travel within their range. Video observations did show hens used all areas of their ranges, including visiting the back portion of the largest-sized ranges. This contrasts with previous group-level direct observations in commercial flocks that showed hens preferred to remain in the areas close to the pop holes with almost no hens visiting the furthest 40% of the range (varying-sized ranges observed, Hegelund et al., Reference Hegelund, Sørensen, Kjaer and Kristensen2005). The smaller total area in the 20 000 hens/ha stocking densities may account for the higher number of shorter-duration visits shown by hens using these ranges.
Hens in the lowest stocking density alternatively, may have spent more time outdoors as they had greater space in which to fulfill their ethological needs such as foraging/scratching, walking, dust bathing and sun bathing. Kinematic analysis of space requirements of cage-housed hens showed a maximum average of 1913 cm2/hen is needed to perform the behaviour of wing-flapping, the stationary behaviour considered to require the most space in comparison with, for example, standing or turning around (Mench and Blatchford, Reference Mench and Blatchford2014). Another study looking at space requirements between small groups of hens concluded anything <5000 cm2 (the space provided by the highest stocking density at 0.5 m2/hen) imposed a restriction on free expression of behaviour by individual hens, such as walking or ground-pecking (Savory et al., Reference Savory, Jack and Sandilands2006).These space requirements for the individual hen were either matched or exceeded by all the stocking density treatments in this study at hypothetical maximum capacity, suggesting sufficient space for free behavioural expression. However, similar to other studies (Thurner and Wendl, Reference Thurner and Wendl2005; Gilani et al., Reference Gilani, Knowles and Nicol2014) on average, less than half of the hens in each pen were on the range simultaneously, highlighting the dynamic environment of the free-range system and how both indoor and outdoor stocking densities change throughout the day. Thus, a stocking density of 2000 hens/ha, with 5 m2 per individual bird at 100% range occupancy, is an underestimate of the actual space available to individual hens in this study that attracted them to use the range for longer periods and vice versa for the highest stocking density.
In addition to more space, the outdoor range provided resources not available indoors (sun, insects, grass, etc.) but food, water, perches, nest boxes and shelter were resources present indoors only, accompanied by less space available per hen, litter build-up, dimmer lighting and fan-ventilation, etc. Thus, it may be difficult to differentiate the attraction of the range itself, v. avoiding unappealing indoor conditions (Whay et al., Reference Whay, Main, Green, Heaven, Howell, Morgan, Pearson and Webster2007) and whether the choice between indoors and outdoors is dictated by different resources, available space, or different environmental conditions. In this study, all indoor conditions were kept equal with resources set to or exceeding the current model standards, but competition may have restricted resource access to some hens and, thus, they preferred to remain indoors to, for example, feed unrestrictedly as other birds moved outside. In addition, the motivation to fulfil certain behavioural needs may vary between individuals (Weeks and Nicol, Reference Weeks and Nicol2006) thus increasing or reducing the attractiveness of varying resources provided by the free-range system (e.g. dust bathing outside in dirt; perch access indoors). Further studies could compare behaviours performed both indoors and outdoors by all hens to determine the value of the range in meeting ethological needs.
The longer time spent on the range in the lowest stocking density may have been partially related to the ground coverage as vegetation did not disappear completely as within the ranges of the other two densities. Previous observations in free-range systems showed hens spent more time walking and foraging on grass over gravel (Gebhardt-Henrich et al., Reference Gebhardt-Henrich, Toscano and Fröhlich2014), of which foraging in red junglefowl will take up 60% of their daylight time budget (Dawkins, Reference Dawkins1989). However, differences in range use between the 10 000 hens/ha and 20 000 hens/ha densities which both lost all vegetation indicate ground coverage is not the only factor influencing range usage. Current range stocking density requirements within the Australian Model Code of Practice for the Welfare of Animals – Domestic Poultry (Primary Industries Standing Committee, 2002) do stipulate range rotation is required as stocking densities increase over 1500 hens/ha. In this trial it was noted that as the ground cover depleted, the hens scratched out dust bathing pits in the dry dirt throughout all ranges. Further research could compare how behavioural time budgets of hens may change across the course of range ground-cover denudation.
Range usage increased across the observed lay period both in terms of hours spent outside, and the proportion of birds visiting the range on a daily basis. Differences between stocking densities also increased, suggesting further distinction between treatment groups may have been observed towards the end of the lay cycle or that different range-use patterns may be observed in different seasons (Pettersson et al., Reference Pettersson, Freire and Nicol2016). In addition, different strains of hens may vary in time spent outdoors and/or use of different range areas (Mahboub et al., Reference Mahboub, Müller and van Borell2004).
Determining the space requirements and optimal stocking densities of hens is intertwined with flock size and enclosure size. Several previous studies documented an inverse relationship between range use and flock size, in flocks ranging from a few hundred to several thousand hens (e.g. Bubier and Bradshaw, Reference Bubier and Bradshaw1998; Harlander-Matauschek et al., Reference Harlander-Matauschek, Felsenstein, Niebuhr and Troxier2001; Gebhardt-Henrich et al., Reference Gebhardt-Henrich, Toscano and Fröhlich2014), even with equal stocking densities (Whay et al., Reference Whay, Main, Green, Heaven, Howell, Morgan, Pearson and Webster2007). Thus, we may expect that a group of 150 hens stocked at 20 000 hens/ha would differ in range use from a group of 20 000 hens on a hectare. Studies with broilers have looked to isolate the different effects of flock size, group size and density on space utilisation, showing that nearest-neighbour distances were constrained by density but broilers adapted to increasing enclosure size by using all available area with no effects of group size (Leone and Estevez, Reference Leone and Estevez2008; Leone et al., Reference Leone, Christman, Douglass and Estevez2010). Larger flock size in laying hens has been shown to reduce aggression, possibly via hens abandoning hierarchical formations (Nicol et al., Reference Nicol, Gregory, Knowles, Parkman and Wilkins1999) but as yet there are no data on the social effects of range use, whether individual hens access the range in the same groups and how this social facilitation and/or range space utilisation outdoors may be impacted by flock size. It is also possible that the use of all areas in the ranges in this study were influenced by other hens as barriers between ranges were transparent. In addition, there are few data on the impact of enclosure shape on range use and whether different range shapes as per this study, including placement of vertical fences may modulate ranging behaviour (Rault et al., Reference Rault, van de Wouw and Hemsworth2013).
Overall, stocking density treatment impacted range usage with hens from the lowest stocking density (2000 hens/ha) accessing the range for longer each day and hens from the highest stocking density (20 000 hens/ha) spending the least time outdoors. Range use varied across individual hens from all treatments with the majority of hens accessing the range daily, and a small percentage never venturing outdoors. This choice of environments, irrespective of whether birds go outdoors or remain indoors, may have a positive welfare impact on hens (Nicol et al., Reference Nicol, Caplen, Edgar and Browne2009). Further research should aim to correlate ranging with individual hen welfare parameters to determine whether there is a minimum amount of time a hen should spend outside and what the negative impacts (if any) of not ranging are, for optimal design of free-range environments that improve hen welfare.
Acknowledgements
This research was conducted within the Poultry CRC, grant 1.5.6, established and supported under the Australian Government’s Cooperative Research Centres Program. L. Warin was supported by a Universities Federation for Animal Welfare Small Project and Travel Award. The authors thank Sue Belson, Jonathan Campbell, Grahame Chaffey, Mandy Choice, Andrew Cohen-Barnhouse, Bradley Dawson, Troy Kalinowski, Jim Lea, Barry Lockwood, Greg Mills, Dominic Niemeyer, Hélène Pecourt, Mark Porter, Samantha Robinson, Varun Uthappa and Lindsay Wittig for technical assistance and advice. Thank-you to anonymous reviewers for their comments that improved earlier versions of this manuscript.



