


1. Introduction
1.1. Bering Glacier surges
In late spring 2011, Bering Glacier, the largest and longest glacier in North America, started to show definite signs of a surge, which is a sudden acceleration of the glacier to 100 times or more of its normal velocity and an event that happens only every 25 years in a quasi-cyclic and unpredictable time pattern. Heavy crevassing indicative of sudden deformation, horizontal and vertical displacement of ice and sudden changes in the englacial hydrologic system are characteristic of a surge. Understanding rapid glacier movement is essential to understanding changes in the cryosphere and in the Arctic system, and this event provides a rare opportunity for research on exemplary processes of ice acceleration.
Bering Glacier last surged in 1993–95 (Reference Lingle, Post, Herzfeld, Molnia, Krimmel and RoushLingle and others, 1993; Reference Molnia and PostMolnia and Post, 1995; Reference Herzfeld and MayerHerzfeld and Mayer, 1997; Reference HerzfeldHerzfeld, 1998; Reference Mayer and HerzfeldMayer and Herzfeld, 2000; Reference Shuchman and JosbergerShuchman and Josberger, 2010; see also Reference PostPost, 1972; Reference MolniaMolnia, 2001, Reference Molnia, Williams and Ferrigno2008). The current surge was preceded by a weak surge-type acceleration which started in 2008 and stopped in the same year. In 2009, no surge dynamics were observed, and in 2010 no observations were made (personal communication from B. Molnia, 2011). In early 2011, Bering Glacier’s dynamics suddenly changed to those of a full-scale surge, with deformations and dynamics different than during the previous surge.
1.2. Elevation changes and crevassing during the surge process
The dynamics of a surge-type glacier change over a quasi-cyclic pattern which includes a long quiescent phase of normal flow and a short surge phase of fast flow. A surge glacier builds up ice in a reservoir area during the quiescent phase of the surge; this ice is then rapidly released during the surge phase. In consequence, drastic elevation changes occur during the surge phase, including rapid thinning in the former reservoir area, drawdown along the margins of the glacier and thickening in the receiving area downstream of the reservoir area (e.g. Reference Meier and PostMeier and Post, 1969; Reference FowlerFowler, 1987, Reference Fowler1989; Reference RaymondRaymond, 1987; Reference Harrison and PostHarrison and Post, 2003). Hydrological processes in the glacier play a large role, but the specific englacial water processes are only rudimentarily understood (Reference Humphrey, Raymond and HarrisonHumphrey and others, 1986; Reference KambKamb, 1987). The kinematic wave associated with the surge propagates upstream and downstream, causing heavy crevassing that is characteristic of the rapid, brittle deformation. In this paper, we investigate the large-scale elevation changes and the small-scale surface elevation and elevation-change characteristics as a means to understand the surge. With this objective in mind, airborne laser altimeter data were collected along several profiles over Bering Glacier in September 2011.
2. Approach
Much of the research on surges is based on a few case studies of mostly smaller glaciers, such as Variegated Glacier, Alaska, observed during its 1982/83 surge (e.g. Reference PostPost, 1960; Reference KambKamb and others, 1985; Reference Humphrey, Raymond and HarrisonHumphrey and others, 1986; Reference RaymondRaymond, 1987) and Trapridge Glacier, Yukon (Reference Clarke, Collins and ThompsonClarke and others, 1984, and many later studies), which are easier to equip with geophysical instrumentation but behave differently than large glaciers. Reference Meier and PostMeier and Post (1969) distinguished three types of surging glaciers: (1) large-sized with high surge velocities, large displacement and large lowering of ice reservoir, (2) large-sized with low surge velocities and small vertical and horizontal ice displacement, and (3) steep, small glaciers with small reservoir lowering and ice displacement. Bering Glacier is a prototype of a large surge-type glacier of type 1, whose size is comparable to large fast-moving ice streams in Greenland, which individually play a role in understanding ice-sheet stability and discharge into the ocean. Observing and analyzing surge stages in a large glacier requires a different method than measurement of geophysical properties on the ice, which is impractical. The approach used here is a form of automated spatial analysis of airborne remote-sensing data, which includes automated image analysis, GPS data analysis and analysis of elevation data. The analysis progresses by application of a classification based on a set of spatial parameters that together capture components of the dynamics of surge progression.
Analysis of altimeter data allows elevation changes to be derived which document the mass transfer from the reservoir area to the receiving area. In addition to the large-scale elevation changes, high-resolution altimeter data also capture changes in small-scale topography associated with characteristic crevassing. The latter are needed as they contain the vertical component in deformation matrices or tensors describing deformation, crevassing and generally small-scale kinematics associated with the surge (Reference Herzfeld, Clarke, Mayer and GreveHerzfeld and others, 2004). The analysis of elevation changes and classification of crevassed ice surfaces forms a central part of this paper.
3. Observations
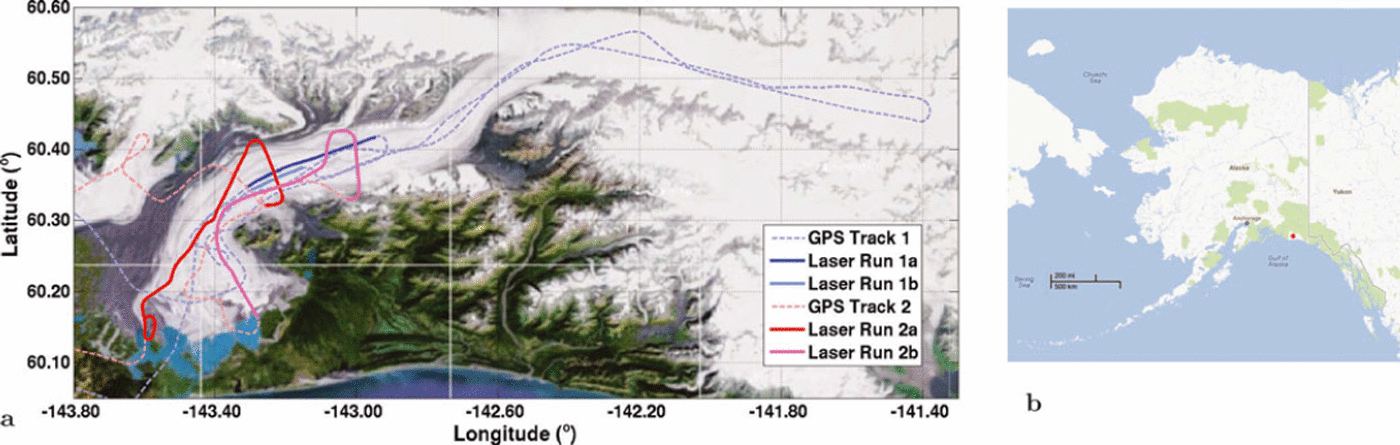
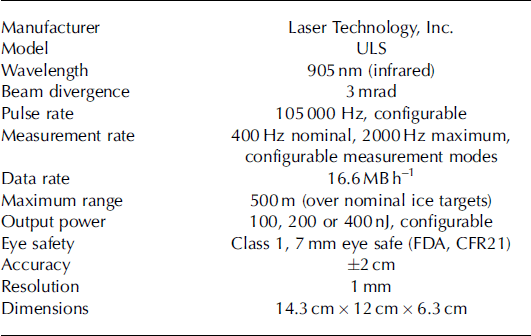
During an aerial observation campaign in September/October 2011, the following data were collected: (1) digital photographic data, (2) digital video data, (3) GPS data and (4) laser altimeter data (see Fig. 1). Flyable weather permitted geophysical observations on 25 September (flight 1) and 26 September (flight 2) 2011. Laser altimeter data were collected with a lightweight laser altimeter operating at 905 nm (near-infrared) wavelength with 400 Hz data collection rate. The instrument is a single-beam nadir-pointing Laser Technology, Inc., Universal Laser System (ULS) rangefinder that is used to measure the distance from the aircraft to the ground surface. The instrument also measures laser pulse return power. Beam divergence is 3 mrad (30 cm diameter footprint at 100 m range). The ULS collects surface topography measurements at 400 Hz (derived from 4000 Hz system-internal measurements ), corresponding to a 7.5 cm along-track sample spacing when flown at 30 m s–1, and has a 60 cm footprint when flown at 200 m above ground level. Accuracy of the instrument is 2 cm according to manufacturer’s specifications, and measurement error (observed standard deviation of measurements over a known, flat surface) is 0.6 cm (Reference Crocker, Maslanik, Palo, Adler, Herzfeld and EmeryCrocker and others, 2011; Table 1).
Location and flight paths of data collection campaign over Bering Glacier, Steller Glacier and Bagley Ice Valley, September 2011. (a) Location and data collection: Bering Glacier is the glacier that calves into a series of proglacial lakes near 60.158 N, –143.58 E; Steller Glacier is west of Bering Glacier; Bagley Ice Valley is seen in the northern part of the map. Data collected over tracks marked ‘GPS’ are digital photographic data, digital video data and GPS data. Over tracks marked as laser runs, laser data were collected in addition to photographic, video and GPS data. Tracks indexed 1 were observed on 25 September 2011, tracks indexed 2 on 26 September 2011. (b) Location of Bering Glacier, Alaska (terminal lobe marked by red dot).
Universal Laser System (ULS) specifications
To meet the rapid time constraints of observing the surge, altimeter data were collected by simply holding the altimeter out of the plane secured to an outstretched arm of the scientist holding it, pointing at approximately nadir. During operation, the ULS and a GPS unit were connected to a laptop computer (a MacBook), and laser measurements and GPS times were co-registered. In post-processing, altimeter measurements were corrected by GPS positions (aircraft positions). The same laser system was previously used as part of an integrated system on manned and unmanned aircraft over glaciers and sea ice (Reference Crocker, Maslanik, Palo, Adler, Herzfeld and EmeryCrocker and others, 2011). Because mounting an instrument outside a plane requires the approval of the US Federal Aviation Administration (FAA), in addition to longer-term coordination with the flight service, hand-held operation was the only option to collect such data during the rapidly evolving surge. However, this simple method worked surprisingly well, as the following analysis will demonstrate. Individual crevasses are visible and different crevasse provinces can be identified in the data. Maximal crevasse depth resolved is almost 60 m (Figs 1 and 2).
Crevasse profiles and and ice-surface profiles observed during Bering Glacier surge, 25 September 2011. Laser altimeter data, corrected with GPS data. (a, b) Overview (a) and close-up (b) of location of examples shown in (c–e). (c–e) Elevation vs along-track distance; aspect ratio 5 : 1 . Blue: data points; red: piecewise linear interpolation. (c) Area 4a (note two different surface provinces separated by a 60 m deep rift; see Fig. 3) (flight 1 , laser run 1a, 25 September 2011); (d) area 3a (flight 1 , laser run 1b, 25 September 2011); and (e) area 1a2 (flight 1 , laser run 1b, 25 September 2011).

In flight 1 , laser data were collected in two along-flow profiles, from a cross-flow line connecting Khittrov Hills and Grindle Hills to a cross-flow line at Point 3687 in central Bering Glacier (laser run 1a), with a second line to validate the method (laser run 1b). In flight 2, longer tracks were flown in lower and central Bering Glacier, including Tashalich arm, the main lobus and two profiles approximately normal to the flowline (Fig. 1). The cross-flow profiles were repeated offset such that videos and photographs of the same locations could be obtained. A total of 141.48 km of laser altimeter data were collected (23.2 km in flight 1 , run 1a; 8.7 km in flight 1 , run 1b; 55.8 km in flight 2, run 2a; 53.78 km in flight 2, run 2b). Laser data used in the following analysis were corrected using GPS data collected at the same time.
Figure 2 gives examples of laser-altimeter profile sections, which indicate (1) that different structural provinces can be distinguished, (2) that the laser beam reaches into the crevasses, so that crevasse depth can be measured, and (3)0that laser points are sufficiently dense on the ground to capture the ice surface morphology, including roundedness of crevasse edges and small surface features between major crevasses. These principal properties of the data facilitate the analyses in this paper. Prior to the analyses, we introduce the originally geological concept of a structural province (Section 4) and the methodological concept of mathematical characterization and classification for discrimination of structural provinces (Section 5). The following elevation data analysis has three parts: First, we analyze the first-order variables that have long been of interest to glaciologists and mountaineers, namely average and maximal crevasse depth and average crevasse spacing (Section 6). Second, we derive characteristic parameters for crevasse provinces (Section 7). Third, absolute elevation changes are calculated from 2010 and 2011 data (Section 8).
4. Structural Glaciological Provinces
The principal concept is that the dynamics of fast-moving ice manifest themselves in crevassing, and consequently the deformation history of the ice can be reconstructed by analysis of crevasse patterns (Reference Herzfeld and MayerHerzfeld and Mayer, 1997; Reference HerzfeldHerzfeld, 1998). Crevassing is a form of brittle deformation that occurs when local forces exceed a threshold. Examples of deformation include extension, compression and shear. A structural province is an area that is homogeneous with respect to structural glaciologic properties (properties caused by deformation) and that is maximal (i.e. any larger area would contain a second structural glaciologic type and hence be inhomogeneous). Examples of structural provinces are seen in Figure 3: a large rift separates two structural provinces, a crevasse field of rhombic crevasses and a region that is almost uncrevassed, where older, closed crevasses dominate. The rift is most likely the result of shear. The field of rhombic crevasses to the north of the rift is resultant of shear and extension caused by surge kinematics, whereas the surge has only marginally affected the area south of the rift.
Rift and adjacent crevasse provinces, Bering Glacier, 25 September 2011. Photograph by U.C. Herzfeld. The laser profile given in Figure 2c and analyzed in Figures 6 (classification parameters) and 7 (typical variograms of structural provinces) crosses the rift at a location shown just below the middle of the photo at a small angle, where the rift appeared deepest; flight direction is from the heavily crevassed region in the north to the almost uncrevassed region south of the rift (viewers near-field), where a few small crevasses exist near the rift (only). Approximate location of flight path shown in yellow.

Structural geologic principles provide links between dynamics, kinematics and deformation, which can be physically formalized and quantified using continuum mechanics (Reference MeansMeans, 1976; Reference SuppeSuppe, 1985; Reference Twiss and MooresTwiss and Moores, 1992; Reference Ramsay and LisleRamsay and Lisle, 2000; Reference LiuLiu, 2002; Reference GreveGreve, 2003). Use of crevasse patterns as a source of geophysical information in an objective and automated approach was first applied in analysis of image data (video data) from the 1993–95 surge (Reference HerzfeldHerzfeld, 1998; Reference Herzfeld and ZahnerHerzfeld and Zahner, 2001). This approach leads to classification of surge-crevasse types correctly in 95% of all cases and allows association of deformation characteristics to specific images (Reference Herzfeld and ZahnerHerzfeld and Zahner, 2001). Applications of the method facilitate mapping of deformation provinces in surging and continuously fast-moving glaciers (Reference Herzfeld and MayerHerzfeld and Mayer, 1997; Reference HerzfeldHerzfeld, 1998; Reference Herzfeld, Mayer, Feller and MimlerHerzfeld and others, 2000; Reference Mayer and HerzfeldMayer and Herzfeld, 2000, Reference Mayer and Herzfeld2001, Reference Mayer and Herzfeld2008; Reference Herzfeld and ZahnerHerzfeld and Zahner, 2001; cf. Reference Vornberger and WhillansVornberger and Whillans, 1990; Reference Marmo and WilsonMarmo and Wilson, 1998; Reference RistRist and others, 1999).
However, the analysis is based on two-dimensional data (imagery), which provide mathematical information for derivation of deformation matrices in two dimensions, as described in theory in Reference Herzfeld, Clarke, Mayer and GreveHerzfeld and others (2004). In this paper, we utilize high-resolution laser profilometer data to explore the third dimension. For example, laser altimeter data of the rift and its neighboring provinces are seen in Figure 2c.
The analysis in this paper focuses on crevasses induced by surge kinematics. As is well known, in any glacier, crevasses form induced by topography of the glacier bed and margins. The interaction between surge forces and preexisting topographically induced crevasses is discussed by Reference Herzfeld and MayerHerzfeld and Mayer (1997) and Reference HerzfeldHerzfeld (1998).
5. Methodological Concept: Mathematical Characterization and Classification for Discrimination of Structural Provinces
The analysis of laser altimeter data is based on an approach that quantitatively relates parameters derived from elevation profiles to structural glaciological provinces. In this section, we introduce the concepts connecting observations and attribution of glacial change. These mathematical principles are summarized in the geostatistical classification method (Reference HerzfeldHerzfeld, 2008). For the surge application we include the additional parameter of roundedness of crevasse edges, as surge crevasses are typically clear-cut because of the sudden occurrence in a single deformation event (Reference Lingle, Post, Herzfeld, Molnia, Krimmel and RoushLingle and others, 1993; Reference HerzfeldHerzfeld, 1998).
The objective of this paper is to present laser altimeter data collected during the current (2011) surge of Bering Glacier and to demonstrate how these laser altimeter data can be used in a systematic way to understand certain quantitative aspects of the surge process. The approach combines two methods, (1) elevation change determination and (2) spatial classification–characterization of crevasse properties, and hence covers large (in 1) and small (in 2) spatial scales, as well as a classic quantitative method (in 1) and (in 2) a new method that is being developed specifically for analysis of crevasse formation during a surge.
For a glacier, the classification has three components: (1) characterization, (2) classification and (3) segmentation. The objective of mathematical characterization is to determine a set of parameters that uniquely describe an object. The objective of classification is to associate a given object to one of a number of classes; so that the class association can be carried out for each case automatically, a rest class is required to collect all objects that do not belong to any of the characteristic classes. In each new application, the characterization problem must be mastered before the classification problem. By moving a classification operator over a large spatial dataset (e.g. an image), each window is associated to a class, and a segmentation may be achieved. A segmentation into reasonably coherent subsets or segments may require smoothing; however, in a good classification this is not necessary (for examples and details see Reference Herzfeld and HigginsonHerzfeld and Higginson, 1996). The characterization–classification approach stems from a family of methods derived to address the general problem of retrieving hidden, overprinted or secondary information from spatial data (Reference HerzfeldHerz-feld, 2008) and is adapted here to analyze laser altimeter data with the objective of understanding crevasse formation and surge progression. The mathematical principles are given in the Appendix.
Related to the surge phenomenon, the characterization is applied to uniquely describe (mathematically characterize) crevasse types that occur during typical surge stages. Applied to laser data, we expect to answer questions such as: Does crevasse depth increase during the surge? How does transport of crevasses affect spacing and depth of surge crevasses? Can crevasse depth and crevasse significance be used to discriminate two different generations of crevasse opening (as occurs when a new kinematic wave affects a previously crevassed area)? Can we distinguish surge crevassing that affects previously smooth ice from surge crevassing that affects previously crevassed ice? In this paper, we demonstrate the principles of this type of analysis and show that characteristic parameters can be derived. To this end, we establish links between crevasse types and associated parameters based on laser altimeter data.
The approach links the crevasse classes to their position in the surge. To demonstrate this, we select two topics: (a) the region of a large rift that separates two flow regimes and (b) the position of crevasse types relative to the bulge and the front of the surge (from synopsis of crevasse types and elevation change analysis).
Once the characterization is established, an automated classification can be computationally implemented and carried out. For example, an automated classification algorithm can be presented with a new section of laser data of a surge glacier and associate a crevasse type. The third step is the application of the automated classification to a dataset that covers the entire glacier (or a sufficiently dense grid of tracks), to map deformation provinces. (Such a dataset does not exist currently.) A map of deformation provinces gives the state of the surge at one point in time. Notably, only one set of data collected at one point in time is required for analysis (not two, as is the case with interferometry or elevation-change detection or derivation of velocity from image data (Reference Herzfeld and MayerHerzfeld and Mayer, 1997)). In this paper, the characterization is carried out. We present the data and a proof of concept for the overall mapping segmentation, along with applied results that follow directly from the characterization step. Then we combine that with results from the elevation-change analysis.
6. Crevasse Depth and Crevasse Spacing
Previously, glaciologists believed maximal crevasse depth in any glacier is 30 m, but much larger depths can be reached. The rift shown in Figure 3 has a depth of ^ 6 0 m (Fig. 2). This is the maximal depth observed in the collected lidar profiles, which cover only a small subset of the ice surface. However, the rift is the most prominent crevasse feature that existed during the time of survey and visually appeared to have the largest depth of any open crevasse.
Results of along-track calculation of (1) maximal crevasse depth, (2) average crevasse depth, (3) average crevasse spacing and (4) mean curvature of crevasse edges are shown in Figure 4; all calculations are taken over a 500m along-track window. Data analysis is based on laser altimeter data that have been GPS-corrected for geolocation (elevation, position corrected by plane altimetry and position).
Depth and spacing of crevasses and curvature of crevasse edges, derived from laser profilometer data collected during Bering Glacier surge, 25 and 26 September 2011. Parameters calculated from GPS-corrected laser altimeter data in 100m along-track windows. White interpolation of flight track indicates that the crevasse parameters could not be determined, because no crevasses exist within a 100 m along-track window. Superimposed on Google image for approximate reference. Image collected before the surge. (a) Maximum crevasse depth (m); (b) average crevasse depth (m); (c) average crevasse spacing (m); and (d) average curvature (m–1) of crevasse edges, used as a measure of age of crevasses since formation (for definition see Section 7.1).

Average crevasse depth ranges from 2 to 54 m depending on the crevasse provinces (Fig. 4b). Average crevasse spacing is typically 20-30m and reaches 100m in some crevasse fields. Spacing of crevasses is evaluated along-track and hence provides a relative measure for near-straight segments; actual spacing is less than or equal to the value shown here. This value is best used in combination with image analysis.
Maximal crevasse depth varies across the surveyed area, but appears to be associated with crevasse provinces, i.e. depth values are similar for a given length of track, then change to another value. Average track depth suggests the same hypothesis, but overall shows more variability than maximal depth. The hypothesis is investigated in the following.
7. Characteristic Parameters of Crevasse Provinces
Two types of parameters are used: (1) curvature or roundedness of crevasse edges and (2) geostatistical classification parameters. Geostatistical classification parameters are defined in the Appendix.
7.1. Roundedness as an indicator of crevasse age and surge progression
The motivation of this part of the analysis is the observation that surge crevasses open suddenly, as the surge wave hits a given location, resulting in characteristic sharp edges. This is well documented in many observations of the 1993–95 surge (Reference Lingle, Post, Herzfeld, Molnia, Krimmel and RoushLingle and others, 1993; Reference Herzfeld and MayerHerzfeld and Mayer, 1997; Reference HerzfeldHerzfeld, 1998). In contrast, crevasse fields surveyed with laser altimetry in the lower and central Bering Glacier formed several weeks/months before our survey. Melting and additional snowfall cause rounding of the crevasse edges. The high vertical accuracy and spatial density of the crevasse observations permit quantification of roundedness, as performed in the following analysis.
The roundedness algorithm includes the following steps: (1) discrimination of crevasse interior (A) and ice surface outside of crevasses (B) as two domains, (2) identification of the bottom of crevasses, (3) identification of the start of the crevasse edge, (4) interpolation of surface outside of crevasses, (5) calculation of differences between (A) and (B) as crevasse depth, (6) identification of the convex region in the profile, starting at the crevasse edge identified in (3) (using the edge that is located after the crevasse in observation time), (7) fitting of a circle to the convex region and (8) calculation of the radius r of the circle. (9) Curvature is defined as 1/r, i.e. larger curvature values indicate fresher crevasses. The method is illustrated for area 3A in Figure 5.

This algorithm has been applied to all laser data collected during our campaign. The result is shown in Figure 4d. Notably, curvature values in crossover locations of tracks match. A concentration of crevasses with more rounded edges is observed at 60.3–60.358 N, 143.4–143.358 W (reservoir area), over the Khittrov crevasse field at approximately (60.278 N, 143.458W) and in Tashalich arm (near (60.28 N, 143.558 W)). The surge started in the reservoir area and reached the front in Tashalich arm soon after that. The elevation change analysis for these areas is given in Section 8. The Khittrov crevasse field is characterized by wide open crevasses and fallen seracs. The curvature analysis holds potential for systematic full surveys and repeat surveys.
7.2. Geostatistical classification parameters for discrimination of crevasse types
Geostatistical classification uses parameters proven to characterize spatial surface roughness and spatial surface properties in a summarizing manner (Reference HerzfeldHerzfeld, 2008). Parameters are derived from vario functions and residual vario functions, as described in the Appendix. Here we employ the parameters pond (overall surface roughness), p1 (significance, absolute size), p2 (significance, relative value) and mindist. In the crevasse analysis, the mindist parameter yields the average spacing of crevasses in a homogeneous area (a subarea of a structural province). To demonstrate the approach, laser data from the area of the rift and the two adjacent provinces are analyzed.
Comparison of the panels in Figure 6 indicates that differences between the vario function and the residual vario function do not affect the parameters much. This means that the elevation trend over the window sizes investigated (200m) is small compared to the crevasse structure. To simplify the text, we base the following interpretation on the parameters from the residual vario function, but use parameters from both the vario and the residual vario function in the characterization in Figure 6. The two parameters, pondres and p1res allow the classification of three structural provinces: (1) the heavily crevassed region to the left (north) of the rift, (2) the rift itself and (3) the area of low-relief surface microtopography to the right (south of the rift). The latter may be an area of closed old crevasses (non-surge) and surface melt features that is in the early stages of being affected by rhombic surge crevasses (see Fig. 3). A deterministic characterization of the three main provinces is possible using only two or three components. Based on first analysis of the parameter plots in Figure 6, the rift separates two different flow regimes. A simple statistical cluster analysis, based on geostatistical parameters pond, p1 and mindist and using the centroid method for clustering and automatically searching for two clusters, confirms that the provinces separated by the rift can be automatically discriminated using this approach.
Geostatistical classification parameters calculated from laser altimeter data for the region of the rift. Top panel shows laser altimeter profile. Next two panels show classification parameters derived from vario functions: red – pond; blue – p1; green – p2; black – mindist. Bottom two panels show classification parameters derived from residual vario functions: red – pond; blue – p1; green – p2; black – mindist. Parameters calculated for windows of 200 m, maximum vario function lag 150 m, windows offset by 10 m, resulting in a feature vector every 10 m. Parameters are plotted as relative values (ratio of actual parameter value and maximum parameter value in the set). All values are location-referenced to along-track distance, geographic latitude and longitude and also to Universal Transverse Mercator (UTM) north and east. Vertical lines indicate structural provinces and sub-provinces, based on visually aided analysis of the feature vectors composed of classification parameters.

However, a visual interpretation of the parameter plots in Figure 6 suggests that province 1, the crevassed region north of the rift, can be subdivided into five sub-provinces (1a, 1b, 1c, 1d, 1e ordered in along-track direction), which is not obvious from visual interpretation of the photograph in Figure 3. To refine the classification, it is useful to introduce the concept of a feature vector, with vector elements v = (pond(var),p1(var), p2(var), mindist(var),pond(res), p1 (res), p2(res), mindist(res)) for each of the four parameters, derived for two types of vario functions. We consider the variograms (vario-function graphs) from which the parameter plots are calculated (Fig. 7) as a means for a more detailed analysis, as well as a demonstration of the functionality of the characterization-classification method.
Variograms for sections of rift-traverse profile. A typical variogram is given for each province and sub-province of the rift-traverse profile, identified in Figure 6. Difference between vario-gram (blue) and residual variogram (green) quantifies amount of drift. Variograms are calculated for 200 m windows, offset by 10 m in along-track direction for the entire profile section shown in top panel of Figure 6, using a unit lag of 2 m and a maximum lag of 150m (75 points, 75% of window size). Every fifth variogram is numbered. Variogram labels (variogram number - along-track distance) allow the variograms shown here to be matched with along-track distance of the profile shown in top panel of Figure 6 and geostatistical classification parameters shown in Figure 6.

As a first step, the difference between the variograms and the residual variograms in Figure 7 is a means to check for second-order stationarity of surface. The variogram is always larger than or equal to the residual variogram (see Eqn (A3) in the Appendix). Figure 7g (variogram 46) has the typical shape of a transitional variogram, with low values indicative of good spatial correlation for short distances, increasing to higher values until a sill is reached (sill value 0.6 m2 for res and 0.75 for var), indicative of degrading correlation with increasing separation of points. The variogram can increase steeply after a given distance, while in this case the residual variogram gives the characteristic pond value. As seen in Figure 6, the pond parameter is low for the non-crevassed area (but there are some surface features, i.e. the surface is not entirely smooth). The low value of parameter p1 tells us that there are no significant crevasses. In region 2 of the rift, the highest pond values of the entire laser data section are encountered; a typical variogram is given in Figure 7f (variogram 34); p1 is also high, because a large crevasse (the rift) dominates (high pond, high p1).
Provinces 1, 2 and 3 can be discriminated based on parameters pond and p1: for province 3, use pond less than 10 (in the absolute values), p1 less than 0.01 (in the relative values in Fig. 6); for the rift (region 2), pondis larger than 200; for the crevassed region (1), pond is between 0.01 and 200.
To refine the classification of province 1 into sub-provinces, a variogram is analyzed for each sub-province. For example, sub-province 1e has low values of p1, pond and p2 (not many deep and significant crevasses). Section 1d (Fig. 7d, variogram 23) has a pond value of 100-180 (second-highest to the rift) but also a high p2 value, which indicates the presence of a mix of large crevasses with (a different generation of) less deep, but relatively significant crevasses in between (p2 is the relative-significance parameter; see Appendix). We conclude that sharp surge-type crevasses formed here. This is validated by a look at the photograph (Fig. 3) and the crevasse-edge curvature analysis (Fig. 4d). Variogram 18 (Fig. 7c) shows sets of three small crevasses in each group of large crevasses, but the small crevasses are not relatively significant (and hence probably older); this is characterized by a low p2 value and low pond (50) and p1. Figures 7a (variogram 2) and 8b (variogram 9) show that sub-provinces 1a and 1b can be discriminated based on parameters mindist (average crevasse spacing) and p2, while p1 and pond are similar for 1a and 1b.
In summary, the analysis demonstrates that the classes can be discriminated deterministically. To implement an automated classification, a powerful class association method needs to be selected; an example is the connec-tionist–geostatistical method (Reference Herzfeld and ZahnerHerzfeld and Zahner, 2001).
7.3. Interpretation I: the rift
The analysis in the previous subsections objectively shows that the rift separates two different structural provinces and hence two entirely different flow regimes. The question arises, what causes the rift? Visual observation and analysis of video and photographic imagery tells us that the rift is a unique feature in the Bering Glacier–Bagley Icefield system. It is also the deepest crevasse (in our dataset, see the red pixel indicating largest crevasse depth in Fig. 4a). Analysis of satellite imagery and photographic material collected during observation flights shows that no similar rift or large crevasse exists. The mathematical characterization indicates that the rift impedes the progression of surge kinematics and causes longitudinal separation of forces in this area. In conclusion, different flow regimes exist on either side of the rift. This motivates the hypothesis that the rift is caused by the morphology of the glacier bed, such as a ridge between two large channels. Bed topographic data (Reference Conway, Smith, Vaswani, Matsuoka, Rignot and ClausConway and others, 2009) suggest that the bed of Bering Glacier has at least two channels in some places, but the data coverage is extremely spurious. Bed topography can influence and inhibit the spatio-temporal progression of the surge in a large complex glacier. Observations during the 1993–95 surge did not reveal a similar rift (Reference HerzfeldHerzfeld, 1998). Therefore the rift appears to be a key feature in understanding the current surge. An alternative explanation could be the existence of a side glacier entering the main Bering trunk. There is a side glacier north of the rift, but the location of the rift is not in the right spot for the side glacier to be causing the rift.
8. Elevation Change
In this section we compare altimeter data collected by us during the surge in September 2011 with altimeter data collected by C. Larsen (University of Alaska Fairbanks) as part of NASA’s Operation IceBridge. Our flight tracks were planned without knowledge of the existence of Larsen’s observations, but the flight tracks of both campaigns are sufficiently closely located for a comparison. Therefore, regions of crossovers shown in the track plots are used to derive elevation differences (Figs 8 and 9). Pairs of crossover points were identified as follows. First, crossover regions were determined from the track plots. Each region was divided into squares, such that 50 squares cover the x-direction; then laser measurement points were aggregated into the squares, averages within each square formed for each observation year, and finally differences formed according to

Laser altimeter tracks over Bering Glacier. Location of laser altimeter data collected by C. Larsen (University of Alaska Fairbanks), 2010, under NASA Operation IceBridge, and by U.C Herzfeld, September 2011, as part of US National Science Foundation project.

Elevation change from 2010 and 2011 laser altimeter dataover Bering Glacier. (a) Lower central Bering Glacier (uppermost area). (b) Lower central Bering Glacier (downstream of (a)). (c) Front of Bering Glacier in Tashalish arm. Green: data collected by C. Larsen, 2010. Other colors: data collected by U.C. Herzfeld, September 2011. Squares show elevation differences in crossover locations and near-crossover locations. For locations of areas see Figure 9.

Elevation differences shown in Figure 9 indicate a surface lowering of 40-70 m on the northwestern side of the lower central part of Bering Glacier and a thickening of ?s20-40 m in lower Bering Glacier near the ice front in Tashalish arm. While the analysis is limited by the coverage of the laser tracks, the area of largest surface lowering corresponds in location to the area where the surge may have started, based on visual interpretation of crevasse patterns. Hence this area is interpreted as the former reservoir area of the surge. (The first laser run was selected to include the region where the surge may have started, based on visual crevasse interpretation and knowledge of the 1993-95 surge process.)
The area of largest thickening coincides with the area where the surge first reached the ice front. The fact that surface increase is still observed indicates that the additional mass transferred from the reservoir area has not been entirely redistributed in the receiving area, by September 2011.
8.1. Discussion of error sources
The accuracy of laser altimeter data is limited by knowledge of the position of the aircraft, which in the case of our data is derived from GPS data. An unknown component of the error budget is caused by the attitude of the plane, which was not registered. However, both 2011 laser altimeter flights were undertaken in extraordinarily stable weather conditions, and only very broad, gentle turns were undertaken. Data from turns were not included in elevation-difference calculations.
Using an estimated pointing accuracy of 5° and an (actual) altitude of 1000 m above the glacier, the maximal position error is ∼50m. The slope of laser track 1a in flight 1 is 0.0120 m vertical per 1 m horizontal along-track distance, equivalent to a ratio of 0.012 (averaged over the entire track). Neglecting slope in across-track direction, the elevation error due to lack of pointing knowledge is hence 0.6 m. Laser run 1a follows the flowline, hence along-track slope is much larger than across-track slope. If, for a conservative estimate, it is assumed that across-track slope equals along-track slope, then the maximal elevation error due to lack of pointing knowledge is 0.8 m. The laser held out of the window was very stable, because it was leashed to the scientist’s arm by a tight sling and the wind pressed the holding arm into the window frame. For the IceBridge data, we assume that pointing error has been corrected for (but this is not documented). In conclusion, the pointing errors in our eleva-ion data do not affect the determination of elevation change significantly, because the surge causes large elevation changes on the order of 20-70 m in a short time. Elevation changes are given with meter accuracy here. The method of holding an altimeter out of the aircraft window is therefore considered sufficiently accurate for the purpose of our study.
A complete error calculation is not possible, because sufficient information on the error budget and corrections of IceBridge altimeter data is not available. We assume that IceBridge data have an accuracy similar to our laser data, and they are likely more accurate. The data aggregation method used for forming differences of near-crossovers between the two datasets may introduce errors in elevation difference due to slope of up to 0.77m in area 1 (gridcells (46m)2; maximal error is the largest diameter of cell (46 m x 1.4) x slope), 5.29 m in area 2 (gridcells (315 m)2) and 5.04 m in area 3 (gridcells (300 m)2). These values can only be reached if there is only one point per survey in the same cell and the two points fall in opposite corners of the gridcell. Examination of overlap of aggregation gridcells and survey tracks in Figure 9 indicates that this error component is actually lower: In area 1, both surveys overlap and hence this error component is negligible for the area of thickening. For areas 2 and 3 the overlap is more than half the gridcell, which reduces the error component to about 2.5 m. More details on the variability of the values can be inferred from the figure panels. Variability in elevation difference may also be caused by crevasse depth; however, this effect appears to average out within the gridcells. In summary, the method is sufficiently accurate to measure elevation change during a surge with meter accuracy and determine the location of the reservoir area and the receiving areas.
The absolute accuracy of the laser altimeter data does not affect the geostatistical classification parameters, which are determined from increment functions based on difference values. The roundedness parameter is affected by missing point measurements, resulting in too large diameters. The latter case is flagged in the software and excluded in averaging roundedness/curvature as age indicator.
8.2. Interpretation I I : collapse of the reservoir area and progression of the surge-wave front
Elevation differences indicate surface lowering in lower central Bering Glacier and surface height increase near the front in Tashalich arm, as more precisely shown in Figure 9. A surge starts in the location where a bulge collapses; this corresponds to the area of largest surface lowering, which approximately coincides with the location of oldest crevasses.
The surge progressed fast to the front, reaching it in the Tashalich arm area before May 2011 (personal communication from B. Molnia, 2011; observed in photographs). In the Tashalich arm area, chaos-type crevasses with complex haystack types dominate. This location near the front shows maximal thickening/increase of surface height, out of the observed regions. Combining analysis of crevasse depth and spacing, parameterization of crevasses and elevation analysis facilitates analysis of the surge progression.
9. Summary of Results
The Bering Glacier–Bagley Icefield System is currently surging (2011). The dynamics of a surge-type glacier change over a quasi-cyclic pattern that includes a long quiescent phase of normal flow and a short surge phase of fast flow. A surge glacier builds up ice in a reservoir area during the quiescent phase of the surge; this ice is then rapidly released during the surge phase. In consequence, drastic elevation changes occur during the surge phase, including rapid thinning in the former reservoir area, drawdown along the margins of the glacier and thickening in the receiving area downstream of the reservoir area. The kinematic wave associated with the surge propagates upstream and downstream, causing heavy crevassing that is characteristic of the rapid, brittle deformation. In this paper, we have investigated the large-scale elevation changes and the small-scale surface elevation and elevation-change characteristics as a means to understand the surge. With this objective in mind, airborne laser altimeter data were collected along several profiles totaling 141.48km over Bering Glacier in September 2011.
Elevation data analysis was carried out in three parts: First, we analyzed the first-order variables average and maximal crevasse depth and average crevasse spacing. Maximal crevasse depth is 60 m, reached in a rift that separates two deformation domains, indicative of two different flow regimes. Surge crevasse depth generally reaches 20–30 m.
Second, we derived characteristic parameters of structural provinces by applying the geostatistical classification method. Parameters include significance and spacing of crevasses, surface roughness and crevasse-edge curvature (indicative of crevasse age). Average crevasse spacing is typically 20–30m and reaches 100m in some crevasse fields. Because freshly formed surge crevasses have a characteristic clear-cut edge, which rounds over time due to erosion and melting, the curvature parameter provides a means for relative dating of crevasse age and hence allows us to infer the progression of the surge wave through the glacier, based on a single-time observation.
Combined into a feature vector, the parameters characterize spatial surface roughness. A classification based on the feature vector serves to objectively discriminate structural provinces, indicative of surge progression down-glacier and up-glacier. Here this has been demonstrated for the region of a large rift in central Bering Glacier, where several crevasse provinces and sub-provinces can be distinguished.
The characterization of altimeter data from the region of the rift shows that the rift is a unique feature that separates different structural provinces. In conclusion, different flow regimes exist on either side of the rift: a field of rhombic crevasses resultant from shear and extension caused by surge dynamics (north of the rift) and an area south of the rift that has only at its margins been affected by the surge (at time of survey). The rift has the effect of impeding progression of surge kinematics. The rift itself may be attributed to shear between the two dynamic provinces. This result motivates the hypothesis that the rift may be associated with a large bed-topographic feature, such as a ridge between two large channels.
Third, absolute elevation changes were calculated by differencing our 2011 altimeter data and laser altimeter data collected in 2010 under NASA’s Operation IceBridge by University of Alaska scientists. Results show surface lowering of 40–70m in the lower central Bering Glacier on the northwest side (location of the bulge that marks the former reservoir area) and thickening of 20–40 m near the front in Tashalich arm (where the surge first reached the ice front).
Elevation differencing documents the mass transfer from the reservoir area to the receiving area. Results of the crevasse profilometry and crevasse pattern analysis allow us to mathematically–physically reconstruct the rapid progression of the surge to the time of observation. The geostatistical and structural–glaciologic analysis permits us to distinguish a small number of deformation events (one to three), but is limited once many events turn the crevasse patterns into a chaos of seracs and blocks, as typically happens near the ice front. Using parameters such as roundedness (relative age) and overprinting of crevasses, more than one deformation event or crevasse generation can be identified. Especially because the surge only started a few months earlier, such reconstruction is feasible for most of the glacier. At the time of observation in September 2011 the surge was still in progress, and future observations will be needed to capture the entire surge process.
Methodologically, the paper introduces an approach that utilizes the principles of structural glaciology and mathematical characterization and classification as a means to identify crevasse provinces (structural provinces in case of the brittle deformation that dominates during a surge) and then to derive characteristic parameters related to surge progression. This is the first work in which we apply the spatial characterization–classification approach to laser altimeter data of crevasses and thus derive quantitative parameters of the vertical component of surge deformation stages. When combined with image classification using the same method (Reference Herzfeld and ZahnerHerzfeld and Zahner, 2001) three-dimensional descriptors of surge deformation can be obtained.
There are three components to this type of analysis of ice dynamics: (1) characterization (establishment of a unique set of parameters for each class), (2) classification (association of new objects to a class) and (3) segmentation (mapping of structural provinces for an entire glacier or glacier system). In this paper, the characterization step has been carried out for typical surge-crevasse types. Notably, the characterization step alone is sufficient to provide a basis for forward modeling (assuming all crevasse types that occur during a surge have been sampled with laser-altimeter and image data). To provide a parameterization for model input is one of the goals of our study. Following collection and analysis of data covering the entire glacier system throughout the surge, the structural classification will be carried out systematically, aided by connectionist–geostatistical classification.
As a further application, the same approach generalizes to investigating kinematics and brittle deformation associated with ice acceleration in temperate glaciers in or near the Arctic, including accelerations of outlet glaciers of the Greenland ice sheet in a warming climate (surge-related and not surge-related).
Acknowledgements
Thanks are due to Bruce Molnia for alerting U.C.H. to the start of the surge in June 2011. Support of the research presented here through the US National Science Foundation’s Arctic Natural Research Program under award ARC-1148800 and Research Experience for Undergraduates (Award ARC-1247839) is gratefully acknowledged, the latter especially by the junior co-authors, R.G.H., P.C. and T.T. Support through the University of Colorado Undergraduate Research Opportunity Program is equally appreciated. Thanks to Chris Larsen for collecting laser altimeter data of Alaskan glaciers as part of NASA’s Operation IceBridge and for making the 2009 and 2010 data available via the US National Snow and Ice Data Center/World Data Center for Glaciology A (NSIDC). Thanks to NSIDC (Marilyn Kaminski and co-workers) for helping us with IceBridge data access and interpretation. iceberg-calving mechanism at Vitus Lake, Alaska, U.S.A. J. Glaciol., 39(133), 722–727
Appendix: Geostatistical Classification Parameters
In the interest of brevity, we limit the mathematical description to the parameters employed in the analysis of laser altimeter data of the Bering Glacier surface. Other geostat-istical classification parameters are introduced in Reference HerzfeldHerzfeld (2008). To mathematically summarize spatial surface roughness in a given area, a vario function is formed. In this paper, we use the first-order vario function and the residual vario function, motivated and defined as follows. Since we are interested in characterizing the crevasse structure in a given area, the actual value at each location is not as relevant as the parameters that describe morphology more generally for a crevasse field. Therefore, we form differences of measurement values and average over all points that have the same common distance (or distance and direction), creating vario functions.

for pairs of points  , where
  isaregion in
  (case of survey profiles) or
  (case of survey areas) and n is the number of pairs separated by h; the distance value h is also termed ‘lag’. The function v1(h) is called the first-order vario function. This function exists always and has a finite value, because only finitely many data points enter the calculation. For elevation data in meters, the variogram values have units in m2. In situations where a regional trend or a local drift underlies the data, the residual vario function is often more useful to analyze roughness. Using

the residual vario function is defined as

and also has values in m2. The first-order vario function is formally equivalent to the variogram; however, the variogram is defined for a dataset that may be considered a realization of a spatial random function satisfying the intrinsic hypothesis (see Reference MatheronMatheron, 1963, Reference Matheron1973). A discussion of the theoretical and practical differences between vario functions and vario-grams is given in Reference HerzfeldHerzfeld (2008). Vario functions are more robust analysis tools than the covariance function and the power spectrum (power spectral density) and exist under conditions where those functions do not exist. This makes them particularly useful in geoscience applications. In the geostatistical classification method, the vario function is used akin to the spectrum, but, in contrast to the spectrum, it is not easily perturbed by disturbances over small scales, which is an important aspect in the study of roughness characteristics.
Parameters. The pond parameter is defined as the maximal value of the vario function; it serves to distinguish crevassed areas from non-crevassed areas and generally is a summative measure of surface roughness. The terms pondvar and pondres designate pond determined from the first-order vario function and the residual vario function, respectively. The mindist parameter, defined as the lag of the first minimum after the first maximum in the vario function, gives the spacing of parallel crevasses. We further define the significance parameters p1 and p2:


p1 is the slope parameter and p2 the relative significance of the first minimum min1 after the first maximum max1, and hx and vx denote lag and vario-function value of x, respectively. Here vcan stand for the vario function or the residual vario function. For example, p1(var) denotes parameter p1 calculated for the vario function, var, and p1(res) denotes parameter p1 calculated for the residual vario function, res. For elevation profiles and var or res, parameters p1 and mindist have units in m, pond in m2, while 0 < p 2 <1 holds always.



