The prevalence of obesity and overweight has been increasing among adults and children worldwide, especially among young people in developed countries( Reference Ng, Fleming and Robinson 1 ), increasing their risk for associated chronic diseases( 2 ). In Chile, a country of 17 million inhabitants, six out of ten adults and half of children aged 6–7 years are overweight or obese( 3 ). Global initiatives have called for the urgent monitoring and regulation of the food environment as a means of halting this epidemic( 4 – Reference Sassi 7 ). These initiatives include attention to television food advertising, which disproportionately promotes products high in energy, sugars, sodium and saturated fat( Reference Boyland, Nolan and Kelly 8 – Reference Roberts and Pettigrew 15 ). Exposure to advertising of sugary, energy-dense and fast foods has been associated with overweight and obesity( Reference Boyland, Nolan and Kelly 8 , Reference Chou, Rashad and Grossman 10 , Reference Lewis and Hill 12 , Reference Andreyeva, Kelly and Harris 16 – Reference Young, Webley and Hetherington 27 ) and shown to motivate consumption of the advertised brand, increased snacking and consumption of other unhealthy foods( Reference Sadeghirad, Duhaney and Motaghipisheh 24 , Reference Buijzen, Schuurman and Bomhof 28 – Reference Emond, Lansigan and Ramanujam 30 ).
In response to the nation’s growing obesity-related health issues, the Chilean Government approved a comprehensive regulation to prevent obesity. Effective July 2016, the National Law of Food Labeling and Advertising (Law 20.606)( 31 ) (i) requires front-of-package warning labels to identify pre-packaged foods high in energy, saturated fats, sugars and/or sodium (abbreviated hereafter as HEFSS), (ii) forbids HEFSS foods in school kiosks and feeding programmes and (iii) restricts the marketing of HEFSS foods to children under age 14 years across different platforms, including websites, social media, magazines, billboards, pamphlets, newspapers, radio and television. If the television programme targets children or at least 20 % of its audience members are children, advertising of any product above the specified thresholds in energy, sugars, saturated fats and/or sodium is restricted in that programme. Child-directed marketing appeals, including the presence of children, animations, licensed characters, celebrities, popular words and toys, are banned from the remaining HEFSS advertisements. Then, on 28 November 2017, an update to Law 20.606 was published that extends the television advertising restriction across the broadcast day from 06.00 to 22.00 hours, effective six months from the 2017 publication date (the 2017 extension is Law 20.869). These restrictions are significant, as terrestrial television is the dominant medium for audience use and advertising expenditures in Chile( Reference Godoy and Gronemeyer 32 ) and is recognized as the most important food marketing medium, generally( Reference Cairns, Angus and Hastings 9 ).
In anticipation of how Chile’s comprehensive marketing regulations will impact the food advertising environment, the present study provides a baseline assessment of this environment as it existed in the year prior to the regulation while also extending current knowledge of food marketing to children. Analyses conducted in various countries have found that 20 to 22 % of the advertising in children’s television programmes is for foods and beverages( Reference Kelly, Halford and Boyland 33 , Reference Vergara-Leyton and Vergara del Solar 34 ). Food ads generally promote energy-dense foods such as pre-sugared breakfast cereals, soft drinks and savoury snacks( Reference Cairns, Angus and Hastings 9 , Reference Powell, Szczpka and Chaloupka 13 ). In Chile, according to a 2007 study, 34 % of the advertising time in child-targeted programmes was dedicated to foods and beverages( Reference Uribe Bravo 35 ). In addition, another recent investigation found that 53 % of food advertising was targeted to children and mostly focused on sugary dairy products (28 %), sweetened beverages (26 %) and breakfast cereals (18 %)( Reference Gonzales-Hidalgo 36 ). Most of these studies focus on children’s programming, yet a large proportion of children also watch general-audience programmes, even at night( 37 ). Additionally, food advertising affects both children and adults( Reference Harris, Bargh and Brownell 29 ), and whereas children influence their parents’ purchasing decisions( Reference Schor 38 , Reference Ward, Wackman and Wartella 39 ) using ‘pester power’ to ask for products( Reference Buijzen and Valkenburg 40 , Reference McDermott, O’Sullivan and Stead 41 ), parents make the final purchases affecting their child’s diet. Thus, it is highly important to assess television food advertising across programmes with differing audience composition.
The current study addresses this gap in the literature. Food and beverage advertisements across two constructed weeks of broadcast and cable television aired from 06.00 to 00.00 hours were subjected to a rigorous quantitative content analysis. Findings address the proportion of advertisements that relate to foods and/or beverages, the nutritional quality of the foods and beverages advertised and the composition of audiences seeing those ads, and the marketing strategies used in these ads.
Methods
Data set
A quantitative content analysis was conducted on advertisements appearing in a sample of two weeks of television aired between 06.00 and 00.00 hours (18 h/d) across eight channels. Guided by audience ratings data provided by Chile’s National Television Council and the media research company, Kantar Ibope Media, Chile’s four major broadcast networks – Mega, Chilevisión, TVN and Canal 13 – as well as the cable networks that have the highest ratings among children and teens in Chile – Discovery Kids, Disney, Cartoon Network and Fox – were included in the analysis. These channels include the fifty television programmes with the highest ratings among the general audience, as well as among children aged 4–12 years and adolescents aged 13–17 years, enabling analyses based on variations in audience composition.
A probabilistic sampling method was used to randomly select two Sundays, two Mondays, etc. from April to May 2016 to create two composite weeks of programming, robust to confounds of over-representation of specific days or special holiday events( Reference Riffe, Aust and Lacy 42 ). In total, 2016 h of programming were sampled across 14 d of programming in eight channels. Recordings of these television days were obtained from Chile’s National Television Council.
Content analysis
Advertisements related to foods and non-alcoholic beverages placed within the short breaks within and between programmes (product placements within programmes are excluded) were the unit of analysis. The total number of ads aired each day was also recorded to obtain the proportion of food and beverage ads out of the total number of ads. Food-related ads were defined as those that advertise products and/or services related to foods and (non-alcoholic) beverages, including ads where the main focus was foods and beverages but also supermarkets, restaurants and food-related brands with or without food shown. Alcoholic beverages and nutritional supplements were not included as food-related ads.
For all ads in the sample, the host network (channel), air date, start and end times (used to calculate ad duration) and host programme name were recorded. Audience exposure and audience composition data for each host programme were then obtained from Kantar Ibope Media, which measures television use via a people meter system, sampling from seven regions covering 51 % of Chile’s urban population( Reference Buzeta and Moyano 43 ). Audience ratings were used to indicate audience exposure; a rating is the average proportion, expressed as a percentage, of people in the defined age group who watched a given programme out of the total number of people in that age group with a television in their home. Ratings data were obtained for children aged 4–12 years, adolescents aged 13–17 years and the general audience (also called the ‘television universe’). Audience adhesion (ADH) was used as the primary indicator of audience composition; ADH is a measure of audience structure based on the percentage of a programme’s viewers that belong to the target age group. According to the Chilean food marketing regulation, programmes are considered child-targeted if they achieve a child ADH of 20 % or more.
Audience exposure to ads for foods/beverages high in energy, saturated fats, sugars and/or sodium
Based on ratings and ADH data, gross rating points (GRP) and gross impressions were calculated for HEFSS ads in total, within programmes above the 20 % ADH threshold in audience composition and within programmes aired between 06.00 and 22.00 hours (the majority of the broadcast day), to project changes in audience exposure based on the current regulation and on the more stringent upcoming restriction across the day. GRP and gross impressions are marketing metrics that reflect both the frequency of an ad and the number of people exposed to the ad.
GRP are calculated based on the number of ads and their audience rating. In this case, GRP were calculated using each HEFSS ad’s host programme’s rating for each target audience (children aged 4–12 years, adolescents aged 13–17 years, universe). Within each target audience, rating points were summed across all HEFSS ads to provide total GRP for HEFSS ads across the two-week sampling period. This sum was divided by 2 to estimate GRP for a single week.
Gross impressions were calculated by multiplying the GRP within each target audience (GRP expressed as a percentage) by the estimated number of viewers in the respective target audience. Thus, gross impressions constitute an estimate of the number of total views HEFSS ads obtained in one week; gross impressions include unique views, as well as repeat views (viewers who see the ad more than once).
Classification of products to identify ads for foods/beverages high in energy, saturated fats, sugars and/or sodium
Trained nutritionists linked foods and beverages featured in the ads to nutrition facts panel data collected as part of the University of Chile Institute of Nutrition and Food Technology’s International Network for Food and Obesity/non-communicable diseases Research, Monitoring and Action Support (INFORMAS) project( Reference Swinburn, Sacks and Vandevijvere 44 ), which monitors food environments across twenty-two countries. Using the nutrition facts panel data, identifiable food/beverage products within each ad (up to four products) were coded as being regulated (=1) or unregulated (=0) under the first 2016 phase of implementation of the Chilean regulation for exceeding the following thresholds in energy, sugars, saturated fat and/or sodium: 1464 kJ (350 kcal) total energy, 800 mg sodium, 22·5 g sugars and 6 g saturated fats for solid foods per 100 g; and 418 kJ (100 kcal) total energy, 100 mg sodium, 6 g sugars and 3 g saturated fat for liquids per 100 ml. These thresholds apply to products with added ingredients that increase the amount of these nutrients beyond the natural content (e.g. fruit juice with added sugar is subject to the regulation but 100 % fruit juice is not). Any product exceeding any of the four thresholds above was considered an HEFSS product based on the first phase.
Products were also identified as regulated (=1) or unregulated (=0) for energy, sugars, sodium and/or saturated fat based on the final 2019 implementation of the regulation for exceeding the following stricter thresholds: 1151 kJ (275 kcal) total energy, 400 mg sodium, 10 g sugars and 4 g saturated fats for solid foods per 100 g; and 293 kJ (70 kcal) total energy, 100 mg sodium, 5 g sugars and 3 g saturated fat for liquids per 100 ml. Any product exceeding any of the four final thresholds was considered an HEFSS product based on the final implementation.
Any ad that contained at least one HEFSS product based on the first nutrient threshold was considered an HEFSS ad at the first implementation (=1) and ads that contained all unregulated products based on this first threshold were considered non-HEFSS (=0). The same designation of HEFSS and non-HEFSS ads was performed for the final threshold.
Separate from designating ads as HEFSS ads, the main categories of foods and beverages were classified from the nutrition facts panel information to describe the types of products advertised. Food groups were based on a modification of the food-grouping system developed for the tax evaluation project in Mexico( Reference Batis, Rivera and Popkin 45 ) and modified by graduate-level Chilean dietitians to reflect the typical Chilean diet. Beverages and foods were categorized in the following manner: sodas, dairy-based beverages (e.g. milk, drinkable yoghurt), water, coffee/tea, sports/energy drinks, industrialized fruit/vegetable juice, grain-based and non-grain based sweet desserts (e.g. cookies, chocolate, candies and sweet bakery), meat/poultry/meat substitutes, fish/seafood, eggs, dairy products (e.g. cheese, cream, yoghurt), salty snacks (e.g. chips), oil and fats (e.g. oil, butter, margarine), formula, breakfast cereal, cereal-based products (e.g. pasta, rice, flour, bread), sauces (e.g. tomato, soya sauce), soups, condiments (e.g. mayonnaise, ketchup, mustard), caloric sweeteners (e.g. sugar, honey) and non-caloric sweeteners (e.g. stevia), baby food, fruits/vegetables, legumes and salt/seasoning.
Marketing strategies
Marketing strategies were defined and described in the codebook based on prior work by INFORMAS( Reference Rayner, Wood and Lawrence 46 ), using the definitions provided in the Chilean marketing regulation to ensure all child-directed strategies identified in the regulation were included in coding. We included strategies identified by the previous literature such as taste, happiness, nutrition and promotional content, which are found in ads targeted to both children’s and general-audience programming( Reference Warren, Wicks and Wicks 47 , Reference Page and Brewster 48 ), and fantasy, popularity cues and animated or licensed characters as additional appeals common in child-targeted ads and regulated by the law( Reference Gantz, Schwartz and Angelini 11 , Reference Lewis and Hill 12 , Reference Warren, Wicks and Wicks 47 , Reference Bernhardt, Wilking and Adachi-Mejia 49 ). The codebook instrument that contained strategies of ads was first pre-tested by two trained coders recruited from a Chilean university communications programme. Intercoder reliability was calculated with ReCal, a software to calculate intercoder reliability( Reference Freelon 50 ), for all codes using a sub-sample of four days of programming. Results indicated an acceptable degree of agreement between coders, Cohen’s κ and Scott’s π = 0·98 to 0·70 across codes. The remaining sample was coded by eight coders after receiving 10 h of training.
Ads were first coded as follows: (i) the primary function was the promotion of one or more specific food/beverage products; (ii) a food/beverage was featured in a promotion for a non-food company (e.g. pharmacy); (iii) food/beverage products were shown within a supermarket or restaurant promotion; or (iv) a food company/brand was being promoted without food shown.
Ad content was then coded for the presence (=1) or absence (=0) of the following marketing strategies identified in the regulation: (i) one or more child actors; (ii) animated characters (e.g. animals, children, licensed characters); (iii) celebrities or athletes; (iv) promotional incentives (e.g. gifts, prizes, contests or games); and (v) childhood life references (e.g. school, playground, popular children’s words and fantasy). Other marketing strategies not included in the regulation were also coded, including: (i) happiness/entertainment appeals; (ii) taste/smell/texture claims; (iii) nutrition/health/weight control claims; (iv) deregulated consumption suggestion; and (v) sex/romance cues. These codes are shown in greater detail in the Appendix.
Statistical analysis
Descriptive statistics were used to describe the extent of HEFSS ads in the television sample, the quantity of marketing strategies found across those ads, the placement of those ads over the broadcast day, the current extent of audience exposure (based on GRP and gross impressions) and changes in that exposure expected with the regulation. The χ 2 test was used to test for differences in the proportion of HEFSS ads featuring (v. not featuring) each marketing strategy, as well as test for differences in the frequency of HEFSS ads based on time of day. The t test was used to compare the audience composition of HEFSS ads v. non-HEFSS ads and to compare audience composition of ads based on the presence v. absence of each marketing strategy. Comparisons were considered statistically significant at P <0·05 unless Bonferroni α adjustments note otherwise.
Results
Of the 44 890 ads sampled across the analysed channels, 16 % were related to foods and beverages. The percentage of food advertising was higher on broadcast (21 %) than on cable channels (11 %). As shown in Table 1, 49·5 % of the food-related ads on broadcast television were for supermarkets (some of which showed no foods or beverages), 45·6 % were for specific food and/or beverage products, and the remaining ads were for restaurants (some of which showed no foods or beverages) or food brands showing no food or beverage products. On cable television, 74·6 % of food-related ads were for specific food or beverage products and the remaining ads were evenly split between restaurants (including fast food) and supermarkets. Fast-food ads were found only on cable channels (3 % of ads). The remaining analyses consider only those food-related ads that featured at least one identifiable food or beverage product that could be evaluated for its nutritional quality.
Types of food-related ads aired on Chilean television, across all channels and separated by channel, during two random composite weeks across April–May 2016 from the four broadcast and four cable channels with the largest youth audiences

Statistical comparisons are made within rows only and are between the proportion of ads of a given type found in broadcast v. cable channels, based on χ 2 tests of independence. Differences considered statistically significant based on Bonferroni correction of α = 0·0125 based on four tests. Food/beverage product ads focus on (and show) specific food and beverage products. Supermarket ads focus on supermarkets and might or might not show specific products. Restaurant ads include fast-food ads and might or might not show actual foods or beverages. Food/beverage brand ads focus on a food-related brand and do not show specific food or beverage products.
Of the 6251 ads with identifiable food or beverage products, 34 % contained at least one HEFSS product across all channels based on the initial thresholds of 2016. The percentage of food ads with at least one HEFSS product increased to 47 % if applying the final 2019 phase of threshold implementation.
Broadcast channels differed from cable channels in their relative amounts of HEFSS ads; when applying the first nutrient threshold, 47 % of cable ads with identifiable foods/beverages contained at least one HEFSS product and 28 % of the food ads on broadcast television contained an HEFSS product (χ 2 = 218·2, P≤0·001). If these percentages are projected for the final phase of the law, HEFSS ads reach 60 % of food-related ads in child/teen-targeted cable channels and 40 % in broadcast television (χ 2 = 218·8, P≤0·001). Not shown in tables or figures, 66 % of the HEFSS ads contained at least one product above the threshold in added sugars, 45 % contained at least one product above the threshold in energy, 26 % contained a product high in saturated fat and 11 % contained a product regulated for added sodium.
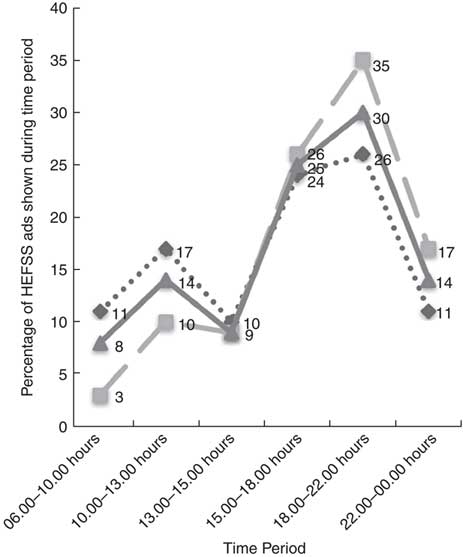
Figure 1 shows the distribution of HEFSS advertising by time of day across all analysed channels, within broadcast channels and within cable channels. A χ 2 analysis indicates this distribution differs significantly based on time of day (χ 2 = 28·1, P < 0·001). About a third of all HEFSS advertising aired between 18.00 and 22.00 hours; 26 % of broadcast HEFSS ads and 35 % of cable HEFSS ads aired during this time. Channels aired the fewest amount of their HEFSS ads during the times 06.00–10.00 hours and 13.00–15.00 hours. Overall, the same percentage of HEFSS ads aired between 10.00 and 13.00 hours as between 22.00 and 00.00 hours. Cable channels aired 17 % of their ads after 22.00 hours, whereas broadcast channels aired 11 % of their ads after 22.00 hours; this pattern is reversed for the period between 10.00 and 13.00 hours.
Average distribution of HEFSS food and beverage advertising aired on Chilean television from 06.00 to 00.00 hours by time of day, across all channels (![]() ) and separated by channel (broadcast (over-the-air free television),
) and separated by channel (broadcast (over-the-air free television), ![]() ; child/teen cable (paid television),
; child/teen cable (paid television), ![]() ), during two random composite weeks across April–May 2016 from the four broadcast and four cable channels with the largest youth audiences (total percentage = 100 % across the day within channel type (broadcast, cable, all); total HEFSS ads, n 2146; broadcast networks’ HEFSS ads, n 1185; child/teen cable networks’ HEFSS ads, n 961). Distribution was significantly different based on time of day: χ
2 = 28·1, P < 0·001 (HEFSS, high in energy, saturated fats, sugars and/or salt)
), during two random composite weeks across April–May 2016 from the four broadcast and four cable channels with the largest youth audiences (total percentage = 100 % across the day within channel type (broadcast, cable, all); total HEFSS ads, n 2146; broadcast networks’ HEFSS ads, n 1185; child/teen cable networks’ HEFSS ads, n 961). Distribution was significantly different based on time of day: χ
2 = 28·1, P < 0·001 (HEFSS, high in energy, saturated fats, sugars and/or salt)
Table 2 shows the categories of foods and beverages that appeared in the ads (up to four products coded per ad). In sum, 57 % of the foods and 52 % of the beverages that appeared in the ads were HEFSS; this is a total of 55 % of the products combined. Sodas (24 %), sweet desserts (15 %), meat/poultry/fish/eggs (15 %) and dairy-based beverages (9 %) were the most relevant food categories advertised on Chilean television. About three out of four sodas and sweet desserts were HEFSS (75 and 77 %, respectively).
Groups of foods that appeared in food-related ads aired on Chilean television during two random composite weeks across April–May 2016 from the four broadcast and four cable channels with the largest youth audiences
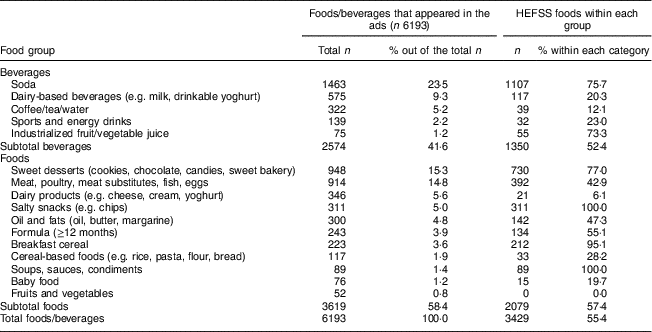
HEFSS, high in energy, saturated fats, sugars and/or salt.
For each spot, up to four products were coded and linked to their nutritional information. Thus, in this table, the sample sizes are based on the total number of foods/beverages that were coded and linked to their nutritional information. HEFSS foods are foods that exceeded at least one of the initial 2016 nutrient thresholds in energy, added sugars, added sodium or added saturated fat (e.g. nearly all salty snacks exceeded the 2016 threshold for energy).
Table 3 shows both the regulated and non-regulated marketing strategies present in ads with HEFSS products and ads without HEFSS products. With few exceptions, HEFSS ads contained significantly more regulated child-directed marketing strategies such as the presence of children, animated characters and children’s daily situations (e.g. school, playground) than ads with non HEFSS products, based on χ 2 tests evaluated at a Bonferroni-corrected α of 0·002 based on twenty-two tests (HEFSS and non-HEFSS ads compared on twenty-two different marketing strategies). Among the few exceptions, non-HEFSS ads included more celebrities than HEFSS ads. No differences were found for popular words. Gifts were more often to appear in non-HEFSS than in HEFSS ads, although this difference approached significance after the Bonferroni correction; other promotional incentives, prizes/contests and interactive games were more common among HEFSS ads. Regarding strategies that are not regulated by the law, non-HEFSS ads were also more likely than HEFSS ads to contain nutrition/health/weight-control appeals and sales promotions. However, happiness and deregulated consumption appeals were more prevalent in HEFSS ads than in non-HEFSS ads.
Marketing strategies in ads aired on Chilean television, according to presence or absence of HEFSS food or beverage products, during two random composite weeks across April–May 2016 from the four broadcast and four cable channels with the largest youth audiences
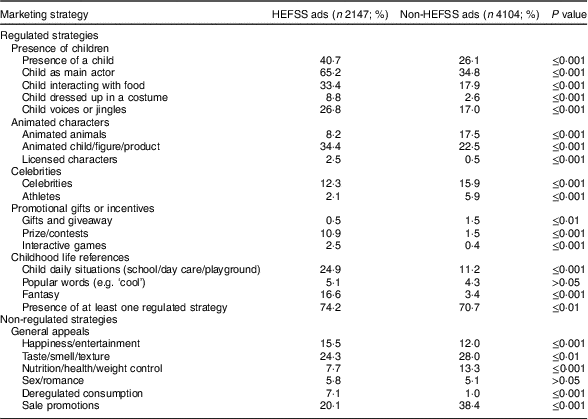
HEFSS, high in energy, saturated fats, sugars and/or salt.
Statistical comparisons are made within rows only and are between the proportion of HEFSS v. non-HEFSS ads, based on χ 2 tests of independence. Differences considered statistically significant based on Bonferroni correction of α = 0·002 based on twenty-two tests (twenty-two marketing strategies).
Table 4 presents the current audience exposure to HEFSS ads based on GRP and gross impressions, including the projected exposure if HEFSS ads are eliminated in programmes above the 20 % child (age 4–12 years) ADH threshold in audience composition and if HEFSS ads are eliminated across the television day (06.00–22.00 hours). Currently, just over 40 % of the minutes given to advertising foods or beverages per week consist of HEFSS advertising, using the first implemented nutrient threshold. Not shown in the table, this percentage grows to 56 % if applying the final threshold. Applying the first threshold, between 34 and 38 % of food/beverage ads seen weekly by 4–12-year-old children, 13–17-year-old adolescents and the general audience are HEFSS ads, according to audience ratings data. If HEFSS ads are restricted based solely on the regulation’s audience composition threshold (i.e. 4–12-year-old children representing 20 % or more of the audience), about 31 % of 4–12-year-old’s current HEFSS ad exposure would be eliminated, along with 17 % of 13–17-year-old’s exposure and 8 % of the general audience’s exposure. Restricting HEFSS advertising across the broadcast day from 06.00 to 22.00 hours captures about 80 % of exposure across these audiences. Not shown in Table 4, an application of the final nutrient threshold encompasses a larger percentage of HEFSS ads to all food/beverage ads seen by child, adolescent and general audiences, based on GRP and gross impressions (between 50 and 52 %). However, this increase does not seem to be located within programmes meeting the 20 % ADH threshold. Overall percentages of HEFSS ads seen within the 20 % ADH programming compared with all HEFSS ads seen decreased by one percentage point when applying the final threshold. However, percentages increased by one to two percentage points when applying the final threshold to GRP and gross impressions for the 06.00–22.00 hours ban.
Audience exposure to food advertising aired on Chilean television measured by GRP and gross impressions in one week, and projection of HEFSS ads reduced based on Chilean regulation (>20 % ADH) and on a more stringent daytime advertising restriction, during two random composite weeks across April–May 2016 from the four broadcast and four cable channels with the largest youth audiences

GRP, gross rating points; HEFSS, high in energy, saturated fats, sugars and/or salt; ADH, adhesion.
Values are sums of descriptors of the identified ads observed in one week of television programming spanning 06.00–00.00 hours. HEFSS ads include all ads that featured a product above the threshold of energy, sugars, saturated fat and/or sodium as defined by the first phase of the Chilean regulation. ADH is percentage of a target audience out of the total audience that a programme attracts. Programmes with >20 % ADH indicate programmes that attracted audiences where 20 % or more of the audience consisted of children aged 4–12 years; this 20 % threshold is subject to HEFSS food advertising restriction according to the law. GRP are the sum of all ratings of the respective ads shown across one week, based on the rating garnered by the ad’s host programme. Gross impressions are the number of views obtained by the respective ads across one week, calculated as GRP × the number of possible viewers in the given audience.
Given the small percentage of HEFSS ads included in programmes defined by the 20 % ADH threshold (see Table 4), a comparison of the typical audience composition was made between HEFSS and non-HEFSS ads. On average, 17 (sd 17) % of the audiences seeing HEFSS ads were 4–12-year-old children and 7·5 (sd 6) % of these audiences were 13–17-year-old adolescents. These figures were statistically higher than the percentage of 4–12-year-olds and 13–17-year-olds in audiences seeing non-HEFSS ads, which were 12 (sd 14) % and 6 (sd 5) %, respectively (t = −11·7, P≤0·001 and t = −12·0, P≤0·001).
Table 5 displays comparisons based on whether a specific marketing strategy was present. Only the most prevalent twelve strategies were analysed; other strategies were excluded due to small sample size (too few strategies observed to support the analysis). Tests are evaluated at a Bonferroni-corrected α of 0·004, based on twelve strategies included in the analysis. As shown in Table 5, HEFSS ads that featured regulated strategies such as children, animated characters and child life situations had significantly more 4–12-year-old children and 13–17-year-old adolescents in their audiences, on average, compared with non-HEFSS ads featuring the same strategies. This pattern is also found among non-regulated strategies such as happiness/entertainment appeals and deregulated consumption appeals. This finding also applied to promotional gifts, although this finding approached significance for 4–12-year-old audiences only after applying the α correction.
t Test results comparing the proportions of 4–12-year-old children and 13–17-year-old adolescents in audiences seeing HEFSS ads v. non-HEFSS ads aired on Chilean television, based on presence of prevalent marketing strategies, during two random composite weeks across April–May 2016 from the four broadcast and four cable channels with the largest youth audiences
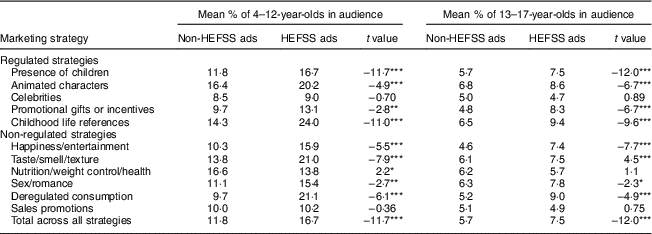
HEFSS, high in energy, saturated fats, sugars and/or salt.
Statistical comparisons are made within rows only and are between HEFSS v. non-HEFSS ad audience composition, based on t tests adjusted for unequal variances based on Levene’s test for equality of variances. Differences considered statistically significant based on Bonferroni correction of α = 0·004 based on twelve tests (twelve most prevalent marketing strategies). HEFSS ads, n 2146; non-HEFSS ads, n 4278.
* P≤0·05
** P≤0·01
*** P≤0·001.
Discussion
The present study extends current literature on food advertising in children’s programming by going beyond assessments within child-targeted or prime-time programmes and covering four broadcast and four cable channels throughout the entire day (06.00 to 00.00 hours) during two randomly selected composite weeks in April and May 2016. Thus, food advertising in child-directed programming is contextualized within the larger television environment. The study is also framed within Chile’s National Law of Food Labeling and Advertising and therefore provides critical information for future assessments of how this phased restriction of food marketing will impact children’s food marketing exposure and any subsequent changes in diet( Reference Adams, Tyrrell and Adamson 51 ). Given that the most important food marketing channel is television worldwide( Reference Cairns, Angus and Hastings 9 ) and in Chile( Reference Godoy and Gronemeyer 32 ), the present study investigates food advertising on both broadcast and cable television before the law became effective in June 2016 to allow for monitoring of the quantity, content and audience impact of food advertisements that would be covered by the new regulation.
We found that 34 % of all ads selling food and/or beverage products featured at least one product above the Chilean regulation’s 2016 threshold in at least one of the four critical nutrients, namely energy, saturated fats, sugar and/or salt. This proportion of HEFSS ads is a somewhat lower figure, compared with the evidence suggested by other studies conducting similar analyses in different countries( Reference Powell, Szczpka and Chaloupka 13 ). However, when the final nutrient thresholds are applied as planned in Chile’s final phase of implementation, 47 % of food ads would be eliminated from Chilean television, assuming the examined nutrient content of foods remains consistent and no reformulation occurs.
We also found that 55 % of the products in Chilean food/beverage ads exceeded the regulation’s initial 2016 thresholds in at least one of the critical nutrients. The most prominent food categories advertised were sodas and sweet desserts. Dairy-based beverages and meat products were also prevalent. Our finding regarding sweetened beverages corroborates recent studies in Chile and elsewhere( Reference Cairns, Angus and Hastings 9 , Reference Powell, Szczpka and Chaloupka 13 ), and our finding with respect to dairy corroborates an additional study showing that, in Chile, dairy-based products are relevant in food advertising( Reference Gonzales-Hidalgo 36 ).
Across Chilean television, a significantly higher proportion of HEFSS ads employed marketing strategies that appeal to children and excluded messages promoting nutrition/health or weight control, compared with the proportion of non-HEFSS ads. However, although HEFSS ads, especially those with child-directed strategies, were more likely to be seen by audiences with a higher proportion of children, compared with non-HEFSS ads, most of the HEFSS ads analysed were in programmes that ultimately did not meet the Chilean law’s initial child audience threshold of 20 % (percentage of children aged 4–12 years in the television audience) for restriction. HEFSS ads within programmes at or above 20 % ADH comprised a minority of the total amount of time devoted to food and beverage advertising on Chilean television, as well as comprising a very small percentage of both the total audience and the child (aged 4–12 years and aged 13–17 years) audience viewing food and beverage ads, measured via GRP and gross impressions. Rather, the majority of HEFSS ads seen by children are only captured when all HEFSS ads aired between 06.00 and 22.00 hours are restricted under the newest iteration of the regulation.
The prevalence of HEFSS ads across programmes and throughout the day is important, given evidence that children are often exposed to television their parents or family members are viewing( Reference Anderson and Pempek 52 , Reference Lapierre, Piotrowski and Linebarger 53 ). The prevalence of child-directed marketing strategies within HEFSS ads across programmes is particularly troubling, as children’s understanding of advertising and strategies to cope with ads vary greatly by age( Reference Roedder 54 , Reference Young 55 ). Children under age 6 years have limited memory and processing abilities( Reference Schneider and Pressley 56 ) and see advertising as entertainment rather than having persuasive intent. In addition, young children more easily process and therefore rely more on television images (e.g. images of fruits) than other modes of information to understand food content; young children also mistake real fruit from non-real fruit depictions( Reference Heller, Martin-Biggers and Berhaupt-Glickstein 57 ). By age 8 to 11 years, children can identify advertising and understand marketing strategies in general, but these older children do not always use this knowledge to recognize or counteract its persuasive effects( Reference Roedder 54 , Reference Young 55 ). Older adolescents are capable of recognizing and scrutinizing persuasive messages( Reference Goldberg, Niedermeier and Bechtel 58 ) but their increased impulsivity and self-consciousness( Reference Pechmann, Levine and Loughlin 59 ) make them uniquely susceptible to marketing strategies focused on autonomy, social acceptance and social identity( Reference Kelly, Vandevijvere and Freeman 60 , Reference Montgomery and Chester 61 ).
Finding child-directed HEFSS food advertising within programmes that have a high proportion of children in their audiences is concerning, but it is equally problematic that children gain a significant amount of HEFSS advertising exposure from television programmes attracting older audiences; child-directed advertising exists beyond television traditionally labelled as children’s television based on audience composition( Reference Harris, Sarda and Schwartz 62 ). Thus, our results support the need for Chile’s more stringent 06.00–22.00 hours advertising restriction if a greater amount of HEFSS advertising is to be eliminated from children’s view.
It is important to note that although the current study accounts for a variety of programmes and marketing strategies, the study is limited in its sample of Chilean television drawn before the food marketing law became effective. In our study we found that 16 % of all ads in our sample were food-related – a lower figure than the 20 to 22 % reported in the international literature( Reference Roberts and Pettigrew 15 , Reference Kelly, Halford and Boyland 33 ) and the 34 % reported in the Chilean literature( Reference Uribe Bravo 35 ). The lower percentage might be the result of the wider scope of the present study, which captures a wide variety of programmes shown at different times of day, including times that are not heavily viewed and therefore would not attract advertisers. For instance, we did note that the amount of food ads increased significantly in the afternoon leading to prime-time, a period with a high viewership and high amounts of advertising. Unfortunately, we did not analyse non-food ads in our study and so we are unable to discuss the nature of the other promotional messages being seen by children, whether the messages promote active play, sedentary behaviour or other behaviours with health implications, and to what extent these other ads use child-directed strategies.
Another surprising observation from the Chilean television sample was that about half of food ads across the broadcast and cable channels we analysed were for supermarkets and only 3 % of the food ads were for fast-food restaurants. Yet, research on US children’s food advertising exposure suggests a greater degree of exposure to fast-food messages( Reference Chou, Rashad and Grossman 10 , Reference Powell, Szczpka and Chaloupka 13 ). Based on this additional observation, Chile appears to have a markedly different advertising landscape, compared with the USA, which suggests a need to monitor this environment for changes in response to the regulation. For example, given that the regulation is specific to identifiable foods and beverages, fast-food chains and other companies might increase their advertising of their brand without showing specific food or beverage products. Another means of increasing advertising without violating the regulation might be to promote products (e.g. diet soft drinks) that fall below the implemented nutrient thresholds. It will be vital to evaluate how food advertising will shift, and how effective a 06.00–22.00 hours ban based on nutrient thresholds will be, in the light of these shifts.
In sum, we anticipate that the food industry will change its marketing approach in response to the regulation, including the quantity of ads, strategies used in the ads and even the products being advertised. The current study is therefore a necessary first step in monitoring the changes anticipated in food marketing in Chile. As the new law restricts television HEFSS food advertising from 06.00 to 22.00 hours, the food industry may also strengthen the advertising in other platforms, particularly digital outlets. Therefore, future studies should monitor social media and food-related websites. The present study also facilitates future research linking changes in food advertising over time with children’s exposure to these ads, to see how advertising exposure, measured longitudinally, explains children’s understanding, attitudes and behaviour towards foods and food ads, including food purchase decisions and dietary intake.
Finally, Chile’s regulation emphasizes the reduction of energy, sugar, sodium and saturated fat in one’s diet, using three increasingly restrictive thresholds implemented in three phases. It is important to note that, based on the Global Burden Disease study( 63 ), promotion of healthy dietary patterns should include an emphasis on whole grains, fruits, vegetables and nuts/seeds, in addition to consuming less of the nutrients identified in the Chilean regulation. However, as our study focused on the Chilean regulation, we analysed advertising based on those critical nutrients and were able to project how varying those specific nutrient thresholds can yield important differences in the amount of advertising designated HEFSS, provided reformulation does not happen. It is important to acknowledge, however, that countries might differ widely in the nutrients and nutrient thresholds suggested for regulation, with corresponding variance in how much of the food market is being captured by those regulations. Future studies might therefore consider how international standards from such bodies as the WHO or Pan American Health Organization compare with individual countries’ own statutory regulations, in efforts to ascertain which regulatory actions are most effective in positively impacting the health of a given population.
Acknowledgements
Acknowledgements: The authors thank Chile’s National Television Council for providing the recordings of television programming. They also thank Bloomberg Philanthropies, the International Development Research Centre, the University of North Carolina Institute for Global Health & Infectious Diseases, and the Carolina Population Center for financial support. They thank Natalia Rebolledo Fuentealba and Donna Miles for their assistance with food categorization, Fernanda Mediano Stoltze for her assistance with the codebook, Camila Román and Camila Fierro for their assistance in coding, Frances Dancy for administrative assistance, Barry Popkin and Camila Corvalán for their leadership and support, and the Carolina Population Center for general support. Financial support: This work was supported primarily by Bloomberg Philanthropies, with additional support from the International Development Research Centre (IDRC) (grant numbers 107731-002 (INFORMAS) and 108180-001 (Institute of Nutrition and Food Technology–University of North Carolina (INTA–UNC))), the Chilean National Commission for Scientific and Technological Research (CONICYT) (grant number Fondecyt #1161436), the Carolina Population Center (grant number P2C HD050924), and the University of North Carolina Institute for Global Health & Infectious Diseases (Explorations in Global Health grant). Beyond financial support, funders had no role in the study design, data collection, analysis, or interpretation. Conflict of interest: None of the authors have conflicts of interest of any type with respect to this manuscript. Authorship: All authors contributed to the study design and writing of the paper. T.C. trained the coders, managed the data sampling and coding, conducted analyses and led the writing. M.R. secured the television sample and assisted with the nutritional profiling. L.P.S.T. managed the matching of advertisements to product nutritional profiles. F.R.D.C. contributed to the analysis and had primary responsibility for the final content. Ethics of human subject participation: This study was conducted according to the guidelines laid down in the Declaration of Helsinki. None of the procedures described in this article involved human subjects.
Appendix Definition of advertising strategies