

We have reported previously that in a randomized, crossover designed study in people with untreated type 2 diabetes, a diet in which the carbohydrate content was reduced from 55 to 40 % of food energy with a corresponding increase in protein from 15 to 30 %, and without a change in fat content, resulted in a decrease in percentage total glycohaemoglobin (%tGHb) of 0·8 at the end of the 5-week studyReference Gannon, Nuttall, Saeed, Jordan and Hoover1. Body weight was unchanged. The major effect on plasma glucose concentration was a reduction in the postprandial glucose excursions. The fasting glucose value was little changed.
Subsequently, we determined the effect on the circulating glucose concentration and %tGHb of a diet in which the protein content remained at 30 % of food energy. However, the carbohydrate content was decreased to 20 % and the fat content was increased to 50 % of food energy. After 5 weeks on this diet the %tGHb had decreased by 2·2 (from 9·8 to 7·6 %)Reference Gannon and Nuttall2. The 24 h glucose profile indicated not only a decrease in postprandial glucose excursions but also a decrease in the fasting glucose concentration. Indeed, the reduced 24 h glucose profile was approaching that in people without diabetes. Again, body weight did not decrease when compared to the standard diet (15 % protein, 30 % fat, 55 % carbohydrate).
Based on the above information we now have designed a diet containing the same high-protein content but with an increase in carbohydrate content from 20 to 30 % of food energy and with a corresponding decrease in fat content from 50 to 40 %. The objective was to determine if this increase in carbohydrate content would still result in a significant decrease in fasting glucose and a decrease in %tGHb which was similar to that when the carbohydrate content was 20 %. Such a diet would require a smaller adjustment from a typical American diet, and thus should be acceptable to more people. The results form the basis of this report. We refer to these diets as Low Biologically Available Glucose Diets (LoBAG Diets), i.e. LoBAG40 for 40 % carbohydrate, LoBAG20 for 20 % carbohydrate and LoBAG30 for 30 % carbohydrate in the diet, i.e. the present study.
In all of the studies a major goal has been to decrease diet-derived glucose since it is largely responsible for the postprandial rise in plasma glucose. Ingested gluconeogenic substrates (fructose, galactose and protein) result in only a modest and transient increase in glucose production rateReference Nuttall, Khan and Gannon3–Reference Gannon, Nuttall, Damberg, Gupta and Nuttall6. An increase in dietary protein also strongly stimulates insulin secretion and can further decrease the plasma glucose concentrationReference Nuttall, Mooradian, Gannon, Billington and Krezowski7–Reference Nuttall and Gannon10.
Research design and methods
Eight men with mild, untreated type 2 diabetes were studied in a special diagnostic and treatment unit (SDTU), similar to a clinical research centre. All participants met the National Diabetes Data Group criteria for the diagnosis of type 2 diabetes11, and were not being treated with oral hypoglycaemic agents during the study. Five of the subjects had been treated with oral hypoglycaemic agents prior to enrollment in the study. After enrollment, they were taken off that medication and followed biweekly until their fasting plasma glucose concentration stabilized. Once stabilized for approximately 6 weeks, the diet intervention was begun. None of the subjects had been treated with insulin. Participant characteristics are given in Table 1. The Department of Veterans Affairs Medical Center and the University of Minnesota Committees on Human Subjects approved the study, and all participants gave written informed consent prior to enrollment in the study. Exclusion criteria included: haematological abnormalities, kidney disease, liver disease, macroalbuminuria (>300 mg/24 h), congestive heart failure or untreated thyroid disease. Before the study, participants were interviewed to determine their physical activity profile, any food aversions, and to explain the study process and commitment in detail. Participants confirmed that they had been weight stable for at least 3 months. They were instructed to maintain their current activity level and medication dosage throughout the study. Two weeks before beginning the study, the participants completed a 3 d food questionnaire, with one of the days being a Saturday or a Sunday. This information was used to calculate the total food energy necessary to maintain body weight.
Patient characteristics

GHb, glycohaemoglobin.
For six of the eight subjects, a 5-week randomized crossover design was used with a ≥ 5-week washout period between diets. The control diet was designed according to the recommendations of the US Department of Agriculture12, 13 and the American Heart Association14 and consisted of 55 % carbohydrate, 15 % protein and 30 % fat (10 % monounsaturated, 10 % polyunsaturated, 10 % saturated). The study diet was designed to consist of 30 % carbohydrate, 30 % protein and 40 % fat. The SFA content of the diet was approximately 10 % of total food energy; thus, the majority of the fat was mono- and polyunsaturated. The diet composition and a sample menu are given in Table 2. Each patient was on a 6 d rotating menu for a total of 5 weeks. All food was provided. The results following the control diet were similar to results previously reportedReference Gannon, Nuttall, Saeed, Jordan and Hoover1, Reference Gannon and Nuttall2. Since the results of the test diet were so dramatic, and at the suggestion of a previous reviewer of our LoBAG20 diet publication, we did not do a crossover design for the last two subjects. For those two subjects, the fasting plasma glucose concentrations decreased from 269 and 316 mg/dl at the beginning of the test diet to 163 and 214 mg/dl at the end of 5 weeks. %tGHb decreased from 11·2 and 12·7 to 9·8 and 10·8 %, respectively. Net integrated 24 h glucose area response decreased from 1847 and 1142 to 548 and 335 mg h/dl. Total integrated 24 h glucose area response decreased from 8302 and 8717 to 4443 and 5470 mg h/dl, respectively.
Diet composition and sample menu

tbsp, tablespoon (~15 ml); tsp, teaspoon (~5 ml).
* One cup is approximately 240 ml.
Participants were admitted to the SDTU on the evening prior to the study. The next day, standardized meals containing 55 % carbohydrate, 30 % fat and 15 % protein were given for breakfast, lunch and dinner at 08.00, 12.00 and 18.00 hours. Participants were asked to remain in the SDTU during the study period with minimal activity.
On the second day in the SDTU, standardized meals again were given. In addition to the meals at 08.00, 12.00 and 18.00 hours, a snack was given at 20.00 hours. Fasting blood was obtained at 07.30, 07.45 and 08.00 hours. Samples then were collected every 15 min for the first hour after meals, every 30 min for the next 2 h, and then hourly until the next meal. Blood was drawn at a total of 46 time-points. After this 24 h data accumulation period, the participants were sent home with all of the necessary food for the next 2–3 d according to the LoBAG30 menu plan.
Participants returned to the SDTU every 2–3 d to pick up food and meet with the study dietitian and study coordinator. At that time, the subjects provided a urine specimen for analysis of creatinine and urea to determine dietary compliance. They also were weighed and had blood pressure, %tGHb and blood glucose measured. If their body weight decreased or increased on two successive occasions, the total food energy of the meals was increased or decreased as appropriate to attempt to maintain stable weight throughout the study. In addition, participants were interviewed regarding dietary compliance during each visit. At the end of the 5-week period, the participants again were admitted to the SDTU and blood was drawn as described earlier. At this time participants were given the meals (breakfast, lunch, dinner and snacks) appropriate for that day in the LoBAG30 menu rotation.
The plasma glucose concentration, HDL-cholesterol and total cholesterol were measured with the use of an automated method on an Ortho-Clinical Diagnostics Vitros 950 analyser (Raritan, NJ, USA). LDL-cholesterol was calculated with the Fridewald formula. The β-hydroxybutyrate concentration was determined by a colormetric assay (STANBIO, Boerne, TX, USA); %tGHb by boronate-affinity HPLC (BioRad Variant; BioRad Labs, Hercules, CA, USA); serum immunoreactive insulin using standard double-antibody RIA kits from Incstar (Stillwater, MN, USA); glucagon and C-peptide with RIA kits from Linco Research (St. Louis, MO, USA) and Diasorin (Stillwater), respectively. Subjects were weighed in street clothes without shoes on a digital scale (Scalitronix, White Plains, NY, USA). Blood pressure was determined using a Dinemap instrument (Critikon/Mediq, Pennsauken, NJ, USA).
The net 24 h incremental area responses were calculated using the overnight fasting value as baseline. This reflects the postprandial area response. Total 24 h area responses were calculated using zero as the baseline. The total area response reflects both the fasting and postprandial area responses. Both area calculations were done using a computer program based on the trapezoid rule. Statistics were determined using Student's t test for paired variates, with the Statview 512+ program (Brain Power, Calabasas, CA, USA) for the Macintosh computer (Apple Computer, Cupertino, CA, USA). Criterion for significance was set at P < 0·05. Data are presented as the means and their standard errors. Prospective power calculation, using %tGHb as the primary endpoint, with β equal to 80 %, resulted in n 3.
Results
The average body weight was 94 (se 5·1) kg (206 (se 11·3) lb) before the diet (Fig. 1(a)). At the end of the 5 weeks on the diet, the average weight was essentially unchanged 93 (se 5·1) kg (204 (se 11·2) lb).
(a), Mean weekly body weight before and for 5 weeks while on the LoBAG30 diet. Values are means with their standard errors depicted by vertical bars. (b), Plasma β-hydroxybutyrate concentration pre (Δ) and post (●) 5 weeks on the LoBAG30 diet. Insert: Net and total 24 h integrated β-hydroxybutyrate area response pre (□) and post (■) 5 weeks on the LoBAG30 diet. Net areas are calculated using the fasting concentration as baseline. Total areas are calculated using zero as baseline B, L, D, S refer to breakfast, lunch, dinner and snack respectively.
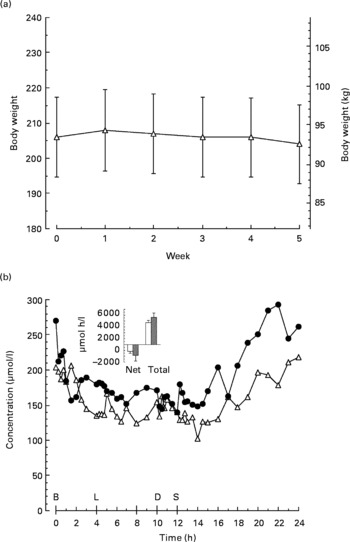
Urine ketones were monitored twice weekly while participants were on the LoBAG30 diet, using nitroprusside-impregnated tablets (Bayer, Elkhart, IN, USA). They were negative with two exceptions, one trace and one small positive.
The 24 h plasma β-hydroxybutyrate concentration (Fig. 1(b)) was modestly higher after the LoBAG30 diet, but not significantly.
The mean fasting plasma glucose concentration decreased from 227 (se 18·6) mg/dl (12·6 (se 1) mmol/l) to 137 (se 14·5) mg/dl (7·6 (se 0·8) mmol/l; P = 0·001) after 5 weeks on the diet (Fig. 2(a)). The mean 24 h integrated net glucose area response decreased from 1269 (se 269) mg h/dl (70·5 (se 14·9) mmol h/l) to 449 (se 129) mg h/dl (24·9 (se 7·2) mmol h/l; P = 0·001; Fig. 2(a, insert)). The total area response decreased from 6717 (se 501) mg h/dl (373 (se 27·8) mmol h/l) to 3724 (se 348) mg h/dl (207 (se 19·3) mmol h/l; P = 0·0001, Fig. 2(a, insert)).
(a), Mean plasma glucose concentration pre (Δ) and post (●) 5 weeks on the LoBAG30 diet. Values are means with their standard errors depicted by vertical bars. Insert: Net and total 24 h integrated glucose area response pre (□) and post (■) 5 weeks on the LoBAG30 diet. Mean values were significantly different from those of the pre group: *P < 0·05. (b), Mean serum insulin concentration pre (▲) and post (●) 5 weeks on the LoBAG30 diet. Insert: Net and total 24 h integrated glucose area response pre and post 5 weeks on the LoBAG30 diet B, L, D, S refer to breakfast, lunch, dinner and snack, respectively.

The mean fasting serum insulin concentration was unchanged (8·4 (se 1·1) μU/ml (50·4 (se 6·6) pmol/l) and 9·0 (se 1·0) μU/ml (54 (se 6) pmol/l) before and after 5 weeks on the diet, respectively (Fig. 2(b)). The mean 24 h integrated net insulin area response and the total integrated insulin area response also remained essentially unchanged after 5 weeks on the diet (Fig. 2(b, insert)).
The mean fasting serum C-peptide concentration also was unchanged after 5 weeks on the diet (0·6 (se 0·1) to 0·8 (se 0·2) ng/ml, P = 0·3; 0·2 (se 0·03) to 0·3 (se 0·07) nmol/l; data not shown). The 24 h time course response was similar to the insulin response. The net C-peptide area also was essentially unchanged (11·4 (se 2·4) to 10·6 (se 1·4) ng h/ml; 3·8 (se 0·8) to 3·5 (se 0·5) nmol h/l; P>0·05). The 24 h total area did not change before or after the diet, 25 (se 2·9) to 25·8 (se 2·5) ng h/ml, respectively (8·3 (se 1·0) to 8·5 (se 0·8) nmol h/l).
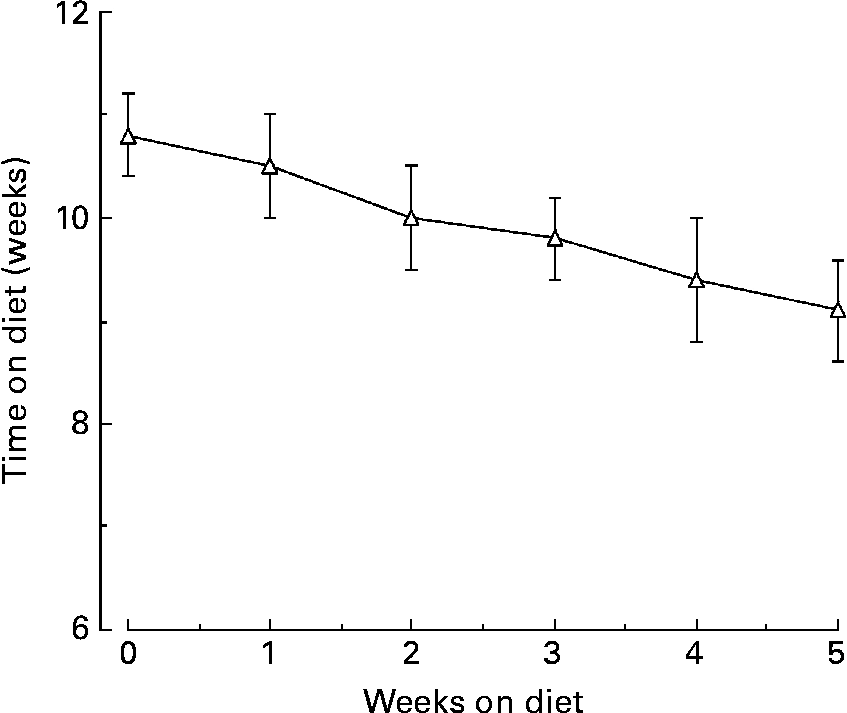
The mean %tGHb decreased from 10·8 (se 0·4) before to 9·1 (se 0·5) %, after the diet, respectively (P < 0·0001; Fig. 3). In addition, at the end of the study it was still decreasing in an essentially linear fashion.
Mean percentage total glycohaemoglobin (%tGHb) response during the 5 weeks of the LoBAG30 diet. A statistically significant decrease occurred at week 1 (P = 0·039).
The mean fasting plasma glucagon concentrations were similar before and after the diet, 76 (se 3·1) and 77 (se 11·1) pg/ml, respectively (76 (se 3·1) and 77 (se 11·1) ng/l) (Fig. 4(a)). Both the 24 h integrated net response and the 24 h total area responses were modestly increased after 5 weeks on the diet (Fig. 4(a, insert)). These were not statistically significant (P = 0·33 and P = 0·32, respectively).
(a), Mean plasma glucagon concentration pre (Δ) and post (●) 5 weeks on the LoBAG30 diet. Insert: Net and total 24 h integrated glucose area response pre (□) and post (■) 5 weeks on the LoBAG30 diet. (b), Mean serum TAG concentration pre (Δ) and post (●) 5 weeks on the LoBAG30 diet. Insert: Net and total 24 h integrated TAG area response pre (□) and post (■) 5 weeks on the LoBAG30 diet. Mean values were significantly different from those of the pre group: *P < 0·05 B, L, D, S refer to breakfast, lunch, dinner and snack, respectively.

The mean fasting plasma TAG concentration significantly decreased from 190 (se 24·5) to 113 (se 9·4) mg/dl (2·1 (se 0·3) to 1·3 (se 0·1) mmol/l) after 5 weeks on the diet (P = 0·007; Fig. 4(b)). Although the 24 h net area was not decreased significantly (Fig. 4(b, insert)), the 24 h total area response was significantly decreased from 5695 (se 806) to 3586 (se 326) mg h/ml (63·8 (se 9·0) to 40·2 (se 3·7) mmol h/l) (P = 0·008; Fig. 4(b, insert)).
The total cholesterol concentration significantly decreased from 189 (se 15) to 152 (se 11) mg/dl (4·9 (se 0·4) to 3·9 (se 0·3) mmol/l) after 5 weeks on the diet (P = 0·004). The plasma LDL-cholesterol and HDL-cholesterol concentrations decreased but not significantly, 113 (se 14) to 95 (se 10) mg/dl and 37 (se 2) to 34 (se 2) mg/dl, respectively (2·9 (se 0·4) to 2·5 (se 0·3) and 1·0 (se 0·1) to 0·9 (se 0·1) mmol/l, respectively) (P = 0·09 and P = 0·18, respectively).
Other results such as blood urea nitrogen (BUN), creatinine and protein metabolized have been published separatelyReference Nuttall, Schweim, Hoover and Gannon15.
Discussion
The objective in the present study was to determine if increasing the carbohydrate content from 20 % (LoBAG20) to 30 % (LoBAG30) with a corresponding decrease in fat content would still result in a decrease in fasting glucose, as well as a decrease in postprandial excursions, and thus result in a more dramatic decrease in glycohaemoglobin than when the carbohydrate content was 40 % (LoBAG40). When the carbohydrate content was 40 %, only the postprandial excursions were decreased. The fasting glucose concentration remained unchanged.
The current LoBAG30 diet resulted in both a decrease in postprandial glucose and in the overnight fasting glucose concentration. Indeed, the decreases were nearly as great as with the LoBAG20 dietReference Gannon and Nuttall2. The total 24 h integrated glucose areas were 6717 v. 3724 and 4746 v. 3023 mg h/dl before and after the LoBAG30 and LoBAG20 diets, respectively. The decreases in %tGHb were 1·7 and 2·2, respectively, and not significantly different (P = 0·17).
As previously reported, the study was designed to be 5 weeks in duration because 33 d has been reported to be the half-time for %tGHb to reach a new steady stateReference Rech16. If this is the case, then the anticipated final %tGHb in the present study would be approximately 7·4 % (i.e. 1·7 × 2 = 3·4; 10·8 − 3·4 = 7·4 %).
With the %tGHb method we use, each 1 % tGHb represents approximately 20 mg/dl glucose integrated over a 24 h periodReference Nuttall17. Using this information and the 24 h integrated glucose concentration observed at the end of the 5 weeks on the LoBAG30 diet, the estimated final %tGHb would be 6·5 %. In the previous LoBAG20 study the calculated %tGHb at the end of the 5 weeks was 6·3 %Reference Gannon and Nuttall2. Thus, both diets have the potential to normalize or nearly normalize the blood glucose in people with mild to moderately severe type 2 diabetes.
As indicated previously, the decrease in postprandial glucose concentration observed can easily be explained by the smaller amount of carbohydrate in the diet and thus the smaller amount of glucose absorbed after ingestion of the meals. The reason for the greatly decreased fasting glucose is uncertain but could be the consequence of a reduced store of glycogen and thus a decrease in glycogenolysis rateReference Nilsson, Furst and Hultman18.
The subjects' weights remained relatively unchanged (Fig. 1). Thus, weight was not a contributing factor to the improvement in fasting and postprandial glucose.
The LoBAG30 diet did not result in a decrease in 24 h integrated insulin concentration (either net or total), in spite of the dramatic decrease in integrated glucose concentration. Therefore, it is likely some dietary factor other than absorbed glucose stimulated insulin secretion. Most likely this was due to the high protein content of the dietReference Nuttall, Mooradian, Gannon, Billington and Krezowski7. Alternatively, the diet could have re-set the β-cell sensitivity to circulating glucose concentrations.
Dietary protein is known to not only increase the circulating insulin concentration, it also stimulates an increase in circulating glucagon concentrationReference Unger and Orci19. Nevertheless, in spite of the increase in dietary protein, the 24 h integrated glucagon concentration was only slightly increased. The reason for this is unclear.
The fasting plasma TAG concentrations decreased, and the decrease was essentially the same as with the LoBAG20 diet, i.e. 60 and 61 %, respectively. However, the plasma total cholesterol significantly decreased with the LoBAG30, but not with the LoBAG20 dietReference Gannon and Nuttall2. The mean LDL-cholesterol and HDL-cholesterol concentration changes were not significant with either diet.
In a study of people with type 2 diabetes by Garg et al.Reference Garg, Bantle, Henry, Coulston, Griver, Raatz, Brinkley, Chen, Grundy, Huet and Reaven20, the carbohydrate content of the diet was decreased from 55 to 40 % and the fat content was increased from 30 to 45 % by increasing the MUFA content of the diet. The lower carbohydrate/higher fat diet resulted in an 18 % decrease in fasting TAG. In the present study, the lower carbohydrate/higher fat diet resulted in a 41 % decrease in fasting TAG. However, our lower carbohydrate diet contained 10 % less carbohydrate than the diet used by Garg et al. In neither study were the LDL-cholesterol or HDL-cholesterol concentrations significantly different than with the higher carbohydrate diet used for comparison. Thus, both the present study and that of Garg et al. suggest that a higher fat diet did not adversely affect the plasma/serum lipid profile under the conditions of these studies. A lower TAG concentration theoretically would mean the presence of a more salutary overall lipid profile, particularly since it is commonly associated with a reduction in small, dense lipid particlesReference Gaziano, Hennekens, O'Donnell, Breslow and Buring21.
As indicated in the introduction, we were interested in the glucose and insulin responses to an increase in the carbohydrate content because the diet would likely have better long-term acceptance. For example, in the present study the average food energy content was approximately 11 924 kJ/d (2850 kcal/d). Since carbohydrate is 30 % of the total food energy in the diet, this represents 3577 kJ (855 kcal) or approximately 214 g carbohydrate, or the equivalent of about fourteen slices of bread. The present diet also clearly was not ketogenic. The plasma β-hydroxybutyrate concentration was nearly the same before and 5 weeks after the subjects received the LoBAG30 diet.
Potential limitations of the study
The number of subjects proposed for the study was determined by the mathematical analysis for predicting nReference Glasnapp and Poggio22, based on difference between means and sample variance. To show a change of 1·5 in %tGHb using 0·05 as the level of significance, setting the type II error at 0·2 (80 % power), with sd 0·9, assuming a mean %tGHb of 9 % and solving for n indicated that three subjects would be required. Since multiple comparisons were done, n was increased to eight. Therefore, this small study is significantly powered to show significant differences before and after the diet. Nevertheless, the present results should be considered to be merely a proof of concept. Only men were studied; the diet was highly controlled and was of a relatively short duration. Subjects were still able to secrete insulin. Therefore, similar results may not be obtained in patients with advanced type 2 diabetes who have a limited capacity to secrete insulin.
Generalization of the present results will depend on additional longer-term studies in which both men and women and different age and ethnic groups with varying duration of diabetes are included. Use of a greater variety of foods also would be desirable. In the present study the subjects were limited to a 6 d rotating menu. Also foods used were limited by those available from hospital supplies.
In conclusion, increasing the dietary carbohydrate from 20 to 30 % of total food energy and with a 30 % protein content resulted in a similar decrease in fasting plasma glucose and overall decrease in %tGHb. The present diet did not significantly effect glucagon, insulin or lipids, with the exception of a small decrease in total cholesterol and a major decrease in TAG concentration. In addition, a 30 % carbohydrate diet should be more acceptable than a 20 % carbohydrate diet and result in better compliance as a treatment option.
Acknowledgements
This study was supported by grants from the American Diabetes Association, and the Minnesota Beef Council and merit review funds from the Department of Veterans Affairs. We thank the participants for volunteering for these studies, Jan Thurgood, Linda Hartich, the staff of the SDTU and the Clinical Chemistry Laboratory for excellent technical expertise, and Rachel Anderson for excellent secretarial support.


