


Homelessness is a global issue. In England, over 68 500 households in 2015 were classified as homeless( 1 ) and a further 3569 were considered rough sleepers( 2 ). The lack of stable accommodation, in conjunction with a low or absent income, raises challenges for the homeless, one of which is access to food, although this is likely to differ between rough sleepers and those in temporary accommodation. However, despite the widespread prevalence of homelessness, relatively few studies have sought to determine the nutritional status of these individuals, a situation that may partly reflect the difficulty in collecting data from this transient population.
Despite this, several themes have emerged from studies to date, including a high-SFA, low-fruit and vegetable diet( Reference Rushton and Wheeler 3 – Reference Darmon, Coupel and Deheeger 6 ), elevated serum cholesterol( Reference Luder, Boey and Buchalter 7 ) and low levels of vitamin B6, Ca and Fe( Reference Luder, Boey and Buchalter 7 , Reference Wolgemuth, Myers-Williams and Johnson 8 ), although findings have not been consistent between countries. For example, lower skin-fold thickness and muscle mass measurements have demonstrated ‘wasting’ in homeless communities in Germany and the USA (1989–2001)( Reference Langnäse and Müller 4 , Reference Luder, Boey and Buchalter 7 , Reference Wolgemuth, Myers-Williams and Johnson 8 ), whereas others have found a proportion of homeless that, according to their BMI, are overweight or obese in the USA (2012–2013)( Reference Koh, Hoy and O’Connell 9 , Reference Tsai and Rosenheck 10 ).
In the presence of physiological stresses arising from exposure to harsh environmental conditions, the absence of a nutritionally balanced diet is likely to have a detrimental impact on the health of a homeless individual. Elevated levels of acute and chronic disease( Reference Hwang 11 , Reference Homeless 12 ), increased visits to emergency departments( Reference Kushel, Vittinghoff and Haas 13 ) and an average age of death of 47 years in the UK( Reference Thomas 14 ) highlight the additional challenges faced by the homeless community. CVD, for which diet is a key modifiable factor, is reported as the leading cause of mortality in homeless adults between 45 and 65 years( Reference Hibbs, Benner and Klugman 15 , Reference Hwang, Orav and O’Connell 16 ).
A higher prevalence of mental illness (e.g. depression, anxiety) in the homeless compared with the general population has also been reported( Reference Homeless 12 , Reference Krausz, Clarkson and Strehlau 17 ). Reward mediated behaviours such as problematic alcohol use, smoking and substance misuse are also frequently described( Reference Langnäse and Müller 4 , Reference Homeless 12 ). The reported substitution of food with alcohol by alcoholic homeless individuals( Reference Langnäse and Müller 4 ) and the use of money for illicit substances as opposed to food in homeless drug addicts( Reference Homeless 12 ) demonstrates the potential nutritional consequences arising from reward mediated behaviour. Addictive substances may also impact upon the absorption, metabolism and/or requirements for nutrients( Reference Lykkesfeldt, Christen and Wallock 18 , 19 ).
Habitual diets and culture limit the extent to which nutrient intake of the homeless is comparable between countries or regions( Reference Kubisová, Adámková and Lánská 20 ). Furthermore, studies have often failed to account for the impact of physical and mental wellbeing on dietary intake; do not use a control group and have widespread reliance on dietary reference values (DRV), which is potentially misleading. Comparing homeless and housed individuals within the same region would overcome this issue, providing a more accurate assessment of homeless intake in the specific location. However such studies are currently lacking.
The aim of the present research was to compare nutritional status, dietary intake and mental wellbeing in a group of homeless with age and sex-matched housed individuals (control group) in Reading, UK. A secondary aim was to establish the marginal impact of homeless status (e.g. street homeless v. hostel residents) on these parameters.
Methods
Participants and study design
In this cross-sectional observation study homeless (n 75) and housed (n 75) men and women were recruited. During recruitment, the two groups were broadly matched on the basis of age range (18–29, 30–39, 40–49, >50 years), sex and ethnicity. In order to capture homeless individuals at the more extreme stages of homelessness this study only included individuals ‘living rough’ on the street and those in the initial stages of housing (supported living). Street homeless were recruited from a church drop-in centre that provides hot meals. Two hostels (charity and council led) were used to recruit individuals residing in ‘stage 1’ accommodation. In addition to accommodation for adults previously living on the street, the charity-led hostel also provides ‘in house’ meals. Recruitment posters were displayed in each venue by staff, and residents/clients recruited on a first-come basis. Housed volunteers were recruited at random through a volunteer database at the Hugh Sinclair Unit of Human Nutrition, Reading, and via posters displayed at Reading central library and around the Reading University campus. The University of Reading School of Chemistry, Food and Pharmacy Research Ethics Committee (approval no.: 20/14) and The Salvation Army Ethics Committee granted ethical approval for the study. All participants gave informed written consent before participation.
Data collection
Each participant completed three questionnaires during a single research session. A room was provided at each venue for the purpose of the study and one of four trained researchers and a volunteer from the specific venue were present during each session. Each volunteer was provided with the option of either completing the questionnaires themselves or being asked the questions by the researcher. For those opting to self-complete the questionnaires, responses were checked and verified before departure. Questionnaires took between 60 and 90 min to complete. Volunteers were reimbursed for their participation in the study via a £10 shopping voucher.
Questionnaires
To assess nutrient intake, the European Prospective Investigation into Cancer and Nutrition (EPIC)-Norfolk FFQ was used. The FFQ is a validated semi-quantitative questionnaire consisting of 130 food and drink items( Reference Sprake, Russell and Barker 21 , Reference Bingham, Welch and McTaggart 22 ). For each item the participant is required to choose one out of nine possible frequency options ranging from ‘never/less than once a month’ to ‘6+/d’. FFQ are typically completed with reference to the preceding 6 months to 1 year. However to ensure reported nutrient intake related to the time an individual was homeless, participants were asked to complete the FFQ with reference to the last month only, as some had been homeless for one to two months. FFQ EPIC tool for analysis software was used to determine daily nutrient levels from the FFQ responses, which is based upon McCance and Widdowson’s The Composition of Foods (5th edition) and its supplements( Reference Mulligan, Luben and Bhaniani 23 ). Energy, macronutrients (including sub-classes of fats and carbohydrates), key vitamins and minerals (associated with public health concerns), and fourteen food groups (alcoholic beverages, cereal and cereal products, egg and egg dishes, fats and oils, fish and fish products, fruit, meat and meat products, milk and milk products, non-alcoholic beverages, nuts and seeds, potatoes, soups and sauces, sugars; preserves and snacks and vegetables) were reported in the present analysis.
The validated Patient Health Questionnaire: Somatic Anxiety and Depressive Symptoms (PHQ-SADS) was used to determine the presence of symptoms related to a mental health condition( Reference Kroenke, Spitzer and Williams 24 ). It combines three questionnaires to screen for the presence of depression (PHQ-9), anxiety (GAD-7) and somatization (PHQ-15) disorders. Each part of the questionnaire resulted in a score from which individuals are categorised as ‘none’, ‘mild’, ‘moderate’ or ‘severe’ with relation to the presence of depressive, anxiety and/or somatic symptoms.
A ‘Health and Lifestyle’ questionnaire formulated specifically for the present study was used to record demographic data as well as information about smoking, alcohol and substance abuse. The questionnaire consisted predominantly of quantitative questions requiring a yes/no answer. Individuals were also asked about their appetite, meal frequency and the amount of money spent on food using questions, as per previous studies on nutritional status and homelessness( Reference Luder, Boey and Buchalter 7 ).
Physiological measurements
A stadiometer (Seca 213; Seca Medical Measuring Systems) and calibrated electrical scales (Seca 877; Seca Medical Measuring Systems) were used to measure height and weight respectively using standard operating procedures. BMI was calculated as weight (kg)/height (m2) and classified in accordance with the WHO guidelines( 25 ). The mean of three handgrip strength measurements of the participant’s dominant hand using a hand-held dynamometer (Takei 5001; Takei Scientific Instruments Co.) provided a non-invasive measure of general muscle strength( Reference Lauretani, Russo and Bandinelli 26 ). Blood pressure measurements were taken in triplicate using an automated blood pressure monitor (M10-IT; Omron Healthcare Ltd). In order to assess CVD risk, the online ‘QRISK 2-2015 Web Calculator’ was used to estimate the 10-year risk of developing CVD( Reference Hippisley-Cox, Coupland and Vinogradova 27 ).
Statistical analysis
The study was powered using previous comparison of energy intake (kJ) in homeless and domiciled male youths in Toronto( Reference Tarasuk, Dachner and Li 28 ). Using G*Power( Reference Faul, Erdfelder and Lang 29 ), it was estimated that sixty-eight participants would be required in each group for a 2385 kJ energy difference with sd of 6408 kJ (α level P=0·05, 1-β power 0·85). Estimated samples sizes based on differences in total fat (g), protein (g), vitamin B6 (mg) and Ca (mg) were lower (range n 12–32/group). To allow for a 10 % dropout or incomplete data collection a total of seventy-five participants were recruited per group.
Means and standard deviations were used to describe parametric distributed data, and medians and 95 % CI for non-parametric distributed data. Counts and percentages were used for categorical variables. Homeless and housed groups were broadly matched for their sex, age range and ethnic category during the data collection stage. Data were checked for normality of distribution, and where possible skewed variables were transformed using log10. Parametric data were analysed using general linear models and non-parametric using independent samples Mann–Whitney U tests for the comparison of continuous variables. For categorical variables chi-squared tests were used to assess for differences between the two groups. P<0·05 was classified as significant. Data were analysed using SPSS Statistics 21·0 (IBM).
Results
Participant characteristics
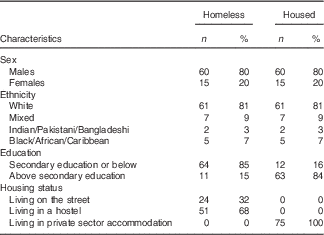
Demographic information of the homeless (n 75) and housed (n 75) groups is shown in Table 1. The mean age was 38 (sd 11) years (range 19–59 years) for the homeless and 38 (sd 11) years for the housed participants (range 20–59 years). Ethnicity and sex distributions were matched between groups. With regards to education, there was a significant difference in attainment between groups (P<0·001); whilst the majority of homeless individuals had achieved secondary education or lower education (O-Level’s/GCSE’s and primary education), the majority of the housed group had attained above secondary level with 25 % (n 19) reporting higher degrees compared with 4 % (n 3) in the homeless group. Homeless individuals consisted of those sleeping rough on the street (n 24) or residing in council-led (n 22) or charity-led (n 29) hostels. All housed individuals lived in private sector accommodation consisting of rented, mortgaged or owned property.
Demographic characteristics of homeless (n 75) and housed (n 75) adults (Numbers and percentages)
Responses of both groups to questions regarding reward mediated behaviour, meal consumption and cooking facilities are shown in Table 2. Significantly more homeless compared with housed individuals reported that they smoked (P<0·001) and/or had taken illicit substances within the preceding month (P<0·001). There was no significant difference between the number of individuals who reported consuming alcohol, although significantly more of the homeless (35 %, n 18) compared with housed (8 %, n 5) individuals who consumed alcohol reported intakes above the recommended weekly intake of 14 units (UK) for men and women (P<0·001, data not shown). The majority of homeless individuals reported consuming one or two meals per day in contrast to the housed that predominantly reported three meals daily (P<0·001). In addition, significantly less homeless participants reported having enough to eat, a good appetite and cooking facilities (all comparisons, P<0·001). For the homeless individuals reporting cooking facilities, the majority only had access to a microwave in a communal living space whereas all housed participants reported a full kitchen in their accommodation. A greater proportion of homeless individuals reported receiving <£150 ($200) and spending <£50 ($67) on food per week compared with housed individuals (all comparisons, P<0·001).
Responses by homeless (n 75) and housed (n 75) groups to behavioural questionsFootnote * (Numbers and percentages)
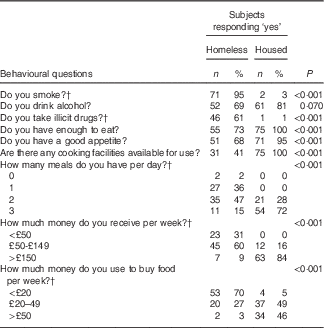
* Data were analysed using χ 2 tests comparing homeless and housed responses on each characteristic.
† Analysed using Fisher’s exact test with Freeman–Halton extension for contingency tables >2×2.
Physiological and psychological characteristics
There was no significant difference in BMI between the two groups as shown in Table 3. However, a greater number of homeless (66·6 %) had a BMI<24·9 kg/m2, with 5·3 % classified as underweight (BMI<18·5 m2), whereas half (50·6 %) of the housed group were classified as overweight and obese (BMI>25 kg/m2) and none as underweight. Despite this 4 % more homeless adults (21·3 v. 17·3 % for housed) were also classified as obese (BMI>30 kg/m2). The homeless had a significantly higher mean diastolic blood pressure (DBP) (P=0·008) and mean QRISK-2 score (P=0·009) compared with the housed, with no significant difference in systolic blood pressure (SBP) or handgrip strength.
Physiological characteristics, Patient Health Questionnaire-9 for depressive symptoms (PHQ-9) Somatic Anxiety Depressive Symptoms and QRISK-2 scores for homeless (n 75) and housed (n 75) adultsFootnote * (Mean values and standard deviations; medians and 95 % confidence intervals)
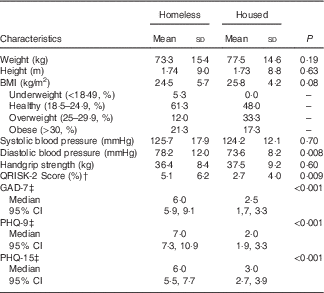
GAD-7, general anxiety disorders-7 for anxiety symptoms; PHQ-15, Patient Health Questionnaire-15 for somatic symptoms.
* Data were analysed using independent t tests.
† Estimated risk of developing CVD over the next 10 years.
‡ Analysed using independent samples Mann–Whitney U test.
Homeless individuals scored significantly higher than the housed group for the presence of somatic (PHQ-15), anxiety (GAD-7) and depressive (PHQ-9) symptoms (all comparisons, P<0·001) with a mean classification of ‘mild’ (score range 5–9) for each condition (Table 3). In total, 24 % (n 18) of homeless adults reported mental illness diagnoses (depression, n 11; schizophrenia, n 1, multiple diagnoses, n 5; undisclosed diagnosis, n 1) and 4 % (n 3) of housed adults (all depression).
When comparing street homeless (n 24) with first-stage living hostel residents (n 51), no significant differences were observed for weight, BMI, SBP, DBP or PHQ-SADS scores (Table 6). There was a trend for higher handgrip strength in street homeless participants compared with first-stage living hostel residents (P=0·058), although the difference failed to reach significance. Mean duration of street homelessness was 5·4 (sd 6·8) months and hostel residency 9 months (sd 9·3).
Nutritional intake
Homeless individuals reported a significantly higher mean daily intake of total fat (P=0·049), SFA (P=0·002), MUFA (P=0·026) and alcohol (P<0·001), as a percentage of energy intakes, compared with the housed group (Table 4). In contrast, carbohydrate (P<0·001) and protein (P=0·011) accounted for a significantly lower percentage of energy in the homeless group. Mean daily intake of NSP was significantly lower in homeless compared with homed individuals (P<0·001). Further comparison of daily NSP intake with the UK recommended level of 18 g( 30 ) highlighted that the majority of homeless (n 58, 77 %) and homed (n 46, 61 %) individuals had an intake below 18 g (data not shown). Removal of over-reporters (n 2, homeless adults) did not alter the statistical findings (data not shown). Although total energy intake did not differ between street homeless and hostel residents, mean SFA intake (percentage of total energy intake (%TE)) was significantly higher for hostel residents (P=0·010).
FFQ-derived daily energy and nutrient intake for homeless (n 75) and housed adults (n 75)Footnote * (Mean values and standard deviations)
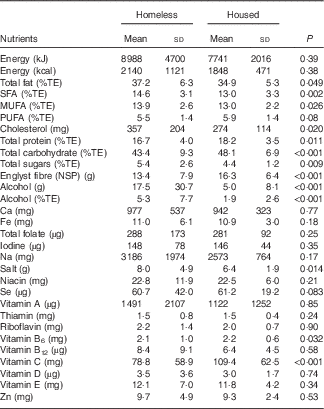
%TE, percentage of total energy intake.
* Data were analysed using independent t tests.
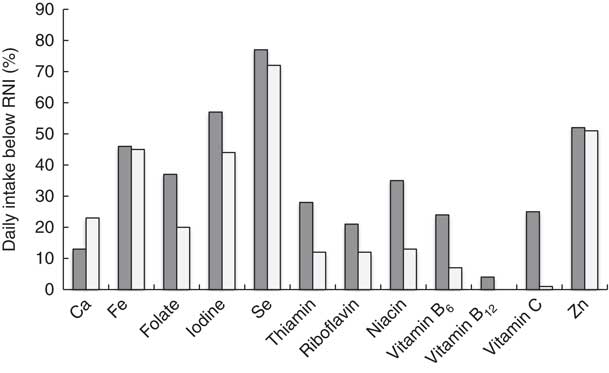
Micronutrient data (Table 4) demonstrated a significantly higher mean daily intake of salt in the homeless compared with housed group (P=0·014). In contrast, vitamin C intake was significantly lower in the homeless compared with housed (P=<0·001). Daily intake for the majority of individuals in both the homeless and homed groups was found to meet or exceed the recommended nutrient intake (RNI) (32) for most of the micronutrients measured including vitamin C. In contrast, 58 (77 %) homeless and 54 (72 %) homed individuals had below the lower reference nutrient intake (LRNI) for Se (Fig. 1). Approximately half of the homeless (n 39, 52 %) and homed (n 38, 51 %) groups failed to meet the Zn LRNI. Although the majority of homeless (n 40, 53 %) and homed (n 41, 55 %) individuals met the Fe LRNI, these were predominantly men. Consequently for women, thirteen out of fifteen homeless and all of the fifteen women in the homed group failed to reach the Fe LRNI of 14·8 mg (data not shown). In contrast to Fe, the majority of homeless (n 61, 81 %) and homed individuals (n 67, 89 %) reported a Na intake above the LRNI of 1600 mg. Of these individuals 45 (60 %) homeless and 42 (56 %) homed consumed above the recommended maximum salt level of 6 g.
Homeless (![]() ) and housed (
) and housed (![]() ) individuals with daily intake below LRNI for each micronutrient. Values are percentages of individuals who did not meet the daily recommended nutrient intake for each micronutrient, homeless (n 75) and housed (n 75).
) individuals with daily intake below LRNI for each micronutrient. Values are percentages of individuals who did not meet the daily recommended nutrient intake for each micronutrient, homeless (n 75) and housed (n 75).
Division of FFQ data into food groups is shown in Table 5. The mean daily homeless diet consisted of significantly higher amounts of alcoholic beverages (P<0·001), fats/oils (P=0·023), meat and meat products (P=0·037) and potatoes (P=0·035). In contrast, the homeless compared with homed diet was composed of a significantly lower amount of fruit and nuts and seeds (P<0·001), and vegetables (P=0·022). Removal of individuals reporting mental health diagnoses (n 21) resulted in a loss of significant difference in intake of fats/oils (P=0·18) between the groups; no other findings were altered.
Daily intake of the fourteen food groups derived from FFQ analysis for homeless (n 75) and housed (n 75) adultsFootnote * (Mean values and standard deviations)
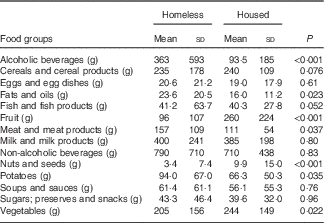
* Data analysed using general linear models.
Ca, iodine and riboflavin intakes were all significantly lower in street homeless compared with first-stage living hostel residents (P<0·05) (Table 6). Hostel residents were found to consume significantly greater quantities of milk (P=0·001) and potato (P=0·012), and less soups and sauces (P=0·047). There was also a trend for greater sugary snack consumption in hostel residents (P=0·052).
Subject characteristics and nutritional intake for street homeless (n 24) and first-stage living hostel residents (n 51)Footnote * (Mean values and standard deviations; medians and 95 % confidence intervals)
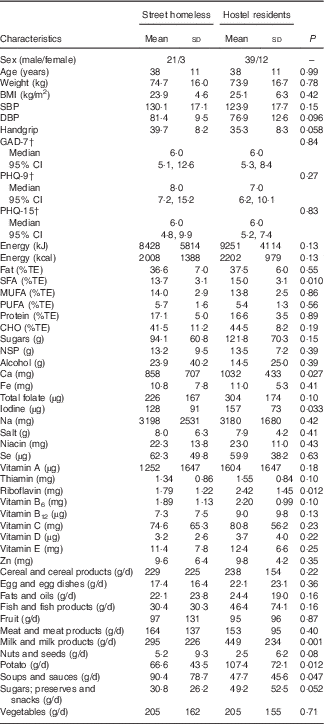
SBP, systolic blood pressure; DBP, diastolic blood pressure; GAD-7, general anxiety disorders-7 for anxiety symptoms; PHQ-9, Patient Health Questionnaire-9 for depressive symptoms; PHQ-15, Patient Health Questionnaire-15 for somatic symptoms; %TE, percentage of total energy intake.
* Data were analysed using general linear models.
† Analysed using independent samples Mann–Whitney U tests.
As a sensitivity analysis, data analysis was repeated in males only (n 120) and in participants reporting ‘white’ ethnicity (n 122). The identified significance differences were similar following removal of females, although just a tendency for a lower vitamin B6 intake in the homeless was observed (P=0·078). Analysis in only white participants led to an additional significant difference for PUFA (5·51 (sd 1·41) % homeless, 5·91 (sd 1·36) % housed, P=0·031).
Discussion
The present study compared dietary intake, nutritional status and mental wellbeing of homeless and housed adults in Reading. Our findings suggest that homeless adults have a higher risk of CVD and incidence of anxiety and depressive symptoms, and poorer dietary and nutrient intake than housed adults. Homeless diets were characterised by high consumption of meat and meat products, fats and oils and alcoholic beverages, and significantly lower intakes of fruits, vegetables, nuts and seeds than housed comparators. Street homeless were at particular risk of Ca and iodine deficiency, and had a significantly lower intake of milk and milk products than hostel residents.
Although no significant difference in energy intake was observed between homeless and housed adults, 27 % of homeless reported not having ‘enough to eat’ and 38 % reporting having ≤1 meal/d. There was also a trend (P=0·080) for a lower BMI in the homeless group. In the present study, both homeless and housed intakes of total fat and SFA exceeded the UK recommended intakes (total fat, 34 %TE; SFA, 10 %TE)( 30 ). However, homeless adults reported significantly higher intake of these fats, as observed previously in the homeless community( Reference Luder, Boey and Buchalter 7 , 31 ). This may be attributed to their greater intakes of meat and meat products (e.g. sausages, minced beef and processed sliced meat) and fats and oils (e.g. butter). SFA intake was also significantly higher in hostel residents than street homeless, which supports previous data that charitable meal provision is weighted towards sugar and fat energy( Reference Pelham-Burn, Frost and Russell 32 ). Homeless adults reported a significantly lower intake of carbohydrate and protein derived energy.
Englyst NSP intake was below the recommended daily intake of 18 g/d( 30 ) in both housed and homeless groups. However, significantly lower intakes of NSP were reported in the homeless group (no difference between street homeless and first-stage living hostel residents), which may be due to their lower fruit and vegetable intake. A diet low in fruit, vegetables and fibre has been reported previously in the homeless community( Reference Rushton and Wheeler 3 – Reference Hickey and Downey 5 ). In the present study, a greater disparity in fruit intake between homeless and housed participants than vegetables was observed (170 v. 19 % higher in housed respectively); this may reflect the type of meals (hot meals including vegetables( Reference Hoyumpa 36 )) available to the homeless population and lack of fresh fruit provided. In line with a low fruit intake, a significantly lower intake of vitamin C was observed in the homeless, supporting previous studies( Reference Darmon, Coupel and Deheeger 6 , Reference Malmauret, Leblanc and Cuvelier 33 ). However the majority of homeless individuals still met or exceeded the daily vitamin C RNI of 40 mg.
Intakes of Ca, iodine and riboflavin were significantly lower in street homeless compared with hostel residents, who consumed significantly more milk and milk products and potato. This may be due to hostel residents having access to cold food storage facilities and regular cooked meals, which has been associated with nutritional advantages in the USA( Reference Wiecha, Dywer and Jacques 34 ). Inadequate Ca intakes have been observed previously in UK single homeless adults( Reference Evans and Dowler 35 ).
Alcohol was a significant source of energy in the homeless group, as reported previously( Reference Darmon, Coupel and Deheeger 6 ). Furthermore, a greater percentage of homeless had B vitamin intakes below the LRNI and, given that chronic alcohol use is associated with malabsorption and reduced utilisation of B vitamins( Reference Hoyumpa 36 ), this is likely to be underestimated. Early clinical thiamin (vitamin B1) deficiency, which causes the alcohol–linked neurological disorder Wernicke–Korsakoff syndrome, has been observed previously in homeless men( Reference Darnton-Hill and Truswell 37 ) and prophylactic oral thiamine is advised for harmful or dependent drinkers at risk of malnutrition( 38 ).
The significantly higher salt intake in the present homeless population represents an established risk factor for the development of hypertension( Reference Cook, Cutler and Obarzanek 39 ) although, despite a significantly higher diastolic level in the homeless group, mean blood pressure measurements were within the normal range( 40 ). However, the significantly higher QRISK-2 score in the homeless group indicates that the homeless group are at a greater risk of developing CVD within the next 10 years. Handgrip strength, a low value of which has been associated with increased mortality in adults >50 years( Reference Lauretani, Russo and Bandinelli 26 , Reference Stenholm, Mehta and Elo 41 ), was significantly greater in street homeless compared with hostel residents; although this is likely to be most reflective of increased physical activity. Significantly more homeless compared with housed reported smoking and substance misuse in the present study, as documented previously( Reference Langnäse and Müller 4 , Reference Homeless 12 ). Furthermore, a significantly greater number of homeless that consumed alcohol reported an intake above recommended levels, which is consistent with previous data( Reference Darmon, Coupel and Deheeger 6 ).
Homeless adults had significantly higher scores for each PHQ-SADS component compared with housed group, which corresponds with the high levels of mental illness reported in the homeless community v. the general population( Reference Homeless 12 ). Within the homeless community, street sleepers are more likely to experience depression( Reference La Gory, Ritchey and Mullis 42 ), as observed in the present study whereby street homeless had higher scores for the depressive component (PHQ-9) of the PHQ-SADS compared with hostel residents. It is currently unclear as to whether mental illness precedes homelessness or homelessness induces/ exacerbates the occurrence of mental illness and the role, if any, nutrition has to play in these conditions. The higher numbers of homeless compared with housed reporting a poor appetite, in the presence of the increased levels of mental illness, may reflect the depressive influence of mental conditions on appetite( Reference Konttinen, Männistö and Sarlio-Lähteenkorva 43 ), which warrants further investigation.
The current study has a number of limitations. The high male:female ratio is consistent with other studies and reflects the preponderance of males in the homeless population( Reference Homeless 12 ). However, male dominance and potential selection bias due to reliance on services accessed by the homeless to attain participants limit the generalisability of the results( Reference Faugier and Sargeant 44 ). In addition, comparison with the most recent (2011) Census in Reading (74·8 % white)( 45 ), suggests that white individuals may have been over-represented in this sample (81 % white). The significant difference between the educational status of the homeless and housed groups may represent an uncontrolled confounding factor given that higher educational status has been associated with a ‘healthier’ diet( Reference Friel, Kelleher and Nolan 46 ). The EPIC FFQ has been validated for the assessment of nutrient intake in different populations( Reference Bingham, Welch and McTaggart 22 , Reference McKeown, Day and Welch 47 ), is less burdensome that weighed intake dairies and was consequently considered appropriate for the current research. However, due to the transient nature of the homeless population, participants were asked to report dietary intake over the previous month (i.e. shorter-term intake), which may have been challenging individuals with fluid dietary patterns. Memory recall may be further confounded in the homeless community whereby greater incidences of reward mediated behaviour, mental illness and alcohol-related brain damage are reported. Objective assessment of energy expenditure, food intake and nutritional status, using biomarkers, would help to confirm the observed differences. Finally, the grouping of hostels may be confounding due to differences in storage facilities and the provision of food. For example, whilst breakfast and dinner were provided by the charity-led hostel, residents in the council-led hostel were self-catered. Further analysis regarding the impact of meal provision on nutritional status in first-stage living hostels is therefore warranted.
The often limited and infrequent access to food by homeless individuals means that the provision of nutritionally sufficient meals is of utmost importance. However, determining which nutritional issues are specific to a homeless community is required in order to determine suitable intervention strategies. Previous studies have aimed to address poor dietary intake in homeless populations through recipe modification at food aid organisations( Reference Pelham-Burn, Frost and Russell 32 ) and implementation of educational programs( Reference Sprake, Russell and Barker 21 , 31 , Reference Johnson, Myung and McCool 48 ). Decreasing the total and SFA content of meals and increasing fruit availability in the hostels surveyed would help to address some of the issues identified in Reading. Milk supplementation in street-homeless adults could also help to address Ca, iodine and riboflavin insufficiencies. However, beyond the scope of this study, exploration of Food Bank usage, which has increased in the UK( Reference Loopstra, Reeves and Taylor-Robinson 49 ), may also assist in the identification of suitable interventions for the local area.
The findings of this study highlight the vulnerability of homeless adults in Reading, who have reduced mental wellbeing, a higher risk of CVD and a poorer dietary intake compared with the housed population. Further objective data is warranted, but the results clearly highlight the need for intervention aimed at improving mental wellbeing and nutritional status in this group.
Acknowledgements
The authors would like to thank Matt Farrow (Crime Reduction Initiatives), Laura Carey (the Salvation Army, Willow House) and the Churches in Reading drop in centre for assistance in the recruitment of homeless participants and Sarah Hargreaves (Hugh Sinclair Unit of Human Nutrition) for assisting in the recruitment of housed participants.
This research received no specific grant from any funding agency, commercial or not-for-profit sectors.
J. A. L. and R. F. designed the research protocol; R. F., J. V. S., C. M. and L. A. collected homeless data; J. V. S. collected housed data; R. F. and J. V. S. analysed data and drafted the manuscript. All authors have read and approved the final manuscript.
The authors declare that there are no conflicts of interest.


