


Malnutrition is common among older adults in health-care settings(Reference Cereda, Pedrolli and Klersy1–Reference Soderstrom, Thors Adolfsson and Rosenblad3), with only one-third having a good nutritional status in a hospital setting(Reference Soderstrom, Thors Adolfsson and Rosenblad2). The condition is associated with a decreased quality of life (QoL)(Reference Hernandez-Galiot and Goni4), up to four times higher mortality rate(Reference Dent, Visvanathan and Piantadosi5–Reference Soderstrom, Rosenblad and Thors Adolfsson8) and early death, irrespective of cause(Reference Soderstrom, Rosenblad and Thors Adolfsson7). Therefore, nutritional treatment interventions are of utmost importance. In clinical practice, treatment strategies to prevent and treat malnutrition include dietary advice (DA) and oral nutritional supplements (ONS). We have previously reported that DA and ONS do not increase survival in malnourished older adults(Reference Soderstrom, Rosenblad and Bergkvist9). However, ONS might have other beneficial effects. The relevance of health-related QoL (HRQoL) as a critical outcome in nutritional interventions for the prevention and treatment of malnutrition in older people has been highlighted in a Delphi study by a panel of experts in nutrition and geriatrics(Reference Correa-Pérez, Lozano-Montoya and Volkert10).
Previous randomised studies examining whether DA or ONS have any impact on QoL are few, had small sample sizes (n 60–225), were inconsistently using different measures of QoL and implemented interventions that were too diverse to combine for meta-analyses(Reference Correa-Perez, Abraha and Cherubini18–20). Thus, high-quality evidence is urgently needed.
The present study was part of a larger multicentre randomised controlled trial (RCT) including older adults who were either malnourished or at risk of malnutrition, and who were given 6 months of treatment comprising DA and ONS – separately or in combination – or routine care. The primary outcome of the RCT was overall survival(Reference Soderstrom, Rosenblad and Bergkvist9), and the secondary outcome was HRQoL at the 6-month, 1- and 3-year follow-ups. The present study aimed to investigate the effect on HRQoL among older adults after 6 months of treatment with individual DA and/or ONS. We hypothesised that HRQoL would differ between one or more intervention groups and the control group.
Materials and methods
The present study was approved by the Uppsala Ethical Review Board (approval number: 2009/203). Before the patients entered the study, all of them provided written informed consent, after being informed both verbally and in writing about the study. The trial is registered at ClinicalTrails.gov with ID: NCT01057914.
Study design and setting
This multicentre RCT was conducted by registered dietitians (RD) at five hospitals in central Sweden during the period February 2010 to December 2014. The dietitians received 2 d of training and instructions regarding the study protocol by the investigators, before the patients were recruited. During the study, the dietitians and the investigators had telephone conferences every week to discuss issues that had arisen. In addition, the dietitians met in person twice a year during the study period and practised the implementation of the study protocol, to decrease inter-rater variability.
The patients were recruited by the study RD when they were admitted to hospital and randomised to one of the four study arms: DA, ONS, DA + ONS or routine care (see below). The primary outcome was all-cause mortality, the results of which have been published(Reference Soderstrom, Rosenblad and Bergkvist9). The present study aimed to analyse the secondary outcome, HRQoL, measured with the European QoL five-dimension, three-level (EQ-5D-3L) questionnaire.
Participants
To be considered for inclusion in this RCT, individuals had to be ≥ 65 years old and assessed to be malnourished or at risk of malnutrition according to the 18-item Mini Nutritional Assessment instrument(Reference Guigoz21–Reference Soderstrom and Rosenblad24). Moreover, the participants had to have no or at most modest cognitive impairment according to the Short Portable Mental Status Questionnaire(Reference Erkinjuntti, Sulkava and Wikstrom25–Reference Smith, Breitbart and Platt27). The exclusion criteria were inability to communicate, not speaking Swedish, having a BMI ≥ 35 kg/m2, already receiving dietary intervention, living in a nursing home or having an expected survival of < 1 year. Finally, 671 individuals were included in the RCT at baseline(Reference Soderstrom, Rosenblad and Bergkvist9). To be included in the present study of the secondary outcome – HRQoL – participants had to provide valid values for the EQ-5D-3L index at both baseline and the 6-month follow-up (n 409) (Fig. 1).
Flow chart describing the participant recruitment and randomisation process in five hospitals in central Sweden. DA, dietary advice; MNA, Mini Nutritional Assessment; ONS, oral nutritional supplements; SPMSQ, Short Portable Mental Status Questionnaire; EQ-5D-3L, European quality of life five-dimension, three-level.
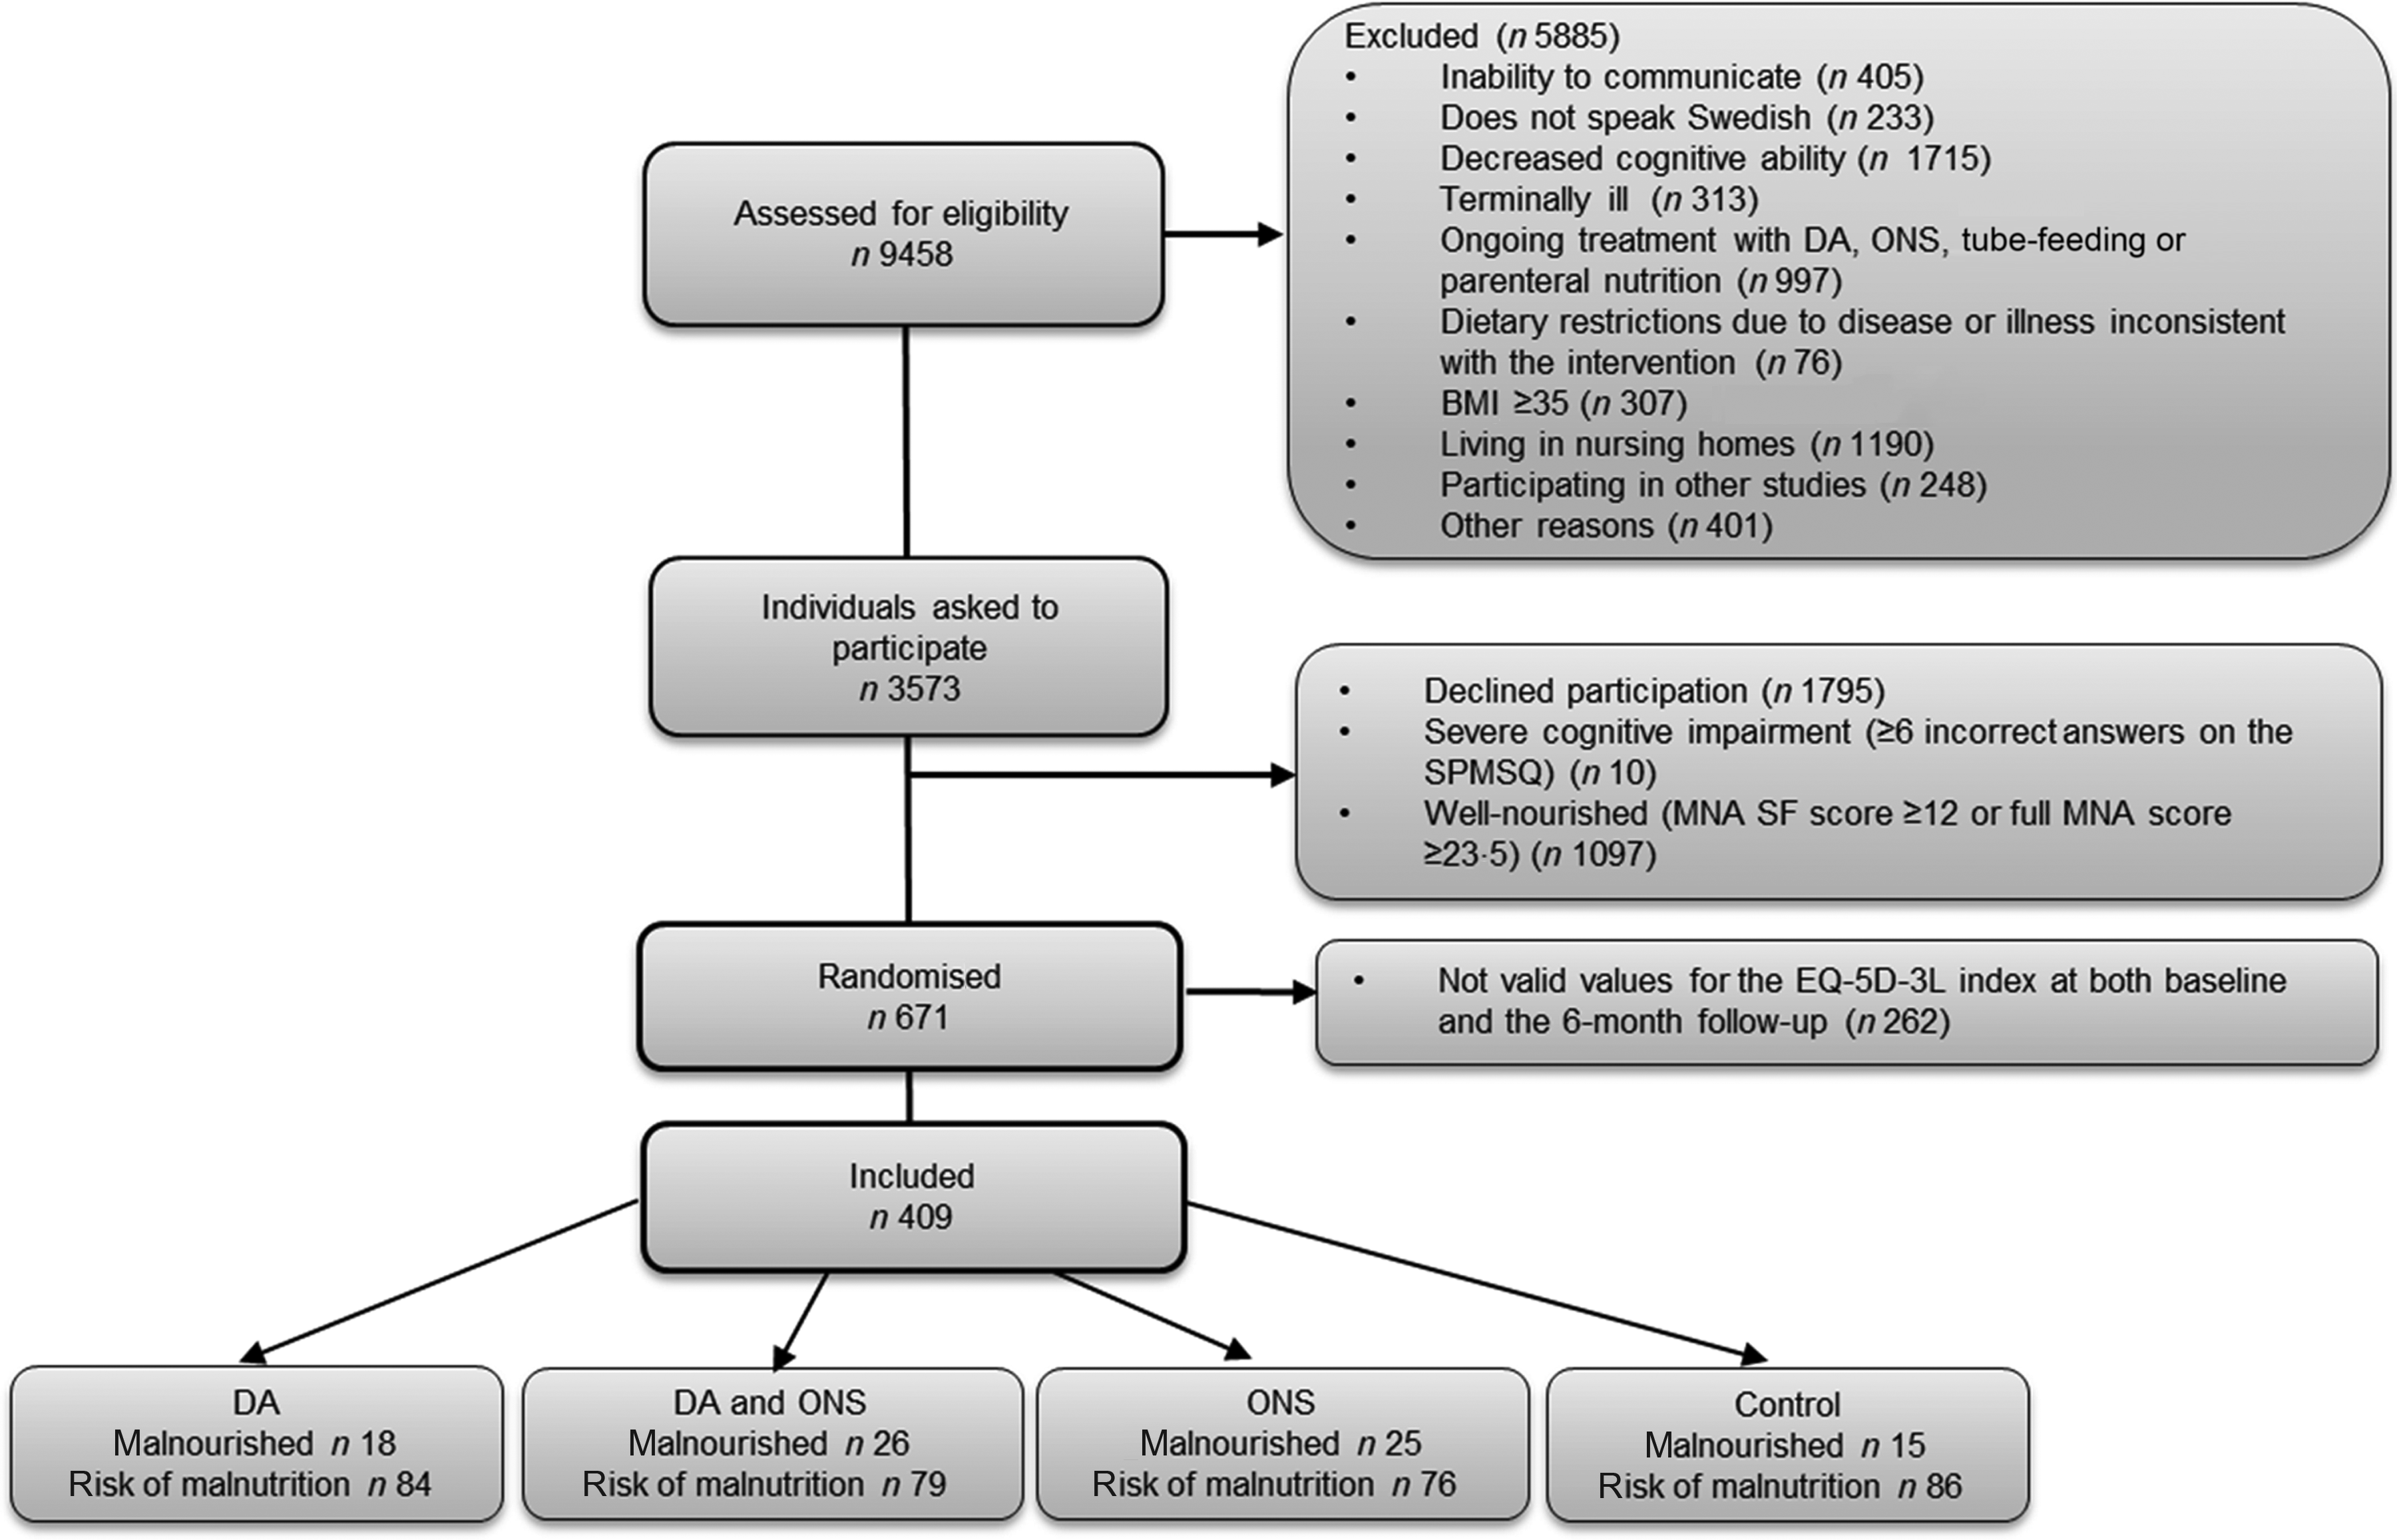
Based on a power calculation for the primary outcome, described previously(Reference Soderstrom, Rosenblad and Bergkvist9), we aimed to include a total of 800 participants in the RCT, that is, ≥200 individuals in each study arm. However, a tentative interim analysis performed after 560 participants had been included in the RCT showed that an extreme difference in mortality had to be observed in the remaining group of 240 patients if we were to reach a statistically significant result. Therefore, a decision was made to terminate the study early. The termination was set to December 2014, at which time 671 individuals had been included in the study. Of these randomised participants, 409 had valid values for the EQ-5D-3L index at both baseline and the 6-month follow-up, thus constituting the cohort for the present study.
Randomisation procedure
A detailed description of the randomisation procedure has been published(Reference Soderstrom, Rosenblad and Bergkvist9). In short, a stratified computerised block randomisation procedure, using random block sizes of eight to thirty-two participants, was performed by the statistician author (AR), separately for each participating hospital.
Patients who fulfilled the inclusion criteria and agreed to participate were stratified into two subgroups: already malnourished and at risk of malnutrition. At each hospital, the subgroups were then randomised independently to one of the four study arms.
Intervention and control groups
Patients randomised to the DA or ONS groups were counselled by an RD on one occasion during their hospital stay and instructed to start the intervention at discharge. The control group was instructed to continue their usual dietary habits. A detailed description of the interventions has been published(Reference Soderstrom, Rosenblad and Bergkvist9). In short, the interventions were administered as follows:
-
DA group: The study RD at each hospital gave DA according to the national dietary recommendations(28), based on information from the Mini Nutritional Assessment screening.
-
ONS group: The RD asked the participants to drink one to two bottles of ONS per day. The goal was to administer 400 kcal/d and 12–20 g protein. Since we used different preparations, the amount could vary between participants depending on brand (Nestlé, Fresenius Kabi, Nutricia). The supplements had a volume of 125–200 ml/bottle, the energy density was 5·23–5·86 kJ (1·25–2·4 kcal/ml) and protein content 4–9·4 g/100 ml.
-
Combination of DA + ONS group: The patients received DA as described for the DA group above. In addition, they were encouraged to drink the ONS in the same way as the ONS group.
-
Control group: The study RD informed the patients about their Mini Nutritional Assessment screening results but gave no further instructions. The patients were subjected to routine care but were free to contact a health-care professional if they were concerned about their risk of malnutrition.
For both the ONS and the DA + ONS groups, all supplements were paid for by the trial. All four groups were contacted by telephone by a study RD at 1, 3 and 6 months after discharge. The three intervention groups were asked questions regarding their compliance with the treatment. They could also ask questions, receive new DA or change the flavour or type of ONS, if desired. The control group was contacted by an RD at the same intervals as the intervention groups to minimise the risk of any bias caused by increased attention given to the former. They were asked questions regarding their health-care use during the study period.
Health-related quality of life
HRQoL was assessed at baseline at the hospital using the EQ-5D-3L health questionnaire(29), and at 6 months, 1 year and 3 years after discharge from hospital, at which time the questionnaires were sent by regular mail to each participant’s home address, together with a prepaid envelope for returning the questionnaire. The EQ-5D-3L consists of a three-level descriptive system and the EQ-visual analogue scale (EQ-VAS). The descriptive system comprises five dimensions (mobility, self-care, usual activities, pain/discomfort and anxiety/depression), and each dimension has three severity levels (no problems, some problems and extreme problems). The patient is asked to indicate his/her health state by ticking the box next to the most appropriate statement in each of the five dimensions. This decision results in a 1-digit number that expresses the level (1–3) selected for that dimension. The digits for the five dimensions can be combined into a five-digit number that describes the patient’s health state(Reference Brooks30). These numbers are used to establish the overall HRQoL measured by the EQ-5D-3L index, which incorporates judgements made by representative samples of the general population(Reference Burstrom, Sun and Gerdtham31).
The EQ-VAS records the patient’s self-rated health on a vertical 0–100 VAS scale, where the endpoints are labelled ‘Best imaginable health state’ and ‘Worst imaginable health state’, respectively. EQ-VAS is used as a quantitative measure of health outcome that reflects the patient’s subjective assessment of his/her HRQoL. Participants that had ticked two boxes for a single dimension were given the level corresponding to the box with the highest HRQoL, and the scores for the EQ-5D-3L index and EQ-VAS were then calculated as described in the EQ-5D-3L manual(32).
Statistical analyses
Categorical data are presented as frequencies and percentages, n (%), while continuous, discrete and ordinal data are given as mean values and standard deviations. To test for differences in background characteristics between individuals included in the study and those excluded from the study, Pearson’s χ 2 test was applied to categorical data while the Mann–Whitney U test was used for continuous, discrete and ordinal data. Data were analysed according to the intention-to-treat approach, with each participant analysed as belonging to the group to which they had been randomised, regardless of compliance to the treatment given to that group. The main focus of the analyses was on comparing the four study arms regarding changes Δ in observed scores from baseline to follow-up, that is, observed scores at follow-up minus observed scores at baseline, computed separately for each individual.
Differences in the EQ-5D-3L index and EQ-VAS grades between the four study arms were evaluated using the Kruskal–Wallis test. In the case of a statistically significant Kruskal–Wallis test, pairwise differences between study arms were examined using the Mann–Whitney U test. To account for possible imbalances in the data caused by differing survival rates at follow-up, as implied by the primary outcome of the RCT, multiple linear regression analyses were performed, with the results presented as slope coefficients β with accompanying 95 % CI. The EQ-5D-3L scores were calculated using the R package ‘eq5d’ applying time trade-off-based value sets for Sweden. Statistical analyses were performed in R 3.6.2/4.0.0 (R Foundation for Statistical Computing) with two-sided P values < 0·05 considered statistically significant.
Results
Baseline characteristics for the 409 participants are listed in Table 1. Overall, the participants had a mean age of 78·1 year when enrolled in the study, with a majority (62·3 %) being women, 9·3 % being smokers and half of the participants living alone. The mean BMI was 23·9 kg/m2, the overnight fast lasted a mean of 12·30 h and the participants used 6·6 medications on average.
Baseline characteristics of the 409 participants in the study as well as the 262 individuals excluded from the study
(Mean values and standard deviations; numbers and percentages)
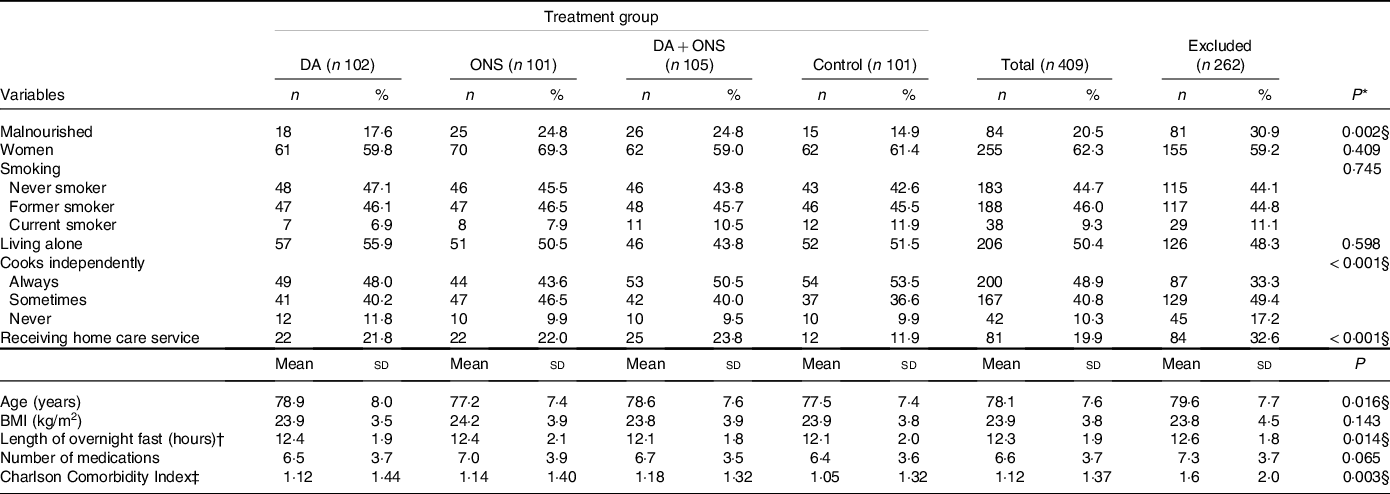
DA, dietary advice; ONS, oral nutritional supplements.
* P values for tests of differences between the 409 included and 262 excluded individuals.
† The time between the last eating episode in the evening and the first eating episode the morning after.
‡ A co-morbidity score that predicts death based on seventeen diseases, each given a score based on the relative risk of dying within a year from that disease.
§ Significant P values.
Table 1 also gives baseline characteristics for the 262 individuals excluded from the study. Compared with the individuals included in the study, the excluded individuals seemed to me more fragile in that they were more often malnourished (P = 0·002), less often cooked independently (P < 0·001), more often received home care service (P < 0·001), were somewhat older (mean age 79·6 years, P = 0·016), had a longer overnight fast (12·6 h, P = 0·014) and had a higher degree of co-morbidity (mean Charlson Comorbidity Index 1·65 v. 1·12, P = 0·003). No statistically significant differences between the two groups were, however, found regarding sex, smoking, living alone, BMI and number of medications used.
Overall HRQoL scores, measured using the EQ-5D-3L index and EQ-VAS, are given in Tables 2 and 3, respectively, for the total group of participants as well as for the malnourished and those at risk separately. Data at baseline and at the 6-month, 1- and 3-year follow-ups are presented for individuals with valid answers at each specific time point, while data for changes Δ in observed scores at these times are given for those individuals with valid answers at both baseline and the specific follow-up time points.
EQ-5D-3L index scores at baseline, 6-month, 1-year and 3-year follow-ups, together with changes Δ from baseline, for the malnourished (MN) and at risk of malnutrition (AROM) nutritional status groups as well as for the total study group
(Numbers; mean values and standard deviations)
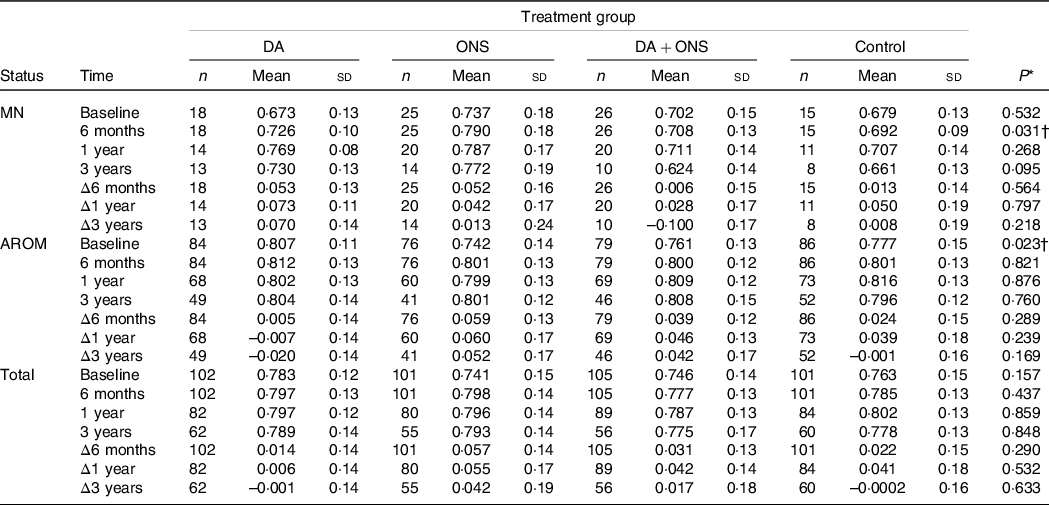
DA, dietary advice; ONS, oral nutritional supplements.
* Calculated using the Kruskal–Wallis test.
† Significant P values.
Visual analogue scale (VAS) scores at baseline, 6-month, 1-year and 3-year follow-ups, together with changes Δ from baseline, for the malnourished (MN) and at risk of malnutrition (AROM) nutritional status groups as well as for the total study group
(Numbers; Mean values and standard deviations)
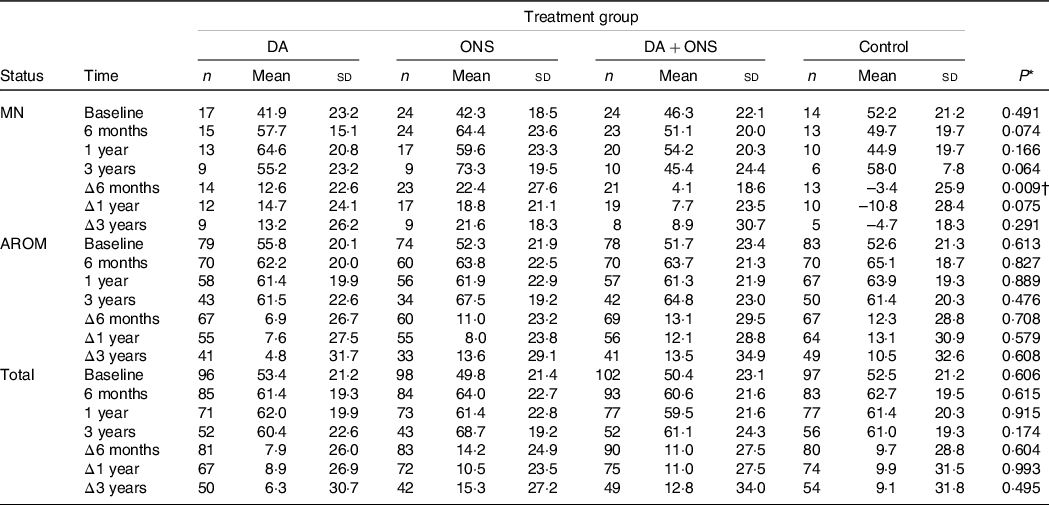
DA, dietary advice; ONS, oral nutritional supplements; VAS, visual analogue scale.
* Calculated using the Kruskal–Wallis test.
† Significant P values.
Health-related quality of life: European quality of life five-dimension, three-level index
For overall HRQoL measured using the EQ-5D-3L index, there were no statistically significant differences among the four study arms for the total group (n 409) at any of the follow-up times (Table 2). However, the values at the 6-month follow-up differed significantly (P = 0·031) in the malnourished group, with the highest EQ-5D-3L index score of 0·790 observed for the ONS group and the lowest score of 0·692 observed for the control group. In pairwise comparisons for this case, significant differences were observed between the DA and ONS (P = 0·041), ONS and DA + ONS (P = 0·021) and ONS and control (P = 0·031) groups. However, because no significant differences were observed in changes Δ from baseline to the 6-month follow-up, the observed difference in index score at 6 months may be explained by the ONS group having a somewhat higher score than the control group at baseline. For the group at risk for malnutrition, baseline values differed significantly (P = 0·023), with the highest EQ-5D-3L index score of 0·807 in the DA group and the lowest score of 0·742 in the ONS group, although none of the four treatment groups differed significantly in pairwise comparisons for this case. However, no significant differences were observed at any of the follow-up time points; neither were there any significant changes Δ from baseline to follow-up between the four study arms.
Health-related quality of life: European quality of life-visual analogue scale
For overall HRQoL measured using the EQ-VAS tool, there were no statistically significant differences among the four study arms for the total group or the group at risk for malnutrition (Table 3). However, a statistically significant difference was observed for the change Δ from baseline to the 6-month follow-up in the malnourished group, with a mean increase in VAS of 22·4, 12·6 and 4·1 points for the ONS, DA and DA + ONS groups, respectively, compared with a mean change of –3·4 points for the control group (P = 0·009) (Table 3). In pairwise comparisons for this case, significant differences were observed between the ONS and DA + ONS (P = 0·006) and the ONS and control (P = 0·007) groups. No other statistically significant differences were observed.
To account for possible imbalances in the data, multiple linear regression analyses with changes Δ in VAS from baseline to follow-up at 6 months, 1 year and 3 years, respectively, as outcome and treatment group as predictor, adjusted for all variables listed in Table 1, were performed. The results are presented in Table 4. Notably, only the malnourished group showed any statistically significant associations between treatment and changes in VAS. At 6 months follow-up, only ONS was found to have a statistically significant association with a change in VAS, with participants in the ONS arm having a 27·5 points larger increase in VAS score from baseline to follow-up than participants in the control arm (P = 0·011), which is consistent with the results from the Kruskal–Wallis test shown in Table 3. At the 1-year follow-up, all active treatments had a statistically significant association with changes in VAS, with participants in the DA, ONS and DA + ONS arms having 28·7 points (P = 0·041), 34·4 points (P = 0·007) and 30·7 points (P = 0·024), respectively, larger increases in VAS score from baseline to follow-up than participants in the control arm. At 3 years follow-up, again only the ONS arm showed a statistically significant association with change in VAS, with participants in the ONS arm having a 38·8 points larger increase in VAS score from baseline to follow-up than participants in the control arm (P = 0·032). ONS was thus the only treatment showing significant increases in subjectively assessed HRQoL compared with the control group at all three follow-up time points.
Results of multiple linear regression analyses of changes Δ in visual analogue scale (VAS) scores from baseline to follow-up using treatment group as predictor, for the malnourished (MN) and at risk of malnutrition (AROM) nutritional status groups as well as for the total study group§
(β-coefficients; 95 % confidence intervals)
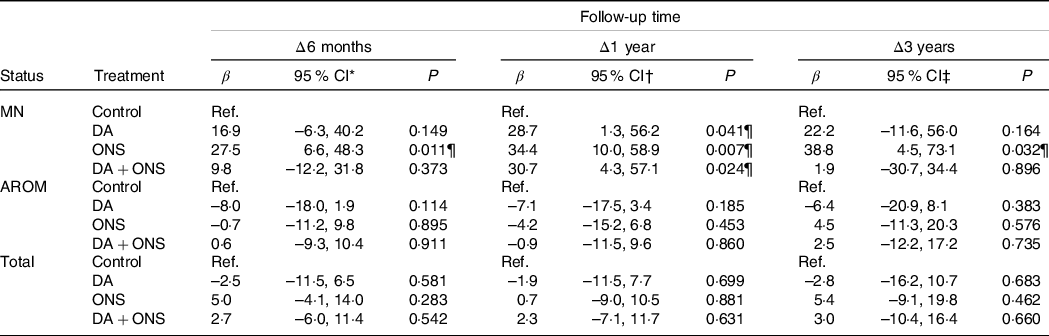
DA, dietary advice; ONS, oral nutritional supplements; Ref, reference group; VAS, visual analogue scale.
Results based on *56 (66·7 %), 213 (65·5 %) and 287 (70·2 %);
† 46 (54·8 %), 200 (61·5 %) and 246 (60·1 %) and
‡ 23 (27·4 %), 144 (44·3 %) and 167 (40·8 %) observations with complete data for the MN, AROM and total, respectively, groups.
§ All results adjusted for sex, smoking status, living alone, cooks independently, receiving home care service, age, BMI, length of overnight fast, number of medications and Charlson Co-morbidity Index.
¶ Significant P values.
Discussion
This multicentre RCT has shown that the use of ONS for 6 months after discharge from hospital increased the subjectively assessed HRQoL, as measured with the EQ-VAS tool at 6 months, 1 year and 3 years follow-up in malnourished older adults, compared with receiving routine care. However, because there were no significant differences between the four study arms in the EQ-5D-3L index, and evidence from previous studies has been inconsistent, this result must be interpreted with caution.
Comparison with results from previous studies
In a Cochrane review from 2009 including sixteen studies with data on QoL in older adults receiving nutritional treatment, most studies had an intervention time that was too short to have a realistic chance of detecting any beneficial effects(Reference Milne, Potter and Vivanti19). A systematic review in 2019 found no beneficial effects of ONS treatment on QoL, and that the results of other intervention studies (dietary counselling and ONS, ONS combined with exercise or nutrition delivery systems) were inconsistent(Reference Correa-Perez, Abraha and Cherubini18). The significant improvement in VAS after 6 months of treatment in the present study (4–22 points) was found to be similar (7–11 points) to that observed in an RCT of 104 malnourished care-home residents in the UK receiving ONS or DA for 14 weeks(Reference Parsons, Stratton and Cawood14).
We did not find any statistically significant differences for overall HRQoL measured using the EQ-5D-3L index. This result is consistent with another RCT of 100 malnourished older adults receiving either ONS or no ONS during 14 weeks after discharge from hospital, which found no effect on the EQ-5D-3L index, but in contrast to our study found no effect on EQ-VAS after a 6-month follow-up(Reference Edington, Barnes and Bryan12). The reason why no significant effect was seen in HRQoL could be that it may be too late to expect improvements in QoL simply by providing ONS for 2 weeks. The authors argue that instead the prevention of malnutrition is the key. Moreover, the study did not control for disease severity which could have been a confounding factor(Reference Edington, Barnes and Bryan12).
A Swedish study of 108 geriatric malnourished patients receiving DA and liquid and multivitamin supplementation over 4 months did not find any significant effects on QoL using a different measure (SF-36)(Reference Persson, Hytter-Landahl and Brismar15). However, only fifty-four participants completed the study, and eight participants in the control group were not restricted from receiving nutritional supplements for ethical reasons, which could have affected the results(Reference Persson, Hytter-Landahl and Brismar15).
Another Swedish study that used the EQ-5D-3L questionnaire reported that nutritional supplements given to twenty women (mean age 83 years) with femoral neck fractures tended to have had a positive effect on HRQoL at a 6-month follow-up, as the decline in HRQoL was least pronounced in the group receiving nutritional supplements (P > 0·05 between groups)(Reference Tidermark, Ponzer and Carlsson17).
Strengths and limitations of the study
The present study is one of the largest multicentre RCT examining the effects of ONS and DA on HRQoL, with a duration of nutritional treatment of 6 months and follow-up of HRQoL for up to 3 years. Another strength was the use of the two different measurements of HRQoL: the EQ-VAS, which is based fully on self-assessment, and the EQ-5D-3L index, which also depends on social judgements, influencing the weighting factors applied to the five different questions. The generalisability of the present study was strengthened by the fact that the study population had a variety of geriatric conditions and came from hospitals of different size (university as well as non-university regional hospitals) in central Sweden.
A limitation of all studies of QoL is that effects can only be measured for individuals who are alive at the time of follow-up. This is especially important for studies on older, fragile, possibly malnourished individuals, such as in the present study, where the mortality is high. A further limitation was the use of the EQ-5D-3L questionnaire, which only has three levels for each of the five questions, resulting in a crude measure of each dimension, and thus less variation and power. From this perspective, it might have been better to use the EQ-5D-5L questionnaire instead(33), which has five levels for each of the five questions. However, this could have led to reliability problems because, unlike the EQ-5D-3L tool(Reference Burstrom, Sun and Gerdtham31), no value sets for Sweden are available for EQ-5D-5L. Finally, there were many analyses done in this RCT and only one result was significant, so it might well have arisen from chance.
Conclusions
The use of ONS might improve subjectively assessed HRQoL in malnourished older adults. However, since there was no significant beneficial effect on HRQoL among patients at risk of malnutrition, further research is needed to identify those who benefit most, and a general recommendation for the use of ONS to older malnourished patients is not yet supported.
Acknowledgements
The authors thank the RD:s who recruited the patients for the study and performed the nutritional treatments. The authors are also thankful for the contributions to the present study by Ms Hanna Frid and Dr Eva Thors-Adolfsson, who participated in the initiation of the study. Finally, the authors thank the editorial work of OnLine English (https://www.oleng.com.au).
This research was supported by grants from Region Västmanland, Uppsala-Örebro Regional Research Foundation (RFR) and the Swedish National Board of Health and Welfare. The funders had no role in the design or conduct of the study; collection, management, analysis or interpretation of the data; preparation, review or approval of the manuscript; or the decision to submit the manuscript for publication.
L. S., A. R. and L. B. participated in the conception and design of the study. A. R. performed the statistical analyses. L. S. and A. R. drafted the manuscript. L. S., A. R. and L. B. interpreted the data and revised the manuscript critically. All authors approved the final manuscript.
No potential conflicts of interest have been reported by the authors.


 Open access