

For the assessment of energy intake in large epidemiological studies a valid instrument for use in children is critical. Until children have reached the developmental stage when they are aware of their food intake and can begin to conceptualize time (at approximately 7–8 years of age), reporting of food intake depends on the parents(Reference Livingstone, Robson and Wallace1). Due to its cost-effectiveness and the possibility for self-administration by the parent, the FFQ may be a useful instrument for use in large-scale studies. As a suitable FFQ for the assessment of energy intake in Dutch children was not available, we developed an FFQ(Reference Brants, Stafleu and Ter Doest2) based on intake data of children included in the third Dutch National Food Consumption Survey (DNFCS)(3). The doubly labelled water (DLW) method is considered to be the ‘gold standard’ for the determination of total energy expenditure in free-living subjects(Reference Hill and Davies4) and has been used as a reference method in a large number of studies to validate energy intake both in adults (e.g. references Reference Anderson, Tomten and Haggarty5–Reference Kroke, Klipstein-Grobusch and Voss8) and children (e.g. references Reference Livingstone, Robson and Wallace1, Reference Kaskoun, Johnson and Goran9–Reference Reilly, Montgomery and Jackson12). The number of validation studies of FFQ using the DLW method in children is limited(Reference Livingstone, Robson and Wallace1, Reference McPherson, Hoelscher and Alexander13).
The first aim of the present study was to validate the FFQ with respect to energy intake, using the DLW method as a reference method, in 4- to 6-year-old children. In large-scale studies extensive quality control of FFQ is time-consuming and expensive. Therefore an additional aim of the study was to investigate how the extent of quality control influences the validity of the FFQ. In population studies a high response rate is crucial and therefore the burden placed on parents should be limited. In our FFQ we asked parents to measure the content of cups and glasses to have a more precise estimate of beverage portion sizes. To evaluate whether this indeed had a positive effect on the questionnaire’s quality, the third purpose of our study was to assess the effect of standard, uniform v. individually measured beverage portion sizes on the validity of the FFQ.
Materials and methods
Participants
Parents with children aged 4 to 6 years were recruited from a pool of volunteers from TNO (a Dutch acronym for the Netherlands Organization for Applied Scientific Research) Quality of Life, Zeist, The Netherlands. Recruitment also took place by means of advertisements which were posted at for example primary schools and children’s day care. In total twenty-eight parents with thirty apparently healthy children (fifteen boys and fifteen girls) agreed to participate in the study. Written informed consent was obtained from both parents of each participating child after receiving an explanation of the procedures. Before the start of the study all children underwent a medical examination. This examination involved a medical history and measurement of weight and height. An independent medical ethics committee (The Medical Ethics Committee of Tilburg) approved the research protocol. All children completed the study.
Anthropometry
At the medical examination weight and height of the children were measured. Standing height was measured using a height measure to the nearest 0·1 cm (Leicester Height Measure; Invicta Plastics Limited, Leicester, UK). In addition parents received a weighing scale (type HE-5; CAS corporation, East Rutherford, NJ, USA) and were asked to weigh the child to the nearest 0·1 kg on the weighing scale in the morning of day 2 and day 15. Children were weighed in their underwear without shoes.
FFQ
The FFQ was developed based on 2 d food record data of the third DNFCS(3). The foods in the database were grouped into eighty-five food groups. In order to select food groups relevant for the energy intake of children we used a two-step selection procedure in different age and gender groups of children aged 2–12 years. First, the percentage contribution of each food group to the energy intake was calculated. Food groups were selected until a cumulative contribution of 80 % of the energy intake was achieved. In this way an estimate of the mean energy intake on the population level was established. This first step yielded twenty-two to twenty-six food groups for the different age and gender groups. To capture the variation between subjects in the contribution of food groups to energy intake, food groups were added that contributed more than 2·5 % to the energy intake of users of the particular food group and also fulfilled the criterion of being consumed by a minimum of 10 % of users of the food group (step 2). Some food groups with a lower percentage of users were selected as well if the foods might be used by the users on a daily basis (e.g. soya milk). After steps 1 and 2, the thirty-nine to forty-six selected food groups covered 90–93 % of the total energy intake for the different age and gender groups according to the DNFCS. As the selection differed only slightly between the different age and gender groups, it was decided to make one questionnaire for all age groups. The selection of the food groups was the basis for the generation of items. Some food groups were split into different items or combined into one item based on the following criteria: the energy content per portion, the importance of foods within a food group, and whether a food item would be a logical combination of foods for the respondent. This resulted in seventy-one items. For twenty-seven foods additional questions were asked about the specific types or brands consumed and preparation methods. The reference period of the FFQ was the past 4 weeks. Parents indicated their child’s habitual consumption frequency of each of the food items by checking one of six frequency categories ranging from ‘never’ to ‘6–7 days a week’. Portion sizes were asked for in natural units (e.g. number of apples, slices of bread), household units (e.g. glasses, spoons) or grams (e.g. grams of meat)(14). Parents were asked to measure the volume of glasses and cups used for different types of beverages. Moreover, parents were asked to inquire at their child’s day care about the food and beverages that were consumed. From a pilot study it appeared that it took a parent on average 25 (range 10–60) min to complete the questionnaire(Reference Brants, Stafleu and Ter Doest2).
On day 15 of the study, parents received the FFQ and were asked to return this by mail within two weeks. After the completed questionnaires were returned, several copies were made in order to study the influence of reviewing and data processing on the validity of the questionnaire. This resulted in different scenarios (see Table 1). The first scenario was a thoroughly reviewed FFQ, where each FFQ was individually reviewed by a dietitian. The dietitian retrieved each missing or rectified each incorrect answer by contacting the parent by telephone. The answers were entered in electronic format and converted to SAS data by means of SAS Vovris, a software package for the processing of FFQ(Reference Bouman, Brants and Kistemaker15). Output of the data cleaning in SAS Vovris consisted of answers below the minimum or above the maximum amount eaten as defined by the dietitian, missing frequencies, quantities or sort categories and data errors due to data entry, for example non-existing categories. Next the dietitian reviewed all errors and warnings in an iterative process with the cleaning procedures in SAS Vovris. In a next step consistency checks were performed between different items in the questionnaire. The dietitian checked all the output and corrected if necessary. In the second scenario parents were not consulted and the review by the dietitian was less extensive. Recurrent incorrect answers, resulting from the data control in SAS Vovris, were corrected by the dietitian in a uniform way according to a code instruction. One dietitian was responsible for reviewing the FFQ. In order to have no prior knowledge of the answers given in the FFQ, the second scenario review was performed first by the dietitian. This was followed by the thorough review, i.e. the first scenario. The third scenario was that the FFQ was not checked on missing data or consistency by the dietitian. SAS Vovris automatically deleted real errors (double answers and non-existing categories). The fourth scenario was the same as the first scenario, the difference being that the portion sizes as measured by the parents were replaced by standardized beverage portion size of 150 ml per glass. For all scenarios, defaults for missing quantities and missing sort categories (i.e. specific food types, brands and preparation methods) were automatically filled in by SAS Vovris before calculation when they could not or were not traced by the dietitian. For the calculation of energy and nutrient intake the Netherlands Food Composition Table NEVO 2001(16) was used. New and/or specific products for children were added by the dietitian.
Different scenarios used for FFQ review
Doubly labelled water method
The DLW method was used to estimate the total energy expenditure of the children. DLW was prepared by the University of Maastricht (Department of Human Biology), following standard procedures(Reference Westerterp, Wouters and van Marken Lichtenbelt17). 2H was obtained as a solution containing 99·9 atom % and 18O as an aqueous solution containing 10 atom %. The dose of labelled isotopes was a mixture of 10 atom % 18O (Campro, Veenendaal, The Netherlands) and 5 atom % 2H (Cambridge Isotopes, Andover, MA, USA) in proportion to the child’s body weight, which was measured during the medical examination. Background urine specimens were collected at home before the subjects came to research centre TNO for consumption of the water solution containing the labelled isotopes (2H218O). Subjects drank the water straight from the bottle and the bottle was rinsed with 50–75 ml tap water which was consumed as well. The water was consumed as a last consumption before the children went home to go to sleep.
After the consumption of DLW, the 2H is excreted as 2H2O and 18O is excreted as H218O and C18O2. In order to measure this excretion, seven urine samples were collected in two weeks. The first sample was the background sample (before consumption of DLW). The other six samples were the second and last voiding of study day 2, morning and evening voiding of day 9, evening voiding of day 14 and morning voiding of day 15. Urine samples were collected at home and kept in the fridge. Within 24 h of each collection a research assistant visited the subjects and took the urine samples to research centre TNO. Duplicate samples of each voiding were kept in the freezer (−20°C) until they were transported to Maastricht University for analysis. Samples were analysed by isotope ratio MS (Optima; VG Isogas, Middlewich, UK). Total daily energy expenditure (EE) was calculated from the rate of C18O2 production. Detailed information on the procedures followed for urine analysis and subsequent data analysis has been given previously(Reference Westerterp18).
Statistical analyses
Statistical analyses were performed using the SAS statistical software package version 8·2 (SAS Institute, Cary, NC, USA). Means and standard deviations were calculated for energy intake (EI) and EE in all children. A paired t test was calculated to determine differences between EI and EE on a mean level. Additionally, a Bland–Altman plot(Reference Bland and Altman19) was used to analyse agreement between EI and EE. This plot of the difference between the two methods against the average of the measurements shows the magnitude of disagreement, spots outliers and identifies trends. Furthermore the EI:EE ratio was calculated to assess the accuracy of the reported energy intake. A value of 1·00 is expected when EI calculated by an FFQ is equal to the measured EE. Pearson correlation coefficients between EI and EE for the total population and partial correlations adjusted for gender were calculated. P < 0·05 was considered as statistically significant. All children were included in the statistical analyses.
Results
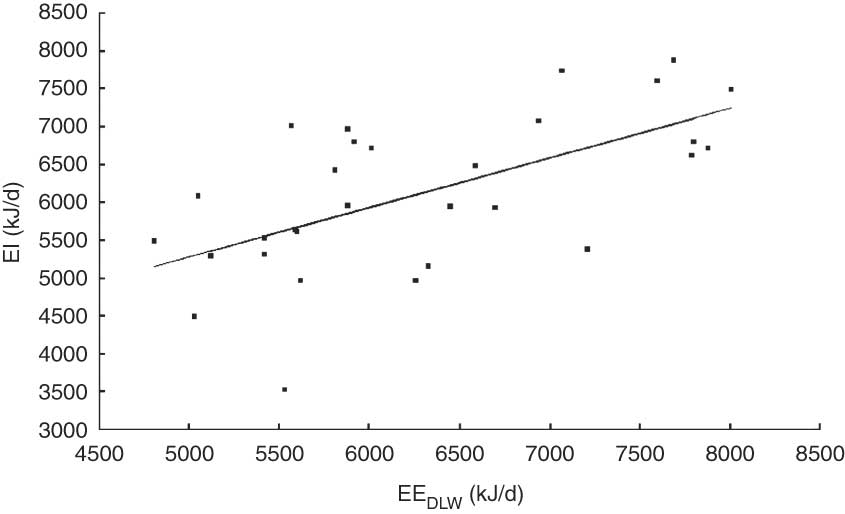
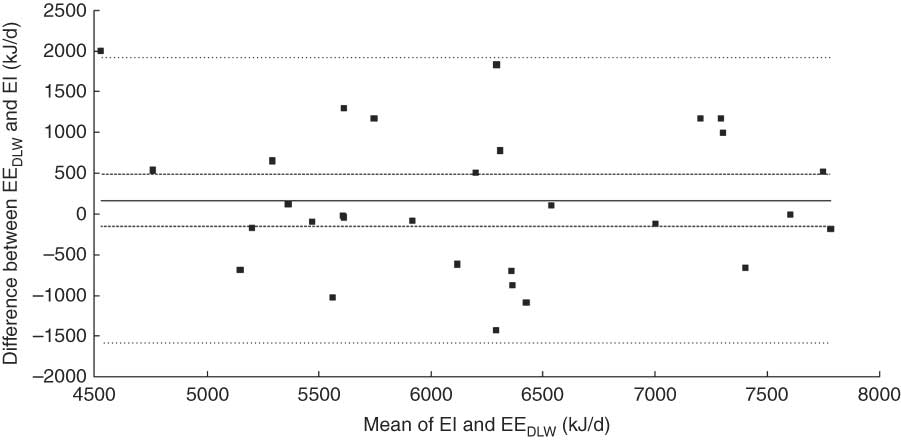
The characteristics of the children and their parents are shown in Table 2. The mean age of the children was 5·2 (sd 0·7) years and their mean BMI was 16·0 (sd 1·4) kg/m2. Children’s mean body weight was equal on day 2 and day 15 (21·6 (sd 3·6) kg; within-subject standard deviation σ = 0·4751 (95 % CI 0·3976, 0·6349)). Table 2 shows the energy expenditure and energy intake assessed by the extensively reviewed and cleaned FFQ (scenario 1). Mean EI (6117 (sd 1025) kJ/d), as calculated from the extensively reviewed FFQ, did not differ from mean EE (6286 (sd 971) kJ; P = 0·1496). The group average EI deviated from the measured EE by –3 %. Figure 1 shows the scatter plot and results of the regression analysis of EI as calculated from the extensively reviewed FFQ (scenario 1) v. EE measured by the DLW method. The Pearson correlation between EI and EE was 0·62 for scenario 1. The individual differences between EI calculated from the extensively reviewed FFQ and EE were plotted against the mean of EI and EE and the result is depicted in Fig. 2. This Bland–Altman plot shows that the variation between the methods (i.e. difference between EI and EE) was equally distributed with the mean of the two methods (P = 0·15), indicating that there is no relevant systematic bias. The plot illustrates that both under- and over-reporting of energy intake occurred. The mean EE v. EI difference is a measure for the constant bias and is close to zero, namely 169 kJ. The precision window is between −158 and 495 kJ. The width of the 95 % confidence limits of agreement varied from −1580 to 1917 kJ, indicating wide discrepancies between the two methods for some individual subjects. The differences did not tend to increase as the absolute energy values increased. EI and EE were classified into tertiles, showing a 53 % correct classification and a 7 % misclassification. Moreover, misclassification was tested by means of the kappa agreement coefficient which was 0·40, showing a moderate agreement between EI and EE.
Characteristics of children and parents, energy intake (EI), energy expenditure (EE) determined with the doubly labelled water method and energy percentage of macronutrients calculated from the FFQ with scenario 1: healthy children aged 4–6 years, The Netherlands
*Lower level of secondary school.
†Higher level of secondary school and intermediate vocational education.
‡Higher vocational education and university.
Energy intake (EI) measured by the extensively reviewed FFQ, in which individually measured beverage portion sizes were taken into account, plotted v. total energy expenditure (EE) measured by the doubly labelled water (DLW) method. The straight line is the regression line: EI (kJ/d) = 2018 + 0·65 × EE (kJ/d); r = 0·62
Individual differences between total energy expenditure (EE) measured with the doubly labelled water method (DLW) and energy intake (EI) calculated by the extensively reviewed FFQ plotted v. the mean of the measurements of EI and EEDLW. The constant bias is 169 kJ (—); the precision window is between −158 and 495 kJ (---); and the width of the 95% confidence limits of agreement varies from −1580 to 1917 kJ (····)
In Table 3 the mean energy intake between the four scenarios is compared. The mean EI varied from 6117 (sd 1025) kJ/d in the extensive reviewed FFQ (scenario 1) to 5828 (sd 887) kJ/d when individually measured beverage portion sizes were replaced by standard portion sizes (scenario 4). Pearson correlation coefficients varied between 0·56 and 0·63. Partial correlations adjusted for gender were somewhat weaker due to the more limited range of EI and varied between 0·41 and 0·46 for the different scenarios.
Comparison of energy intake (EI) and ratio of energy intake to energy expenditure (EE) by the doubly labelled water (DLW) method in different FFQ reviewing and data processing scenarios: healthy children aged 4–6 years, The Netherlands
*Two questionnaires out of thirty were not filled out properly. According to the standard instruction they should not be considered as valid. For comparison reasons they are included in the analysis.
Mean EI as calculated from the FFQ without review (scenario 3, 6081 (sd 1032) kJ/d) and minimal data cleaning (scenario 2, 6043 (sd 1013) kJ/d) did not differ from EE (P = 0·12 and P = 0·08, respectively). However, for the FFQ with standard beverage portion sizes mean EI (5828 (sd 887) kJ/d) differed significantly from mean EE (6286 (sd 971) kJ; P = 0·0040). When analyses were performed separately for boys and girls, only mean EI of the boys differed significantly from EE (data not shown).
As shown in Table 4, self-measured portion sizes of beverages were on average higher than the standard portion size of 150 ml. However, the Pearson correlation coefficient between EI in scenario 4 and EE (0·63) was comparable to the correlation between EI in scenario 1 and EE.
Standard and individually measured beverage portion sizes in the FFQ validation study: healthy children aged 4–6 years, The Netherlands
*Lemonade = syrup plus added water.
Discussion
The present study showed that the FFQ developed to assess energy intake in children is a reasonably valid and useful instrument for use in dietary surveys and epidemiological studies in The Netherlands. The mean EI did not differ from EE as measured with the DLW technique. For the total group the mean ratio EI:EE was 0·98, and most (90 %) subjects were within the limits of acceptable reporters defined as having EI:EE values between 0·76 and 1·24(Reference Livingstone and Black20). Pearson’s correlation coefficient was 0·62, indicating a reasonable capacity to rank subjects with respect to energy intake in a population of children with a similar narrow age range. The Bland–Altman plot showed that for some individuals the difference between EI and EE was substantial, although the upper and lower limits of agreement were smaller than in other validation studies (24 h multiple-pass recall and 3 d record) in children of about the same age(Reference Montgomery, Reilly and Jackson10–Reference Reilly, Montgomery and Jackson12). However, a larger sample size would have resulted in a more precise estimate of the agreement. In Livingstone et al.’s(Reference Livingstone, Robson and Wallace1) comparison of eleven validation studies in young children the mean EI:EE varied between 0·82 and 1·59. With respect to the EI:EE ratio, our questionnaire performed much better than the only study that validated an FFQ, in which the mean EI:EE was 1·59(Reference Kaskoun, Johnson and Goran9). An important difference is that Kaskoun et al.(Reference Kaskoun, Johnson and Goran9) used the slightly adopted Willett questionnaire developed for adults, which was not designed to measure energy intake, in contrast to our questionnaire, which is specially developed to measure energy intake in children. Compared with other DLW validation studies of FFQ in adolescents(Reference Perks, Roemmich and Sandow-Pajewski21) and adults(Reference Anderson, Tomten and Haggarty5, Reference Kroke, Klipstein-Grobusch and Voss8), our questionnaire performed well to estimate mean EI.
When the DLW method is used as a reference method for energy intake, the assumption must be fulfilled that the subjects are in energy balance, i.e. EI = EE. Children normally are in positive energy balance; however energy accretion is small, about 1–2 % of EI(Reference Kaskoun, Johnson and Goran9, Reference Livingstone and Robson22). In our study mean body weight was equal on day 2 and day 15. Furthermore, the period of the EE measurement (15 d) was covered by the reference period of 4 weeks of the FFQ.
Under-reporting is always an aspect that needs to be considered. In general people tend to under-report their food intake, but overweight subjects more than those with normal weight (e.g. references Reference Livingstone, Robson and Wallace1, Reference Livingstone and Black20 and Reference Bellisle23). In our study both under- and over-reporting occurred. However, in our study only two boys out of thirty children were overweight. Therefore we do not know if parents tend to under-report food intake of overweight children with our questionnaire. Kaskoun et al.(Reference Kaskoun, Johnson and Goran9) concluded that body composition of children and their parents did not appear to be a strong factor influencing the overestimation of energy intake by FFQ in children. Also O’Connor et al.(Reference O’Connor, Ball and Steinbeck11) reported no relationship between misreporting and BMI of the children in their study among 6- to 9-year-olds. In addition, EI and macronutrient composition of the diet in the children participating in our study were comparable to those found in a recent Dutch population study among 4- to 6-year-olds(Reference Ocké, van Rossum and Fransen24).
Bellisle(Reference Bellisle23) included in his overview several DLW studies in children and concluded that intake data of young children are more valid than intake data of adults. One possible explanation for the more accurate reporting in children is that an observer (parent, caregiver) does the reporting(Reference Hill and Davies4, Reference Bellisle23). Also Hise et al.(Reference Hise, Sullivan and Jacobsen6) found that the combination of observer-recorded food records with snack recalls is a valid method for measuring EI in overweight and obese subjects. Livingstone et al.(Reference Livingstone, Robson and Wallace1) concluded that parents can be reliable reporters of their children’s food intake in the home environment, but probably not of their children’s out-of-home food intake. In the present study, parents were responsible for filling out the FFQ and also parents were in control of most of the food intake of their child. However, as our questionnaire is intended for use in children between 2 and 12 years of age, the validity of the FFQ might decrease with increasing age because parents are less in control of older children’s food intake.
In large population and epidemiological studies it is not always possible to contact parents when values filled out are not clear or questions are skipped, and to review each questionnaire extensively. Therefore, we evaluated how a review by a dietitian in a standardized manner, without contacting the parents, influences the validity. It appeared that with this less extensive standardized review the validity of the FFQ decreased only slightly. Therefore, in large population or epidemiological studies a less extensive review by a dietitian seems justified. In two out of thirty subjects it was, according to the standard instruction, indicated that we should consider the questionnaire as unreliable as two pages were skipped. Therefore, depending on the standard instruction, it might be that more subjects would be excluded as a result of missing values in the less extensive reviewing situation. Excluding subjects when subject characteristics are correlated with reasons for excluding might influence survey value. In our small sample size we were not able to investigate whether subject characteristics were related with lower questionnaire quality. We also investigated the research situation with minimal resources in which a review by a dietitian is not possible at all. In this scenario 3 the mean energy intake decreased as in scenario 2, but the FFQ still remained reasonably valid. As the parents and children in our study participated in a small intensive study, it is possible that the parents completed the questionnaire very accurately and truthfully. If this indeed happened, necessary corrections were limited and this might partly explain why we found only small differences between the different reviewing scenarios.
In our questionnaire parents were asked to measure the content of glasses and cups of several beverages. Measuring beverage portion sizes gives participating parents an extra burden and might have a negative effect on response rates in larger studies. Therefore we also investigated the effect of using a standard beverage portion size instead of self-measured portion sizes. When the standard beverage portion size was used, the resulting lower EI differed significantly from EE and EI:EE decreased to 0·94. Although this could be partly explained by the prevention of over-reporting (EI:EE > 1·24)(Reference Livingstone and Black20), it appeared that the standard portion size applied for beverages (150 ml) was too small. Replacing the self-measured beverage portion sizes with the standard size did not reduce the ranking capacity of the FFQ, possibly because self-measurement of volumes not only adds information, but also measurement error. This does not apply to portion sizes of other foods, which were asked for in natural units (e.g. number of apples, slices of bread), household units (e.g. spoons) or grams (e.g. grams of meat). As in general these portion sizes are not standard portion sizes used for adults, we do not expect that overestimating of serving sizes occurred in our questionnaire, suggested as the most likely source of bias in the study of Kaskoun et al.(Reference Kaskoun, Johnson and Goran9). Further, the present study indicates that the chosen standard portion size for beverages for children needs to be revised. However, it should be kept in mind that the number of subjects in the current study was limited.
In summary, data from the present study showed that the developed FFQ is a valid instrument to estimate mean energy intake in a group of 4- to 6-year-old children and performs reasonably well to rank the subjects with respect to energy intake. It is therefore a useful instrument to estimate energy intake in children in surveys and epidemiological studies in The Netherlands. Intensive quality control may enhance the validity of the FFQ only marginally. Using a standard beverage portion size (of 150 ml) increases under-reporting. This could be resolved by replacing the standard beverage portion size in this age group with a higher size. To determine the size of a new standard beverage portion, a study in a larger population of children is necessary.
Acknowledgements
Source of funding: This work was supported by the Dutch Ministry of Health, Welfare and Sports. Conflict of interest: None declared. Author contributions: A.E.D. was responsible for writing the manuscript. A.S., A.K. and W.J.A.M. were involved in design of the study. H.A.M.B. was involved as dietitian in the study. K.R.W. was responsible for the DLW method. C.K. analysed the data. R.A.G. and A.S. were involved in writing the manuscript. Acknowledgments: We thank all parents, children and employees of the metabolic unit of TNO Quality of Life involved in the conduct of the study for their efforts.


