

Weaning piglets at a relatively early stage in life is often associated with development of intestinal malfunction and symptoms of diarrhoea (Nabuurs et al. Reference Nabuurs, Hoogendoorn, van der Molen and van Osta1993). The transition from a milk-based diet to adult-type plant-based diets, combined with the stress of being introduced to new environments, is often followed by a period of low feed intake (Brooks & Tsourgiannis, Reference Brooks, Tsourgiannis, Pluske, Le Dividich and Verstegen2003). Absence of gut luminal content has detrimental effects on the mucosa (Bertolo et al. Reference Bertolo, Chen, Pencharz and Ball1999; Ganessunker et al. Reference Ganessunker, Gaskins, Zuckermann and Donovan1999; Burrin et al. Reference Burrin, Stoll, Jiang, Hartmann, Holst, Greely and Reeds2000) and alters the intestinal microbiota (Gyles, Reference Gyles, Gyles and Thoen1993; Jensen, Reference Jensen1998). Drugs like antibiotics and ZnO have effectively been used as both therapeutics and in-feed growth promoters to block the detrimental effects of weaning. However, the European Union has recently banned the use of antibiotics as in-feed growth promoters, as this may have consequences in terms of increased microbial resistance. The properties of antimicrobials have been researched extensively (Sawai, Reference Sawai2003; Torrallardona et al. Reference Torrallardona, Conde, Badiola, Polo and Brufau2003; Hojbjerg et al. Reference Hojbjerg, Canibe, Poulsen, Hedemann and Jensen2005) but little is known of how the manipulated microflora interacts with gut digestive function and integrity (Commission on Antimicrobial Feed Additives, 1997; Cromwell, Reference Cromwell2002; Gaskins et al. Reference Gaskins, Collier and Anderson2002). We hypothesized that treatment of weanling pigs with antibiotics, combined with ZnO, is associated with not only marked changes in intestinal microbial community and inflammation, but also in the mucosal digestive and absorptive capacity. Thus, we asked two questions: (1) How does the antimicrobial treatment affect the intestinal microbial community in newly weaned pigs relative to both unweaned and weaned controls? (2) Does antimicrobial treatment improve physiological indices of gut function, like brush border enzyme activity, morphology, integrity and nutrient absorptive capacity relative to both unweaned and weaned controls? Basic understanding of the effects of antimicrobial treatment will help to establish alternative weaning strategies that do not include the use of antimicrobial drugs.
Materials and methods
Experimental design
To test the effects of antimicrobial treatment we chose a spontaneous model of weaning diarrhoea. We selected a commercial weaning facility with a long record of weanling diarrhoea mainly associated with various serotypes of haemolytic E. coli. On day 24 postpartum thirty suckling pigs (Landrace × Yorkshire × Duroc) from four different sows (Landrace × Yorkshire) were separated from their dam and allocated into three groups: (1) unweaned control pigs killed for tissue collection immediately after separation from the sow (unweaned control, n 8); (2) treated with antibiotics and ZnO for 7 d post-weaning (ANTI group, n 11); or (3) no treatment for 7 d post-weaning (weaned control, n 11). All litters were represented with two or three pigs in each treatment group. The pigs from the ANTI and weaned control groups were kept next to each other in two separate pens, and were given ad libitum access to water and dry feed. The composition of the feed is given in Table 1.
Composition of diet for pigs following weaning
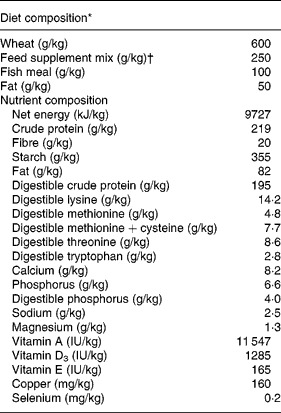
* Data are expressed per kg feed as fed.
† Based on vitamins, minerals and products and by-products of milk, seed, potatoes and grain (Landmix 2730; Vitfoss, Graasten, Denmark).
Treatments
Prior to the study ten faecal samples from pigs in the same weaning facility were collected and tested for sensitivity towards thirty-four different antibiotics belonging to fifteen different groups (sulphonamids, trimethoprims, penicillins, cephalosporins, tetracyclins, aminoglycosides, spectinomycins, macrolides, lincosamides, polymyxins, chloramphinicol, bacitracin, quinolones, tiamulins or fusidin). The sensitivity measured as size of inhibitory zone around an antibiotic tablet on a blood agar, was highest towards the semisynthetic penicillin Synulox (Amoxicillinum trihydricum, potassium clavulanate; Orion Pharma, Nivå, Denmark) which was then mixed into the diet at 25 mg/kg (of which 20 mg/kg is amoxicillin and 5 mg/kg is potassium clavulanate) together with ZnO at 2·5 g/kg. To ensure sufficient antimicrobial exposure regardless of pig voluntary feed intake Synulox (17·5 %) was given by intramuscular injection at 0·05 ml/kg body weight per 12 h. Likewise, weaned control pigs were given an intramuscular injection of saline at 0·05 ml/kg body weight per 12 h.
Tissue collection
Seven days post-weaning, all pigs were anaesthetized with Zoletil 50 (zolazepam/tiletamin; Boehringer Ingelheim, Copenhagen, Denmark) and subsequently killed with an intra-cardiac injection of sodium pentobarbitone. Immediately after death, the intestine was excised and sections at 80 cm caudal to the pyloric sphinter (proximal), 80 cm cranial to the ileo-caecal valve (distal), and the middle colon, respectively, were excised and transferred to an oxygenated Ringers buffer for in vitro nutrient absorption studies as outlined in previous protocols (Karasov & Diamond, Reference Karasov and Diamond1983; Buddington & Diamond, Reference Buddington and Diamond1990). Tissue samples from the pancreas and the intestine (proximal, distal and colon) and samples of luminal contents from the distal small intestine and the colon were collected and snap frozen in liquid nitrogen and stored at − 80°C for later analysis of digestive enzyme activity, concentration of SCFA and for DNA-based characterization of the microbial community. Weights of the heart, lungs, liver, kidneys, adrenals, spleen, pancreas, stomach and the empty small intestine and colon were recorded, and a score (1, firm well-formed; 2, soft; 3, loose; 4, watery) for the luminal contents of the caecum, colon and rectum was given.
In vitro nutrient absorption
Measurement of nutrient absorptive function was done according to pre-established protocols (Karasov & Diamond, Reference Karasov and Diamond1983; Buddington & Diamond, Reference Buddington and Diamond1990). Tissue samples from the proximal and distal small intestine and middle colon were everted, mounted on steel rods and kept 2 min in oxygenated Ringers buffer containing 50 mm of either glucose, fructose, butyrate (containing 0·01 mm-14C-labelled tracer), leucine or proline (containing 0·01 mm of 3H-labelled tracer), or tracer alone. The samples were weighed and radioactivity levels were subsequently measured on a scintillation counter (Wallac, PerkinElmer, Boston, MA, USA). Calculations of nutrient absorption rates of each individual nutrient were done as outlined by Karasov & Diamond (Reference Karasov and Diamond1983). Furthermore, as an indication of carrier-dependency, ratios of nutrient accumulation in the presence of tracer alone to presence of tracer in 50 mm of non-labelled nutrient, were calculated according to Buddington et al. (Reference Buddington, Malo, Sangild and Elnif2000). An accumulation ratio close to 1·0 indicates little competition for carriers, and that a major part of nutrient uptake may occur via carrier-independent mechanisms, whereas accumulation ratios far beyond 1·0 indicate large carrier-dependency.
Enzyme activity
Activities of lactase-phloridzin (EC 3.2.1.23-62), sucrase-isomaltase (EC 3.2.1.48-10), maltase-glucoamylase (EC 3.2.1.20), dipeptidyl-peptidase IV (EC 3.4.14.5), aminopeptidase N (EC 3.4.11.2) and aminopeptidase A (EC 3.4.11.7) in homogenates of proximal and distal small intestinal tissue were determined spectrophotometrically using lactose, sucrose, maltose, glycyl-l-prolin-4-nitroanilide, l-alanine-4-nitroanilide and α-l-glutamic acid 4-nitroanilide as substrates, respectively, according to a previously established protocol (Sangild et al. Reference Sangild, Sjostrom, Noren, Fowden and Silver1995). Frozen pancreas was homogenized in Tris-HCl buffer (100 mmol/l containing 20 mmol/l CaCl2, pH 7·9, 2 min, 0°C), centrifuged (20 000 g, 45 min, 4°C) and the supernatant was used for analysis of amylase, trypsin and chymotrypsin activity. Ethylidene-p-nitrophenyl, d-maltoheptaside was used as a substrate for amylase and the released nitrophenol was determined spectrophotometrically at 405 nm (577-50P; Sigma Chemical Co., St Louis, MO, USA). Benzoyl-arginine-p-nitroanilide was used as the substrate for trypsin after activation of trypsinogen with enterokinase (B 4875 and E 0632; Sigma), and chymotrypsin was measured using Succ-AAPF-p-nitroanilide (S 7388; Sigma). For all enzymes, a hydrolytic rate of 1 μmol substrate hydrolysed/min at 37°C was considered to represent 1 U of enzyme activity. Enzyme activities were expressed per g wet intestine or pancreas.
Plasma pepsinogen
Blood samples were collected from each pig at the time of killing. Plasma was isolated upon centrifugation and used for determination of pepsinogen concentration according to the RIA developed by Banga-Mboko et al. (Reference Banga-Mboko, Sulon, Closset, Remy, Youssao, De Sousa, El Amiri, Sangild, Maes and Beckers2003). The detection limit of the RIA was 0·2 ng/ml. The intra- and inter-assay variations were 8 and 12 %, respectively.
SCFA
The concentration of SCFA was measured as described by Jensen et al. (Reference Jensen, Cox and Jensen1995). Samples of the colon luminal content were diluted in a sodium hydroxide solution containing 2-ethylbutyric acid as internal standard. The diluted samples were extracted with HCl and diethyl ether. Following centrifugation (3000 g, 10 min), the ether layer was isolated and added to the reagent N-methyl-N-t-butyldimethylsilyltrifluoroacetamide. The reaction mixture was incubated at 80°C for 20 min followed by a further incubation at room temperature for 48 h. Finally, the samples were injected into a gas chromatograph and the chromatograms were analysed using HP GC ChemStation software (Technical Lab Services, ON, Canada).
Escherichia coli
Samples of the luminal content from the distal small intestine were incubated at 37°C under aerobic conditions for 18 h on a blood agar. The presence or absence of haemolytic and non-haemolytic E. coli was subsequently registered and their serotypes identified.
Microbial community
DNA from samples of distal small intestinal tissue and luminal content were extracted and purified according to Leser et al. (Reference Leser, Lindecrona, Jensen, Jensen and Møller2000) and Ausubel et al. (Reference Ausubel, Brent, Kingston, Moore, Smith, Seidman, Stuhl and Ausubel1988). Briefly, 200 mg sample homogenate were added to 600 μl PBS and centrifuged (4°C, 200 g, 2 min). The supernatant was isolated and centrifuged (4°C, 12 000 g, 5 min), upon which the pellet was isolated and resuspended in a Tris-HCl–EDTA solution. To lyse the bacterial cells, the suspension was transferred to vials containing zirconia–silica beads and SDS, and subsequently shaken on a high-speed minibead beater (Biospec Products, Bartlesville, OK, USA) for 4 min. The lysed suspensions were centrifuged and proteins and polysaccharides were precipitated using the cetyltrimethylammonium bromide method by Ausubel et al. (Reference Ausubel, Brent, Kingston, Moore, Smith, Seidman, Stuhl and Ausubel1988). The purified DNA was amplified by thirty cycles of PCR using the reaction conditions specified by Leser et al. (Reference Leser, Lindecrona, Jensen, Jensen and Møller2000). Subsequently, the fluorescently labelled PCR product was purified and digested with a restriction enzyme (CfoI, 20 U; Boehringer Mannheim, Mannheim, Germany). Together with standard fragment mixtures (GS-500 ROX and GS-1000 ROX; Applied Biosystems, Foster City, CA, USA), the restriction fragments were loaded on to a denaturing polyacrylamide gel for electrophoresis (2500 V, 40 mA, 10 h) and analysed on an automatic sequence analyser (ABI PRISM 373 DNA Sequencer; Applied Biosystems) in Gene-Scan mode. Data on the lengths of restriction fragments were subsequently analysed using the Bionumerics software package (Applied Maths, Austin, TX, USA) with special emphasis on identification of operational taxonomic units (OTU) differentially expressed among treatment groups. The similarity of each OTU to the nearest phylotype was based on the clone library by Leser et al. (Reference Leser, Amenuvor, Jensen, Lindecrona, Boye and Møller2002). Additionally, as an indication of similarities between samples, we calculated the Dice coefficient using the Bionumerics software package. The Dice coefficient reflects the similarity between two individual samples by calculating the ratio of two times the number of terminal restriction fragments (T-RF) in common between two samples, divided by the total number of T-RF in the two samples. The ratio is calculated for all pairwise sample-to-sample combinations, and from this means and their standard errors are calculated within treatment groups, between treatment groups, within sample site (tissue or content) and between sample sites. Finally, we used Bionumerics to search for T-RF that were present in the ANTI group but absent in weaned controls, as this is an indication of the most important microbial differences between the two groups.
Microscopy
After 24 h in 10 % neutral buffered formaldehyde, the tissue samples from the proximal and distal small intestine and the colon were carefully cleaned of remaining digesta using deionized water and then transferred to a fresh solution of 10 % neutral buffered formaldehyde. Subsequently, the samples were dehydrated and infiltrated with paraffin wax. Three slides were prepared from each sample, and each slide contained a minimum of four sections cut at 4 μm, at least 50 μm apart. The slides were processed for carbohydrate histochemistry using either the periodic acid-Schiff reaction or Alcian Blue reaction at either pH 2·5 (Alcian Blue 2·5) or pH 1·0 (Alcian Blue 1·0). The periodic acid-Schiff reaction stains neutral mucins, Alcian Blue 2·5 stains carboxylated or sulphated types of acidic mucins, and Alcian Blue 1·0 stains sulphomucins (Kiernan, Reference Kiernan1990). Carbohydrate histochemistry on the periodic acid-Schiff- and Alcian Blue-stained samples was evaluated as described previously by Brunsgaard (Reference Brunsgaard1997). Briefly, fifteen well-oriented villi and crypts were selected on each slide and for each villus and crypt the area of mucin granules with a clear positive reaction for either neutral mucins, acidic mucins or sulphomucins were determined using a computer-integrated microscope and an image analysis system (Quantimet 500 MC; Leica, Cambridge, UK) with a monitor. This area included the mucus material present in the crypt lumen. As the histochemical procedure employed in our study stains the granules of all mucous cells (goblet cells and crypt secretory cells) as well as the apical secretion of these cells, these are all included in the measures. The slides processed for neutral mucins were further used to determine area, height and density of villi and crypts, using the image analyses system. Villous height and area as well as crypt depth and area were determined on fifteen well-oriented villi and crypts, respectively. The villi and crypt density were determined as the number of villi or crypts appearing over a defined distance. The density counts of villi and crypts were done at fifteen different sites on each sample. All measures were done using a light microscope at 10 × magnification.
Statistics
All data, except the results from the molecular terminal restriction fragment length polymorphism (T-RFLP) analysis, were analysed using pig and sow as random variables and treatment as fixed variable in the Mixed procedure of the SAS statistical software program version 8 (SAS Institute, Cary, NC, USA). When a significant treatment effect was identified, differences between two individual means were compared using the PDIFF option in SAS. Probability levels below 0·05 were considered significant. Differences in prevalence of haemolytic and non-haemolytic E. coli were compared with a χ2 test in SAS.
Results
At weaning all pigs appeared clinically healthy. During the 7 d post-weaning, pigs from the ANTI group showed no clinical symptoms at any time whereas all pigs in the weaned control group developed weaning diarrhoea within 3–4 d and remained clinically sick until they were killed on day 7. This led to a daily weight loss in the weaned control group, while there was a net daily weight gain in the ANTI group (Table 2).
Average daily gain, luminal content score and organ dimensions in weanling pigs (Mean values with their standard errors)

ANTI group, antimicrobial group.
a,b,c Mean values within a row with unlike superscript letters were significantly different (P < 0·05).
* P values refer to the overall treatment effect.
† 1, firm well-formed; 2, soft; 3, loose; 4, watery.
Relative to unweaned controls, the ANTI group pigs showed an increase in small intestinal percentage dry mucosa and weights (relative to body weight) of the empty stomach and colon (all P < 0·05; Table 2). Compared with weaned controls, these indices were similar, whereas the relative weight of the colon and the liver were significantly lower in the ANTI group (P < 0·05; Table 2). Mean plasma level of pepsinogen was higher in the ANTI group compared with both control groups (ANTI group 156·1 (se 12·2) ng/ml v. unweaned controls 89·6 (se 14·3) ng/ml and weaned controls 115·0 (se 14·0) ng/ml; P < 0·05). There were no apparent differences in stomach mucosal integrity among the groups.
Compared with unweaned control pigs, the ANTI group pigs had increased activity of amylase and maltase but a decreased activity of aminopeptidase N, dipeptidylpeptidase IV and lactase (all P < 0·05; Fig. 1). There were pronounced differences in digestive enzyme activity between weaned control pigs and the ANTI group in that aminopeptidase N, aminopeptidase A, trypsin and amylase activities were markedly higher in the ANTI group than weaned controls (all P < 0·05; Fig. 1). Across treatments, small intestinal lactase and peptidase activity was higher in the proximal than in the distal intestine, whereas sucrase and maltase activity was similar in both regions (regional results not shown).
Enzyme activities (expressed as U/g tissue) of aminopeptidase N (ApN), dipeptidylpeptidase IV (DPP IV), aminopeptidase A (ApA), chymotrypsin and trypsin (A), and sucrase, lactase, maltase and amylase (B). (C), Small intestinal in vitro absorption rate, expressed as mmol/g tissue per min of glucose, fructose, leucine and proline. Values are means with their standard errors depicted by vertical bars. a,b Mean values with unlike letters were significantly different (P < 0·05). ■, Unweaned control; ![]() , weaned control;
, weaned control; ![]() , antimicrobial group.
, antimicrobial group.
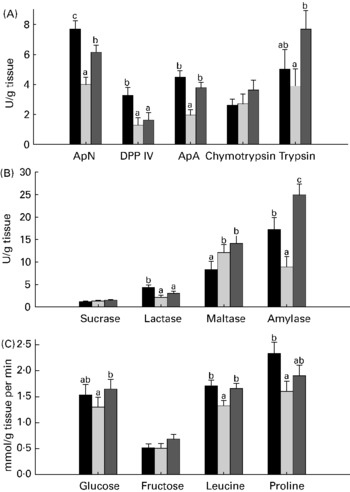
In vitro mucosal uptake of the most carrier-dependent nutrients, glucose and leucine (data for carrier-dependency not shown), were significantly higher in the ANTI group compared with weaned controls (P < 0·05), whereas the less carrier-dependent uptakes of fructose and proline were similar between these groups (Fig. 1). In vitro absorption rate of butyrate showed a clear pH-dependency (7·6 mmol/g tissue per min at pH 2·5 v. 4·2 mmol/g tissue per min at pH 5·5, P < 0·001), but there was no effect of treatment.
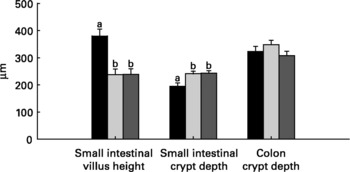
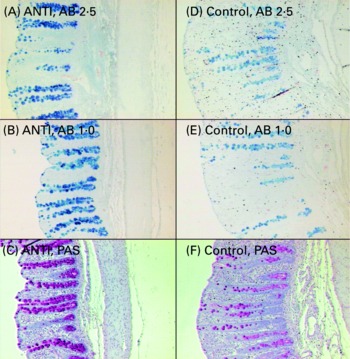
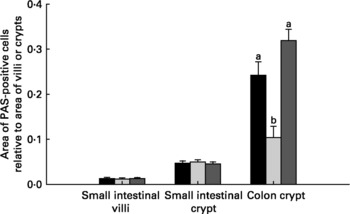
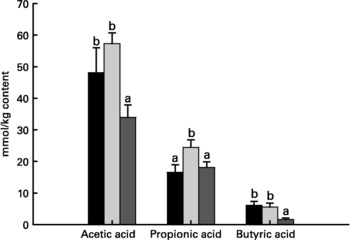
Relative to unweaned controls, morphometric analysis showed a significant decrease in villous height and an increase in crypt depth in the ANTI group (P < 0·05), whereas the morphometric measures were similar between the ANTI group and weaned controls (Fig. 2). However, goblet cells in the colon stained with either Alcian Blue (pH 1·0 or 2·5) or periodic acid-Schiff showed marked differences in that weaned control pigs had a reduced area of stained goblet cells compared with the ANTI group (Figs. 3 and 4; P < 0·001). Levels in the small intestine were similar among all three groups (Fig. 4). Compared with weaned controls, antimicrobial treatment significantly reduced the concentration of acetic acid (34·0 (se 4·0) v. 57·3 (se 3·2) mmol/kg, P < 0·05), propionic acid (18·1 (se 1·7) v. 24·5 (se 2·2) mmol/kg, P < 0·05) and butyric acid (1·6 (se 0·5) v. 5·5 (se 1·2) mmol/kg, P < 0·01; Fig. 5). These three acids accounted for over 80 % of the total SCFA found in the colon in all treatment groups.
Morphometric dimensions of the small and large intestine expressed in μm. Values are means with their standard errors depicted by vertical bars. a,b Mean values with unlike letters were significantly different (P < 0·05). ■, Unweaned control; ![]() , weaned control;
, weaned control; ![]() , antimicrobial group.
, antimicrobial group.
Mucus-containing goblet cells in the colon of pigs treated with antimicrobials (ANTI; A–C) and weaned control pigs (D–F) using three different stainings: Alcian Blue (AB) pH 2·5 (A, D), AB pH 1·0 (B, E) or periodic acid-Schiffs reagent (PAS; C, F).
Area of mucus-containing goblet cells in the small and large intestine. Data are expressed as area of positively stained cells relative to villus or crypt area using periodic acid-Schiffs reagent (PAS). Stainings with Alcian Blue gave similar results as PAS (data not shown). Values are means with their standard errors depicted by vertical bars. a,b Mean values with unlike letters were significantly different (P < 0·05). ■, Unweaned control; ![]() , weaned control;
, weaned control; ![]() , antimicrobial group.
, antimicrobial group.
Concentration of acetic acid, propionic acid and butyric acid in colon luminal content (mmol/kg content). Values are means with their standard errors depicted by vertical bars. a,b Mean values with unlike letters were significantly different (P < 0·05). ■, Unweaned control; ![]() , weaned control;
, weaned control; ![]() , antimicrobial group.
, antimicrobial group.
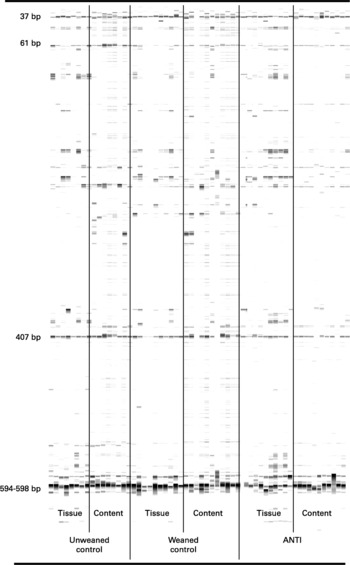
The effect of antimicrobial treatment was also evaluated by the prevalence of haemolytic and non-haemolytic E. coli in distal small intestinal contents, as well as by T-RFLP using distal small intestinal contents and tissue. The prevalence of haemolytic E. coli was 13 % in the ANTI group v. 56 % in weaned controls. One pig in the weaned control group had both haemolytic and non-haemolytic E. coli, whereas all other pigs had either only haemolytic or non-haemolytic E. coli. Based on a χ2 test, the prevalence of haemolytic E. coli between the ANTI group and weaned controls was significantly different (P < 0·001). The non-haemolytic E. coli found in the ANTI group seemed to belong to a single subtype, whereas both haemolytic and non-haemolytic E. coli in the weaned control group came from various subtypes, including O149, O157, O8, O138 and O45. Using the T-RFLP technique, the intestinal microbial diversity in the luminal content expressed as total number of identified T-RF within a treatment group was markedly lower for the ANTI group than for unweaned controls and weaned controls (Fig. 6), whereas the diversity at the tissue level was similar between groups. Dice pairwise similarity coefficients were calclulated within and between treatment groups as well as within and between sample sites (tissue or content) (Table 3). Generally the similarity was larger within sample sites than between them. The low similarity between content and tissue was accounted for by the lower number of T-RF in the tissue compared with content, indicating that tissue-associated bacteria represent only a subfraction of those found in the lumen. Further, as a direct consequence of the markedly reduced diversity in the ANTI group, they showed only little similarity with weaned controls. The most dominating T-RF were found at 37, 61 and 407 bp, and in the range 594–598 bp (Fig. 6; Table 4). Based on a swine-specific database of OTU using the CfoI restriction enzyme (Leser et al. Reference Leser, Amenuvor, Jensen, Lindecrona, Boye and Møller2002), phylogenetic similarities of the most dominating OTU to culturable bacteria are given in Table 4. Lactobacilli appeared to be very dominating in all treatment groups in both tissue and content. Finally, using the Bionumerics software package we did an analysis with the purpose of identifying T-RF that were frequently present in weaned control pigs (with diarrhoea), but absent in the ANTI group (healthy) pigs. Four different OTU were found of which two showed high similarity to strains of lactobacilli, one had high similarity to E. coli and one was unknown (Table 5). Since the prevalence of the four identified OTU seemed to be the same in the content but different in tissue in healthy (ANTI group) v. sick (weaned control) pigs, the present data suggest that bacteria associated with weanling diarrhoea are mostly found at the tissue level and not in luminal content.
Gel containing bands of restriction fragments of bacterial 16S DNA from samples of distal small intestinal tissue and luminal content. The restriction fragment lengths of the four most dominating bands are indicated as number of base pairs. ANTI, antimicrobial group.
Dice pairwise similarity coefficients within and between treatments* (Mean values with their standard errors)
ANTI group, antimicrobial group.
a,b,c,d Mean values with unlike superscript letters were significantly different (P < 0·05).
* Data are expressed as percentages. Within each set of comparisons, results represent means, with their standard errors, of all pairwise sample-to-sample comparisons. Every sample-to-sample comparison was calculated as two times the number of terminal restriction fragments they have in common, divided by the total number of terminal restriction fragments for the two samples.
Dominating terminal restriction fragments (T-RF) in tissue and content and list of potential operational taxonomic units (OTU) and tentative bacterial identification (for details see Fig. 6)
* Only bacterial strains displaying more than 96 % phylogenetic similarity to specific OTU are included.
Prevalence of discriminative terminal restriction fragments (T-RF) that are differentially expressed between treatment groups (size of T-RF and suggestions for operational taxonomic unit (OTU) and tentative bacterial identifications are given)*
ANTI group, antimicrobial group.
* Results represent number of samples containing a specific T-RF/total number of samples within treatment group.
Discussion
Selecting a commercial production site with a record of weanling diarrhoea resulted in major clinical differences between the ANTI group and weaned control pigs. Within 4–5 d post-weaning, all pigs in the weaned control group developed diarrhoea whereas there were no signs of intestinal dysfunction in the ANTI group at any time. This could be related to a stimulation of intestinal peptidase and pancreatic amylase activties in the ANTI group, coupled with an improved absorption rate specifically for carrier-dependent nutrients like glucose and leucine. Despite the marked clinical differences there was surprisingly little difference in the weaning-associated villous atrophy (Hampson, Reference Hampson1986; Miller et al. Reference Miller, James, Smith and Bourne1986; Pluske et al. Reference Pluske, Williams and Aherne1996a, Reference Pluske, Williams and Aherneb) which was similar in the two weaned groups compared with unweaned control pigs.
We also observed a large treatment effect on the mucus-containing goblet cells in the colon. The dramatic reduction in the colon of weaned control pigs seems to reflect an accelerated secretion to the lumen due to increased exposure to pathogens like haemolytic E. coli. The epithelial mucosal lining serves a protective function against pathogens. Production and secretion of mucus by goblet cells is partly continuous, providing for the renewal of mucus lost by erosion, but also partly accelerated when challenged by pathogens (Epple et al. Reference Epple, Kreusel, Hanski, Schulzke, Reicken and Fromm1997). Conventional culturing of faecal samples confirmed that the prevalence of haemolytic E. coli was higher in weaned control pigs than in the ANTI group. The antibiotic we chose was a β-lactam (amoxicillin) which was combined with a β-lactamase inhibitor (clavulanate) that restores its potency against β-lactamase-producing bacteria like E. coli. However, not all strains of E. coli display the same sensitivity towards this combination (Bronner et al. Reference Bronner, Murbach, Peter, Levêque, Elkhaïli, Salmon, Dhoyen, Monteil, Woodnutt and Jehl2002). We therefore hypothesize that the present antibiotic has selected strains of E. coli that were resistant to β-lactam, and that these resistant strains were predominantly non-haemolytic as no haemolytic E. coli were found in the ANTI group.
Our DNA-based characterization of the microflora using T-RFLP confirmed that E. coli present in the tissue, but not in luminal content, account for some of the differences observed in the microbiota between the ANTI group and weaned controls. The present finding is consistent with other studies on the mucosal adhesive properties of E. coli and its role in the pathogenesis of weaning diarrhoea (Gyles, Reference Gyles, Gyles and Thoen1993; Bronner et al. Reference Bronner, Murbach, Peter, Levêque, Elkhaïli, Salmon, Dhoyen, Monteil, Woodnutt and Jehl2002; Grange et al. Reference Grange, Mouricout, Levery, Francis and Erickson2002). It is interesting that weaned control pigs more often also harboured certain strains of lactobacilli in the tissue, compared with the ANTI group pigs. The present observation does not prove that the particular strains of lactobacilli are part of the pathogenesis, nor does it prove that they are potential beneficial probiotics. However, the massive T-RF observed at 407 bp and 594–596 bp in all treatment groups were identified as different strains of lactobacilli which suggests that this group of bacteria requires special attention. Jensen (Reference Jensen1998) found an inverse relationship between numbers of coliforms and lactobacilli in the intestine, such that coliforms proliferate initially during the first 2–3 d post-weaning, but are subsequently substituted by lactobacilli on days 3–7. In their study the shift towards more lactobacilli was associated with an increase in fecal DM, indicating recovery from weanling diarrhoea. In the present study, however, pigs in the weaned control group showed no signs of recovery 1 week after weaning but did have high numbers of lactobacilli as indicated by intense T-RF at 407 and 594–596 bp (Fig. 6). Therefore, high levels of lactobacilli in a late post-weaning phase (days 4–7) does not seem to provide sufficient colonization resistance against pathogens under the given circumstances. High levels of lactobacilli in a compromised intestine may even result in growth depression of the host via competition for luminal nutrients and/or altered fat digestion by deconjugating bile salts (Engberg et al. Reference Engberg, Hedemann, Leser and Jensen2000).
Intestinal colonization resistance against pathogens is an important function of the large intestine in addition to its role in the absorption of water, electrolytes and SCFA. In non-pathological conditions, large intestinal fermentation is considered beneficial because SCFA provide energy to the epithelium and serve as co-factors in the absorption of electrolytes (Ruppin et al. Reference Ruppin, Bar-Meir, Soergel, Wood and Schmitt1980; van Beers-Schreurs et al. Reference van Beers-Schreurs, Nabuurs, Vellenga, Kalsbeek-van der Valk, Wensing and Breukink1998). In contrast to this, the present study shows that controlling weanling diarrhoea with antimicrobials reduces the concentration of SCFA in the colon luminal content. We suggest that antimicrobial treatment prevents large intestinal fermentation of readily fermentable substrates, like starch and protein, via its stimulating effects on digestive enzymes and nutrient absorption in the small intestine, coupled with its general inhibition of bacterial load and specific inhibition of certain tissue-associated pathogens. In weaned control pigs rapid fermentation in the colon may result in tissue damage and body dehydration due to accumulation of osmotic active components like SCFA and electrolytes in the lumen. It is likely that the increased size of the colon in the weaned control group reflects accelerated, yet insufficient, adaptation toward absorbing SCFA from excess fermentation. We have shown that in vitro absorption of SCFA in the colon, exemplified by butyrate, is stimulated by low pH (pH 2·5 v. 5·5). However, as in vivo luminal pH drops only from approximately 7·2 to 6·2 within 7 d post-weaning (Jensen, Reference Jensen1998), there may not be any pH-dependency at all in this range (Rechklemmer & von Engelhardt, Reference Rechklemmer and von Engelhardt1988). Thus, colon luminal pH may be suboptimal for absorption in situations of bacterial overgrowth and supply of readily fermentable substrates not digested in the small intestine. Readily fermentable substrates include simple carbohydrates and protein, whereas fibrous components in the diet are known to provide a slower fermentation that are less likely to exceed the SCFA absorptive capacity.
Deficiency of dietary fibrous components has been shown to make the colonic mucosa more fragile and prone to spontaneous bleeding in rats (Strugala et al. Reference Strugala, Allen, Dettmar and Pearson2003). Relative to oat- or barley-containing diets, the level of NSP in the present experiment was relatively low due to the high content of wheat. We speculate that the interactive effect of the markedly lower feed intake observed for weaned control pigs, and the low dietary level of NSP, resulted in prolonged retention of digesta in the colon leading to increased erosion of the colonic mucus. Erosion of the protective mucus layer exposes the epithelial cells and makes them vulnerable to pathogens that induce inflammation, leading to further malfunction of the colon (Liu et al. Reference Liu, Fishman, Hicks and Kende2005). Treating weanling pigs with antimicrobials effectively blocks the pathogenic pathway, probably by reducing the number of entero-toxigenic bacteria in the small intestine and the colon, and thereby stabilizing the mucosal integrity. Further, it is likely that reducing the luminal load of both pathogenic and non-pathogenic bacteria in the colon provides fermentation that does not exceed the absorptive capacity and therefore leads to retention of water and electrolytes, rather than dehydration.
Intestinal digestive enzymes and absorptive functions, especially those related to protein digestion, were significantly improved by antimicrobial treatment. Likewise, the increase in plasma pepsinogen levels may reflect enhanced protease synthetic capacity in the stomach in healthy pigs. In a recent study, small intestinal peptidase activity declined during the first 3 d post-weaning, but then increased as a sign of recovery (Hedemann et al. Reference Hedemann, Hojsgaard and Jensen2003). In the present study, however, pigs in the weaned control group never recovered from weaning-associated digestive malfunction and this was reflected as reduced protein digestive capacity compared with the ANTI group. Together, these effects could contribute to the hypothesis that reducing protein contents in weaning diets without antimicrobials is beneficial to avoid maldigestion. Considering the reduced feed intake for weaned control pigs, which in itself is a risk factor (Madec et al. Reference Madec, Bridoux, Bounaix and Jestin1998), it appears, however, that lowered digestive and absorptive capacity is not the only factor leading to weanling diarrhoea. Stasis of luminal content in the small intestine due to low feed intake immediately after weaning, allowing adhesion of entero-toxigenic bacteria like E. coli, could be a key factor leading to maldigestion and diarrhoea in the present experiment.
The present study showed that treating weanling pigs with antimicrobials alters the microflora and improves digestive enzyme activity and goblet cell density. Based on the present study, alternatives to antimicrobials are most likely to be found in interventions that specifically prevent or limit tissue colonization of haemolytic E. coli, or generally reduce the intestinal bacterial load. In addition, interventions that improve protein digestive function in the small intestine and/or controls fermentation in the large intestine could possibly simulate the beneficial effects of antimicrobials.
Acknowledgements
This work was presented as an abstract at the 9th International Symposium on Digestive Physiology in Pigs (Banff, Canada, 2003): ‘Effects of GLP-2 treatment and antibiotics on gut structure and function during pig weanling diarrhoea’, pp. 161–163, Department of Agricultural and Nutritional Science, University of Alberta. Anna Siekierska, Katja Kristensen, Thomas Rebsdorf, Mie Lilleris Nielsen and Kathrine Hansen Høirup are greatly thanked for their skilful handling of laboratory procedures. This work was funded by a grant from the Directorate for Food, Fisheries and Agri Business.


