


I. Introduction
Practically every online platform uses score mechanisms. E-commerce, online streaming, travel agents, reviewing services, car sharing services, and others, all include options to rate transactions. Some platforms use ratings for likes and community aspects but many platforms use these score mechanisms to reduce information asymmetries for consumers. Consumers depend on these ratings and reputation systems (Luca, Reference Luca2016; Luca and Zervas, Reference Luca and Zervas2016; Mengxiang Li et al., Reference Li, Huang, Tan and Wei2013) but these systems can also drive product sales (Archak et al., Reference Archak, Ghose and Ipeirotis2011; Jabr and Zheng, Reference Jabr and Zheng2014; Moe and Trusov, Reference Moe and Trusov2011). Providing past customer experiences to potential future customers delivers additional data points and is especially helpful when the quality of a product or service can be evaluated only after purchase.
However, over the past few years, ratings distributions from many platforms have begun to skew more positive—to “inflate.” Zervas et al. (Reference Zervas, Proserpio and Byers2021) refer to this highly skewed distribution of online ratings as a J-shape distribution. Filippas et al. (Reference Filippas, Horton and Golden2022) show that the share of workers with a perfect 5-star rating on an online marketplace for labor grew from 33% to 85% in only six years and describe similar patterns for other platforms. Similarly, the majority of Uber drivers have a perfect five star-rating (Athey et al., Reference Athey, Castillo and Chandar2019). Do these changes reflect a real increase in user satisfaction or merely “reputation inflation,” i.e., better ratings without higher satisfaction? Filippas et al. (Reference Filippas, Horton and Golden2022) decompose much of the upward trend in ratings to the latter cause.
Are all users on these platforms equally susceptible to unsubstantiated reputation inflation? The existing literature treats users as largely homogeneous, but on many platforms some users are more experienced or knowledgeable than others. Such experts may be less prone to social pressure to give better ratings and more focused on their objective quality evaluation. Furthermore, experts—defined by educational criteria or on a status as an influencer with a large network—may face a higher risk of prestige loss when leaving ratings which fail to match tangible quality assessments. As such, insights about heterogeneity in reputation inflation could benefit both platform users and platform providers. The former could rely more on expert reviews if there is evidence for more consistent rating behavior in this group; the latter could adjust internal performance metrics or quality assessments by using deliberate expert definitions to calibrate for reputation inflation.
Score mechanisms often rely on quantitative measures like star ratings or school grades, supplemented by written text reviews. Numeric feedback is simple to compare: it is generally a one-dimensional measure. Text reviews, on the other hand, are more complex. Length, tone and syntax are highly individual. At the same time, text reviews can contain detailed and granular information on a variety of dimensions important to consumers: price, quality, alignment with description, service, and so on. Previous studies investigated the correlation of text-based feedback and its numeric counterparts, as well as the added value of reviews for quality and rating score prediction (Katumullage et al., Reference Katumullage, Yang, Barth and Cao2022; Klimmek, Reference Klimmek2013; McCannon, Reference McCannon2020; Yang et al., Reference Yang, Barth, Katumullage and Cao2022). Their overarching results are threefold: product quality can be related to several review characteristics; there is a positive correlation between text length and product price; and text reviews are a better source of information for quality prediction than pure numerical input.
We leverage differences between written reviews and numerical ratings from experts and non-experts on the world's largest online wine marketplace to identify reputation inflation. Using a variety of machine learning techniques, we predict quantitative ratings from the written feedback. In so doing, we compare numerical ratings with predicted quality based on text reviews, similar to Filippas et al. (Reference Filippas, Horton and Golden2022). We define expert status using a variety of user characteristics, including follower count and comments per review. Furthermore, we check for robustness using a sentiment-based analysis of reviews. Our paper contributes to the existing literature in two ways. First, using written reviews allows side-by-side comparisons of two data sources; this helps us investigate the link between text and numeric rating data. Second, differentiating between reviewers with more as well as less expertise in reviewing accounts for heterogeneity among reviewers.
These numerical ratings increase over time. The average rating of 3.67 in 2014 increased by 4.3% to 3.86 in 2020. In contrast, the ratings predicted purely from written reviews are stable: the average wine scores 3.77 points in 2021 and 3.76 points in 2014.Footnote 1 Comparing these observed values to predicted quality ratings as well as sentiment measurements we find strong evidence for reputation inflation on the platform. Our predictions are more accurate for experts despite our model possessing no information about reviewers themselves. The root mean squared error (RMSE) of the model is 0.50 for experts and 0.60 for non-experts, which suggests that expert reviews are indeed more informative.Footnote 2 Importantly, however, we find that the increase in ratings is even more severe for experts than for non-experts. Among experts, the average rating increased 0.20 points from 2014 to 2020; among non-experts, this increase was only 0.15 points.
The paper proceeds in five parts. The following section provides additional context on the subject of reputation inflation and expert status on platforms. The third section introduces the raw data and details our strategy for distinguishing between experts and non-experts. Section IV introduces our empirical strategy. Section V presents our main results and Section VI concludes.
II. Background
Numerical ratings play an important role in maintaining online markets, though recent literature documents the growing role played by reputation inflation (Filippas et al., Reference Filippas, Horton and Golden2022). We define reputation inflation as an increase in ratings absent a commensurate increase in quality. However, expert users may have lower incentives to participate in reputation inflation. In this section, we provide an overview of existing research on reputation and situate this paper's contribution.
a. Reputation inflation in online marketplaces
The most common form of product reviews online is numerical ratings. Users assign a rating to the product or service. These ratings are often expressed in a star format ranging from one to five. A one star rating represents the lower bound, i.e., a negative review, and five stars the most positive review possible (Yin et al., Reference Yin, Mitra and Zhang2016). While numerical feedback measures reflect a user's overall evaluation of the product or service and serves as a signal of quality and value to the customer (Li and Hitt., Reference Li and Hitt2010), textual reviews bring additional information valuable to potential buyers. Textual reviews can include additional thoughts, detailed reports about different aspects of the product experience, and often some kind of emotional tone (Xiaolin Li et al., Reference Li, Chaojiang and Mai2019).
Highly skewed ratings distributions, in which a large fraction of a marketplace's ratings are good or perfect, are common. Filippas et al. (Reference Filippas, Horton and Golden2022) show that 80% of the evaluations on their online labor market have a rating of at least 4.75 (out of 5.00) and list other marketplaces with comparable results. On eBay, the percent positive measure for sellers is 99.3% on average (Dellarocas and Wood, Reference Dellarocas and Wood2008; Nosko and Tadelis, Reference Nosko and Tadelis2015; Tadelis, Reference Tadelis2016). Almost 95% of Airbnb properties are rated at 4.5 or 5 stars (Zervas et al., Reference Zervas, Proserpio and Byers2021). Zhu and Liu (Reference Zhu and Liu2018) show similarly high seller ratings on Amazon (Zhu and Liu., Reference Zhu and Liu2018). Almost 90% of UberX trips are rated at the maximum of five stars; to leave a lower review signals a problem (Athey et al., Reference Athey, Castillo and Chandar2019). Importantly, the fraction of online reviews which are similarly positive is increasing over time (Zervas et al., Reference Zervas, Proserpio and Byers2021). Filippas et al. (Reference Filippas, Horton and Golden2022) show that the share of workers with a perfect 5-star rating on an online marketplace for labor grew from 33% to 85% in only six years and describe similar patterns for other platforms.
One potential explanation for the overwhelmingly positive majority of reviews is a large and increasing share of fake reviews (Glazer et al., Reference Glazer, Herrera and Perry2021; He et al., Reference He, Hollenbeck and Proserpio2022; Luca and Zervas, Reference Luca and Zervas2016). Beyond an increasing number of fake or inauthentic reviews, bias within the pool of reviewers or within the review content could decrease the ability of these reviews to reduce information asymmetries. This disservice to review systems leaves users without helpful experience reports from other customers. Alternatively, positive reviews may incorporate peer effects. Gastaldello et al. (Reference Gastaldello, Schäufele-Elbers and Schamel2024), for example, document a community effect on Vivino ratings: more popular wines tend to score more highly.
Another explanation for the positive skew of online ratings may be an increasing level of satisfaction with the services provided. However, it seems unlikely that, for example, UberX drivers have unambiguously become better drivers over time. Using objective telemetry data, Athey et al. (Reference Athey, Castillo and Chandar2019) show that UberX customers prefer rides with fewer sharp accelerations or brakes—and that they rate drivers accordingly. A more likely explanation is review inflation: an increase in customer ratings over time which is not justified by increased satisfaction (Filippas et al., Reference Filippas, Horton and Golden2022). Potential explanations for review inflation include manipulated positive ratings, self-selection within the group of reviewers, social pressure where users feel pressured to leave positive ratings, or incentive alignments on the platform which nudge people for positive ratings.
How can we decompose the growth in positive reviews into its constituent parts? One option would be to compare these subjective ratings to a feedback mechanism that is less susceptible to inflation (Athey et al., Reference Athey, Castillo and Chandar2019). Text reviews, for example, do not suffer many of the same pressures for higher reviews that numerical reviews do. Ironically, it is the ambiguity of text reviews that make them less susceptible. While written reviews generally express either positive or negative opinions, this positivity is a latent dimension. People may feel less guilty leaving a review that says “this wine lacks acid” than leaving a one-star review of the wine. In addition, users may be more willing to leave a negative text review because they do not think the text review will figure into the algorithmic rankings of service providers. Finally, users may feel better able to nuance negative reviews when the review is written: there is no room for a “but” in numeric reviews.
To summarize, we expect numerical ratings to increase over time. However, much of this inflation will be unrelated to product quality. As a result, predicted values of these ratings will remain steady over time. More formally, we can distill the following hypothesis:
H1: Numerical ratings of wines will increase over time.
H2: The difference between numerical ratings and the predicted values of ratings from text reviews will increase over time.
b. Expert status in online marketplaces
Many platforms distinguish between different reviewers or providers. For example, Airbnb assigns “Superhost” status to specific hosts of accommodations based on guests’ ratings. The physician rating platform Jameda offers physicians—who present themselves on the platform and are rated by patients—premium memberships which includes profile badges; it also assigns badges for “Top10” or “Top5” within a specific region and area, similar to Airbnb. One might expect expert users to be less susceptible to the review inflation phenomenon. Professionalism and expert status mean different things in different settings. This distinction holds for both the reviewer-side and the products, services or persons rated on a platform.
We focus on the expert status of reviewers, because the users of the platform we study rate products, not providers. Several platforms, such as Amazon, provide the opportunity to users to evaluate reviews of others as helpful or leave likes as some kind of agreement. The question and answer website Stackoverflow uses helpfulness measures or evaluations of the best answer to assign reviewers special badges and reputation measures. The area of influence can often be quantified by the number of followers of users where applicable which might also speak in the direction of expertise on rating platforms.
Experts may be less susceptible to social pressure to give positive reviews because they have an incentive to provide useful reviews. First, Vivino is a sufficiently prominent platform that many aspiring wine critics use it in order to attempt to grow their reach. Many expert reviewers within our sample link their Vivino profiles to their external websites—suggesting that the users are attempting to drive traffic to their own page. Experts may also feel an intrinsic reward for increasing their follower count. Importantly, experts who build a large following probably want to keep it. To do so, they must write informative reviews that are likely to be verified by other users’ experience. This also means that experts should be internally consistent: a change in standards over time is likely to be noticed by other users who follow the expert.
Experts may also take a more wholistic view of rating, particularly when it comes to wine. Kopsacheilis et al. (Reference Kopsacheilis, Analytis, Kaushik, Herzog, Bahrami and Deroy2024) document overall agreement between expert and non-expert ratings by comparing crowd-sourced reviews on Vivino with outside wine critics. However, scores made by wine critics aligned more closely with scores made by other wine critics than by Vivino reviewers, suggesting higher levels of internal consistency within experts than between experts and non-experts. They attributed these results to the fact that “[a]mateurs’ ratings emphasize the immediate pleasure of drinking a wine, whereas professional critics focus more on the potential of a wine once it has matured” (Kopsacheilis et al., Reference Kopsacheilis, Analytis, Kaushik, Herzog, Bahrami and Deroy2024, 286).
These factors imply that experts are likely to produce more informative reviews. In our context, an increase in information is likely to reduce the error in predicting ratings from text reviews. Moreover, if experts are indeed less susceptible to review inflation, then growth in prediction error over time—as text reviews remain unaffected but numerical ratings increase—should be lesser among Vivino users we label as experts. These conclusions generate two additional hypotheses:
H3: The prediction error of our model will be lower for reviews written by experts.
H4: The growth in prediction over time will be lesser for reviews written by experts.
III. Data and descriptives
Our analysis leverages large-scale, web-scraped data from Vivino. Vivino is the world's largest marketplace for wine. It is offered as an app as well as a web version. The platform serves as a community forum where users can interact and leave reviews and ratings for individual wines. They can also purchase wine on the platform. Importantly, many Vivino members use the platform simply to catalog their tasting notes on wines. Currently, over 66 million users are registered on the platform.
a. Dataset
Vivino is a particularly interesting setting to study reputation inflation and experts’ additional value for several reasons. First, its reviews are comparable: at the wine and vintage level, the products are more or less identical, excepting bottle variation. Second, the platform is used by reviewers of different expertise and knowledge levels about wine, which allows differentiation and investigation of heterogeneity effects. Third, Vivino's market size permits a large number of observations for our analysis. Finally, the platform design includes information about followers, comments and likes for every reviewer.
One important caveat for wine is that products will evolve over time. Wine is a natural product; it ages. A wine drunk in one year may not taste the same in subsequent years. Many wines—such as vintage port or classically made Bordeaux—’open up’ and improve over many years in bottle. Other wines like Beaujoulais Nouveau are generally best consumed immediately upon release. The overwhelming majority of wines listed on Vivino will not improve with age.Footnote 3 In our data set, the median wine is consumed three years after vintage date; 90% of wines are reviewed before they are eight years old.Footnote 4 Our random sample covers more than 600,000 different wines across almost 3 million vintage-wine combinations, where vintage means the year the grapes were harvested.Footnote 5 Our sample covers 11.8 million unique reviews. The data were collected during the summer of 2020. They include up to the 100 most recent reviews left for each wine. As our method relies on text analysis of reviews, we decide to use only a subsample of our dataset. First, we drop 100,817 reviews which do not contain a written review. Second, for simplicity we restrict our analysis to English-language texts. We drop 6,081,342 tasting notes written in other languages, mostly in French, Spanish, German, Russian, and Portugese. These deletions leave us with around 5.45 million English-language reviews for which we have both the score (our outcome variable) and an informative written review. These reviews still cover 490,000 unique wines and 952,368 unique reviewers.Footnote 6
b. Variables of interest
To investigate how user heterogeneity affects reputation inflation, we leverage detailed information within Vivino's review system. The following section provides further details on the data used and variables of major interest for our analysis.
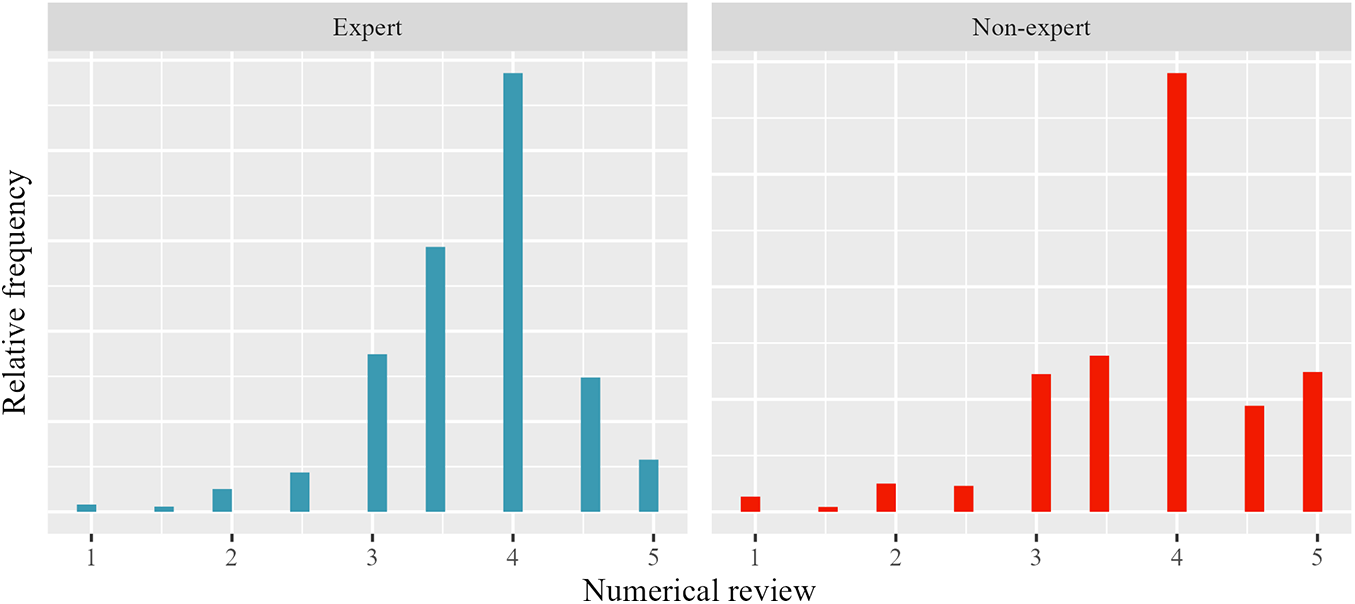
Information on reviews: Users can decide between leaving pure star ratings or adding a textual review. The star reviews are either integers or midpoints between them (i.e., 4.5) between 1 and 5. Figure 1 shows the distribution of scores in our data for both expert and non-expert reviews. The average rating for reviews included in our dataset is 3.77 (3.83 for non-experts, 3.72 for experts). The distribution of ratings is similar to other platforms: slightly skewed with a higher share of good reviews (Engler et al., Reference Engler, Winter and Schulz2015; Filippas et al., Reference Filippas, Horton and Golden2022; Luca and Zervas, Reference Luca and Zervas2016). Figure 1 shows the distribution of these ratings.
Distribution of star ratings by expert level.

This numerical feedback for wine is our outcome variable—the rating whose inflation we measure. We compare these scores to written feedback, a tasting note or wine review. As we argue above, we consider the written feedback to be more time-invariant and less susceptible to review inflation. The average review is 106 characters long.
The content of these reviews is quite varied. Some provide detailed tasting notes of the wine; other reviews are less informative. One example of a highly detailed review is “Violet and dark fruit on the nose. Initially boysenberry and cherry with strong tobacco. After 30 mins did it open up with flavors exploding. More fruit forward. Licorice, currants coming through. Long finish. Medium body. Doesnt feel 100% cab. Some tannic finish.” A shorter but nevertheless informative review reads “Fruity and off-dry with exotic fruits, citrus and minerals. 87.”Footnote 7 On the other hand, an example of an uninformative wine review is “Great with slow cooked lamb shanks.” Many reviews also contain only details about when, where, and with whom the wine was consumed.
Examining word choice can begin to deliver valuable insights about differences and salience. Figure 2 shows basic wordclouds for all experts’ and non-experts’ reviews. These wordclouds are based on the frequency of stemmed words. Non-experts appear to use words which are more vague or subjective in their reviews. For example, the word “smooth” is the eighth most common word in non-expert reviews and the 32nd most common word in expert reviews. Smooth is a word for which the meaning is unclear; it could refer to mouthfeel, tannin, acid, fruitiness, or a number of other characteristics. In contrast, acid is the third most common word for experts (13th for non-experts). Tannin is the eighth most common word in expert reviews, and the 16th most common word for non-experts. These terms are often paired with words like “medium” (seventh for experts, 24th for non-experts) or “balanced” (15th for experts, 20th for non-experts). While acid, tannin, and mouthfeel still require some expertise to distinguish, they refer to more objective qualities than “smoothness.”Footnote 8
Wordcloud of text reviews.

On the other hand, non-experts were more likely to use price-based terminology when describing wines. For non-experts, value was the 32nd most common term; for experts it was the 77th. For non-experts, price was the 22nd most common term; for experts, the 54th. While these observations are purely descriptive, they do start to suggest a pattern of wine experts using more precise language. This difference could explain why our models are better able to predict the scores for expert reviews: like many readers, the models do not understand what “smooth” means.
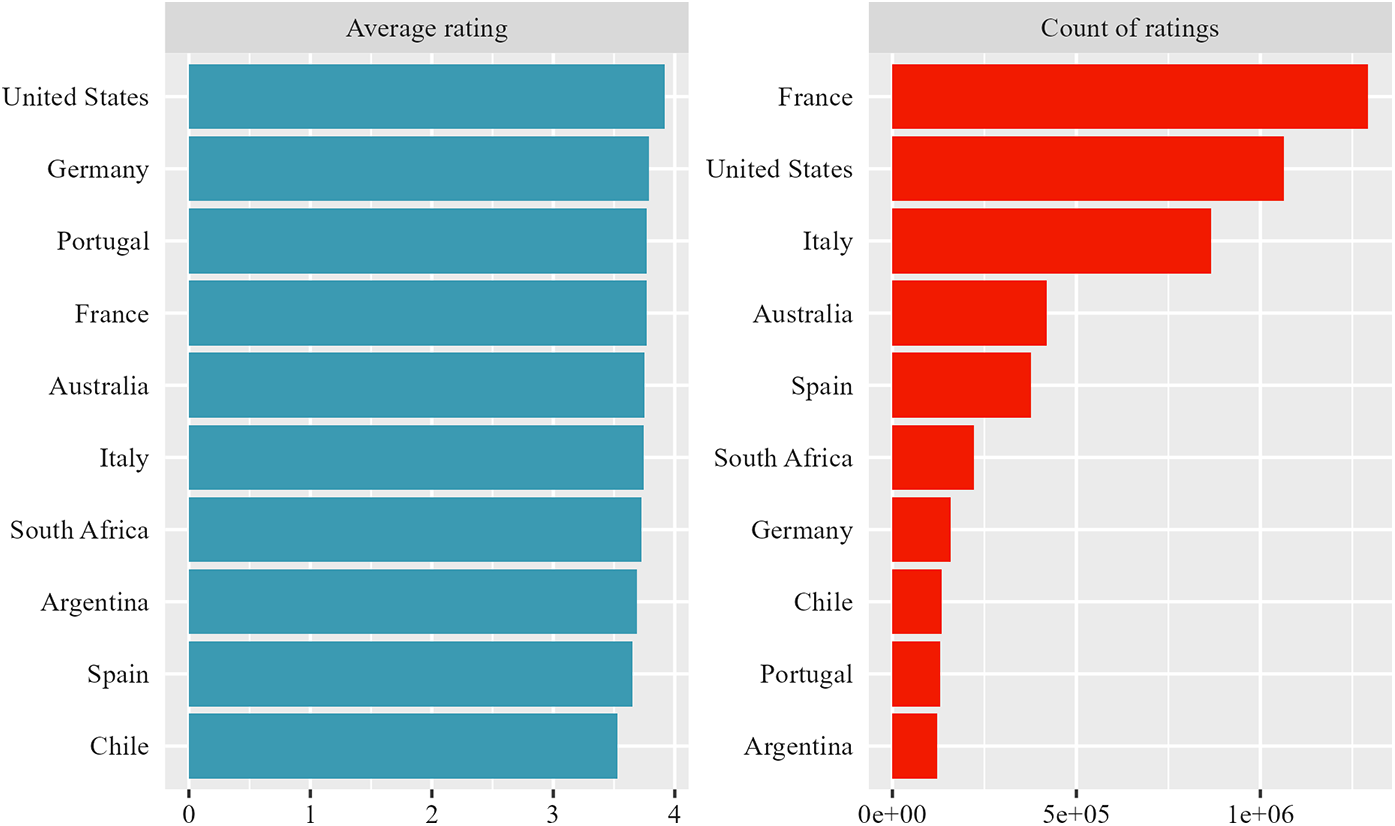
Figure 3 shows the breakdown of both average rating and count of ratings by country for the 10 most common countries in our dataset. France, the United States, and Italy are all heavily represented. However, the average rating does not differ dramatically between countries.
Count of ratings and average rating by country.

Information on users and expert status: A strength of Vivino's review system is that it allows for interaction between different users. Users can like or comment on existing reviews. While this feature is rarely used, it nevertheless permits us to distinguish between expert and non-expert reviews.Footnote 9 We use two decision criteria to separate expert and non-expert Vivino users.
First, we define an expert as a user with a number of followers larger than the 80th percentile.Footnote 10 If we assume that users are more likely to follow an account that produces informative reviews, then experts will end up with the highest follower counts. Users may also follow accounts that review the wines that a particular user is most interested in. If a user is interested in Rieslings from upstate New York, they can likely find an account which reviews many of them. We believe that such specialized accounts are also likely to be experts. Second, we define experts as accounts with an average number of comments per review above the 80th percentile. However, comments can be either positive or negative, so we use the follower count as the key metric of expertise through the rest of the paper.Footnote 11
Our sample contains 5,448,634 reviews, of which 2,340,568 are written by non-experts and 3,108,066 are written by experts, according to our first definition. This discrepancy implies that experts write more reviews, which is unsurprising if experts are the most active users of Vivino. Overall, there are 952,368 reviewers in our sample, of whom 167,740 are experts and 784,628 are not experts. In other words, this strategy identified approximately 17.6% of users as experts.Footnote 12 It also means that the average expert user in our sample has reviewed 18.5 wines and the average non-expert user has only reviewed three wines.
An alternative measurement for expertise is whether the user linked a website on their Vivino profile. While listing a website suggests a strong commitment to wine tasting and the platform, it may also be aspirational. These reviewers may only plan on becoming experts; or list websites not related to wine tasting at all. While it indicates a desire to be taken seriously, it also only identifies a small fraction of users as experts. We include analyses with this measurement for expertise in the appendix; the results are very similar. Next to expert status, reviewers can be described by several other characteristics.
Most of the users in our sample come from the US (40.5%), the UK (12.2%), Australia (5.3%), or Canada (5.2%). Like other social media platforms, the distribution of followers and people followed is uneven. The median user has one follower, but the mean user has 9.9. These numbers reflect that the distribution has a long right-hand tail: the maximum follower count in our sample is 71,926.
Information on wine characteristics: The products within our sample come from a variety of countries and regions. Table 3 shows the breakdown of ratings by country. Two-thirds of the reviews refer to wines from either France (23.7%), the US (19.5%), Italy (15.9%) or Australia (7.1%).Footnote 13 2.8% of reviews describe “natural” wines. For a subset of products we also have information about the price.Footnote 14 The mean price listed for a product reviewed is $45.00; the median price is $40.00.
c. Descriptive statistics
Table 1 summarizes main descriptive statistics for experts and non-experts. Experts leave lower ratings on average (3.72 vs. 3.83); their reviews also contain less positive sentiments (0.25 vs. 0.30). However, reviews by experts are longer on average, have more comments, and have more likes. At the user level, the results show differences in the quantitative measurement of user activity. While experts have left 172.4 ratings and 100.3 reviews on average, non-experts have only left an average of 23.7 ratings and 12.3 reviews. By definition, experts have more followers than non-experts, but they also follow more users.
Summary statistics

Note: This table summarizes descriptive statistics of our main variables. While the upper panel has been calculated using our dataset, the panel at the bottom is based on user-level. The values are taken from the users’ main profile page and do not necessarily coincide with statistics calculated from our data sample. For example, while an expert user in our data sample has written 18.53 reviews on average from the reviews used in our analysis, she has written 100.29 reviews on average overall.
Experts may also produce a herding effect, by which non-experts follow the opinion of experts. A full analysis of herding effects is outside the scope of this paper, but nevertheless, we can nevertheless observe the fraction of ratings which concur with the previous rating. When a non-expert rates a wine, there is a 35.5% chance that the subsequent rating is identical (i.e., if a non-expert gives the wine 4.5 stars, there is a 35.5% chance that the following review also gives the wine 4.5 starts). When an expert reviews a wine, there is a 40.8% change that the subsequent rating is identical to the first. Future research could explore the question of herding effects further.
IV. Empirical strategy
Our empirical strategy comprises three stages. Our goal is to compare the numeric ratings that users give wines to text based reviews. To do so, we use an ensemble machine learning strategy to obtain predicted values for the numerical ratings. These ratings are time-invariant in the sense that they do not take into account the year in which a review was written. They also do not account for any user-level characteristics. We then compare these predicted values to the actual values to show how the latter drift over time. The next stage is to compare the predictions over time and within groups to illustrate the extent to which review inflation pervades both groups. Finally, we use sentiment analysis to further show that individuals rate wines better over time without expressing more positive sentiments in their written reviews.
a. Predicted quality based on text reviews
Reputation inflation does not simply mean that ratings increase over time; rather, reputation inflation means that numerical ratings increase without a commensurate increase in the quality of products. To identify whether this discrepancy increases over time, we use the text reviews to predict a numerical rating. The presence of reputation inflation would imply less consistency between the actual numerical feedback and the predicted value from the texts. Our specific quantity of interest is the root mean squared error (RMSE):
 \begin{equation}
RMSE_{ijt} = \sqrt{\text{mean}\left( Rating_{ijt} - Rating^{pred}_{ijt} \right)^2}\end{equation}
\begin{equation}
RMSE_{ijt} = \sqrt{\text{mean}\left( Rating_{ijt} - Rating^{pred}_{ijt} \right)^2}\end{equation}for product i by user j at time t. Should the discrepancy between the actual numerical rating and the predicted numerical rating increase over time, this change over time would be evidence for review inflation.
Building the predicted text measure is a three step process. First, we use the Doc2Vec algorithm to extract features from the text reviews. Second, we use the resulting feature matrix in a variety of machine learning strategies to obtain predicted values. Third, we construct weighted and unweighted ensembles of these predictions.Footnote 15 We train the model using 80% of the data, leaving 20% to evaluate the model.
The machine learning strategies we use do not take into consideration the year in which a review was written. The training and test set are drawn randomly from all years in our sample. This means that drift in RMSE over time are entirely the result of differences in the relationship between the numerical ratings and the predicted ratings—in other words, “review inflation.”
For the feature extraction we considered three strategies. The simplest strategy is a term frequency (TF) matrix. After stemming the individual words in each review, this strategy creates a matrix which counts how many times the 1,000 most common words were used in each review. However, this strategy cannot distinguish between the relevant importance of different words. A term frequency–inverse document frequency (TF-IDF) strategy overcomes this problem. This approach takes the TF matrix and weights it by the word’s “importance,” measured by the logarithm of the total number of documents divided by the number of documents in which the term appears. However, like the simpler TF strategy, this approach has some flaws. It is a “bag of words” approach in that it does not consider the associations between words or their orders.
After consideration, we adopt a feature extraction strategy called Doc2Vec (Le and Mikolov, Reference Le and Mikolov2014). Doc2Vec is an extension of a framework called Word2Vec, introduced by Mikolov et al. (Reference Mikolov, Chen, Corrado and Dean2013). Like the other strategies, Word2Vec produces a vector space of features. Using a two-layer neural network, it transforms the inputs (i.e., the corpus of documents) into a feature space. However, Doc2Vec also includes some document specific information, making it more suitable for document-level prediction.Footnote 16 Unlike the bag of words strategies, this approach preserves relations between neighboring words. For the remainder of this paper, we report results obtained using features from Doc2Vec, as they produce the clearest results. However, the results are largely similar when replicated with features spaces extracted from the raw text using TF or TF-IDF strategies.
After extracting a feature space from the raw data, we then attempt to predict the numerical score by these features. Often it is unclear which machine learning strategy will perform best in any given space. As such, we try a variety of approaches. We first deploy three flavors of penalized linear regression: Ridge, LASSO, and an elastic net with a mixing parameter of α = 0.5. All three models use cross validation to select the penalty which minimizes mean square error (MSE). We also use a random forest, a neural net, and an XGBoost (eXtreme Gradient Boosting) model. For ease of reading, we compare these models on their RMSE: the average distance of each prediction from the actual answer.
Table 2 shows that across these eight prediction methods, we can achieve an RMSE between 0.581 and 0.725 within the test set. In other words, the predictions made by our models are on average roughly 0.6 away from the true ratings.Footnote 17 We can slightly reduce this error by using the weighted ensemble. We derive weights for the weighted ensemble using a linear regression of each prediction on the true value. The coefficients of this regression are constrained to lie between zero and one, and to sum to one. This gives weights of 0.09 for the LASS0, 0 for the Ridge regression and elastic net, 0.05 for the random forest, 0.86 for the XGBoost, and 0 for the neural net. Table 2 displays the RMSE for each prediction method, broken out by the training and test sets. We use the weighted ensemble method for the remainder of our analyses.
RMSE by prediction method

Note: We extract features using Doc2Vec. Expert is defined here as having above the 80th percentile of followers. We hold out 20% of data as the test set.
b. Sentiment analysis
Beyond predicting quantitative ratings from the text of wine reviews, it is also important for our analysis whether the users actually liked the product in question. To this end, we turn to sentiment analysis of text reviews. In the previous approach, our predictions are agnostic to sentiment. In a sentiment analysis, on the other hand, a document's tone is important. Sentiment analysis distinguishes between positive, neutral, and negative tone in texts. This distinction means that sentiment analysis is a useful alternative metric of review inflation.
Sentiment analysis uses an ordered bag-of-words approach in which it calculates a sentiment for each word and uses a series of weights to aggregate up to a review-level sentiment. These weights account for so-called valence shifters, which can change the sentiment of a word.Footnote 18 We create a sentiment value for each written review in our dataset using the R package sentimentr. This package generates a positive value for reviews with positive sentiment and negative values for a negative sentiment.
As in the previous approach, review inflation would appear as a growing discrepancy between the numerical ratings of wines and the sentiment score we derive from the text reviews. Xiaolin Li et al. (Reference Li, Chaojiang and Mai2019) highlight the effect of numerical ratings on the one hand and textual sentiment on the other hand on product sales. Previous literature in that context had already shown that textual reviews impact product sales (Floh et al., Reference Floh, Koller and Zauner2013; Jabr and Zheng, Reference Jabr and Zheng2014; Ludwig et al., Reference Ludwig, De Ruyter, Friedman, Brüggen, Tin Wetzels and Pfann2013) as well as star ratings (Villarroel Ordenes et al., Reference Ordenes, Ludwig, De Ruyter, Grewal and Wetzels2017). In addition to existing literature showing that in the case of online reviews the specific attributes food, service, ambience, and price are of major importance, Gan et al. (Reference Gan, Ferns, Yang and Jin2017) find that consumers’ sentiments in the attributes mentioned especially explained variation in star ratings. Kim (Reference Kim2021) investigates the usability of sentiment scores for online reviews and concludes that these are less likely skewed to extreme values than numerical ratings.
V. Results
Figure 4 shows how the average numerical rating users assign to wines increased between 2014 and 2020. The blue line shows the average prediction, binned within months. The figure also distinguishes between expert and non-expert users, the cut-off being whether the user's follower count is above the 80th percentile. Across both subgroups, the story is consistent.Footnote 19 Among non-experts, the average score increases from 3.63 in January of 2014 to 3.88 in December of 2020. Among experts, the average score increases from 3.60 in January of 2014 to 3.82 in December of 2020. These figures represent a 6.8% and a 6.3% increase, respectively. These results are strongly consistent with our first hypothesis: the average rating increases over time.
Actual and predicted wine ratings by user follower count.

Figure 4 is also strongly consistent with our second hypothesis. At the beginning of our study period in January 2014, predicted ratings were on average 0.15 points higher than actual ratings for experts and 0.09 points higher than actual ratings for non-experts. However, as time passes, the actual ratings increase while the predicted ratings stay relatively constant and do not show much variation. At the end of our study period in December 2020, the predicted rating was on average 0.03 points lower than the actual rating for experts and 0.09 points lower for non-experts. Contrary to our third hypothesis, review inflation is present in both. Experts do not appear immune to review inflation—they are equally subject to it. These results suggest that both experts and non-experts consistently give higher scores for wines over time despite providing similar qualitative descriptions.
Figure 4 shows clear evidence of review inflation over time. Our prediction model does not take the date of the review or the score given by the user into account. As a result, even while the actual ratings are increasing over time, the predicted ratings are relatively constant. Because the model is predicting scores consistent with the last few years of numerical ratings, the difference between actual and predicted values shrinks over time, but this is nevertheless consistent with our second hypothesis. Numerical feedback and pure qualitative evaluations diverge over time.
Furthermore, our model's predictions are much more consistent for users which we classify as experts. RMSE for reviews written by experts are lower, which means our model is better able to predict the actual numerical scores from the written scores.
Review length could complicate this analysis. Expertise and brevity seldom go hand-in-hand. It may be the case that expert reviewers are simply writing more verbose reviews, which therefore contain more information that we can use to predict the numeric scores. For example, reviewers with a linked website on their Vivino profiles have an average review length of 162 characters; those without average only 97 characters. Table 3 shows the RMSE broken down by subgroup. Each entry shows the average distance between the true value and the predicted value. Expert reviews have consistently lower RMSEs than non-expert reviews—they contain more information. Moreover, long reviews are not necessarily more informative than short reviews. If anything, they produce noisier estimates.
Average prediction error is lower for expert reviewers

Note: We obtain predictions using a weighted ensemble on features extracted via Doc2Vec. Experts have 5 or more followers, the user-level 80th percentile. Long comments have above the median word length, independent of user expertise. These statistics come from only the test set.
Figure 5 shows the distribution of error in these estimates for each decile of review length, broken down by whether or not the reviewer is classified as an expert. This figure confirms the intuitions provided by Table 3: the length of the review does not have a systematic effect on the accuracy of our predictions.
Density of prediction error by decile of review length.

Our sentiment analysis further supports that review inflation afflicts both expert and non-expert reviews. Figure 6 shows how overall sentiment remains relatively stationary in both groups. While we do not display the quantitative ratings in this figure, we saw before that the ratings instead rise over time (cf. Figure 4). This figure further confirms that growth in ratings among experts and non-experts is independent of the actual quality of the wine. The sentiment analysis approach captures the extent to which individuals speak positively of the wines. In this case, it illustrates that the upward trend in ratings is not matched by more positive sentiments. People are giving higher scores to wines regardless of whether they like the wines more or less.
Average sentiment score by reviewers’ expertise.

To summarize our results, the numerical ratings of wine on Vivino increase on average over time. However, when we use an ensemble machine learning strategy to predict these numerical ratings based on the text reviews which accompany them, the predicted ratings are constant. Consequently, RMSE grows over time. These findings support our first and second hypotheses. These error rates are lower for users we identify as experts, independent of the length of the reviews, which supports our third hypothesis. However, we find no support for our fourth hypothesis: users we classify as experts are no less susceptible to review inflation.
VI. Conclusion
In this paper, we study the existence of reputation inflation and whether certain groups of users are more susceptible than others. We define reputation inflation as an increase in quantitative ratings without an equivalent increase in actual ratings. Specifically, we examine review inflation using numeric and text ratings from Vivino, a large online wine review and market platform. Such ratings are an important part of the digital economy, but they increasingly skew towards the positive end of the spectrum, leaving little information for both producers and consumers.
We first show that ratings do increase over time, from 3.67 out of five in 2014 to 3.86 in 2020. We then use an ensemble machine learning strategy to predict numerical ratings purely from the text-based qualitative reviews. Unlike the numeric ratings, the ratings predicted from the text are steady over time. These results are consistent with review inflation: numeric ratings increased without an increase in underlying quality. These differences are independent of the length of the text review. We also use a sentiment analysis of these written reviews to rule out a positive change in reviewer sentiment over time.
We also distinguish between so-called expert and non-expert reviewers, using a cut-off of the 80th percentile of follower count. In other words, we consider users with more than five followers to be experts. We find that reviews left by experts are more informative, in that our ensemble prediction has a lower RMSE when predicting numerical ratings left by experts. A qualitative analysis of expert and non-expert reviews suggest that experts use fewer vague words like “smooth” or price-based terminology, which may not hold as much predictive weight. However, we find that expert reviewers are equally susceptible to review inflation.
The prominence of review systems in the online economy makes review inflation an important subject. Truthful reviews benefit consumers by helping them to distinguish between different products and services on an online market. Truthful reviews also benefit service providers or sellers. Uber, for example, rates both riders and drivers. This articles contributes to a growing literature which quantifies and explains this review inflation. It shows how heterogeneity within reviewer pools may contribute to consumer loss due to review inflation. Previous literature has largely treated reviewers as homogeneous, but this paper advances the literature by distinguishing between standard users and so-called experts, who we would expect to be less susceptible to review inflation. While both standard users and expert users alike have contributed to review inflation on “the world's largest wine marketplace,” the fact that expert reviews more accurately predict quantitative ratings shows the need for a greater understanding of online review systems and review inflation specifically.
Acknowledgments
The authors thank an anonymous reviewer at the Journal of Wine Economics for their feedback on this paper.
Competing interests
The authors declare none.
Appendix A. Alternative metric for expertise
In this article, we define “experts” as having a number of followers above the 80th percentile on Vivino. We also considered two alternative definitions of reviewer expertise: whether the average number of comments per post is above the 80th percentile, and whether or not a user links a website to their Vivino profile.
Average prediction error is lower for expert reviewers

Note: We obtain predictions using a weighted ensemble on features extracted via Doc2Vec. Expert is defined as above the 80th percentile of comments/followers.
Actual and predicted wine ratings by user expertise.

Density of prediction error by decile of review length.

Average sentiment score by user expertise.


 Open access