


1. Introduction
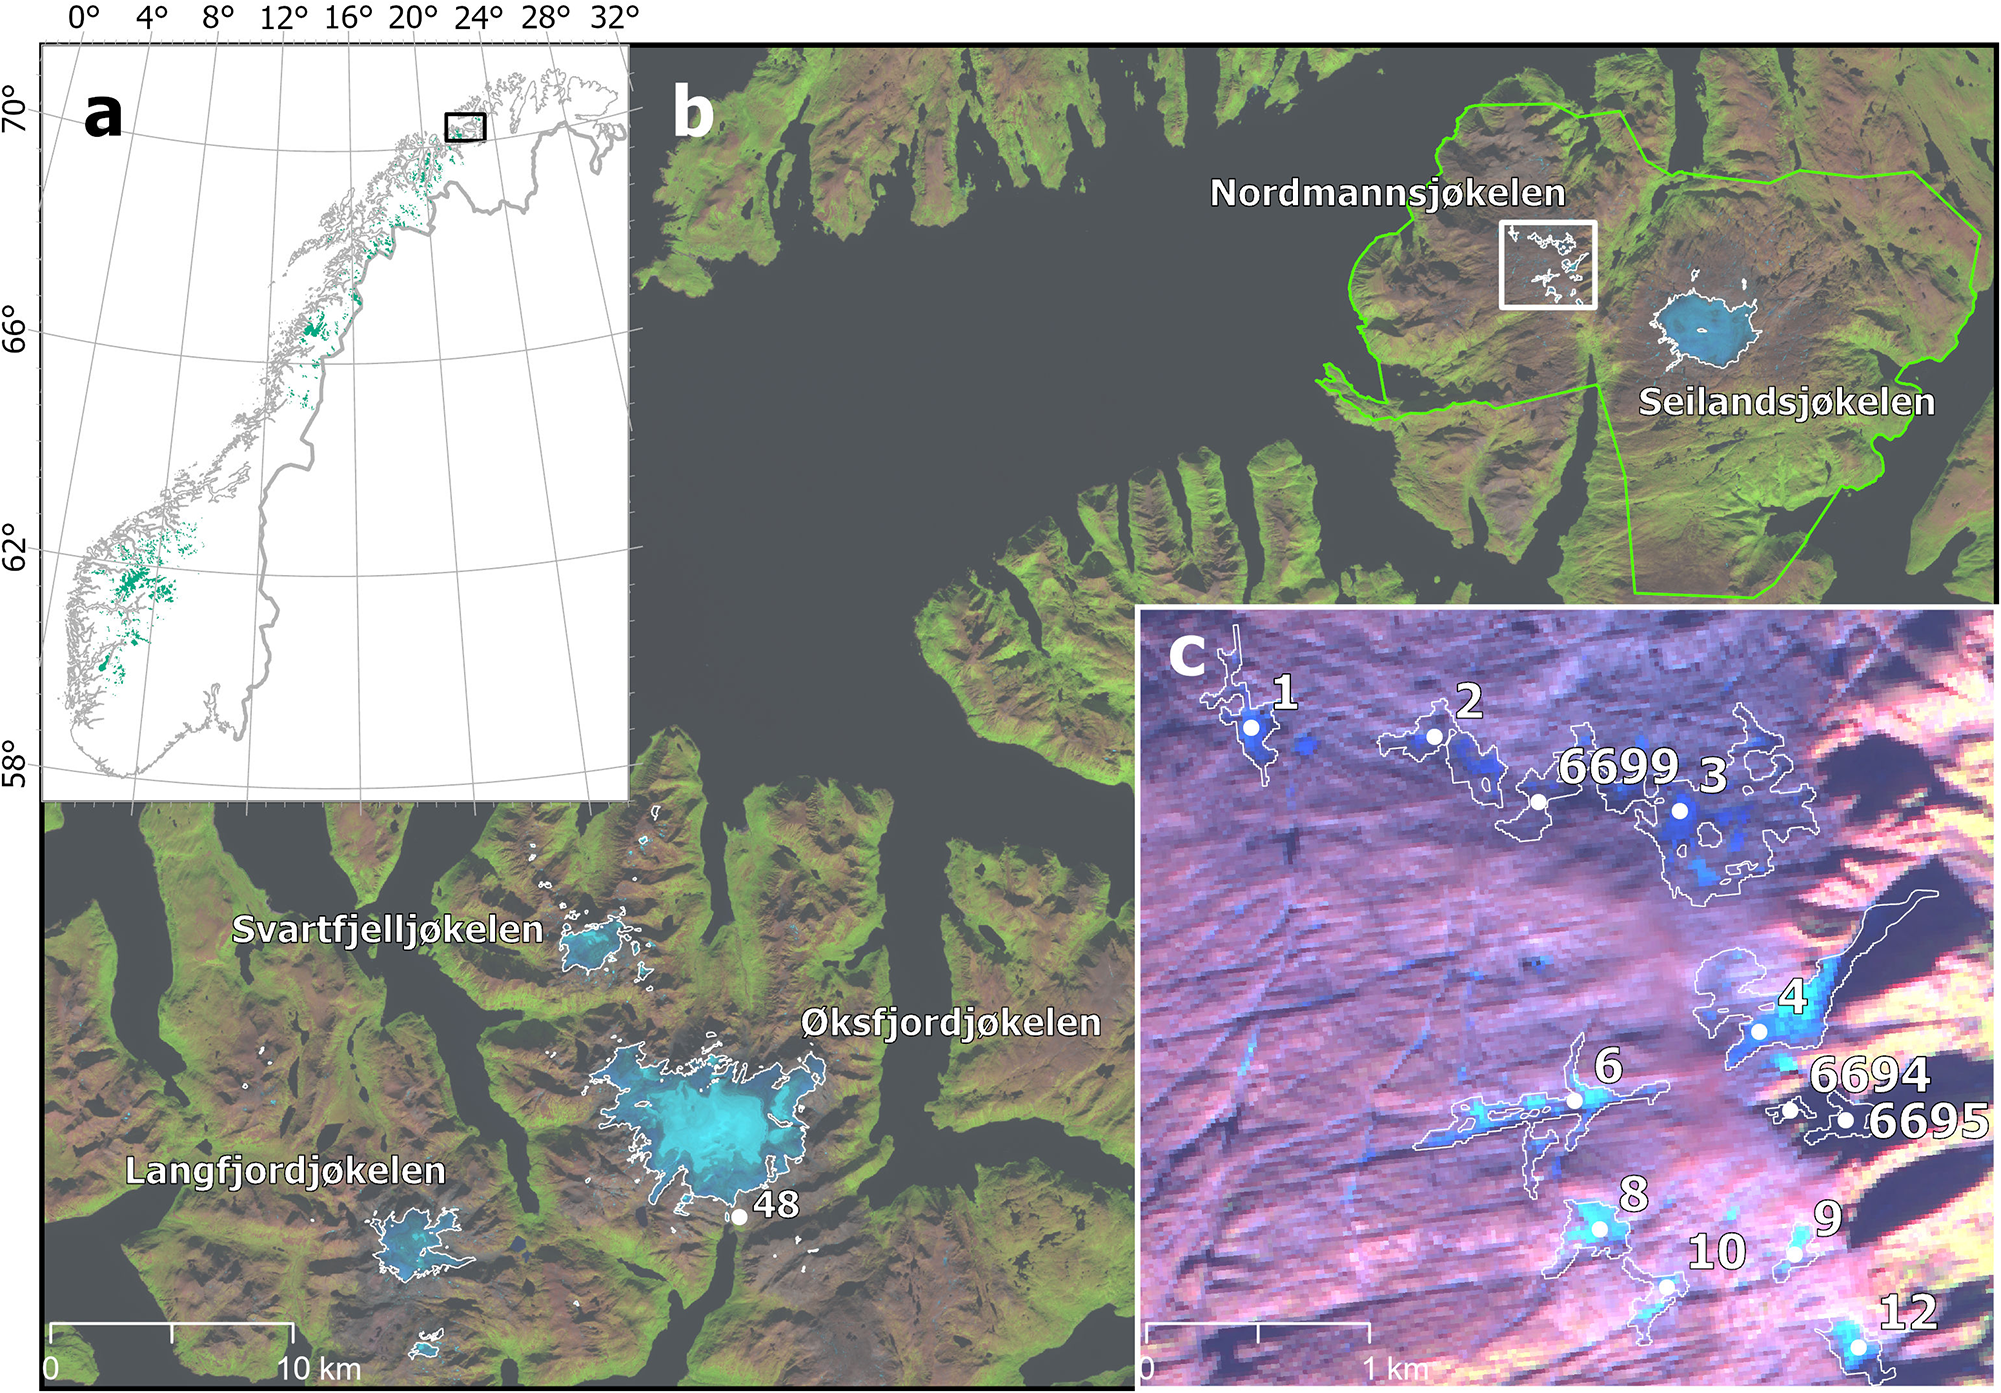
Nordmannsjøkelen, known in Northern Sami as Dáččavuonjiehkki, is a glacier complex situated at 70°27’N, 23°06′E on Seiland Island within the Seiland National Park, Finnmark County, in northern Norway. This glacier, once classified as an ice cap, has undergone major changes since the beginning of the 1900s to 2006 with a total area reduction of 91% (Winsvold and others, Reference Winsvold, Andreassen and Kienholz2014). It is the northernmost glacier (Glacier ID 1) in both Norway and mainland Europe (Andreassen, Reference Andreassen2022; Fig. 1c). Nordmannsjøkelen is included in the Global Glacier Casualty List (Boyer and Howe, Reference Boyer and Howe2024). Norwegian glaciers have been systematically documented through several national glacier inventories, with the most recent surveys from 1999/2006 to 2018/2019 using optical satellite data from the Landsat and Copernicus Sentinel-2 missions, respectively (Andreassen and others, Reference Andreassen, Winsvold, Paul and Hausberg2012b, Reference Andreassen, Nagy, Kjøllmoen and Leigh2022). Several decades of pronounced retreat have been observed for Norwegian glaciers. A total of 364 km2 of glacier area and 20 individual glaciers have disappeared in Norway between the first and second inventories based on optical satellite imagery (Andreassen, Reference Andreassen, Nagy, Kjøllmoen and Leigh2022; Andreassen and others, Reference Andreassen2022). In this paper, we use previous datasets along with new datasets from Sentinel-2 satellite imagery, orthophotos, a digital terrain model (DTM2020) and a 1970 N50 topographic map to document glacier area and elevation change of Nordmannsjøkelen from ∼1900 to 2024.
The panels (a) and (b) show the northernmost glaciers in Norway: Nordmannsjøkelen, Seilandsjøkelen, Svartfjelljøkelen, Øksfjordjøkelen, and Langfjordjøkelen. Glacier IDs for Nordmannsjøkelen and outlines (in white) from the Norwegian glacier inventory, and Nerisen (48), are shown (Andreassen and others, Reference Andreassen, Nagy, Kjøllmoen and Leigh2022). The background in (b) and (c) is a Sentinel-2 satellite image in false colours from 2 September 2024.
Source: Copernicus Sentinel-2 data 2024.

2. Study region
Seiland National Park (known in Northern Sami as Sievjju álbmotmeahcci) has an area of 316 km2 and is in Alta and Hammerfest municipalities (Fig. 1b). The national park encompasses a diverse and rugged landscape, including fjords, alpine terrain, and several small glaciers. In 2018, Nordmannsjøkelen (70°26’27.6”N, 23°06’46.8”E) had an elevation range of 498 to 1046 m a.s.l. and an area of 1.18 km2 (Andreassen, Reference Andreassen2022). To its east lies the ice cap Seilandsjøkelen (8.8 km2). Other glaciers in Finnmark that are still classified as ice caps include Langfjordjøkelen (6.2 km2), Svartfjelljøkelen (3.6 km2) and Øksfjordjøkelen (36.2 km2) (Fig. 1). Among these, Øksfjordjøkelen is the largest of the five northernmost glaciers and the ninth largest glacier complex in Norway. The nearby glacier Nerisen (GlacierID 48, marked as 48 in Fig. 1b), part of the Øksfjordjøkelen ice cap, is the lowest-lying glacier in Norway and extends from 25 to 202 m above sea level (Andreassen and others, Reference Andreassen, Nagy, Kjøllmoen and Leigh2022). Ice from Nerisen was historically used in the fishing industry for cooling fish until the 1940s (Hoel and Werenskiold, Reference Hoel and Werenskiold1962). This close connection with commerce illustrates the long-standing importance of glaciers in the region.
The glacier inventories conducted by Østrem and others (Reference Østrem, Haakensen and Melander1973) and by Andreassen and others (Reference Andreassen, Winsvold, Paul and Hausberg2012b) divided Nordmannsjøkelen into three glacier units. In Andreassen and others (Reference Andreassen, Nagy, Kjøllmoen and Leigh2022), glacier fragmentation resulted in additional glacier units that were assigned distinct Glacier IDs. Only Glacier IDs 3 and 4 were assigned as ‘glacier’ (Fig. 1c), and the rest of the Glacier IDs were assigned as ‘ice patches’. In this work, when we refer to Nordmannsjøkelen, we refer to these glacier IDs (in Fig. 1c).
3. Data and methods
3.1. Glacier area and outline datasets
In this study, glacier area outlines for Nordmannsjøkelen spanning more than a century are used in the analysis, combining historical datasets with updated results derived from recent satellite imagery and orthophotos. Historical glacier outlines were derived from digitized orthophotos, previous glacier inventories, and topographic analogue maps that have been digitized and published in earlier studies. In this study, we incorporate glacier inventories GI1900 (Winsvold and others, Reference Winsvold, Andreassen and Kienholz2014), GI1990 (Winsvold and others, Reference Winsvold, Andreassen and Kienholz2014), GI2000 (Andreassen and others, Reference Andreassen, Winsvold, Paul and Hausberg2012b) and GI2018, the most recent national glacier inventory for Norway (Andreassen and others, Reference Andreassen, Nagy, Kjøllmoen and Leigh2022). We also use a map, orthophotos and Sentinel-2 images to create new glacier outlines for 1970, 2016, 2023, August 2024 and September 2024 (Table 1).
Area of Nordmannsjøkelen between ∼1900 and 2024. Ap = Orthorectified aerial photographs, NMA = Norwegian Mapping Authority, USGS = U.S. Geological Survey. We use the 1970 glacier outlines as a constraint. See Table S1 for uncertainty measures.

* Refined glacier areas (km2) were calculated for the years 2023 and 2024 using the 2018 glacier outlines as a constraint. Small ice patches and perennial snowfields located in gullies and below ridges have been omitted.
The maximum extent of Nordmannsjøkelen, GI1900, is digitized from an old analogue map from a map series called “Gradteigskart” (174-106). This historical source of data tends to overestimate glacier extent and should not be used as an actual benchmark, but rather as an estimate (Østrem and Haakensen, Reference Østrem, Haakensen, Williams and Ferrigno1993; Winsvold and others, Reference Winsvold, Andreassen and Kienholz2014). A study of Langfjordjøkelen revealed a substantial overestimation of the map-based glacier outline (Weber and others, Reference Weber, Lovell, Andreassen and Boston2020), this may also be the case for Nordmannsjøkelen, thus the 1900 area is considered an upper estimate. We derived new glacier outlines for Nordmannsjøkelen using Sentinel-2A and Sentinel-2B Multi Spectral Imager (S2A MSI and S2B MSI) satellite imagery, which was acquired on 27 August 2023, 8 August, and 2 September 2024. The Sentinel-2 data have a spatial resolution of 10 m, and Level-1C top-of-atmosphere (TOA) reflectance products were used, consistent with recent glacier mapping studies (e.g. Maslov and others, Reference Maslov, Persello, Schellenberger and Stein2025). Glacier outlines were extracted using a standard semi-automated band ratio method based on band 4 (red) and band 11 (SWIR), following established approaches (e.g. Paul and others, Reference Paul, Kääb, Maisch, Kellenberger and Haeberli2002; Winsvold and others, Reference Winsvold, Andreassen and Kienholz2014). Threshold values of 3.2 and 2.5 were applied to the 2 September and 8 August images, respectively, to optimize delineation. All outlines were manually checked against the imagery and the 2024 orthophoto. Band 2 (blue) was not included in the ratio due to limited shadowed areas, and the Red/SWIR ratio performed well in this region. We excluded polygons smaller than 0.0012 km2. The 2023 glacier outline was manually digitized from Sentinel-2 imagery without applying the band ratio method.
Additional new glacier outlines were derived from orthophotos via norgeibilder.no, a WMS service operated by the Norwegian Mapping Authority (Kartverket, 2025). Images were available from 14 August 1970, 10 September 2008, 19 August 2016, and 4 August 2024. On 10 September 2008, a minor snowfall had occurred, causing uncertainty in delineating the glacier margin in certain areas. This dataset was therefore not included in this study. The other three orthophotos were of good quality, with visible glacier ice and minimal seasonal snow. Glacier outlines were manually digitized.
The 1970 outlines were derived from the same aerial photos used in the N50 topographic map (Winsvold and others, Reference Winsvold, Andreassen and Kienholz2014) and in the first glacier inventory of North Scandinavia (Østrem and others, Reference Østrem, Haakensen and Melander1973). Our newly digitized outline from the 1970 orthophoto had an area of 4.4 km2 (Table 1). This is smaller than the area of 4.5 km2 in N50, and larger than the total area of 3.1 km2 reported by Østrem and others (Reference Østrem, Haakensen and Melander1973). The differences point to the need to check the original sources where possible; the uncertainties in mapping glacier outlines in general due to snow conditions, and the differences in interpretation, in what to include or exclude in the glacier perimeter, between observers (e.g. Fischer and others, Reference Fischer, Huss, Barboux and Hoelzle2014).
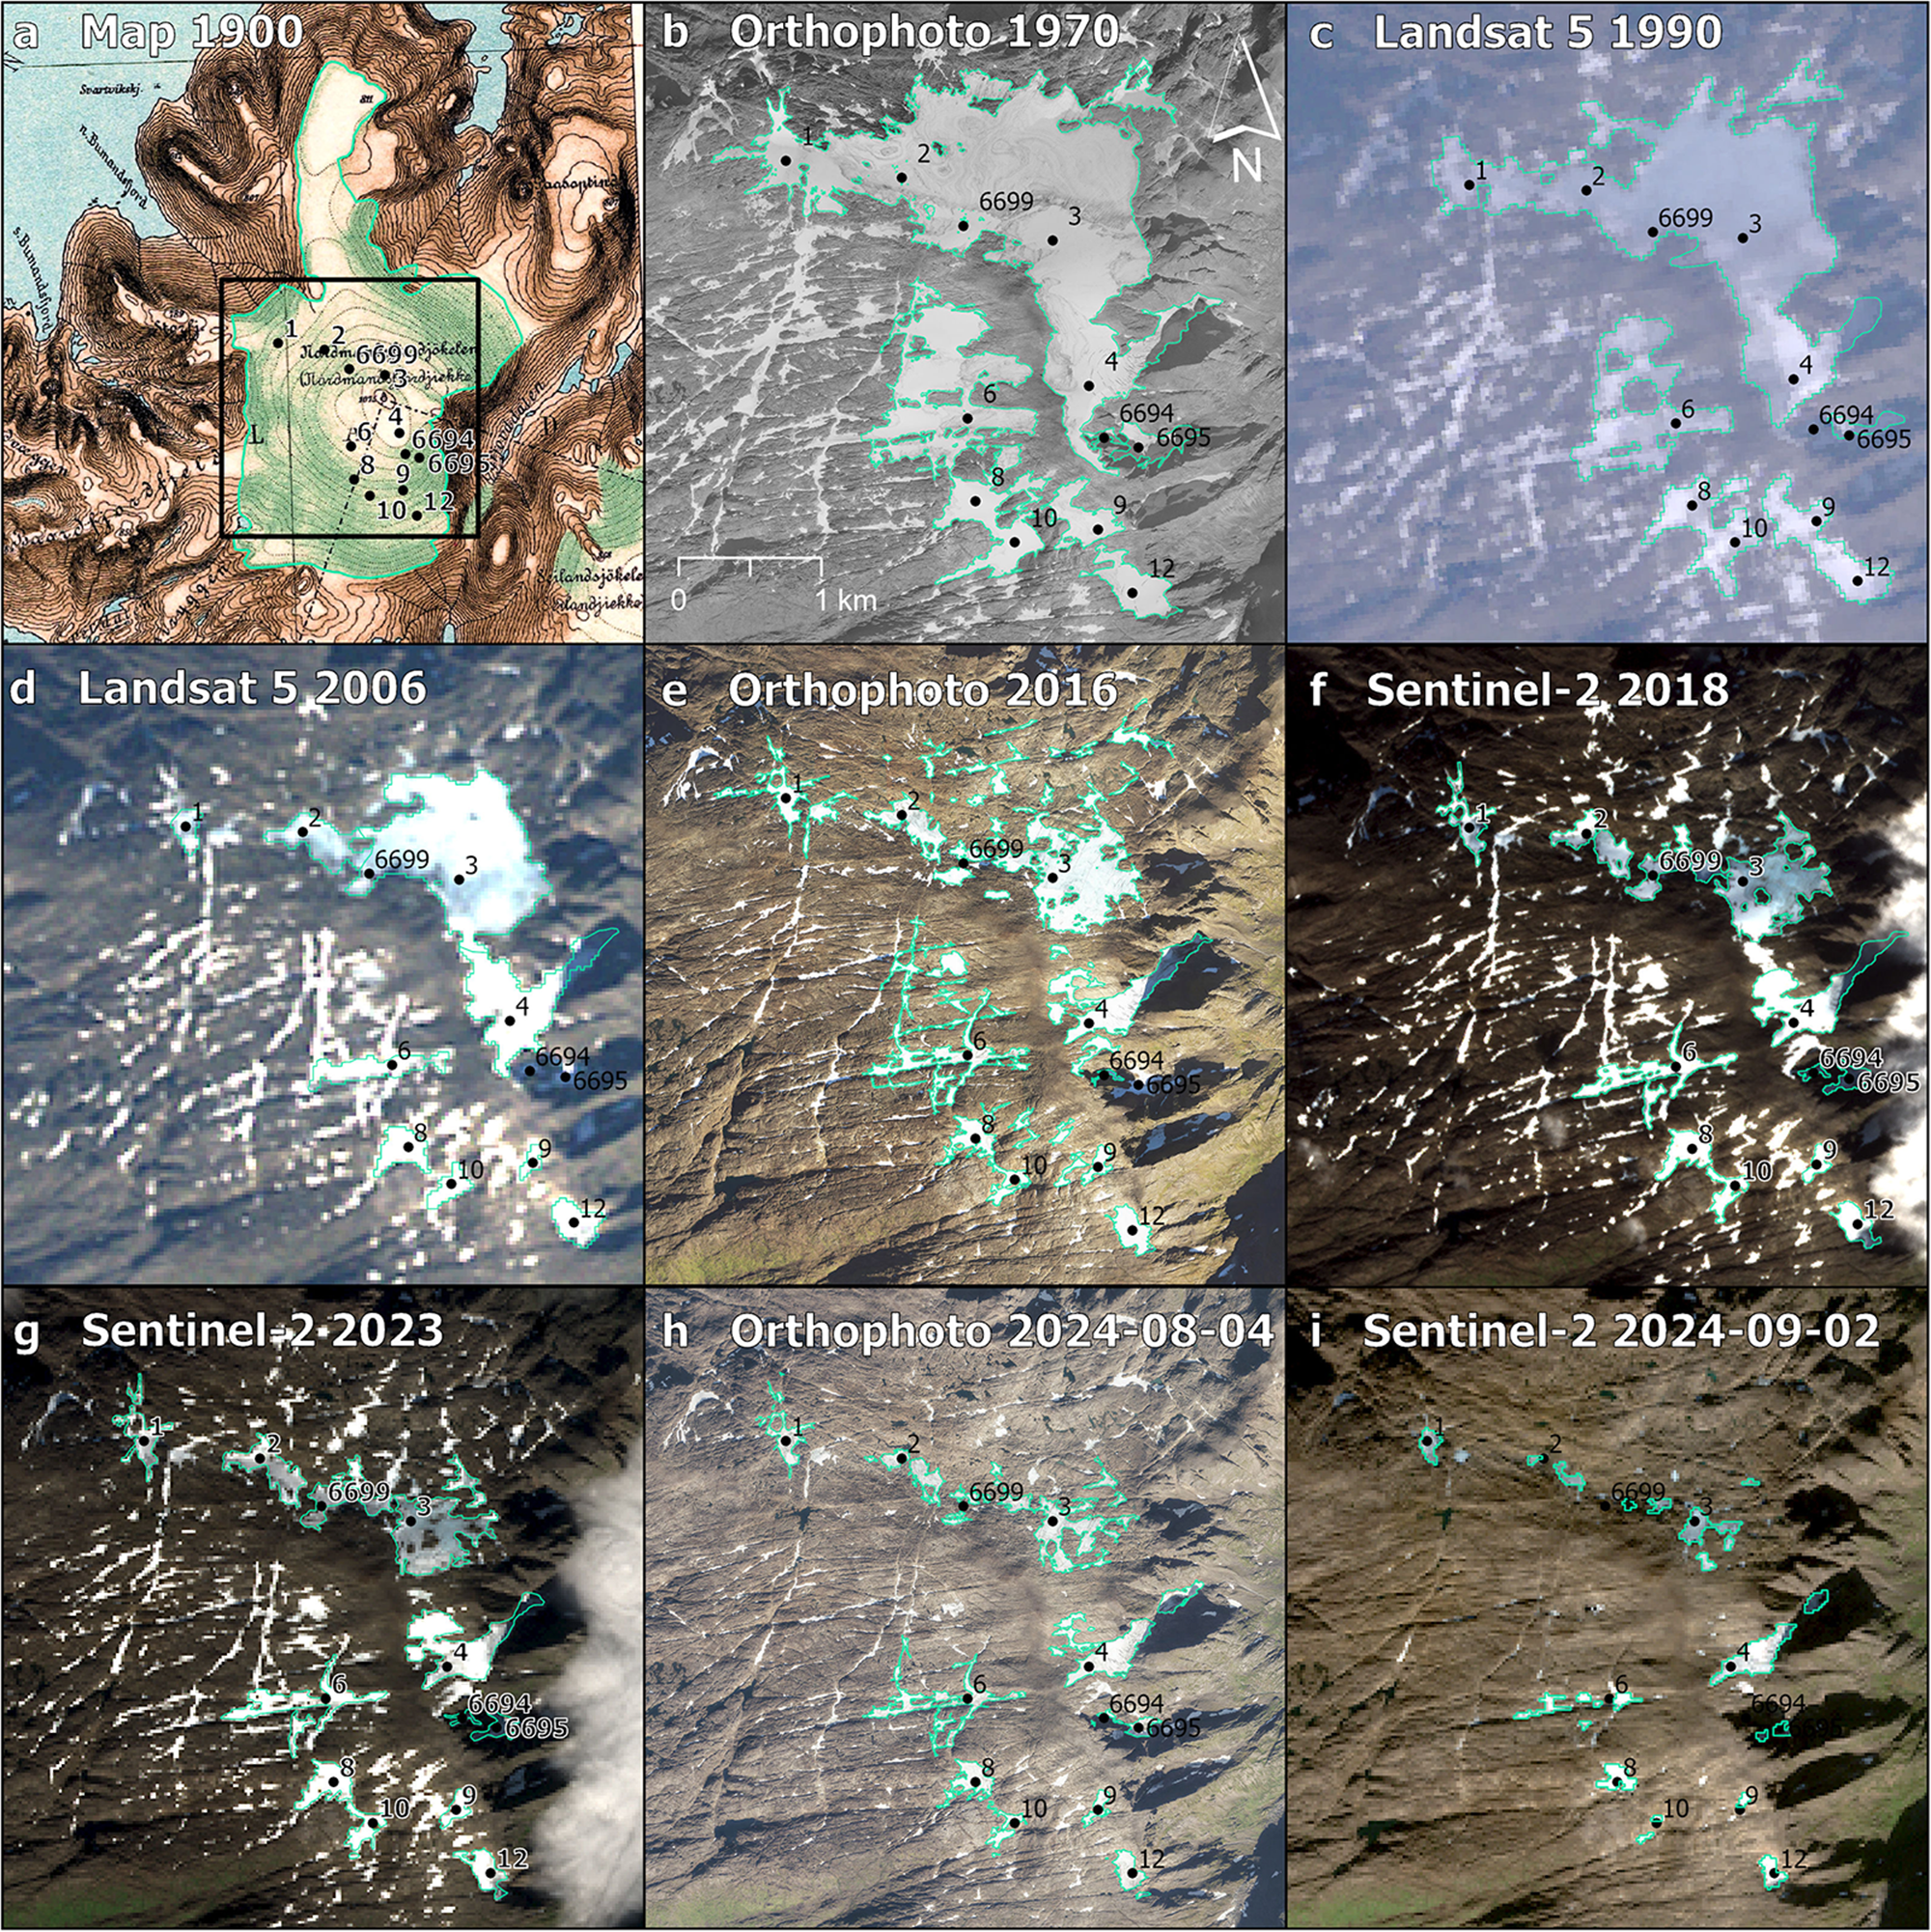
The datasets used have different spatial resolution, ranging from orthophotos (0.25–0.50 m pixel spacing) to Sentinel-2 MSI and Landsat 5 Thematic Mapper (L5 TM) satellite images (10 m and 30 m pixel spacing, respectively). This influences the mapping accuracy and details in the mapped glacier outlines. The higher spatial resolution provides more details and enables not only the inclusion of smaller ice patches, but may also include more seasonal snow covering the glacier (e.g. Paul and others, Reference Paul, Winsvold, Kääb, Nagler and Schwaizer2016; Andreassen and others, Reference Andreassen, Nagy, Kjøllmoen and Leigh2022). An example of this is shown in Fig. 3e, where irregularly shaped snow or ice patches in ridges and gullies may be interpreted as glacier ice. These may not be distinguishable on lower-resolution satellite imagery. Comparing the 2024 glacier outlines from the 4 August 2024 orthophoto and the 8 August 2024, the Sentinel-2 image revealed that some of the smallest glacier and snow patches included in orthophoto were not visible or were hard to distinguish in the Sentinel-2 imagery 4 days later. As a result, there is a slight discrepancy between the two datasets of 0.09 km2, or 13% of the glacier area.
The glacier outlines from different sources were revised and modified using the ArcGIS Pro tool. The 1970 outline was initially used as a baseline, with later outlines trimmed to match within its extent. However, due to the glacier’s substantial retreat and fragmentation, this reference proved unsuitable for recent datasets. To avoid overestimating glacier area from seasonal snow and small ice patches, the 2018 inventory (GI2018) was used to refine the 2023 and 2024 outlines (Table 1). To estimate uncertainties in glacier area measurements, we applied a buffer method commonly used in previous studies (e.g., Granshaw and Fountain, Reference Granshaw and Fountain2006; Paul and others, Reference Paul2013; Pelto and others, Reference Pelto, Menounos and Marshall2019; Andreassen and others, Reference Andreassen, Nagy, Kjøllmoen and Leigh2022). The buffer method was applied to all datasets in this study, except for the ∼1900 dataset. For outlines from orthophotos, a ± 1 m buffer was used, and ± 5 m for the 1970 orthophoto due to visible seasonal snow. For Sentinel-2 data, both ± 5 m and ± 10 m buffers were tested, with ± 5 m selected as the final uncertainty estimate. The uncertainty estimate was nearly twice as large when a ± 10 m buffer was applied (between ± 25% and ± 48%). A buffer of ± 15 m was calculated for Landsat 5 TM 1990 and 2006 images. Resulting area uncertainties range from ± 1.5% to ± 7.4% for orthophotos, ±14% to ±24% for Sentinel-2, and ± 17% to ± 19% for Landsat (see Table S1). Uncertainties for the previously published datasets GI1990, GI2000, and GI2018 were also estimated (see Table S1 and Table 1).
3.2. Glacier elevation change 1970–2020
To assess changes in glacier elevation and geodetic mass balance, we digitised contour lines with 20 m altitude intervals and elevation points based on the N50 topographic map 1835-I SEILAND, published in 1979, based on aerial photography from 1970. We compared this with LiDAR data surveyed on 12 September 2020 from the Norwegian Mapping Authority (Høydedata, 2025). This LiDAR survey had no accompanying orthophotos that could be used for glacier outlines; therefore we used the 2018 Sentinel-2 outline to approximate the 2020 glacier extent. We tested delineating glacier outlines from a hillshade product made from the LiDAR data, but it proved challenging due to steep slopes, especially in the eastern glacier units. The LiDAR data were used to derive a 2 m and 10 m digital terrain model (DTM), referred to as DTM2020. The elevation changes for the period between 2020 and 1970 were calculated within the 1970 glacier outlines, which comprise six distinct glacier bodies and represent the largest glacier mask (Fig. 3b), including snow patches in ridges and gullies in the southwest, and excluding the smallest glacier remnants.
Generally, DTMs derived from high-quality LiDAR data sets are very accurate. The accuracy of the LiDAR dataset from 2020 is documented to be within ± 0.10 m with a standard deviation of 0.04 m. The 1970 elevation dataset, derived from 20-meter contour lines, has a much larger uncertainty. To assess the uncertainty in the 1970 elevation dataset, we compared elevation contours in glacier- and snow-free areas surrounding Nordmannsjøkelen from the N50 topographic map and a 2 × 2 m resolution grid from DTM2020 (Høydedata, 2025). A total of 268 control points with slopes less than 30° were selected from various locations around the glacier for comparison. The average difference between 1970 and 2020 was + 0.1 m, with elevation differences ranging from −10.6 m to +19.5 m and a standard deviation of 3.8 m. Of the 268 control points, 156 (58%) were within ± 2 m. This comparison indicates a fairly good agreement between the two datasets. We conservatively estimate the overall elevation uncertainty to be within ± 2 m.
The volume change, ΔV, was converted to geodetic mass balance, Bgeod:
 \begin{equation}{{\text{B}}_{{\text{geod}}}}{{ \,= \Delta \textrm{V} \,\times }}\,{{\text{f}}_{{{\Delta \textrm{V}}}}}{\text{/A}}\end{equation}
where A is the average glacier area of the two surveys assuming a linear change in time and fΔV the density conversion factor of 850 ± 60 kg m−3 (Huss, Reference Huss2013). The uncertainties in geodetic balance were quantified from the elevation–change uncertainty (± 2 m), area uncertainty (± 7.4%), and density conversion uncertainty (± 60 kg m−3).
4. Results
4.1. Glacier area changes on Nordmannsjøkelen over the past century
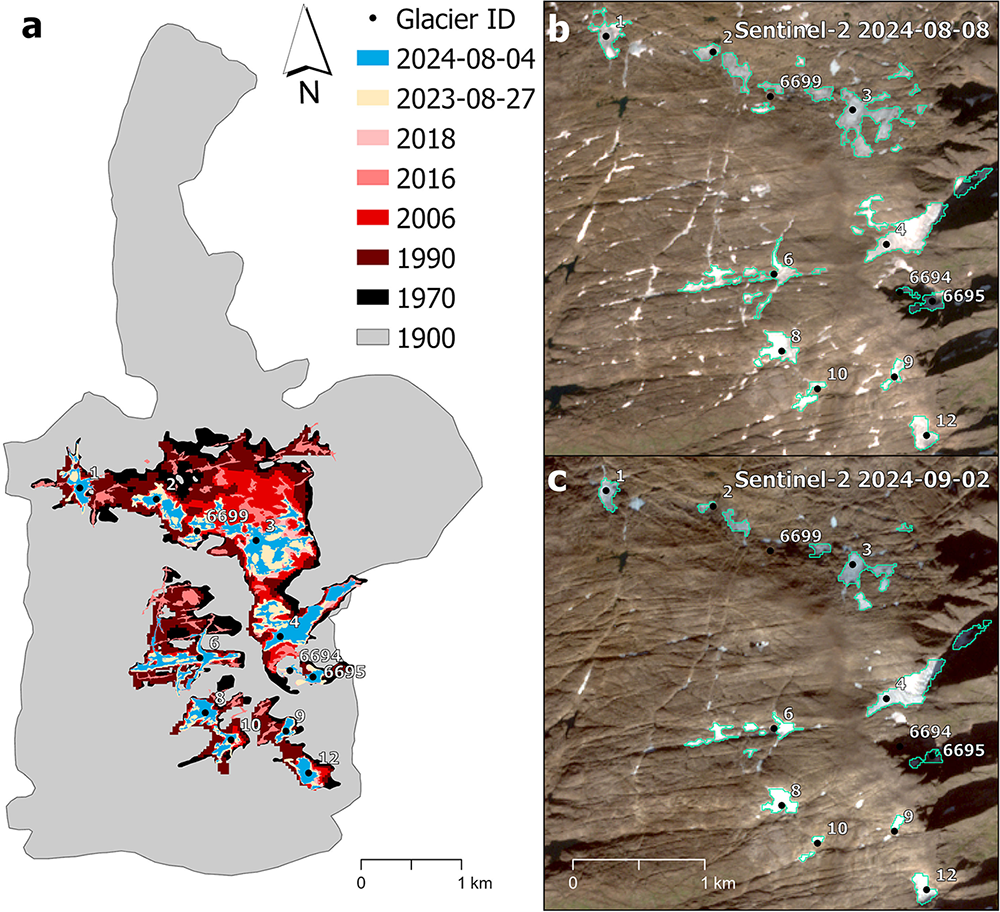
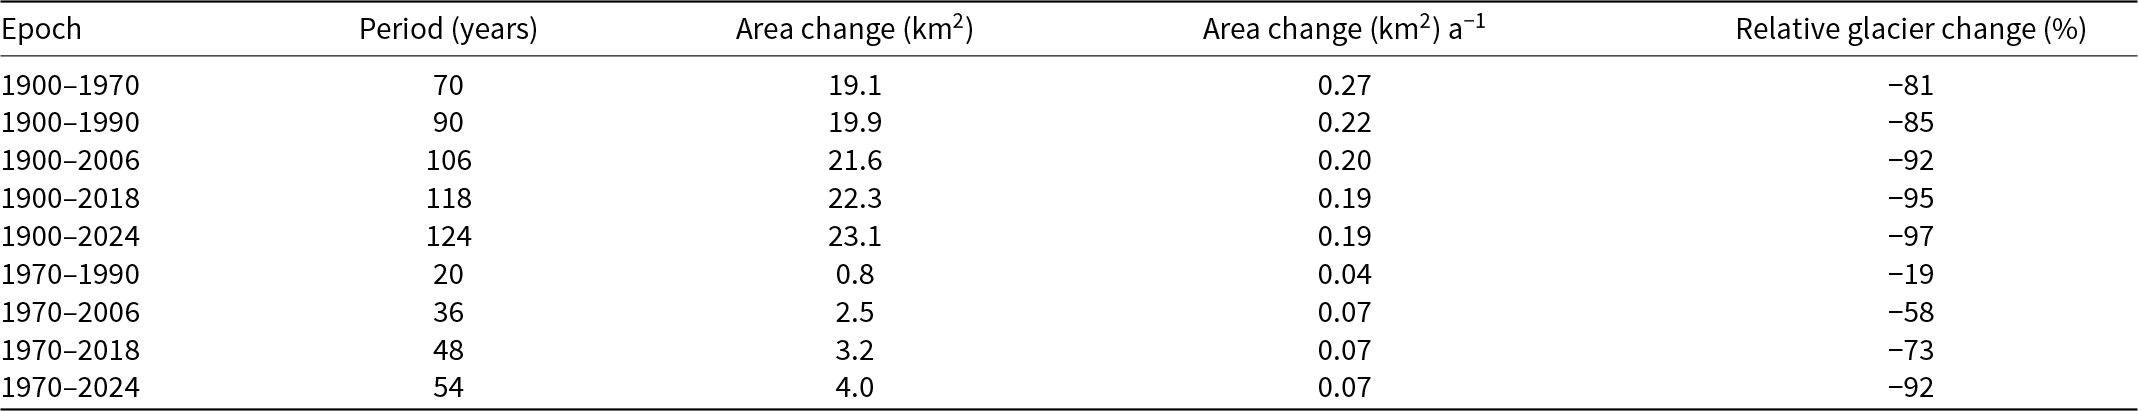
Around 1900, Nordmannsjøkelen covered an area of about 23.5 km2 and was mapped as one big ice cap with several outlets (Table 1, Fig. 2a). Over the period ∼1900 to 1970, Nordmannsjøkelen divided into several parts (Figs. 2a, 3b). In 1970, the total estimated area was 4.4 km2 ± 0.33 and the glacier had lost 19.1 km2 of its area (−81%, −0.3 km2 a−1, Fig. 2a). As noted, the area of ∼1900 might be overestimated, so we denote this as a maximum area loss. Due to the likely overestimation of glacier extent in ∼1900, we also assessed glacier change from 1970 to present (Table 2). In 1970, Nordmannsjøkelen still had a larger part covering the northern part of the plateau, but southern parts were disintegrating into multiple smaller glacier units and snow/ice patches (Figs. 2 and 3). By 1990, the area had decreased to 3.6 ± 0.59 km2, and by 2006 to 1.9 ± 0.35 km2 (Fig. 3c, d). The retreat continued, and in 2018 the glacier covered 1.2 ± 0.18 km2 (Fig. 3f). In 2023, the area was mapped at 1.1 km2 ± 0.16. The orthophoto mapping from 4 August 2024 shows a remaining glacier area of 0.7 km2 ± 0.05 (Fig. 3h), whereas the Sentinel-2 imagery from 8 August 2024 shows an area of 0.6 km2 ± 0.15 (Table 1). The most recent mapping of Nordmannsjøkelen shows an almost vanished glacier, with an area of 0.4 km2 ± 0.08 (2 September 2024) (Figs. 2 and 3i, Table 1).
(a) Multi-temporal glacier outlines listed in Table 1 for Nordmannsjøkelen. (b) and (c) show two additional Sentinel-2 images with glacier outlines in green which illustrate the retreat within 2024 (8.8.2024 and 2.9.2024).
Source: Copernicus Sentinel-2 data 2024.

Illustration of the data sources used for glacier outlines (in green) in this study. (a) Historical map (gradteigskart). The black square in the 1900 frame indicates the extent of the other figures. (b) Orthophoto from 14 August 1970 (Kartverket, 2025), (c) Landsat 5 satellite imagery from 8 September 1990, (d) Landsat 5 satellite imagery from 28 August 2006, (e) orthophoto from 16 August 2016 (Kartverket, 2025), (f) Sentinel-2 satellite imagery from 8 September 2018, (g) Sentinel-2 satellite imagery from 27 August 2023, (h) orthophoto from 4 August 2024 (Kartverket, 2025), (i) Sentinel-2 satellite imagery from 2 September 2024, which depicts the most recent glacier extent.
Source: Copernicus Sentinel data, 2018, 2023, and 2024.

Historical absolute and relative changes in glacier area for Nordmannsjøkelen. The 2024 area is from the Sentinel-2 image that was acquired on 2 September 2024.

Summing up, the reduction in glacier area between 1970 and 2018 was 3.2 km2 (−73%, −0.1 km2 a−1), while the total loss from 1970 to 2024 was 4.0 km2 (−92%, −0.1 km2 a−1, Table 2). For comparison, the annual area changes for 2023–24 were 0.7 km2 a−1 (−68% between 27 August 2023 and 2 September 2024) indicating that the rate of retreat has remained pronounced, and even increased, along with a pronounced fragmentation of Nordmannsjøkelen.
4.2. Changes in glacier elevation over five decades (1970–2020)
Mean elevation change of Nordmannsjøkelen is –13.1 ± 2.0 m in the period between 1970 and 2020, averaged across the 1970 glacier extent (Fig. 4). The total volume loss of snow, firn, and ice within the 1970 glacier mask, covering an area of 4.98 km2, is estimated at –0.065 km3. The corresponding geodetic mass balance was –17.6 ± 1.79 m water equivalent (m w.e.) over five decades (1970–2020), with an average annual mass balance of –0.35 ± 0.04 m w.e. a−1.
Elevation change (m) for Nordmannsjøkelen from 1970 to 2020. In the figure, the glacier outline of 1970 is shown.

The previous glacier inventory shows that the remaining glacier units are situated at elevations ranging from 498 to 1046 m a.s.l. The lowest-lying unit corresponds to Glacier ID 4, while the highest is Glacier ID 3 (Andreassen and others, Reference Andreassen, Nagy, Kjøllmoen and Leigh2022). Based on the 2024 outlines, the elevation range has changed little since 2018, now spanning from 516 to 1038 m a.s.l. Glacier ID 4 remains the lowest, although it has split into two separate units. The larger of these now spans an elevation range of 733–1030 m a.s.l., while Glacier ID 3 continues to represent the highest glacier unit.
5. Discussion
5.1. Rapid glacier loss at Nordmannsjøkelen
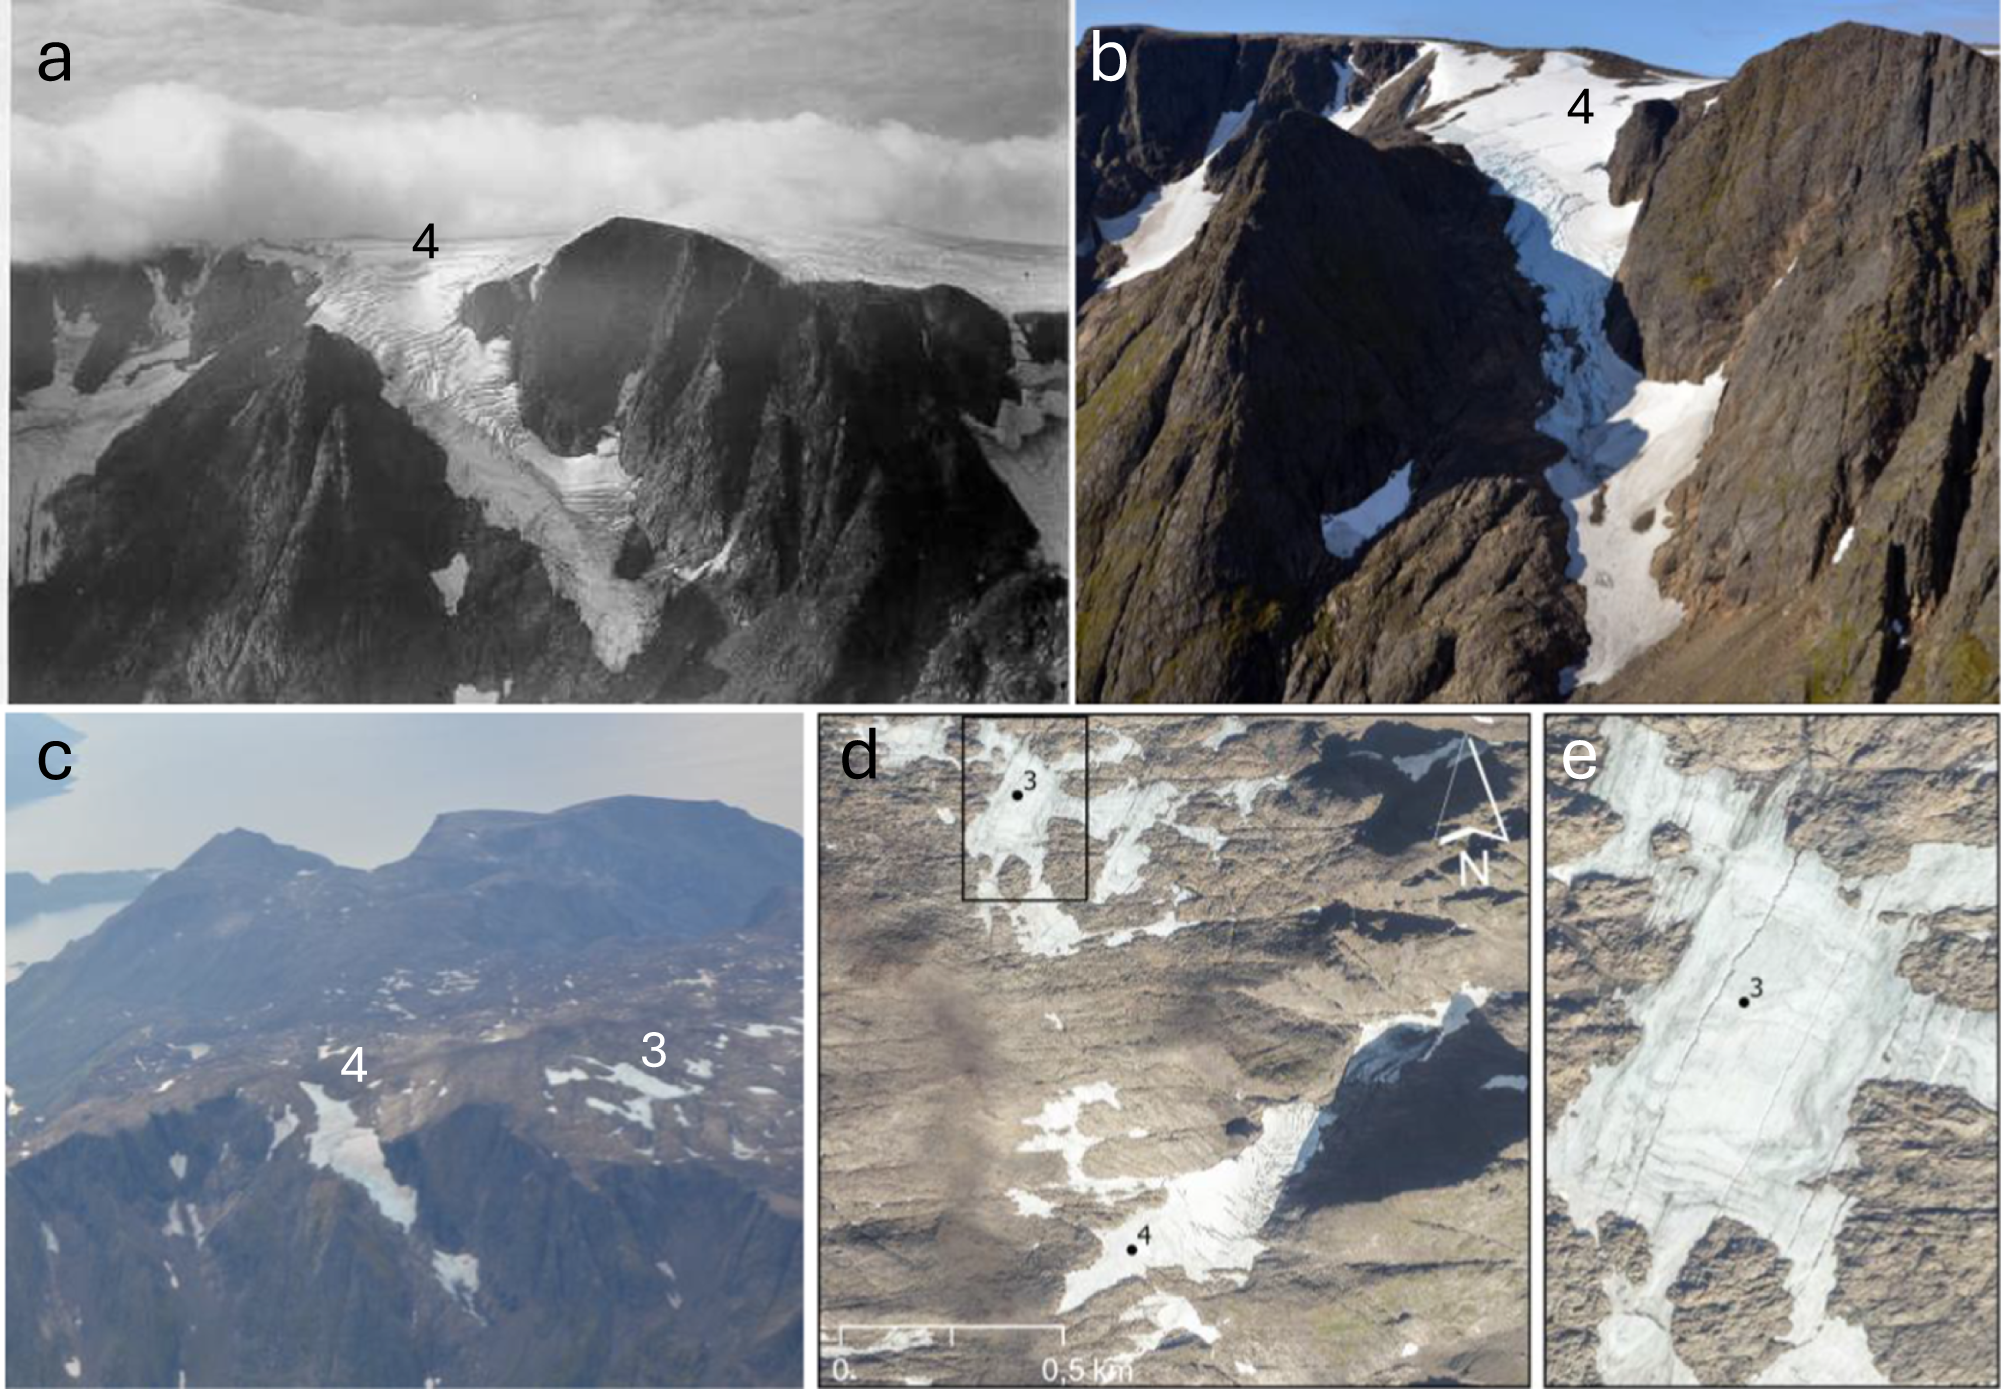
The rapid changes at Nordmannsjøkelen show how quickly a glacier can vanish in a warming climate. Documenting these changes serves as a clear indicator of ongoing climate change in the region, while also contributing to public awareness and preserving a historical record of landscape transformation. Due to significant downwasting and disintegration, Nordmannsjøkelen no longer meets the criteria for classification as an ice cap as defined by Cogley and others (Reference Cogley2011) as “A dome-shaped ice body with radial flow, largely obscuring the subsurface topography…”. Satellite imagery, orthophotos, and photos from 2022 to 2024 reveal that only a few isolated ice patch remnants are remaining (Figs. 2, 3g-i, and 5). Glacier ID 4 is now the only unit on Nordmannsjøkelen that exhibits crevasses, it has been separated into two distinct sections since the GI2018 inventory. The upper part shows well-defined crevasses indicative of active ice flow, while the lower part displays fewer and less pronounced crevasses (Fig. 5b, c, d). Additionally, highly visible supraglacial meltwater channels are present in the disintegrated remnants of Nordmannsjøkelen (Glacier ID 3, Fig. 5e). These melt patterns cannot be identified in the satellite data, due to the lower spatial resolution of Sentinel-2. In the channels are clearly visible, ranging from 0.5 to 1.5 m in width.
Glacier ID 4 on Nordmannsjøkelen observed in the south-west direction in (a), (b), and (c). (a) 1936 (Photo: Widerøe Fjellanger), (b) 25 August 2022 (Photo: Ingunn Ims Vistnes), (c) 29 August 2024 (Photo: Flytjenesten), (d) and (e) Orthophoto 4 August 2024. The black box in (d) indicates the outlines of Figure (e).
Source: Kartverket (2025).

The period from 2018 to 2024 includes several years with suboptimal conditions for glacier mapping using the Sentinel-2 imagery, but the images we use from 2018, 2023, and 2024 reveal the shrinkage of Nordmannsjøkelen. A comparison between the glacier extent in GI2018 and the minimum extent observed in September 2024 from Sentinel-2 reveals that half of the ice patches left are smaller than 0.01 km2 (10 of 21 ice patches). These have become so small that they are nearing or below the minimum size threshold of 0.01 km2 that is applied for inclusion in the Randolph Glacier Inventory (e.g. Maussion and others, Reference Maussion2023). Two ice patches, Glacier IDs 6699 and 6694, have completely vanished when observed with Sentinel-2 images, with area losses of 0.01 km2 and 0.054 km2, respectively (Fig. 3f, i). The northernmost ice patch, Glacier ID 1 had an area of 0.02 km2 in the Sentinel-2 image from 2 September 2024 (reduced by −0.05 km2, −66% since 2018) (Fig. 3f, i). Glacier ID 4 is the only glacier that can still be characterized as a glacier due to signs of ice flow shown by glacier crevasses (Fig. 5d). Between GI2018 and September 2024, it has lost 0.12 km2 (52%). The smallest remnants we include are derived from orthophotos. These images allow us to distinguish between glacier ice and snow, and due to the high-spatial resolution of 0.25 m, it is possible to delineate and map areas smaller than 0.01 km2 (Leigh and others, Reference Leigh, Stokes, Carr, Evans, Andreassen and Evans2019). For example, Glacier ID 6694 had an area of 0.005 km2 in the 2024 orthophoto, and this was not visible from the 2 September 2024 Sentinel-2 image.
Considering the substantial glacier area loss observed in recent years, not only in Norway but also across most glacierized regions globally (e.g., Dussaillant and others, Reference Dussaillant2025), there is a need for more frequent mapping in order to have updated glacier outlines to maintain accurate reference data and boundary conditions for glaciological modelling. Recent developments in machine learning techniques show potential and may contribute to improving the efficiency of future glacier inventories (e.g. Maslov and others, Reference Maslov, Persello, Schellenberger and Stein2025).
5.2. Regional glacier changes in western Finnmark’s ice caps
A significant portion of the pronounced changes found in the ice caps of western Finnmark can be linked to the geometry and elevation distribution of the glaciers. These high-latitude ice caps typically exhibit low surface gradients, resulting in a large proportion of their area being situated near the present-day equilibrium line. They are characterized by relatively low elevations (minimum 340 m a.s.l for Langfjordjøkelen, and maximum 1187 m a.s.l for Øksfjordjøkelen). This configuration renders them particularly vulnerable to climatic fluctuations (e.g. Åkesson and others, Reference Åkesson, Nisancioglu, Giesen and Morlighem2017). In contrast, steeper valley glaciers tend to be less vulnerable to such changes (e.g. Zekollari and others, Reference Zekollari2025). When the equilibrium line rises on ice caps, a large area of the former accumulation zone is turned into ablation area, leading to negative mass balance conditions. In northern Norway, during the summer of 2024, a high-pressure system sent warm air towards northern Norway over a long period of time (Gangstø and others, Reference Gangstø, Grinde, Mamen, Tajet, Tunheim and Aaboe2024a). The mean temperature for the three summer months June, July and August in the whole region was 3.1°C above normal (1991–2020) and it was the warmest summer since 1931 (Grinde and others, Reference Grinde, Mamen, Tunheim and Aaboe2024; Gangstø and others, Reference Gangstø, Rajet and Aaboe2024b). Temperature records were broken at several weather stations with long measurement series, and the old records were surpassed by a large margin. For example, in August 2024, Finnmark County experienced its warmest month on record, with average temperatures reaching 4.7°C above the normal seasonal values (Gangstø and others, Reference Gangstø, Grinde, Mamen, Tajet, Tunheim and Aaboe2024a). To illustrate how this exceptional heat affected Nordmannsjøkelen, Sentinel-2 images from 8 August and 2 September 2024 reveal an area decrease of 0.3 km2 (−45%) in less than a month. The Sentinel-2 image from 8 August 2024 shows little seasonal snow, and this interpretation is confirmed by an orthophoto from 4 August 2024 clearly showing bare glacier ice. Although some of the 2024 change may be due to snowmelt along glacier margins and thus represents an upper bound, the fragmentation and shrinkage of Nordmannsjøkelen is striking.
Among the five ice caps, Nordmannsjøkelen is expected to be the first to disappear completely, but the others have also retreated in both area and length (Winsvold and others, Reference Winsvold, Andreassen and Kienholz2014; NVE, 2025a). Orthophoto analysis of 2024 data (from the same source as for Nordmannsjøkelen) indicates that Seilandsjøkelen currently covers an area of 8.0 km2. This represents a decrease of 0.8 km2, or 10%, compared to the previous glacier inventory (GI2018, Andreassen and others, Reference Andreassen, Nagy, Kjøllmoen and Leigh2022), which reported an area of 8.8 km2.
Since 1989, glacier surface mass balance measurements have been conducted on Langfjordjøkelen, except for 1994 and 1995 (Andreassen and others, Reference Andreassen, Kjøllmoen, Rasmussen, Melvold and Nordli2012a; Kjøllmoen and others, Reference Kjøllmoen, Andreassen and Elvehøy H2025) (Fig. 6). Langfjordjøkelen is located 60 km southwest of Nordmannsjøkelen (Fig. 1) and has an area of about 6.2 km2 (2018), of which 2.6 km2 drains eastward (Kjøllmoen and others, Reference Kjøllmoen, Andreassen and Elvehøy H2025). The measurements include winter and summer balance and are carried out on the east-facing outlet, where the glacier ranges in elevation from 340 to 1043 m a.s.l. The idea to initiate mass balance measurements in northern Norway arose after international researchers, during an International Glaciological Society (IGS) meeting in the mid-1980s, questioned the lack of data from the region. In response, NVE conducted a helicopter survey in 1988, assessing glaciers in western Finnmark and on the Lyngen Peninsula. Langfjordjøkelen was chosen due to its well-defined plateau and outlet, suitability for glaciohydrological studies, and easy access. Results from glacier mass-balance measurements on Langfjordjøkelen reveal an average annual deficit of 1.0 m w.e. over 1989–2024. The recent thinning and mass loss of Langfjordjøkelen is stronger than observed for any other glacier in mainland Norway (Andreassen and others, Reference Andreassen, Kjøllmoen, Rasmussen, Melvold and Nordli2012a, Reference Andreassen, Elvehøy, Kjøllmoen and Belart2020). Except for a few years with slightly positive mass balance in the early 1990s due to increased snow accumulation, all years have had negative annual balances (Fig. 6). In 13 of the 34 years of observation, the equilibrium-line altitude (ELA) is above the highest point of the glacier, thus resulting in a complete absence of an accumulation zone by the end of the mass balance year, corresponding to an accumulation-area ratio of 0%. This shows that under current climatic conditions, the ice cap lacks sufficient high-altitude surface area to sustain itself. In 2024 alone, the annual mass loss was – 4.1 m w.e., the largest mass loss on record (Kjøllmoen and others, Reference Kjøllmoen, Andreassen and Elvehøy H2025).
Cumulative and annual glacier mass balance measurements for Langfjordjøkelen from 1989 to 2024. Bw-winter, Bs-summer, Ba-annual, cum.-Cumulative. Note the record low annual mass balance measured in 2024. *Mass balance estimated for 1994 and 1995.

The front variation measurements of Langfjordjøkelen reveal a strong retreat of 1.6 km in glacier front position from 1966 to 2024 (NVE, 2025b). In the 1990s, many glaciers in Norway experienced periods of advance and transient mass surpluses; however, no frontal advances were observed for Langfjordjøkelen or other glaciers in the northernmost regions (Andreassen and others, Reference Andreassen, Elvehøy, Kjøllmoen and Belart2020). Results from Langfjordjøkelen also reveal a strong area reduction of –3.7 km2 (−37% over 1966–2018) and −1.5 km2 (−20% over 2008–18) (Andreassen and others, Reference Andreassen, Kjøllmoen, Rasmussen, Melvold and Nordli2012a; Kjøllmoen, Reference Kjøllmoen2019). The geodetic mass balance of the east-facing outlet of Langfjordjøkelen was −0.78 m w.e. a−1 over 1966–94, −1.3 m w.e. a−1 over 1994–2008, and −1.4 ± 0.15 m w.e. a−1 over 2008–18 (Andreassen and others, Reference Andreassen, Kjøllmoen, Rasmussen, Melvold and Nordli2012a; Kjøllmoen, Reference Kjøllmoen2019). For the entire Langfjordjøkelen glacier over the period 1966–2018, we employed the same geodetic mass balance extraction method as used in this study for Nordmannsjøkelen, resulting in a geodetic mass balance of −37.7 ± 2.09 m w.e. (−0.7 ± 0.07 m w.e. a−1).
Although the geodetic and surface-elevation thinning periods are not directly comparable without sub-periods for Nordmannsjøkelen, the datasets consistently document substantial glacier mass loss in northern Norway in recent decades.
5.3. Environmental and societal implications of glacial retreat in Seiland
The vanishing of Nordmannsjøkelen has several consequences, including the fragmentation of a glacier in Seiland National Park and the loss of a symbol of cultural identity and ongoing landscape change (Boyer and Howe, Reference Boyer and Howe2024). Locally, it may also lead to reduced availability of drinking water for animals during dry and warm periods. Historically, the Seiland region served as summer pasture for reindeer herding, a tradition that continues today. The area also holds archaeological interest, and glacial-archaeology surveys have been performed in the region (Caspari and others, Reference Caspari, Schou, Steuri and Balz2023). Even though this region does not attract most tourists in Norway (Seiland National Park, 2025), the small amount of tourism it does receive is important locally. A unique characteristic of the park is being lost, as the northernmost glacier on mainland Europe represents a significant part of Seiland National Park’s identity (pers. communication, Ingunn Ims Vistnes, May 2025). No hydropower infrastructure is present in connection with the five ice caps in northern Norway. Thus, tourism constitutes the primary economic relationship between these glacial systems and modern society.
The local reduction of glacier area and mass in western Finnmark, Norway, reflects global projections, which indicate that regions such as Scandinavia are expected to lose most of their glacier mass as warming continues (Rounce and others, Reference Rounce2023; Zekollari and others, Reference Zekollari2025). Nordmannsjøkelen thus serves as a local example of a worldwide pattern of accelerating glacier loss, and the summer of 2024 demonstrates how fast these ice remnants shrink under unusually warm conditions. The glacier change in this region is not unique in Norway, and similar trends are documented in southern Norway at Breifonn (Andreassen and others, Reference Andreassen, Robson, Smith, Weber, Carrivick and Kjøllmoen2025). While Nordmannsjøkelen is rapidly vanishing, larger glaciers in the region such as Øksfjordjøkelen (area of 36.2 km2), one of Norway’s largest, are likely to persist for a longer period. As our study has demonstrated, high-resolution satellite imagery and orthophotos are indeed useful data to monitor and document these changes.
6. Conclusions
The fragmentation of Nordmannsjøkelen over the past century illustrates the rapid response of low-elevation maritime glaciers to climate warming. With its disintegration, the glacier will soon lose its status as the northernmost in mainland Norway. With a 92% reduction in area between 1970 and 2024, and a particularly critical decline in recent years, the glacier has changed from being an ice cap to a collection of isolated remnants. The 68% area loss observed between 2023 and 2024 highlights the importance of using available high-frequency monitoring to capture rapid changes in glacier extent in Norway. Due to its relatively low elevation, Nordmannsjøkelen is unable to accumulate sufficient snow during winter to compensate for the ice loss it experiences during the summer melt season. In this study, we estimated the geodetic mass balance of Nordmannsjøkelen to be −17.6 ± 1.79 m w.e. The adjacent ice caps are also decreasing in area and length, and nearby Langfjordjøkelen shows a negative cumulative annual mass balance since 1989.
Supplementary material
The supplementary material is available at https://doi.org/10.1017/aog.2026.10047.
Data availability
The historical photograph from 1936 is available at https://kartverket.no/. Orthophotos are available at https://norgeibilder.no/, and the DTM from 2020 is available at https://hoydedata.no. The glacier outlines used for Nordmannsjøkelen is available from Nasjonalt Vitenarkiv (https://doi.org/10.58059/cs8c-4637). Landsat 5 images from 1990 and 2006 courtesy of the U.S. Geological Survey and NASA. Copernicus Sentinel-2 MSI satellite data 2018, 2023, and 2024 can be found on https://browser.dataspace.copernicus.eu.
Acknowledgements
We thank two anonymous reviewers, Scientific Editor Brian Menounos, and Associate Chief Editor Guðfinna Aðalgeirsdóttir for valuable comments that helped us improve the manuscript. Publications costs are covered by NVE, with contribution from the Norwegian Space Agency through the post-74 project ‘NVE Copernicustjenester’. Thanks to Ingunn Ims Vistnes, the Seiland National Park Manager, for photographs of the glaciers from 2022, and to Flytjenesten in northern Norway for photographs from 2024.
Author contributions
S.H.W., L.M.A, and B.K developed the concept of the study. B.K. carried out the elevation-change analysis and geodetic mass balance. The glacier outlines from orthophotos and the map were digitized by B.K. Glacier area outlines from Sentinel-2 images were retrieved by S.H.W. S.H.W. prepared the final data and figures and wrote the manuscript with contribution from B.K and L.M.A.


 Open access