


I. INTRODUCTION
The desire to replace carbonaceous electrodes in lithium-ion batteries (LIBs) is being driven by a need for greater energy density in demanding applications like electric vehicles. Silicon is a leading candidate because its theoretical specific capacity of 3580 mA h/g is roughly ten times that of graphite.Reference Obrovac and Christensen1 The main impediment to successful deployment of silicon electrodes is the large volume fluctuation during cycling, which is about thirty times greater than what graphite experiences. The volume fluctuation can destroy electrode integrity and crack the solid electrolyte interphase (SEI), rendering it ineffective as a passivation layer. Capacity fade and eventual battery failure result from associated breaking of electrical contact within the electrode and loss of lithium as new SEI material grows to protect the newly exposed active material.Reference Chon, Sethuraman, McCormick, Srinivasan and Guduru2,Reference Benedek and Thackeray3
Novel electrode construction and electrolyte materials are two widely researched avenues to accommodate the silicon volume fluctuation, either by mitigating the stresses within the electrode or generating more effective SEI layers.Reference Ren, Ding, Yuan, Jia, Qu and Yu4–Reference Shin and Liu6 The silicon SEI is reportedly similar to the one grown on graphite, and its properties can vary greatly due to the electrolyte material used.Reference Nie, Abraham, Chen, Bose and Lucht7–Reference Xiao, Yang, Lucht, Kang and Abraham13 In those studies, it was also shown that the SEI grown on silicon electrodes is not able to withstand the volume fluctuation associated with cycling. Clearly, the attainment of a stable, predictable SEI will be necessary to harness the great capacity increase silicon can offer; however, this goal can be more easily achieved if the effects of the volume fluctuation can be lessened.
Increasing the surface area to volume ratio of the material reduces the internal stress placed on it during cycling, lessening the damage associated with volume fluctuation and potentially extending electrode lifetime into the range of hundreds of cycles for particle sizes on the order of 100 nm in half-cells or overbalanced full cells.Reference Yang, Winter and Besenhard14,Reference Chan, Peng, Liu, Mcilwrath, Zhang, Huggins and Cui15 Further improvement can be made with the addition of binder material in electrode fabrication to induce adhesion of the material to itself and to the current collector, and to accommodate the volume expansion of the substrate material with less damage to the SEI. Polyvinylidene difluoride (PVdF) is a common binder used in LIBs with graphite electrodes but is not optimal in Si-based electrodes presumably because it only binds to silicon particles by weak van der Waals forces.Reference Magasinski, Zdyrko, Kovalenko, Hertzberg, Burtovyy, Huebner, Fuller, Luzinov and Yushin16
The search for binder material compatible with Si-based electrodes is ongoing—sodium carboxymethyl cellulose (CMC) is a brittle, stiff polymeric derivative of cellulose, yet has shown better cycling performance than PVdF in Si-based electrodes.Reference Ding, Xu, Yao, Wegner, Lieberwirth and Chen17 Lestriez and coworkers have attributed increased efficiency of CMC to its extended conformation in solution which facilitates the formation of a more homogeneous electrode and have suggested enhanced cross-linking of CMC chains to explain performance gains of electrodes prepared at low pH.Reference Lestriez, Bahri, Sandu, Roue and Guyomard18 CMC is also water-soluble, making it an attractive option from economic and environmental perspectives.
Magasinski et al. have proposed that rigid structure and lack of interaction with the electrolyte solvent will be the requirements for successful binders in Si-based electrodes in a recent study comparing PVdF, CMC, and polyacrylic acid (PAA).Reference Magasinski, Zdyrko, Kovalenko, Hertzberg, Burtovyy, Huebner, Fuller, Luzinov and Yushin16 Like CMC, PAA as a binder outperforms PVdF. Unlike CMC, however, PAA has the benefit of being soluble in environmentally friendly, organic solvents that can limit the amount of oxide developed on the Si particles during fabrication, and its higher concentration of carboxylic groups permits effective control over the spacing between them by copolymerization with other monomers. Thus, PAA offers some tunability of mechanical properties that are fixed with CMC.
This study utilizes hard X-ray photoelectron spectroscopy (HAXPES) to obtain new information on the role these binders play in development and evolution of the SEI under otherwise identical conditions and electrode preparation. High photon energies available from synchrotron radiation gives access to more tightly bound core electrons and impart more energy to less tightly bound ones than traditional XPS studies. This enables characterization of the SEI layer at shallower, but primarily deeper levels in the film than have previously been studied.
II. EXPERIMENTAL
A. Preparation of electrodes and coin cell fabrication
Silicon nanoparticles (Alfa Aesar, Ward Hill, Massachusetts, ≤50 nm), Super C (Timcal, Terrebonne, Canada) and binders with a weight ratio of 50:25:25 were thoroughly mixed in deionized water with PAA (Sigma-Aldrich, St. Louis, Missouri, M w = 450,000), CMC (Sigma-Aldrich, M w = 700,000) or their mixture or mixed in NMP with PVdF (MTI, Richmond, California, M w = 600,000) to prepare a slurry. The slurry was spread on copper foil and air-dried at room temperature (water solvent) or in a convection oven at 60 °C (NMP solvent) for 1 h. The electrodes were punched into 12.7 mm-diameter disks and dried in a vacuum oven at 110 °C overnight. The dry electrodes were not calendared. The thickness of the electrode laminates was ∼15 μm (excluding copper foil) and the total material loading was ∼1.2 mg/cm2 (0.6 mg/cm2 for Si), corresponding to a density of ∼0.8 g/cm3.
Battery-grade ethylene carbonate (EC), diethyl carbonate (DEC), dimethyl carbonate (DMC), and lithium hexafluorophospate (LiPF6) were obtained from BASF (Ludwigshafen, Germany). Coin cells (2032) were assembled in an Ar-filled glovebox and used for the evaluation of electrochemical cycling performance. The cells consist of a Si working electrode, a lithium foil counter electrode, electrolyte (100 µL), and a separator (Celgard, Charlotte, North Carolina, 2325). The electrolyte was 1.2 M LiPF6 in EC:DEC (1:1, w/w). The cells were cycled between 0.005 and 1.5 V at a rate of C/20 (0.179 A/g) for the first cycle (formation cycle) and then C/5 (0.716 A/g) for subsequent cycles using a BT2000 battery cycler (Arbin, College Station, Texas) at 25 °C. The rate was calculated based on the theoretical capacity of Si at 3580 mA h/g. For ex situ HAXPES analysis, cells were stopped after the 1st, 5th, 10th, and 20th delithiation. To clarify SEI evolution, another set of cells was lithiated to 0.5 V and then delithiated to 1.5 V. The harvested electrodes were carefully rinsed with DMC four times (1 mL in total) to remove residual electrolyte and dried in an Ar-filled glove box for ex situ analysis.
B. HAXPES experiments
All HAXPES experiments were conducted at the X-24A endstation of the NIST beamline at the National Synchrotron Light Source, Brookhaven National Laboratory (Upton, New York).Reference Weiland, Rumaiz, Lysaght, Karlin, Woicik and Fischer19 Samples were transported under Ar at atmospheric pressure in a sealed vessel and installed in the X-24A endstation while a positive pressure of Ar was flown outward through the installation glovebag. The facility and our experimental procedures, including calculation of atomic concentrationsReference Young, Heskett, Nguyen, Nie, Woicik and Lucht20 and estimates of the SEI thickness,Reference Dong, Young, Zhang, Yoon, Heskett, Hu and Lucht21 are described elsewhere. Thickness estimates used Si concentrations restricted to include only the area of the elemental Si contribution to the spectra, as obtained through fits to the experimental data using Voigt shapes.
Spectra were taken using photon energies of 2.2 and 5 keV, and the kinetic energy scale used for data collection was converted to binding energy (BE) for display by referencing C 1s spectrum intensity in each set of spectra taken. For uncycled electrodes, 284 eV was used as the BE reference for the amorphous graphite peak. This peak is attenuated by the SEI layer after cycling begins, so we chose to reference binding energies from the more intense hydrocarbon peak at BE 285 eV for all cycled electrodes.
III. RESULTS AND DISCUSSION
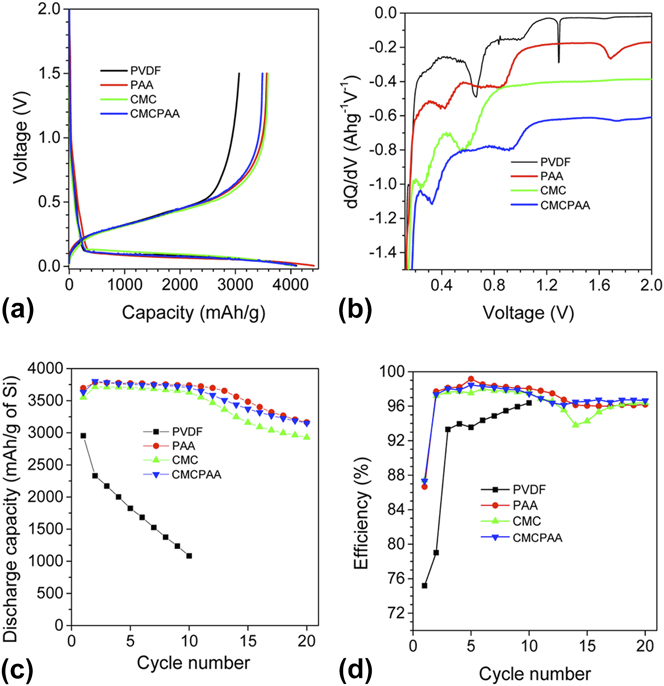
First cycle voltage profiles, dQ/dV plots, and electrochemical cycling results are displayed in Fig. 1. Panes c and d show plots of discharge capacity and cycling efficiency, respectively, versus cycle count. The silicon electrode containing PVdF vastly underperformed the others in the study, losing approximately 2/3 of its initial discharge capacity within ten cycles. For this reason, cells with PVdF binder were not analyzed after 20 cycles. Silicon electrodes containing PAA binder fared the best with those containing CMCPAA binder performing almost identically. Silicon electrodes containing CMC binder performed only slightly less well, showing capacity fade equal to about 250 mA h/g in excess of those containing PAA and CMCPAA, which were very similar after 20 cycles.
Voltage profiles (a) and dQ/dV plots (b) for the first cycle and discharge capacity (c) and efficiency (d) relative to cycle count for batteries with electrode binders PVdF (black), PAA (red), CMC (green), and CMCPAA (blue). Reproduced from Ref. Reference Nguyen, Yoon, Seo, Guduru and Lucht22.
Spectra from HAXPES measurements of the P 1s core electron using 5 keV excitation energy are arrayed in Fig. 2 as plots of intensity versus BE. Individual spectra are grouped in columns by the electrode binder material and in rows according to the axes’ titles. Electrodes that were lithiated to 0.5 V and delithiated to 1.5 V, labeled “0.5 V”, comprise the top row and the subsequent four rows represent the electrodes after the 1st, 5th, 10th, and 20th lithiation/delithiation cycles except for the PVdF. Taken but not reported were P 2p spectra because they are similar to those of the P 1s and do not show obvious differences between the photon energies. We have calculated atomic concentrations based on the P 2p data, as collection of P 1s data using 2.2 keV photons would have required diverging from the 500 eV analyzer pass energy used throughout the study.
Phosphorus 1s spectra for electrodes (top to bottom): lithiated to 0.5 V, 1 cycle, 5 cycles, 10 cycles, and 20 cycles. Noise in the spectra is due primarily to the small concentration of phosphorus in the film, but also to minimizing data collection time to avoid changes to the samples from extended beam exposure.
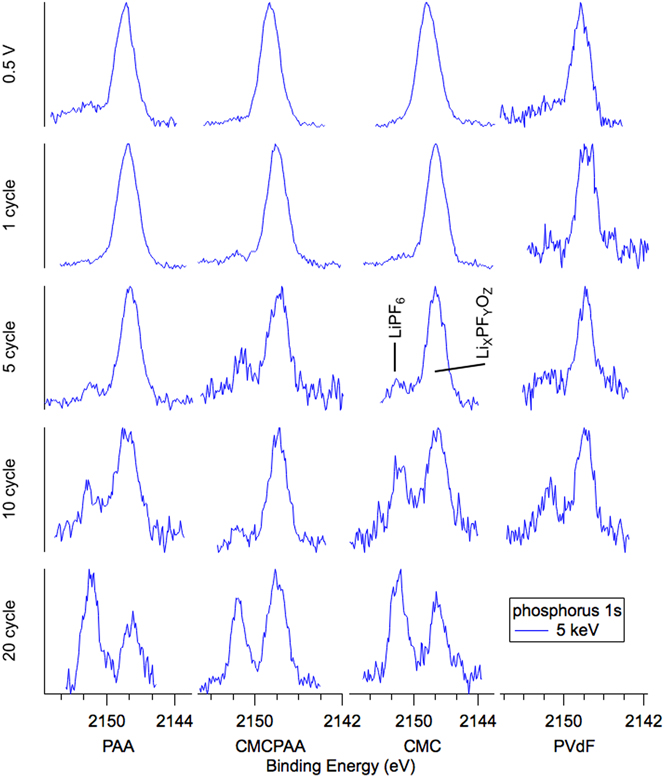
The dominant feature of most phosphorus spectra is a peak at BE 2148 eV that we assign as lithium fluorophosphates (LixPFyOz). At the beginning of cycling, i.e., 0.5 V and 1 cycle, the spectra for PAA, CMC, and CMCPAA have greater signal-to-noise compared to PVdF, indicating higher concentration of LixPFyOz. PAA and CMC may have accelerated the decomposition of LiPF6 due to their high concentration of carboxylic and hydroxyl groups. As the cycle number increases, noisier spectra suggest that the decomposition of LiPF6 is insignificant once the SEI is formed. This is further supported by the decrease in phosphorus concentration as cycle number increases, from 2.5% to below 1%, consistent with our previous report.Reference Nguyen, Yoon, Seo, Guduru and Lucht22 Weak signal intensity observed at BE 2151.5 eV, attributed to residual LiPF6 salt, is visible by the fifth cycle for all electrodes, and with further cycling, this peak grows in intensity relative to the LixPFyOz signal. By the 20th cycle, the salt peak is of comparable or greater intensity to the LixPFyOz peak. The large morphology changes and the thickened SEI may trap LiPF6 and therefore rinsing with DMC was unable to remove the residual salt completely.
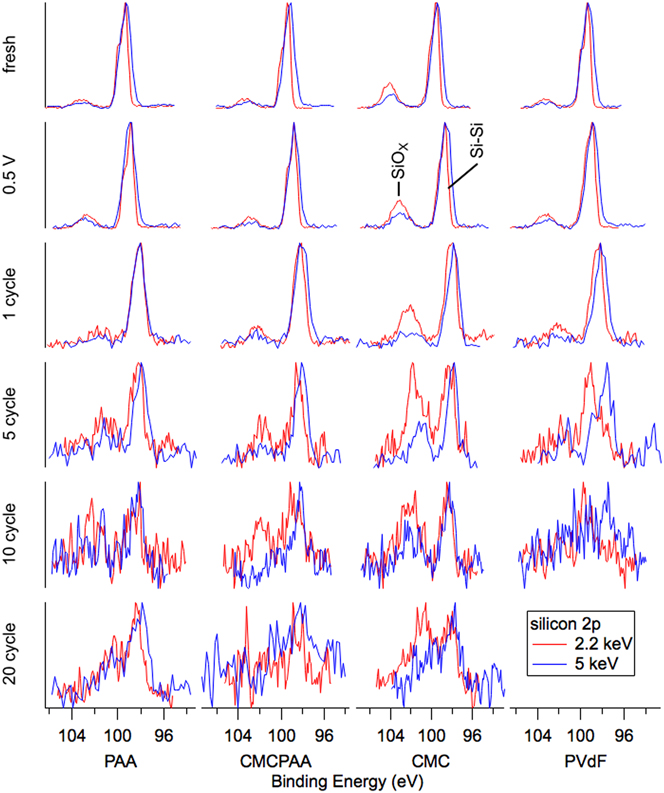
Silicon spectra are displayed in Fig. 3 (Si 2p) and Fig. 4 (Si 1s). The arrangements of individual spectra are similar to that of Fig. 2, but there are now two traces per pane with blue representing the 5 keV measurements and red representing the 2.2 keV measurements. There is also another row on top representing the uncycled electrodes before having been exposed to the electrolyte, labeled “fresh.” The Si 2p core (Fig. 3) spectra represent greater mean depths in the samples than the shallower Si 1s results (Fig. 4) at each photon energy due to the larger mean free path associated with higher kinetic energy photoelectrons. Signal from the same core electron probed with higher energy photons will, on average, also have come from deeper in the sample for the same reason. Relative to common XPS instruments that use 1487 eV photons to excite Si 2p electrons, our Si 1s information taken with 2.2 keV photons (red in Fig. 4) is more surface sensitive and all other silicon spectra are more bulk sensitive.
Silicon 2p spectra for electrodes (top to bottom): fresh, lithiated to 0.5 V, 1 cycle, 5 cycles, 10 cycles, and 20 cycles. Spectra become noisier at both energies for greater cycle counts due to thickening of the attenuating SEI layer and the relatively low probabilities of exciting the 2p photoelectron with photons of these energies.
Silicon 1s spectra for electrodes (top to bottom): fresh, lithiated to 0.5 V, 1 cycle, 5 cycles, 10 cycles, and 20 cycles. The 2.2 keV spectra become noisy for 1 cycle and beyond as the attenuating SEI layer thickens. Photoelectrons for the 5 keV measurements have longer mean free paths due to greater kinetic energy and are less attenuated, increasing the signal to noise.
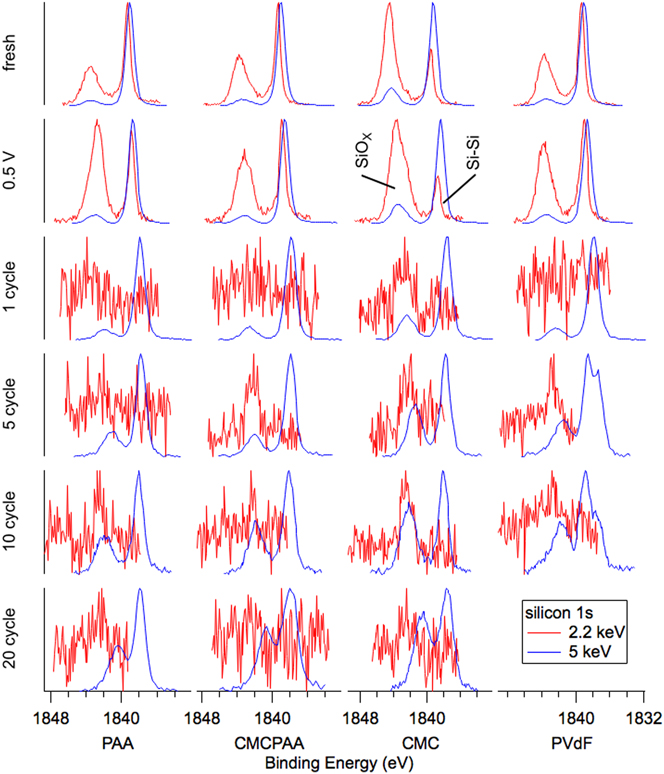
This sensitivity is clearly illustrated in the fresh spectra of Figs. 3 and 4. Shallower (red) spectra for all fresh electrodes exhibit two obvious peaks indicating the presence of the native oxide (SiOx) layer (BE 103.5 eV in Fig. 3 and BE 1844 eV in Fig. 4) encapsulating the substrate elemental Si nanoparticles (BE 99.5 eV in Fig. 3 and BE 1839 eV in Fig. 4). The Si 2p electron exhibits spin–orbit splitting, which is resolved for the elemental peak in the red 2.2 keV spectra of Fig. 3 where the Si 2p 1/2 intensity appears as a shoulder on the high BE side of the more intense Si 2p 3/2 signal, but not in the blue 5 keV spectra due to peak broadening associated with beamline optics. In both Figs. 3 and 4, comparing the deeper 5 keV spectra to the 2.2 keV spectra reveals that there is less intensity corresponding to the native oxide for the deeper measurement in each case. This is consistent with the mean signal depth moving farther into the bulk silicon. Interestingly, in Fig. 3, the ratios of oxide to elemental intensity are roughly the same for all fresh electrodes except the one containing CMC binder, where the oxide intensity remains a significant feature despite the increased signal depth. This indicates that the interaction of the CMC binder solution and silicon produces a thick layer encapsulating the silicon nanoparticles during fabrication.
Inspection of the spectra in Fig. 4 enriches that suggestion. Specifically, the red 2.2 keV measurement of the Si 1s core reveals that both fresh electrodes including CMC binder have a larger relative oxide intensity than the electrode with PAA binder, which appears to have the thinnest native overlayer. The oxide intensity for the electrode with PVdF binder is very similar to that of the electrode with CMCPAA binder, of intermediate thickness between the PAA and CMC bound electrodes, but much closer to the former. Quantified estimates of SEI layer thickness are plotted in Fig. 5 and are discussed later.
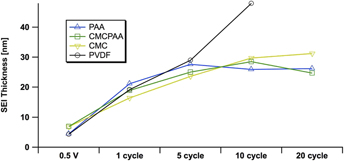
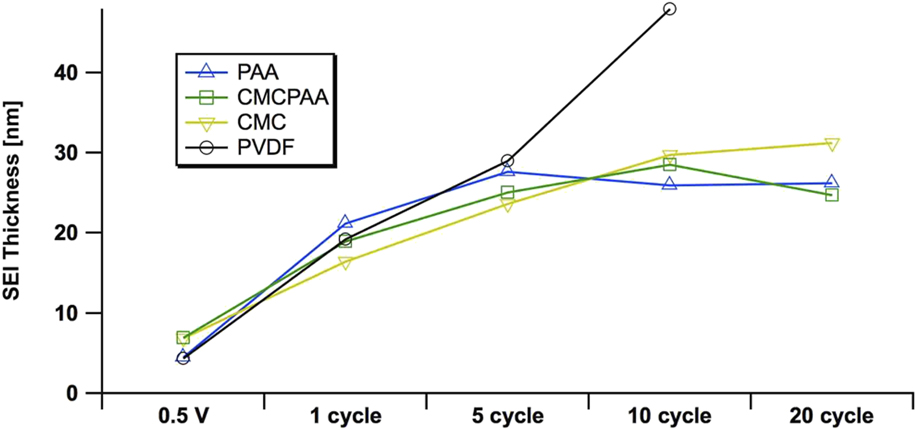
Estimates of the SEI thickness, derived from the elemental Si 1s signal at 5 keV excitation on electrodes using PAA (blue, up triangle), CMCPAA (green, square), CMC (yellow, down triangle), and PVdF (black, circle) binder material. Uncertainties in these measurements, propagated from fit area uncertainties, are all less than 10%.
In Fig. 3, the intensity ratios of the silicon species remain roughly constant in the top three rows, and the 5 keV spectra of Fig. 4 are similarly unchanged. However, in the most surface-sensitive 2.2 keV measurement of Fig. 4, all electrodes exhibit increased oxide intensity upon lithiation to 0.5 V and delithiation to 1.5 V. Notably, for the electrode with PAA binder, the oxide intensity roughly doubles relative to the elemental intensity.
Beginning with the first full lithiation/delithiation cycle, all the electrodes develop an SEI thick enough to greatly attenuate the shallower Si 1s electron signal at 2.2 keV and the red traces in Fig. 4 become noisy. The deeper measurement of the Si 1s core at 5 keV in blue are clearer and while all electrodes show slightly increased oxide intensity relative to the still dominant elemental signal, the CMC electrode has again the thickest layer. The red traces in Fig. 3, corresponding to slightly shallower measurements of the Si 2p core at 2.2 keV, are similar with the CMC electrode’s oxide signal observed to have higher still intensity relative to the elemental signal.
After the fifth cycle, spectra for electrodes bound with PAA and CMCPAA exhibit small increases in oxide intensities for the 5 keV Si 1s measurements, relative to the larger gains made in the spectra for electrodes bound with CMC and PVdF. In contrast to the spectrum from the electrode with CMC binder, where the oxide intensity simply increases relative to the elemental signal, there is a newly distinguished peak in the spectrum for the electrode with PVdF binder with its center intensity approximately 1.2–1.5 eV higher BE than the elemental signal. This new peak, which we attribute to lithium silicates, as well as the oxide signal both increase in intensity after 10 cycles. The silicate peak here is similar to that observed by Philippe et al.Reference Philippe, Dedryvère, Allouche, Lindgren, Gorgoi, Rensmo, Gonbeau and Edström11 and seen in our earlier study concerning binder-free silicon nanoparticle electrodes.Reference Young, Heskett, Nguyen, Nie, Woicik and Lucht20 In that study, we observed similar silicate intensity as batteries began to fail and it is unsurprising to find it in the poorly performing PVdF electrode here. In pane c of Fig. 1, the battery using an electrode bound with PVdF had lost more than a third of its initial discharge capacity by the fifth cycle.
The remaining electrode fabrications do not obviously exhibit this silicate peak through 20 cycles of testing, but we may diagnose the likely conversion of oxide to silicate species through the broadening of the peaks and decreasing separation of the two peaks in each spectrum. As the cycling progresses, the conversion is responsible for shifting the oxide signal to lower BE, and the separation by 20 cycles is roughly 2.5 eV for each electrode, consistent with significant conversion of the native oxide to lithium silicate.
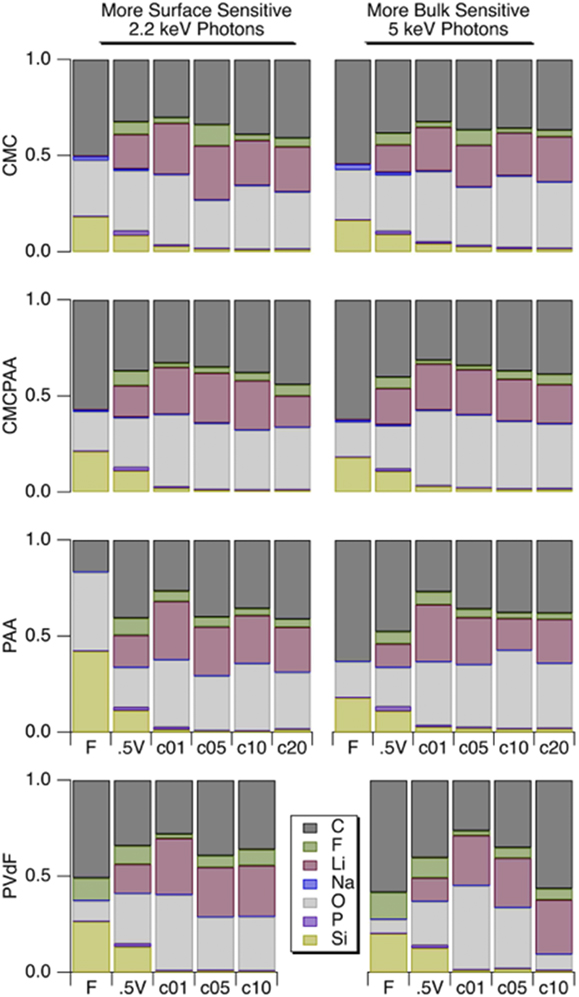
Atomic concentrations reported in Fig. 6 for silicon are slightly higher following formation cycling for electrodes that contain CMC in the binder, though the progressions with cycle count are generally similar for the electrodes with PAA, CMCPAA, and CMC binders. The electrode with PVdF binder has consistently lower silicon concentration than the others, indicating a thicker SEI.
Atomic concentrations for the shallower 2.2 keV measurement (left) and deeper 5 keV measurement (right). Rows correspond to electrode binder material and within each frame are shown concentrations (left to right) for electrodes when fresh, lithiated to 0.5 V, 1 cycle, 5 cycles, 10 cycles, 20 cycles.
Fluorine spectra are reported in Fig. 7. The only fresh sample spectra displayed are for the electrode with PVdF binder, visible as a single peak at BE 688 eV and which we assign as the C–F bond in PVdF. After the 0.5 V lithiation and delithiation to 1.5 V cycle, a peak at BE 685 eV appears indicating the incorporation of LiF in the outer SEI. The peak intensity is roughly equivalent to that of the C–F signal at 2.2 keV, but it decreases relative to C–F at 5 keV consistent with the deeper measurement. After one full lithiation/delithiation cycle, the spectra at 2.2 and 5 keV are very similar, though the atomic concentrations indicate a much lower relative concentration of fluorine in the deeper measurement. For further cycling in Fig. 6, the intensity ratio of the broad C–F, P–F feature to that of the LiF peak decreases at both photon energies.
F 1s spectra for electrodes (top to bottom): fresh, lithiated to 0.5 V, 1 cycle, 5 cycles, 10 cycles, and 20 cycles.
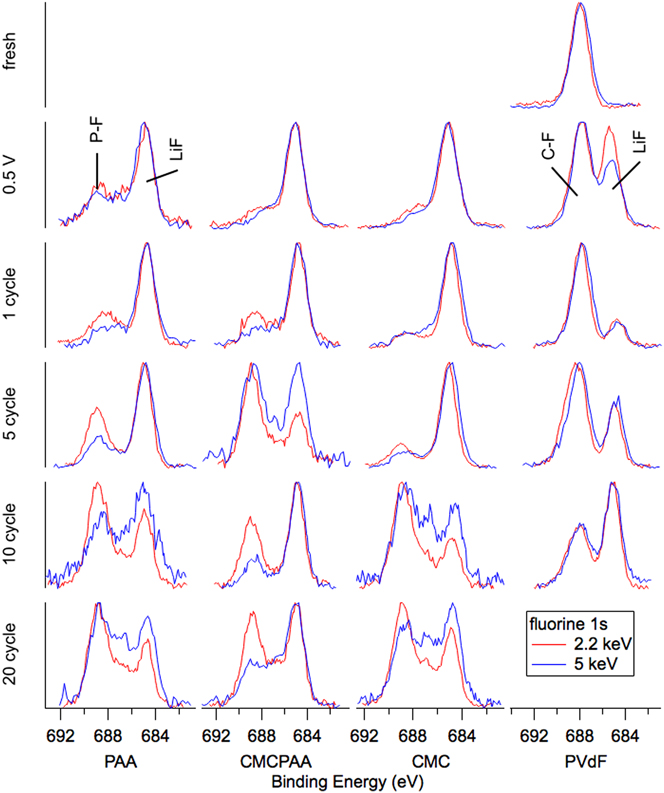
The atomic concentrations corresponding to SEI formation cycling for the other electrodes (PAA, CMCPAA, and CMC binders) have relatively little fluorine. Cycling generates a peak indicative of LiF at BE 685 eV and a very small signal detected at the higher BE due to species with a P–F bond, including unreacted LiPF6 salt and the decomposition product PF5. There is a significant reduction in the fluorine concentration at one cycle, and these concentrations stay relatively consistent with further cycling (except for an anomalously high concentration for the 5-cycle electrode with CMC binder) in contrast to the concentrations for the electrode bound with PVdF which had consistently higher fluorine content than the other three electrodes. Spectra corresponding to cycling beyond the first cycle all consist of two peaks representing LiF and P–F species. The electrode with PAA binder shows increasing intensity of the P–F species relative to the LiF intensity for increased cycling at both photon energies and the same is generally true for electrodes including CMC binder. The electrode using both PAA and CMC binder is less consistent, but except for the high intensity of P–F species in both measurements of the 5-cycle electrode, the P–F intensity slowly increases relative to the LiF peak. These observations are consistent with a mature SEI—one that is as or more likely to incorporate unreacted LiPF6 salt than its decomposition products in new growth.
The evolution of oxygen-containing species displayed in Fig. 8 is similar for all electrodes and all spectra consist of a single peak. SiO2 with expected BE 532 eV is the dominant intensity contributing to the fresh spectra for electrodes containing PAA, which have their center intensities between the C–O bond at BE 534.4 eV and carbonates at BE 531.7 eV. The fresh spectra for electrodes with CMC binder material have their center intensities shifted slightly toward higher BE, indicative of C–O bonds. Once cycling begins, the center intensity for all spectra shifts abruptly toward carbonates at BE 531.7 eV and do not shift away for further cycling, though by 20 cycles the remaining three electrodes in the study show slight shoulders on the high and low BE sides of the main intensity indicating the presence of C=O and lithiated species, respectively.
O 1s spectra for electrodes (top to bottom): fresh, lithiated to 0.5 V, 1 cycle, 5 cycles, 10 cycles, and 20 cycles.
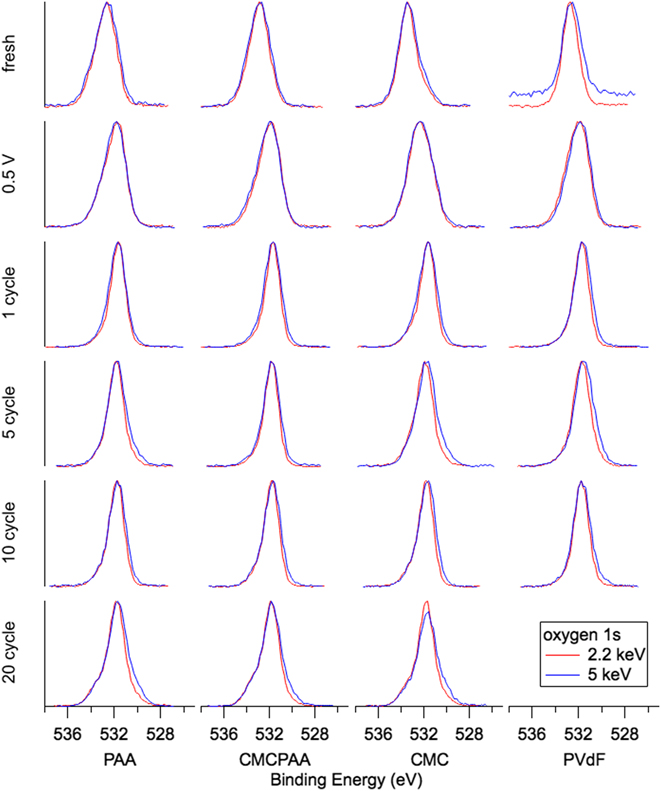
Figure 9 contains spectra for the C 1s core electron. Fresh spectra of Si electrodes prepared with PAA and CMC binders are dominated by a peak at BE 284 eV from Super C and have intensity at BE 285 eV, 286.5 eV, and 289 eV representing the C–C/C–H, C–O, and C=O bonds from the binders, respectively. Beginning with the first full lithiation/delithiation cycle, a peak of significant intensity rises at BE 289.8 eV from the generation of sodium and/or lithium (alkyl) carbonates (labeled CO3 in Fig. 9). This peak is more intense, relative to the other peaks in the spectrum, for the deeper measurement in each photon energy pair.
C 1s spectra for electrodes (top to bottom): fresh, lithiated to 0.5 V, 1 cycle, 5 cycles, 10 cycles, and 20 cycles.
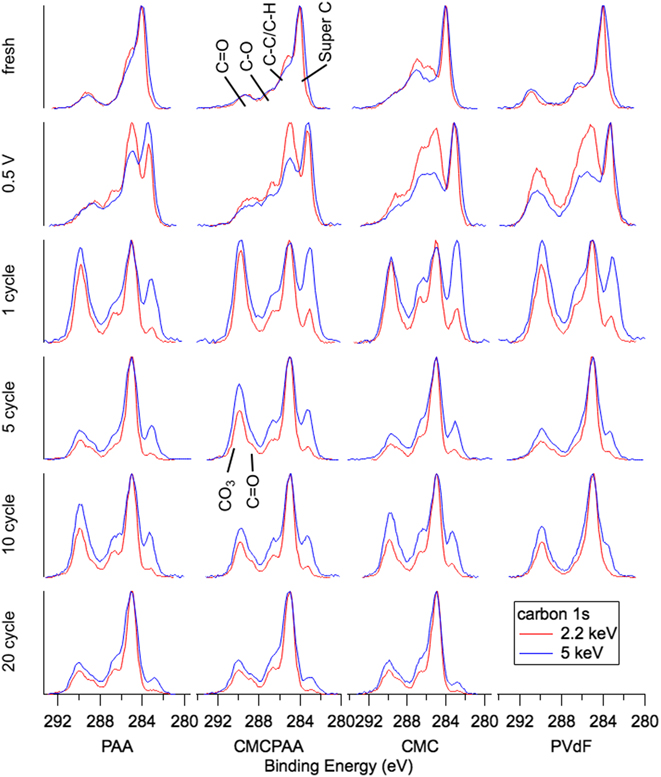
There is also a peak indicative of the PVdF binder at BE 291.1 eV in the fresh spectra for that electrode, but its intensity is not clearly resolved or the 0.5 V cycle or beyond. A significant difference between the SEI layers of electrodes using only PVdF or CMC binder versus those of electrodes using PAA in the binder is the increased intensity of the C–O (BE 286.5) feature after the 0.5 V cycle. This distinction fades for further cycling and by 20 cycles, the SEI layers of the three remaining electrode formulations feature nearly identical spectra for the C 1s electron with only minor but consistent variation by depth (Fig. 9).
We are able to estimate the thickness of the SEI by comparison of the intensities of the signal in the Si 1s spectra, specifically of the peak we have assigned to indicate the Si–Si bond. Estimates of SEI thickness derived from the 5 keV measurements are displayed graphically in Fig. 5 as thickness versus cycle count for the four electrode compositions. All electrodes develop similarly through the fifth full lithiation/delithiation cycle. There is a significant increase in thickness upon the first full cycle, and the SEIs for all electrodes more than double to 15–20 nm. While the rate of growth slows during the next four cycles for all SEIs, the growth rate for the electrode with PVdF binder remains higher than that of the other three electrodes in the study. The thickness of the SEI developed on the electrode using PVdF binder is estimated to be 43 nm after 10 cycles, almost double the thickness of the other three, better-performing electrodes. Furthermore, the curve for the electrode with PVdF binder is roughly linear in contrast to the other electrodes’ curves that appear to approach an asymptote. The other electrodes’ SEI layers are significantly thinner, about 29 nm (or slightly less) after 10 cycles. Over the next ten cycles, SEIs from electrodes bound with PAA, CMCPAA, and CMC grow only slightly and attain thickness equal to 31 nm or less by the 20th cycle.
The performance of PVdF as a binder in Si-based electrodes has previously been found to be poor because it is unable to maintain electrode integrity.Reference Magasinski, Zdyrko, Kovalenko, Hertzberg, Burtovyy, Huebner, Fuller, Luzinov and Yushin16,Reference Nguyen, Yoon, Seo, Guduru and Lucht22–Reference Buqa, Holzapfel, Krumeich, Veit and Novák24 Xu et al. have reported improved performance for Si electrodes that were annealed after fabrication, suggesting that the process enabled the PVdF binder to accommodate the large volume changes of Si during cycling.Reference Xu, Yin, Ma, Zuo and Cheng25 In that study, the authors showed greatly enhanced adhesion of PVdF to the active Si material after annealing, but with decreased electrode porosity that adversely affects Li ion kinetics. Additionally, the achieved efficiencies were still well below what has been realized with other polymeric binders like the ones presented here. Wetting of the substrate materials during electrode fabrication is also important. PVdF in NMP wets carbon more readily than the other binder formulations considered here. It is possible that in the PVdF electrode, the binder preferentially wets the Super C material and 25% binder in the fabrication slurry was not enough to effectively wet the active Si as well. This explanation is consistent with the increased fluorine content and the rise of the silicate species’ intensity in Figs. 3 and 4 for the electrode bound with PVdF, as both these artifacts suggest the unpassivated active Si material decomposing electrolyte solution to increase SEI thickness. However, the fresh Si 1s spectra, especially the most surface-sensitive measurements at 2.2 keV (red, Fig. 4), indicate that the Si nanoparticles in the electrode bound with PAA have the thinnest encapsulating layer before fabrication. Additionally, for the deeper measurement taken at 5 keV (blue, Fig. 4), only the electrode bound with CMC has an overlayer thick enough to be distinct from the other three. In both the 2.2 and 5 keV measurements, the fresh PVdF electrode appears to have had its Si material coated by a layer of intermediate or comparable thickness to that of the other three electrode formulations.
Certainly the thickness of the SEI layer is not the only variable affecting Si electrode performance. While all four electrodes in our study developed similar thicknesses through five cycles, the PVdF electrode had already lost more than 30% of its initial discharge capacity by that point. However, the slightly thinner SEIs after 20 cycles for the electrodes bound with PAA or CMCPAA are consistent with their better discharge capacity retention relative to the electrode bound with only CMC (Fig. 1). More charge/discharge cycles would be necessary to explore the long-term cycling behavior of electrodes using these binders, but it is clear that the electrode using PVdF as a binder is inferior to the other three studied here at least in part due to the fact that its early SEI grows nearly linearly relative to cycle count.
IV. CONCLUSIONS
Coin cell LIBs using PAA, CMCPAA, CMC, and PVdF as the binder material in electrodes composed of silicon nanoparticles, carbon black, and binder in the ratio of 2:1:1 by weight with identical electrolyte formulations have been investigated. Electrochemical cycling data slightly favor the batteries that contain PAA in the electrode binder and batteries containing CMC or PAA in the electrode binder vastly outperform those featuring PVdF.
Electrodes from the batteries have been characterized by HAXPES, which provides a number of conclusions about the SEI formation and maturation during cycling. The interaction between the binder and active substrate material during fabrication results in an overlayer surrounding the silicon nanoparticles that is thinnest in the PAA-bound electrode, thickest in the CMC-bound electrode, and of approximately the same intermediate thickness in the CMCPAA and PVdF-bound electrodes.
Lithiating the batteries to 0.5 V and delithiating to 1.5 V generates a number of changes. LiF is deposited in all SEIs studied, presumably from decomposition of the electrolyte salt LiPF6 and is visible as the single peak appearing in the F 1s spectra. Carbonate signal intensity is observed in the C 1s spectra of all electrodes as well, though it is not until the first full cycle that this signal is obvious relative to the other, more intense species.
Spectra progress in a similar manner beyond the fifth cycle for the three electrode formulations that performed well. The intensity of the lithium (alkyl) carbonate peak in the C 1s spectra relative to the other peak intensities generally decreases with higher cycle count but the signal is slightly more intense deeper in the SEI. The carbon and oxygen spectra suggest that the SEI layers for these systems are similarly composed and while the SEI does continue to mature up to 20 cycles, our analysis indicates that the thickness appears to approach stability there and is roughly 30 nm.
Relative to the other three electrode formulations, where both the smaller fluorine concentrations and SEI thickness suggest maturing SEIs by ten cycles, the PVdF electrodes’ SEIs are consistent with a layer that decomposes electrolyte and continues to grow linearly through ten cycles.
Supplementary Material
To view supplementary material for this article, please visit https://doi.org/10.1557/jmr.2018.363.
ACKNOWLEDGMENTS
Use of the National Synchrotron Light Source, Brookhaven National Laboratory, was supported by the U.S. Department of Energy, Office of Science, Office of Basic Energy Sciences, under Contract No. DE-AC02-98CH10886. We gratefully acknowledge funding from the Department of Energy, Office of Basic Energy Sciences, EPSCoR Implementation award (DE-SC0007074). Additional support was provided by the National Institute of Standards and Technology and through a grant to BTY through the Rhode Island College Faculty Research Fund. Reference to any specific commercial product, process, or service by trade name, trademark, manufacturer, or otherwise, does not necessarily constitute or imply its endorsement, recommendation, or favoring by the United States Government or any agency thereof or its contractors or subcontractors.


 Open access