

In order to inform national and international policy on food and health and dietary change, there is a continuing need to collect information about the food and nutrient intake of populations. The National Diet and Nutrition Survey (NDNS)(Reference Swan1, Reference Whitton, Nicholson and Roberts2) in the UK and the continuous National Health and Nutrition Examination Survey(Reference Dwyer, Picciano and Raiten3, Reference Kant and Graubard4) in the USA are examples of cross-sectional surveys used to collect such information from individuals. In addition to the NDNS, the UK has a long-standing survey of household food consumption, which has been carried out every year since 1940, first as the National Food Survey (NFS; up to 2000)(5), and subsequently in collaboration with family expenditure monitoring in the form of the Expenditure and Food Survey (EFS; 2001–7) and the Living Costs and Food Survey (LCF; 2008 onwards)(6). These household budget surveys yield a continuous picture of the UK diet (albeit with some amendments to the methodology(Reference Paterakis and Nelson7)) and offer a unique opportunity to examine dietary changes.
The LCF and its predecessor the EFS are continuous cross-sectional surveys of households in the UK, commissioned jointly by the Office for National Statistics and the Department for Environment and Rural Affairs (Defra). The surveys are designed to collect information about household food and expenditure and provide a valuable source of information about food purchases of the population, which can be translated into estimates of food consumption and nutrient intake. They collect household food purchase and eating out data from every person over 7 years of age in each household over a 14-d period. The surveys are not designed to measure intakes of specific individuals.
The continuous nature of the surveys enables them to be used to assess dietary trends, allow comparison with population dietary goals and targets and assess the impact of food and health policy initiatives. In 1996, Scotland formulated time-dependent dietary targets as part of its Scottish Diet Action Plan (SDAP)(8) to improve public health. This followed from the recognition of the need to tackle the abundance of diet-related disease in Scotland(9). The Scottish Dietary Targets (SDT; Table 1), which include a mixture of food and nutrient-based targets, were originally set for achievement by 2005. The food targets were largely directed at adult dietary intake, but are actually population targets and positively framed in terms of food groups (e.g. eat more fruit and vegetables, breakfast cereals, fish, etc.) whilst the nutrient targets highlighted reductions in nutrients (e.g. less fats, salt and sugar). The Scottish Executive(10, 11) extended the period for achievement of the SDT to 2010, stating that there should be a ‘measureable incremental impact in Scotland each year to 2010’. The need to monitor progress towards these targets was only formerly recognised in 2003. Following a review of the existing surveys that may be useful to monitor progress (summarised in Table 2), a Working Group on Monitoring Scottish Dietary Targets(12) formally concluded that ‘the Expenditure and Food Survey should be used to monitor progress towards the Scottish Dietary Targets in 2005 and beyond’.

Summary of ability of the four UK surveys to monitor progress towards Scottish dietary targets

The food and nutrient targets used for monitoring were those described in the SDAP(8), but were also informed by the earlier report on the Scottish Diet(9), which identified additional food group indicators. These foods and drinks were considered indicative of overall diet quality and included cakes, biscuits and pastries; processed meat and sausages; bacon and ham; butter; saturated fat margarines and spreads; whole milk; sugar and preserves; confectionery; soft drinks; and savoury snacks (see Table 3).

The work reported in the present paper is part of an ongoing project to monitor progress towards achieving the SDT and to evaluate the impact of policy initiatives that aim to improve food and nutrient intakes in Scotland. The aim of the present paper is to present the results obtained from the analysis to monitor progress towards the SDT and overall diet quality in order to review changes in food and nutrient intake over the period 2001–9.
Materials and methods
The LCF (formerly the EFS) is conducted annually, with the sample being spread over four quarters to account for seasonality. The sample for Great Britain is drawn as a multi-stage stratified random sample with clustering, and a representative sample of the private household population is taken (excluding Scottish offshore islands and the Isles of Scilly). Stratification is based on region, the National Statistics Socio-Economic Classification of the household reference person and car ownership(Reference Hossack and Jarvis13). Cluster and stratification variables were used in the analysis along with the household weighting factor, which adjusts for household composition within the population. Whilst only those over 7 years of age are asked to complete a diary – all household purchases are recorded, so the data include all household members from birth to old age. Due to the nature of the data, it is not feasible to provide results for different age groups and there are insufficient data to be able to conduct analysis by differing household types on an annual basis. In 2009 the sample for Great Britain was 5116 households (a response rate of 50 % for the eligible sample of 10 314) and just over 10 % of these households were in Scotland(Reference Hossack and Jarvis13).
The EFS/LCF data require considerable complex secondary analysis to group the foods relevant to the SDT (and other foods, drinks and nutrients indicative of diet quality) and calculate statistically meaningful results. The calculation of mean per capita consumption and nutrient intakes, with 95 % CI, required a series of factors to be applied to the data. This process is essential if any meaningful comparisons are to be made between years.
Population average intakes of foods and nutrients relating to the SDT (Table 1) and other foods and drinks indicative of diet quality (Table 3) were calculated taking into account accepted definitions of target food groups (e.g. the category fruit and vegetables includes tinned, dried and juiced(Reference Williams14), whereas original estimates of fruit and vegetable consumption were based simply on fresh and frozen varieties). Full details of this process are available elsewhere(Reference Barton and Wrieden15).
Data preparation
The EFS/LCF coding frames provide details of household and eaten out food purchases and were obtained from Defra. The codes for foods contributing to each part of each dietary target (or other foods and drinks indicative of diet quality) were selected, categorised accordingly and a revised detailed coding frame was compiled for the analysis.
Conversion factors were applied to food purchases to estimate the actual amount of each food that was consumed. They were calculated for each food code, for household and eating out purchases; for the proportion of fruit, vegetable, bread, meat, etc. in a composite food; for the proportion of food in food grouping; raw to cooked weight (where appropriate); proportion of inedible waste; and estimate of edible waste. For example, for calculating the vegetable contribution of vegetarian dishes, a factor of 0·4 was used, as in the NDNS of adults aged 19–64 years(Reference Hoare and Henderson16). Where no factor was necessary, a factor of 1·0 was applied. Conversion factors were also used to convert dried or concentrated weights to wet weight (e.g. a factor of 3·71 for dried fruit). Data for these conversion factors were taken from McCance and Widdowson's composition of Foods and its supplements(Reference Holland, Welch and Buss17–23). Where these data were not available from the aforementioned sources, information was sought from manufacturers' label data or market share data supplied by the Food Standards Agency. These conversion factors were added to the coding frame (available on request) and were applied to food purchases to estimate the actual quantity of each food consumed.
Estimates of waste for the UK population published by the Waste and Resources Action Programme (2008)(24) have been mapped by Defra to each of the food codes used in the EFS/LCF. This information was obtained from Defra and used to assign a waste factor to each food code. The waste figures were provided for single and multiple adult households and were linked to the appropriate type of household prior to analysis. The figures published by the Waste and Resources Action Programme only account for edible waste. Inedible waste (i.e. bone) was taken into account when calculating the conversion factor for each food code.
An example of an inclusion in the coding frame for white bread is the bread in a pizza. Thus, the consumption figure for ‘pizza’ would be multiplied by a conversion factor of 0·57 to account for the average fraction of bread in the pizza and then adjusted by 0·2563 or 0·2900 to account for the proportion of pizza wasted in single adult and multiple adult households, respectively.
Data handling
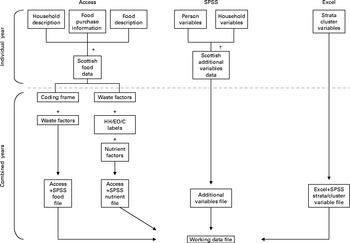
Primary datasets for each year were obtained from the UK Data Archive, University of Essex. The data comprised three files for each year – a Microsoft Access database containing raw data (at the household level) for food and drink purchases and two SPSS (SPSS, Inc.) files – one containing information on each household and the other containing information on each person within each household. Fig. 1 provides a flowchart which illustrates the data handling process for data from each year, which were then merged in SPSS to obtain one working data file with the Scottish sample extracted. Data on sampling strata and clusters were obtained from the UK Office of National Statistics.
Flowchart of data handling process. *Tables merged and Scottish data selected. †Variables selected, files merged and Scottish data selected. HH, household; EO, eater out; C, household and eater out combined.
The Access database containing the Scottish food purchase data was linked to a table constructed from the coding frame, which listed each food grouping, each food within these groupings and the appropriate conversion factor to be applied to the calculations. This table also contained data on waste for single and multiple adult households. Single and multiple adult households were selected in turn, the appropriate adjustment was then made for waste and the databases re-joined. Household consumption (based on purchases) for each food code was multiplied by the appropriate conversion factor and summed by food grouping. This was then divided by the number of individuals in the household and divided by fourteen to obtain the mean daily consumption per person (or by two in the case of fish to obtain mean weekly consumption per person). For nutrients, household consumption data minus waste (based on purchases) for each food code were multiplied by the appropriate nutrient content per gram (provided by Defra). Household and eaten out nutrient intakes for foods and drinks were then summed for each household. These were then divided by the number of individuals in the household and divided by fourteen to obtain the mean daily intake per person for each nutrient. The food and nutrient data from the Access database were exported to SPSS and merged with the working data file and each household was allocated a new identity number due to overlap in case identity number between years.
Analysis of data
Due to the multi-staged stratified sampling procedure of the EFS/LCF, data were analysed using Descriptive Statistics and General Linear Models within the Complex Samples module of SPSS, version 18 (SPSS, Inc.). Linear associations between food consumption/nutrient intake and year were assessed by linear regression. The data were weighted (to adjust for non-response and to ensure a match with population totals on household type) so that estimates obtained for mean food consumption and nutrient intake more accurately reflected that of the Scottish population and household composition. These weightings were provided by Defra.
Presentation of results
Until 2006, the EFS was reported on a financial year basis, i.e. from April of one year to March of the next. From 2006, the EFS moved from a financial year to a calendar year basis. As a consequence of this, the January-to-March 2006 data are duplicated in the 2005/2006 and the 2006 results. For ease of understanding, for years 2001/2002 to 2005/2006 dates have been presented in the text as single years, e.g. 2001/2002 has been presented as 2001, which refers to the period of April 2001 to March 2002.
Food consumption and nutrient intakes (means) relating to the SDT (Tables 4 and 5) and other dietary targets (Tables 6 and 7) are presented from 2001 through to 2009. Although NSP and food energy do not form part of the SDT, they have been added for comparison with the UK Dietary Reference Values(25).
Consumption of Scottish Diet Action Plan 1996 target foods by year, 2001–9*† (Mean values and 95 % confidence intervals)

* Expenditure and Food Survey (EFS)/Living Costs and Food Survey data (g/person per d with the exception of fish g/person per week).
† Household and eating out consumption combined.
‡ From 2006 the EFS moved from a financial year to a calendar year basis. As a consequence of this, the January–March 2006 data are duplicated in the 2005/2006 and the 2006 results.
§ Fruit includes fruit and vegetable juice.
∥ Vegetables include baked beans.
¶ Part of complex carbohydrate target.
** The results are weighted to the Scottish population; the number provided is approximately 1000th of the Scottish population.
Intake of Scottish Diet Action Plan 1996 target nutrients by year, 2001–9*† (Mean values and 95 % confidence intervals)

NMES, non-milk extrinsic sugars; CHO, carbohydrates; DRV, dietary reference value.
* Expenditure and Food Survey (EFS)/Living Costs and Food Survey data (units/person per d).
† Household and eating out intakes combined.
‡ From 2006 the EFS moved from a financial year to a calendar year basis. As a consequence of this, the January–March 2006 data are duplicated in the 2005/2006 and the 2006 results.
§ DRV for adults is 11 % food energy(25).
∥ DRV for adults is 18 g/d(Reference Holland, Brown and Buss19).
¶ The results are weighted to the Scottish population – the number provided is approximately 1000th of the Scottish population.
Consumption of additional foods and drinks indicative of diet quality (sweet) by year, 2001–9*† (Mean values and 95 % confidence intervals)

* Expenditure and Food Survey (EFS)/Living Costs and Food Survey data (g/person per d)
† Household and eating out consumption combined.
‡ From 2006 the EFS moved from a financial year to a calendar year basis. As a consequence of this, the January–March 2006 data are duplicated in the 2005/2006 and the 2006 results.
§ The results are weighted to the Scottish population; the number provided is approximately 1000th of the Scottish population.
Consumption of additional foods and drinks indicative of diet quality (not sweet) by year, 2001–9*† (Mean values and 95 % confidence intervals)

* Expenditure and Food Survey (EFS)/Living Costs and Food Survey data (g/person per d).
† Household and eating out consumption combined.
‡ From 2006 the EFS moved from a financial year to a calendar year basis. As a consequence of this, the January–March 2006 data are duplicated in the 2005/2006 and the 2006 results.
§ Meat portion only – see appendices 2 and 4 of ref. (15) for methodology.
∥ Other red meat products include the meat portion of sausages, meat pies, corned beef, burgers and pate, and is a component of total red meat.
¶ Includes potato crisps.
** The results are weighted to the Scottish population; the number provided is approximately 1000th of the Scottish population.
Results are presented as population means with 95 % CI in g/d for foods and drinks, with the exception of fish, which is expressed as g/week. Nutrient intakes are presented as percentage of food energy for fat, SFA and non-milk extrinsic sugars (NMES); as population mean daily intake in g/d for complex carbohydrate and NSP; and as MJ/d for food energy. The results provided are for household and eaten out purchases combined. P values are provided for linear association for analysis by year.
Results
Food consumption relating to the Scottish dietary targets
There were few consistent changes in consumption of the foods targeted by the SDAP and none of the SDT were met by 2009 (Table 4).
There was a slight increasing linear trend for fruit and vegetable consumption in the population from 2001 to 2009. Mean consumption for all fruit and vegetables (including fruit and vegetable juices and baked beans) was 259 g/d in 2001 and 279 g/d in 2009, which equates to almost three and a half portions per d and is considerably lower than the target of 400 g or five portions per d. The small increase in total fruit and vegetables is due to an increase in fruit consumption, with no significant change to vegetable consumption over the period, although there did appear to be a slight fall in fruit consumption and a slight increase in vegetable consumption over the last 2 years of reporting.
Total bread consumption gradually decreased over the period from 2001 to 2009 (from 111 to 95 g/d), such that the mean consumption in 2009 was significantly lower than that of 2001. This was accounted for by a steady decrease in white bread, which was only partially counteracted by an increase in brown/wholemeal bread consumption from 18 g/d in 2001 to about 23 g/d in 2006–9, the increase being equivalent to just over one-tenth of an average slice.
Total mean breakfast cereal consumption increased from 20 g/d in 2001 to 23 g/d in 2009 due to an increase in high-fibre breakfast cereal, which accounted for over half of the breakfast cereal consumption (10 g/d in 2001 and 14 g/d in 2009).
There was no overall change in oil-rich or white fish consumption over the period.
Fresh potato consumption decreased from 66 g/d in 2001 to 50 g/d in 2009.
Nutrient intake relating to the Scottish dietary targets and other dietary guidelines
There was a small but significant decrease in the percentage of food energy from SFA, from 15·5 % in 2001 to 15·1 % in 2009, compared with the SDT of no more than 11 %. No significant change in intake of food energy, fat, complex carbohydrate or NSP was observed over the period 2001–9 (Table 5), and in 2009, the percentage of food energy from total fat remained above the SDT of no more than 35 % at about 39 %.
The percentage of food energy contributed by NMES rose slightly from 2001 to 2003 (from 15·5 to 16·1 %), but then fell again to 14·8 % in 2009 (Table 5). Intakes remain higher than the SDT for children (less then 10 % of total energy) and the UK Dietary Reference Value(25) for adults (less than 11 % of food energy).
Consumption of additional foods and drinks indicative of diet quality
Mean consumption of cakes, sweet biscuits and pastries remained fairly constant with intakes in 2009 of 39 g/d. The initial upward, followed by downward trend in sugar confectionery and sugar-containing soft drinks mirrored that for NMES (i.e. increased slightly from 2001 to 2003, but then fell again towards 2009), giving an overall fall from 7·6 g/d in 2001 to 7·0 g/d in 2009 for sugar confectionery and 234 to 213 g/d for sugar-containing soft drinks (Table 6).
Mean consumption of total red meat decreased slightly from 2001 to 2009, and this was partly accounted for by a fall in other red meat products (this group included sausages, corned beef, burgers, pâté and the meat portion of meat pies and is a component of total red meat). Bacon and ham intakes have remained constant over the same time period. Total milk consumption decreased from 250 g/d in 2001 to 232 g/d in 2009. This resulted from a decrease in whole milk from 92 to 60 g/d. There was a slight increase in intakes of skimmed milk. The decrease in whole milk and total red meat is compatible with the drop in SFA. Processed potato (e.g. chips) and savoury snack (including potato crisps) consumption has decreased slightly over the period from 33 g/d in 2001 to 29 g/d in 2009 and from 14 g/d in 2001 to 13 g/d in 2009, respectively. Takeaway food consumption between 2001 and 2009 has remained fairly constant at about 21 g/d (Table 7).
Discussion
Small but significant changes in the Scottish Diet for the 9 years from 2001 to 2009 have been found using a standardised methodology developed to calculate food consumption and nutrient intake from the EFS/LCF. Although the method of data collection has remained the same over this period, it should be noted that the formulation of the dietary targets for Scotland was based on an earlier method.
The ‘present daily intake’ figures quoted in Table 1 and published in the SDAP in 1996(8) were originally derived mainly from the NFS of 1989–91, and were therefore an estimate of food and nutrient intake at that time. A major limitation is that the 1989–91 NFS did not include food and drink eaten outside the home or sweets and confectionery. In addition, the calculations used to derive certain food groups, e.g. fruit and vegetables, did not include canned, dried and juiced foods. Defra attempted to adjust results of the NFS to make them comparable to the EFS(26), but this was done after the SDAP was published. Given that several changes were made to the NFS over the period 1989–2000, it is not feasible to calibrate the present results to match those when the original targets were proposed.
The EFS/LCF is a very comprehensive source of information on food consumption and nutrient intake for the Scottish population and is carried out annually. It should be noted that the EFS/LCF has been carried out every year since 2001 using the same methodology. The main limitation of the EFS/LCF is that it is based on records of household food purchases analysed to provide population data (per average person) and not on dietary assessment of individuals. However, it has been noted by Chesher(Reference Chesher27) that, because of the relatively unobtrusive data collection method of household food surveys, this methodology may result in reduced under-reporting and a less biased response (because the food records are not related to specific individuals). In addition, the EFS/LCF collects quantitative information on diets over 14 d, a longer period than other dietary assessment methods, such as that used in the NDNS, and also has a larger sample size than results reported from the NDNS in Scotland (n 114 in the 2001/2002 survey)(Reference Hoare and Henderson16).
The present results indicate a small, but statistically significant, increase in mean consumption of fruit and vegetables in the population over the 9 years from 2001 to 2009. This increase is mostly explained by an increase in fruit rather than in vegetable intake. However, mean fruit and vegetable consumption remains about 1·5 portions below the population target of 5 portions per d. Despite the small but encouraging increase from 2001 levels, consumption appears to have dropped slightly over the period 2007–9, which may be in response to the economic situation and rising prices(28). Assuming a similar rate of increase observed over the 9-year period (4 g/year estimated from the regression equation), it will take 29 years to meet the >400 g/d SDT.
Total bread consumption fell over the period 2001–9, a trend away from the SDT, although it appears that there may have been a shift in the type of bread being consumed, as consumption of brown/wholemeal bread increased slightly. Consumption of breakfast cereals and the proportion contributed by high-fibre breakfast cereal also increased slightly, but in 2009 was still equivalent to less than a bowlful per person per d. There has been a small decrease in consumption of fresh potatoes, which could be due to consumers favouring ready-to-cook processed potatoes, but these too have decreased (Table 7). Overall, fish consumption has remained fairly static and the observed increase in oil-rich fish from 2001 to 2006 was not maintained.
Nutrient intake data from the EFS/LCF suggest that the percentage of food energy from dietary fat and intake of complex carbohydrates have not changed over the 9-year time period and continue to be significantly higher than the SDT for total fat and lower for complex carbohydrate. The SFA and NMES intakes are moving slowly in the desired direction, but are still higher than the SDT. The regression equations show that the change in SFA is − 0·044 % of energy per year, equivalent to approximately 3·7 kJ (based on an average intake of 8·4 MJ), i.e. about 0·1 g SFA, which is similar to the SFA in the reduction seen in whole milk consumption (2·5 % of 4·7 g/year = 0·12 g). If the present rate of reduction in the percentage of energy from SFA continues, it could take over 100 years to reach the SDT. Although these are statistically significant changes, in terms of nutritional and clinical significance, they are very small dietary changes.
The food and nutrient intakes estimated for Scottish adults in the NDNS 2000/2001 survey were similar to those of the results of this secondary analysis of Scottish Data from the EFS, despite the different methodologies used in the two surveys(Reference Wrieden, Barton and Armstrong29). Both surveys confirmed that food consumption and nutrient intakes were far from meeting the SDT. The exception is the NDNS data for total fat, which was 35·3 % of food energy. This figure differs from the 38·8 % of energy estimated for the same period from the EFS data and may be due to the fact that NDNS participants selectively underreported foods high in fat(Reference Gibson30). Alternatively, it could be that intake of fat appears higher because participants purchase quantities of oils and fats that are meant to be consumed over a longer period. However, it is assumed that this will be balanced by those who do not purchase these items during the period because they have sufficient in storage.
Mean daily intakes of foods from the 2001/02 NDNS(31) survey compared with those obtained from the 2001 EFS were similar for fruit and vegetables (when all fruit juice, baked beans and fruit and vegetables in composite dishes are included; 267 g/d(Reference Wrieden, Barton and Armstrong29) compared with 259 g/d from the EFS). There are no separate Scottish figures for the latest NDNS, but the UK intake of fruit and vegetables, as defined earlier, was 350 g/d for 19- to 64-year-old adults (compared with 273 g in 2001/02). This increase may be due to the change from weighed to estimated intakes, but is considerably greater than that seen for the Scottish EFS/LCF analysis, where intakes only increased to 279 g/d in 2009. In the 2003 Scottish Health Survey(Reference Bromley, Chaudhury and Craig32), the mean frequency for fruit and vegetable consumption was 3·1 portions per d, which is comparable to an intake of about 248 g/d if an average portion size of about 80 g is assumed(Reference Williams14). No statistically significant increase was apparent from 2003 to 2009 with mean intakes in 2009 of 3·3 portions per d, comparable to an intake of about 264 g/d(Reference Corbett, Dobbie and Doig33). From this it can be deduced that fruit and vegetable intake in England (the majority of the consumers in the NDNS) is considerably higher than that in Scotland, and comparative figures given in the Family Food 2009 report confirm this(34). The consequences of this difference on the mortality rates from CHD, stroke and cancer in Scotland, compared to England, have recently been explored by Scarborough et al. (Reference Scarborough, Morgan and Webster35). Using a macrosimulation model, which incorporated the results from the LCF, they predicted that if Scotland had an average diet ‘equivalent in nutritional quality’ to England, 40 % of this mortality gap would be removed.
Total bread intake in both the EFS and the NDNS in 2001 was similar, and median consumption figures of zero for wholemeal bread (for both Scotland and the whole of Great Britain) indicated that the majority of the participants were non-consumers (a fact that cannot be appreciated with the mean figures estimated from the EFS). Breakfast cereal consumption in the NDNS 2001/02 survey was higher for both total and wholegrain/high-fibre varieties than the EFS and the reason for this is unknown. It is not possible to compare the NDNS 2008/2009 figures for bread and breakfast cereals without further analysis. Comparison of oil-rich fish consumption in 2001/2002 surveys is complicated by the fact that canned tuna was included in the NDNS figures. However, this was excluded in the latest survey(31) and estimates of mean intakes were about 8 g/d, i.e. 56 g/week for the UK, almost double the estimate for Scotland from the EFS/LCF.
Fat, SFA and NMES intakes, expressed as percentage of food energy, were lower in both the NDNS 2001/02 (Scottish sample)(Reference Wrieden, Barton and Armstrong29) and the latest NDNS(31), and nearer to the SDT. This highlights the difficulties in deciding whether the Scottish population is meeting the target for fat consumption. It must also be remembered that it is not possible to give mean intakes for different age groups in the EFS/LCF and that the comparative figures from the NDNS are for adults aged 19–64 years. It is known from the recent NDNS that children's intakes of SFA and NMES are considerably higher in some age groups, e.g. 11- to 18-year-old boys recorded a NMES intake of 16 % of food energy(31). As the SDT are population targets (with the exception of the separate target set for NMES for children and adults), the results of the EFS/LCF analysis, which covers the whole population, could be considered more appropriate.
Conclusion
A robust standardised methodology has been designed, developed and tested to calculate food and nutrient intakes on a population basis, which can be used to continue to monitor the Scottish diet in the future. The results reported in the present study suggest only small improvements in consumption of fruit and vegetables, brown/wholemeal bread and high-fibre breakfast cereals and only a slight reduction in SFA and NMES intake over a 9-year period, i.e. up to 2009.
The lack of progress has significant implications for the design of government policy aimed at improving food and nutrient intake in Scotland. The Scottish Government has reaffirmed the importance of tackling poor diet and is committed to renewing the population-level dietary targets/goals to provide future impetus and set the direction for the changes needed to improve the diet. The national dietary improvement is a key factor in reducing the burden of preventable and common diet-related diseases such as cancer, diabetes and heart disease, as well as the prevalence of overweight and obesity, now at record levels in Scotland. Continued monitoring of dietary intake is essential in assessing future progress and cost effectiveness of European and national policy initiatives or action to change dietary intake.
Acknowledgements
The authors would like to acknowledge the Food Standards Agency in Scotland and the Scottish Government for funding and, in particular, the support of Anne Milne, Heather Peace and Gillian Purdon. They also wish to thank the members of the Project Steering Group, Dr Chris Dibben (University of St Andrews) and Jim Holding (Defra), as well as the Economic And Social Data Service UK Data Archive and the Office of National Statistics for supplying the data. None of the authors has a conflict of interest to declare. W. L. W. wrote the manuscript aided by K. L. B. who analysed the data. A. S. provided statistical guidance. J. A., A. S. A. and A. S. contributed to the interpretation of results and editing of the manuscript. The project was managed by W. L. W. and the Project Steering Group, which included W. L. W., A. S. A., J. A., A. S. and K. L. B.


