


Childhood overweight and obesity is a serious public health issue globally( 1 ). In 2015, it was estimated that approximately 107·7 million children between the ages of 2 and 19 years were obese( Reference Afshin, Forouzanfar and Reitsma 2 ). This is a serious concern as childhood overweight and obesity often track into adulthood which can lead to various physical and psychological issues( Reference Sanders, Han and Baker 3 ). BMI is the most common way to categorise children into weight status categories; however, BMI is a simple measure of weight status as it cannot distinguish between fat mass and fat-free mass (FFM)( Reference Wells 4 ). A recent study in 4·5-year-old children found that BMI was strongly correlated with both the fat mass index and FFM index( 5 ), indicating that discretion must be used when interpreting BMI values in young children. Therefore, it is important to assess body composition in young children whenever possible.
The criterion measures for assessing body composition are the three-component (3C) and four-component models; however, they are not able to be used in large studies because they rely on measures of body density, FFM hydration and mineralisation (the four-component model only)( Reference Wells and Fewtrell 6 ). Therefore, air displacement plethysmography (ADP) is a promising alternative and it became available for use in the preschool age group after the development of the paediatric option for BodPod (Cosmed) in 2011. ADP is considered a two-component model as it separates the body into fat mass and FFM using appropriate density values for fat mass and FFM. The density value for fat mass is considered to be stable throughout the lifespan; whereas the density value of FFM varies through life, with it being the highest in infants and decreasing as we age( Reference Wells, Williams and Chomtho 7 ). Fields & Allison( Reference Fields and Allison 8 ) validated the use of the paediatric option for BodPod using Lohman’s FFM density values against the four-component model and found it to be an accurate, precise and reliable measure for assessing body composition in young children. However, according to Wells et al.( Reference Wells, Williams and Chomtho 7 ), researchers cannot be certain what the most suitable sex- and age-specific FFM density values are. Therefore, they assessed body composition in a large, contemporary sample of children and young adults aged 5–20 years and provided new FFM density values( Reference Wells, Williams and Chomtho 7 ).
To date, no study has evaluated whether Wells et al.’s( Reference Wells, Williams and Chomtho 7 ) FFM density values provide a more accurate estimate of body composition than Lohman’s values( Reference Lohman 9 ) when assessing body composition using the paediatric option for BodPod. To investigate this, we used data from the mobile-based intervention intended to stop obesity in preschoolers (MINISTOP) study which was a randomised controlled trial that aimed to evaluate the effectiveness of a 6-month mobile health parental intervention to improve body composition, dietary habits, physical activity and sedentary behaviours in Swedish preschool children( Reference Delisle, Sandin and Forsum 10 , Reference Nyström, Sandin and Henriksson 11 ). The aims of this nested validation study were to (i) assess total body fat percentage (TBF%) using the paediatric option for BodPod with both Lohman’s( Reference Lohman 9 ) and Wells et al.’s( Reference Wells, Williams and Chomtho 7 ) FFM density values and (ii) compare the obtained TBF% values with TBF% obtained from the 3C model in forty healthy 5·5-year-old Swedish children.
Methods
Participants and study design
This study was conducted as a nested validation within the MINISTOP trial and details of this validation have been described previously( Reference Delisle Nyström, Forsum and Henriksson 12 , Reference Delisle Nyström, Henriksson and Alexandrou 13 ). When the child and their parent(s) returned to the second and final follow-up, parents were asked if they would be willing to participate in this nested validation study to assess dietary intake( Reference Delisle Nyström, Forsum and Henriksson 12 ), body composition( Reference Delisle Nyström, Henriksson and Alexandrou 13 ) and physical activity( Reference Delisle Nyström, Pomeroy and Henriksson 14 ). The parents were asked sequentially and recruitment was ended when consent for forty children was obtained (recruitment period: February–May 2015). The forty participating children were comparable to the children in the entire MINISTOP trial (n 315) with regard to weight, height, BMI and age. The child was then brought to the Linköping University Hospital for anthropometric and body composition measurements as well as to receive their dose of doubly labelled water to assess total body water. Before the measurement, the parents were reminded not to provide their child with any food or drinks close to the measurement period. This nested validation was conducted according to the Declaration of Helsinki and was approved by the Research and Ethics Committee in Stockholm, Sweden (2013/1607-31 and 2013/2250-32), and all parents provided informed consent. MINISTOP is registered as a clinical trial (https://clinicaltrials.gov/ct2/show/NCT02021786).
Anthropometry and body composition
As previously described( Reference Nyström, Sandin and Henriksson 11 , Reference Leppänen, Nyström and Henriksson 15 ), weight (kg) and height (cm) were measured to the nearest gram and 0·1 cm, respectively. BMI was then calculated as weight (kg) divided by height (m) squared. Body volume was then estimated using the paediatric option for BodPod and body density was calculated as body weight divided by body volume. Body density was then converted into TBF% using the sex and age constants for the density of FFM provided by Lohman( Reference Lohman 9 ) and Wells et al.( Reference Wells, Williams and Chomtho 7 ).
The criterion reference model used in this validation was the 3C model( Reference Fuller, Jebb and Laskey 16 ) and fat mass was calculated using the following equation: fat mass (kg)=((2·220×body volume)−(0·764×total body water))−(1·465×body weight). TBF% was then calculated as fat mass (kg) divided by body weight (kg) multiplied by 100. Body volume was obtained using ADP as described previously( Reference Forsum, Flinke Carlsson and Henriksson 17 ). Total body water was obtained via isotope dilution. Briefly, every child was provided with an accurately weighed dose of stable isotopes 0·14 g 2H2O and 0·35 g H2 18O per kg of body weight and pre-and postdose urine samples were collected, stored and analysed for isotope enrichments using isotope ratio MS as published earlier( Reference Delisle Nyström, Forsum and Henriksson 12 ). The 2H and 18O dilution space were determined using zero time enrichments obtained from the exponential disappearance curves that provided estimates for the elimination rates of both isotopes. Total body water was calculated as the average of the 2H and 18O dilution space divided by 1·041 and 1·007, respectively( 18 ).
Statistical analyses
Values are presented as means and standard deviations. Paired-samples t tests were used to test for differences in TBF% using (i) ADP and Lohman’s( Reference Lohman 9 ) FFM density values and the 3C model and (ii) ADP and Wells et al.’s( Reference Wells, Williams and Chomtho 7 ) FFM density values and the 3C model. A sample size of forty children makes it possible to detect a difference of 0·46 sd, corresponding to 2·5 TBF%( Reference Delisle Nyström, Henriksson and Alexandrou 13 ), between TBF% calculated using Lohman’s( Reference Lohman 9 ) and Wells et al.’s( Reference Wells, Williams and Chomtho 7 ) FFM density values v. the 3C model, with a statistical power of 80 % (α=0·05, two-tailed). The Bland & Altman( Reference Bland and Altman 19 ) method was used to compare TBF% calculated using Lohman’s( Reference Lohman 9 ) and Wells et al.’s( Reference Wells, Williams and Chomtho 7 ) density values v. TBF% computed using the 3C model. Utilising this method, the average of TBF% assessed using Lohman’s( Reference Lohman 9 ) or Wells et al.’s( Reference Wells, Williams and Chomtho 7 ) density values and TBF% assessed using the 3C model (x-axis) were plotted against TBF% assessed via Lohman’s( Reference Lohman 9 ) or Wells et al.’s( Reference Wells, Williams and Chomtho 7 ) density values minus TBF% calculated using the 3C model (y-axis). The mean difference and the limits of agreement (±2sd) were then computed. Linear regression was then used to test for trends between the methods being compared and Pearson correlations were conducted to evaluate the relationship between the variables. All statistical tests were performed with a 5 % level of significance using SPSS version 23 (IBM).
Results
The mean age of the forty children (eighteen girls and twenty-two boys) partaking in this study was 5·5 (sd 0·2) years. Table 1 presents the anthropometric and body composition variables for the participating children. Using Cole & Lobstein’s( Reference Cole and Lobstein 20 ) cut-points, one child was classified as overweight and two were classified as obese.
Anthropometric and body composition variables by means of paediatric option for BodPod using both Lohman’s( Reference Lohman 9 ) and Wells et al.’s( Reference Wells, Williams and Chomtho 7 ) reference values and the three-component (3C) model for participating children (n 40) (Mean values and standard deviations and ranges)
FMI, fat mass index; FFMI, fat-free mass index.
* Calculated using Swedish reference data( Reference Wikland, Luo and Niklasson 26 ).
† One child was classified as overweight and two children as obese( Reference Cole and Lobstein 20 ).
TBF% computed using ADP and Lohman’s( Reference Lohman 9 ) density values, ADP and Wells et al.’s( Reference Wells, Williams and Chomtho 7 ) density values and the 3C model are presented in Table 2. On average, TBF% calculated using ADP and Lohman’s( Reference Lohman 9 ) density values significantly underestimated TBF% in comparison with TBF% calculated using the 3C model (average: 22·2 (sd 5·7) and 25·1 (sd 5·5) %, respectively; P<0·001). When using ADP and Wells et al.’s( Reference Wells, Williams and Chomtho 7 ) density values to calculate TBF% no significant difference was found compared with the corresponding value computed using the 3C model (average: 24·9 (sd 5·5) and 25·1 (sd 5·5) %, respectively; P=0·614). Furthermore, when we stratified the sample by sex, similar results were obtained.
Total body fat percentage calculated using the paediatric option for BodPod utilising both Lohman’s( Reference Lohman 9 ) density values, Wells et al.’s( Reference Wells, Williams and Chomtho 7 ) density values and the three-component (3C) model (Mean values and standard deviations and ranges)
* P-values were tested using paired-samples t tests for comparison against the 3C model comparing total body fat percentage calculated using Lohman’s( Reference Lohman 9 ) or Wells et al.’s( Reference Wells, Williams and Chomtho 7 ) density values with total body fat percentage calculated using the 3C model.
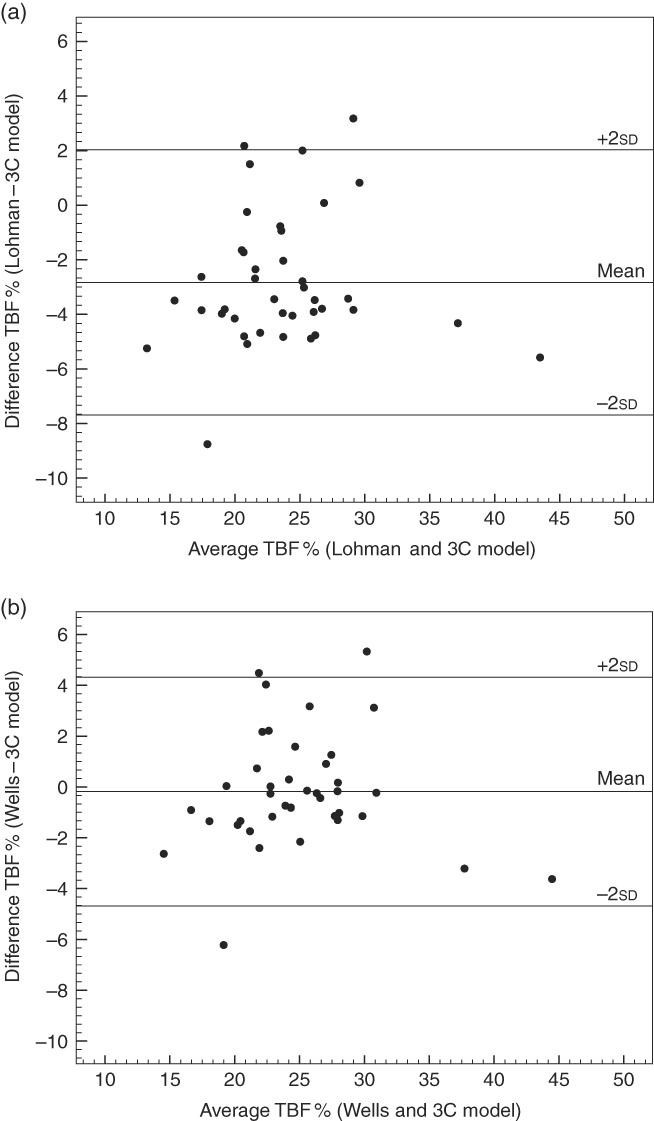
Fig. 1 displays the Bland and Altman plots for TBF% using ADP and Lohman’s( Reference Lohman 9 ) FFM density values (a) and ADP and Wells et al.’s( Reference Wells, Williams and Chomtho 7 ) FFM density values (b) and the 3C model. The Bland and Altman plots for TBF% using both Lohman’s( Reference Lohman 9 ) and Wells et al.’s( Reference Wells, Williams and Chomtho 7 ) FFM density values did not show any bias across the range of body fatness (Lohman( Reference Lohman 9 ): r 0·056, P=0·733 and Wells et al.( Reference Wells, Williams and Chomtho 7 ): r −0·006, P=0·970). The plots had wide limits of agreement; however, the limits of agreement using Wells et al.’s( Reference Wells, Williams and Chomtho 7 ) FFM density values were slightly smaller than corresponding values using Lohman’s( Reference Lohman 9 ) FFM density values (9·0 and 9·7 %, respectively).
Bland–Altman plots for forty children aged 5·5 years comparing total body fat percent (TBF%) between Lohman’s( Reference Lohman 9 ) or Wells et al.’s( Reference Wells, Williams and Chomtho 7 ) fat-free mass density values using the paediatric option for BodPod and the three-component (3C) model. (a) TBF% calculated using Lohman’s( Reference Lohman 9 ) fat-free mass density values is compared with the reference method, the 3C model (mean difference: −2·83 %; limits of agreement (±2sd): 2·03 and −7·69). (b) TBF% calculated with Wells et al.’s( Reference Wells, Williams and Chomtho 7 ) fat-free mass density values is compared with the 3C model (mean difference: −0·18 %; limits of agreement (±2sd): 4·32 and −4·68). In (a), the equation for the regression line is: y=3·42+0·02x (r 0·056, P=0·733) and in (b) y=0·12–2·59−3 x (r −0·006, P=0·970).
Discussion
Due to the complexity of the measurements needed for the multicomponent models, they are unable to be used in large-scale studies. Therefore, as new reference data for the density values for FFM become available, it is essential that they be evaluated to ensure the most accurate assumptions are being made for estimating body composition using two-component models, such as the BodPod. The main findings of this study suggest that average values for TBF% computed using ADP and Wells et al.’s( Reference Wells, Williams and Chomtho 7 ) FFM density values were in good agreement with the reference value from the 3C model. Corresponding average TBF% calculated using ADP and Lohman’s( Reference Lohman 9 ) density values resulted in values for TBF% that differed significantly from the 3C model. The results of this study indicate that Wells et al.’s( Reference Wells, Williams and Chomtho 7 ) FFM density values are superior to Lohman’s( Reference Lohman 9 ) values for 5-year-old children.
The Bland and Altman plots showed that body composition assessed using ADP and Wells et al.’s( Reference Wells, Williams and Chomtho 7 ) FFM density values and the 3C model have a smaller mean difference than the corresponding values from ADP and Lohman’s( Reference Lohman 9 ) reference values. For TBF%, Wells et al.’s( Reference Wells, Williams and Chomtho 7 ) FFM density values had a mean difference of −0·2 %, which did not differ to TBF% calculated using the 3C model. However, when using Lohman’s( Reference Lohman 9 ) FFM density values, the observed mean difference was larger (−3 %) and mean TBF% differed significantly from the corresponding value obtained using the 3C model. The underestimation of TBF% when using Lohman’s( Reference Lohman 9 ) FFM density values has also been found in another study in children aged 8–12 years comparing underwater weighing to the four-component model( Reference Wells, Fuller and Dewit 21 ). Interestingly, the results obtained in this study using Wells et al.’s( Reference Wells, Williams and Chomtho 7 ) FFM density values and the 3C model (mean difference: −0·18 %, span of limits of agreement: 9 %) agree very well with the results found by Fields & Allison( Reference Fields and Allison 8 ) using Lohman’s( Reference Lohman 9 ) FFM density values and comparing to the four-component model (mean difference: approximately 0·75 %, span of limits of agreement: approximately 9 %). One possible reason why we have better agreement with Wells et al.’s( Reference Wells, Williams and Chomtho 7 ) density values over Lohman’s( Reference Lohman 9 ) density values could be that Lohman’s( Reference Lohman 9 ) values underestimate TBF% in older children, but not as much in younger children. We have a slightly older sample (mean age 5·5 (sd 0·2) years) than Field’s et al.( Reference Fields and Allison 8 ) who had a mean age of 4·1 (sd 1·2) years. Therefore, our results are indicating at 5 years of age Wells et al.’s( Reference Wells, Williams and Chomtho 7 ) FFM density values are better; however, future studies are needed in order to confirm or contrast these results.
Lohman’s( Reference Lohman 9 ) FFM density values are based on Fomon et al.’s( Reference Fomon, Haschke and Ziegler 22 ) body composition reference values which were based on a compilation of data in children collected around 1970, which the authors stated were preliminary and crude. Lohman( Reference Lohman 9 ) utilised Fomon et al.’s( Reference Fomon, Haschke and Ziegler 22 ) values and combined them with measurements of total body water, body density and bone mineral from 292 participants aged 8–30 years, in order to create his density values. The constants used in the equation to calculate body composition are based on age and sex, with every age range encompassing 2 years. Wells et al.’s( Reference Wells, Williams and Chomtho 7 ) density values are based upon 533 individuals aged 4–23 years and utilise contemporary data on body composition. The values used to calculate body composition are both age and sex specific; however, in contrast to Lohman( Reference Lohman 9 ) every age group is only 1 year. Therefore, Wells et al.’s( Reference Wells, Williams and Chomtho 7 ) FFM density values are more age specific, which is important as the density of FFM varies with age( Reference Wells, Williams and Chomtho 7 ). As Wells et al.’s( Reference Wells, Williams and Chomtho 7 ) values are based on newer data and provide density values in shorter time intervals, it is, therefore, reasonable to hypothesise that these FFM density values are superior to Lohman’s( Reference Lohman 9 ) values. Another reason why Wells et al.’s( Reference Wells, Williams and Chomtho 7 ) FFM density values may be superior to Lohman’s( Reference Lohman 9 ) values is how bone mineral density was assessed. Wells et al.( Reference Wells, Williams and Chomtho 7 ) assessed whole body bone mineral density, whereas Lohman et al.( Reference Lohman 9 ) only assessed forearm bone mineral density.
The major strength of this study is the use of 3C model as a reference model as it is considered a criterion method( Reference Wells and Fewtrell 6 ). It could be argued that the four-component model would be even better as it separates ‘dry’ FFM into proteins and minerals( Reference Wells and Fewtrell 6 ); however, it has been found that bone mineral contributions to the model are relatively minor( Reference Fuller, Jebb and Laskey 16 ). Indeed, the 3C model yielded similar body composition results as the four-component model with narrow limits of agreement as in a previous study in 8–12-year-olds( Reference Wells, Fuller and Dewit 21 ). Furthermore, other strengths are that this study had a narrow age range (which is good due to the age-dependent variation in FFM density) and covered a wide range of body fatness. The major limitation is that this study included only 5-year-olds, thus motivating further studies in other age groups. Other limitations are the relatively small sample size as well as the fact that it consisted of children of Swedish descent. The latter is important as it may affect the generalisability of the results as studies have shown that ethnicity impacts body composition in children. For instance, Xiong et al.( Reference Xiong, He and Zhang 23 ) found that body composition differs between Chinese children and Caucasian and Japanese children. Therefore, future research is needed to evaluate both Lohman’s( Reference Lohman 9 ) and Wells et al.’s( Reference Wells, Williams and Chomtho 7 ) FFM density values in paediatric populations of varying ethnicities. It is also important to note that a higher level of education for the parents participating in this study was found in comparison with the general Swedish population( 24 ); however, we find it unlikely that this has influenced the results since they were similar in regards to weight status( 25 ). Finally, the participating children were similar to the general Swedish population in regards to weight and height( Reference Wikland, Luo and Niklasson 26 ).
In conclusion, this study shows that ADP using Wells et al.’s( Reference Wells, Williams and Chomtho 7 ) FFM density values provide average TBF% that agree to the corresponding value acquired by the 3C model. In contrast, average TBF% calculated using ADP and Lohman’s( Reference Lohman 9 ) FFM density values underestimated TBF% in comparison with TBF% acquired via the 3C model. Therefore, these results indicate that Wells et al.’s( Reference Wells, Williams and Chomtho 7 ) FFM density values should be used when assessing body composition with ADP in 5-year-old children. However, future studies are needed to confirm these results in other populations, including a wider age range of children.
Acknowledgements
The authors would like to thank the participating families as well as Eva Flinke, Gunilla Hennermark and Birgitta Jensen for their help with data recruitment and data collection.
The MINISTOP project was funded by the Swedish Research Council (project no. 2012-2883), the Swedish Research Council for Health, Working Life and Welfare (2012-0906), Bo and Vera Axsons Johnsons Foundation and Karolinska Institutet (M. L.). C. D. N. was supported by a grant from Henning and Johan Throne-Holst Foundation. P. H. was supported by a grant from the Strategic Research Area Health Care Science, Karolinska Institutet/Umeå University. H. H. was supported by grants from the Swedish Society of Medicine and the County Council of Östergötland, Sweden. All of the funders mentioned above had no role in the design, analysis or writing of this article.
All authors contributed to designing the research question and M. L. is the primary investigator of the MINISTOP trial. M. L. with the aid of C. D. N., P. H. and H. H. designed the study. C. D. N. collected and analysed the data. C. D. N. with help from E. S. and E. P. wrote the article and all authors provided comments and approved the final version.
The authors declare that there are no conflicts of interest.


