


I. INTRODUCTION
Machine learning is a promising technology for analyzing diverse types of big data. However, since a single core technology is insufficient for achieving innovative services that exploit big data, a composite technology that combines key technologies is essential. Furthermore, to conduct technology trials in the field and uncover business needs, close discussions are needed with specialists in applied fields. Against this background, the Machine Learning and Data Science Center (MLC) was established in April 2013 at NTT Laboratories as an inter-laboratory collaborative organization focused on big data analysis [1].
It has been more than a decade since the concept of “big data” was first proposed. Unfortunately, definitions of big data and its analysis were unclear from the start. In time, though, advances in sensor technologies will enable the use of sensors in all sorts of fields including social infrastructure, medicine and healthcare, transportation, and agriculture. An environment is currently evolving in which massive amounts of data can be collected and analyzed in real time: the birth of a concept called the Internet of Things (IoT). Through IoT the true nature of big data is finally being revealed.
As envisioned by MLC, the research and development visions for big data analysis technologies in the IoT era are shown in Fig. 1. From this perspective, regression analysis, which is representative of conventional data analysis, aims to describe objective variables using multiple explanatory variables. That is, it has an analysis technology for determining whether an objective variable (e.g. sales) can be expressed as a function of explanatory variables (factors). In the IoT era, however, there is a need for technology that can extract latent information spanning heterogeneous multidimensional datasets that cannot be discovered by individually analyzing different sets of data. To this end, we developed a technique called “multidimensional data analysis” that enables multiple heterogeneous sets of data to be simultaneously analyzed whose usefulness has been demonstrated through actual field trials [Reference Naya and Sawada2–Reference Takeuchi and Ueda4].
Core technologies for era of big data and Internet of Things.

With the improvement of sensing technology and the rapid spread of smartphone applications and IoT devices, various big data on car and object movements, human behavior, and environmental changes can be measured and collected everywhere in real time. By making moving entities such as people, cars, and things function as sensors, we can efficiently collect a variety of fine-grained data collection of real-world information linked to time and space (location) from many kinds of sensors. This type of information is called “spatio-temporal data”. In this paper, we also describe our trials that collected and detected city-wide events by government vehicles in Fujisawa city, Kanagawa, Japan as mobile environmental sensors [Reference Chen, Nakazawa, Yonezawa, Kawasaki and Tokuda5–Reference Kishino8].
Referring to Fig. 1, time-series analysis models the temporal interaction or cause-and-effect relationship among data, but spatio-temporal analysis constructs models that also consider the spatial dynamics among data. To analyze the spatio-temporal behavior of people and things and predict when, where, and what in real time, we established a research theme called “spatio-temporal multidimensional collective data analysis”. This form of analysis addresses time and space along multidimensional axes and uses past data from a certain period of time to learn about the mutual relationships between time and space with respect to the “flow” of people, things, information, etc.
The global trend of urbanization has increased the concentration of people in metropolitan regions [9]. This trend will intensify congestion at mass events as well. Pedestrians often get lost in unfamiliar urban environments or in large, indoor spaces. Even if people are familiar with their surroundings, they will likely have difficulty evacuating during emergencies. During Japan's most recent natural disaster, 2011’s Great East Japan Earthquake, many people could not return to their homes due to heavy congestion caused by damage to the infrastructure of highways and train lines. In such situations, either outdoors or indoors, guidance on demand must be provided that is individually tailored to human needs.
As one critical application of spatio-temporal collective data analysis, we describe our novel approach for real-time and proactive navigation in such crowded environments as event spaces and urban areas where many people are simultaneously moving toward their destinations [Reference Ueda, Naya, Shimizu, Iwata, Okawa and Sawada10,Reference Ueda11]. The ideal navigation system requires the following characteristics:
• Navigation should be optimized not for individuals, but for overall human navigation so that new congestion will not be caused by independent individual navigations.
• Navigation should be performed in real time because countermeasures must be facilitated based on the people-flow changes from moment to moment, depending on the people-flow condition.
• Navigation should be proactive; it should be achieved before congestion occurs by predicting near-future people-flow conditions.
• Navigation should cope with the avoidance of congestion, while also taking into account the intentions of individuals as much as possible. That is, it must enable many people to reach their destinations as quickly as possible.
Our challenge is to develop a real-time navigation system that satisfies the above ideal navigation characteristics. In this paper, we describe our navigation system and show its effectiveness by computer simulation using artificial people-flow data.
The rest of the paper is organized as follows. In Section II, we describe our smart data collection system to detect city-wide events. In Section III, we briefly explain our machine learning technologies for spatio-temporal multidimensional collective data analysis. In Section IV, we explain real-time, proactive navigation, which is a core technology for providing comfortable living anytime and anywhere.
II. SMART CITY-WIDE DATA COLLECTION USING GOVERNMENT VEHICLES
In the following, we describe our trials that collected and detected city-wide events using government vehicles in Fujisawa city as mobile environmental sensors.
A) City-wide data collection by sensorized government vehicles
One of the most important concerns of citizens in urban areas is the health impact of air pollution. The World Health Organization estimates that 4.3 million deaths occur annually from exposure to indoor air pollution and 3.7 million to outdoor pollution [12]. Although cities in developing countries are generally more polluted than first-world cities, millions suffer worldwide from allergies to cedar pollen and PM2.5 concentration. Accumulating fine-grained air quality information and delivering it to the public are important to assess urban air conditions to protect the health of citizens. However, acquiring detailed air quality information is usually difficult both spatially and temporally because expensive atmospheric observation stations are limited even in city areas and the sampling rate frequency is as low as just once as hour.
To cope with the above issue, we have been investigating city-wide event detection technology using environmental data collected by car-mounted sensors. We have installed dozens of sensors on garbage trucks that operate daily all over Fujisawa city [Reference Chen, Nakazawa, Yonezawa, Kawasaki and Tokuda5,Reference Shirai, Kishino, Naya and Yanagisawa6]. Figure 2 shows a sensorized garbage truck and a block diagram. The truck is equipped with various environmental sensors, such as NO2, CO, O3, PM2.5, pollen, temperature, humidity, luminance, UV, two types of air contaminants, and a microphone for measuring ambient noise. These sensor data are sampled every few seconds by the sensor type, and many sensors with global positioning system (GPS) geolocation information are transmitted to a remote server by a mobile Internet connection service every 30 s. Such fine-grained environmental data help detect spatio-temporal events in more depth, e.g. the emergence of air pollution hot spots and the generation of ambient noise. Figure 3 shows the heat maps of NO2 and the ambient noise levels of Fujisawa city by data collected from 1 month. Some parts of the main roads are noisier than other roads as well as some particular hot spots.
Sensorized garbage truck and block diagram.

Heat maps of NO2 and ambient noise levels of Fujisawa city.

Normally, for designing such a sensing system, the data sampling intervals and communication frequencies are fixed. However, these parameters for capturing changes in sensor data with finer granularity are often unknown until the data are collected and analyzed once. They also depend on the service requirements from citizens and local municipalities. To address this, we developed a remote program relocation function that allows us to remotely change the program on the sensor nodes on demand. Detailed information is available [Reference Shirai, Kishino, Naya and Yanagisawa6,Reference Kishino, Yanagisawa, Shirai, Mizutani, Suyama and Naya7].
B) Smart waste management
Another important issue in cities across the world is waste management. Efficient waste management is essential for local municipalities to sustain stable waste collection services in the future. Even though developing countries are transitioning toward better waste management, they have insufficient collection and inefficient waste disposal. Since rapid population growth through urbanization creates a huge amount of solid waste, appropriate waste management is required based on future population projections for each region. To this end, we have been conducting experiments to evaluate regional solid-waste production by motion sensors mounted on garbage trucks [Reference Kishino8].
In conventional waste management, the amount of solid waste for a given area is summarized by weighing the total waste delivered to incineration plants by garbage trucks assigned to the region. In fact, one garbage truck collects solid waste in multiple separated areas to balance workloads among multiple trucks. Therefore, estimating the weight of regional waste is difficult based on the summarized weight; it is roughly estimated based on human intuition, which includes sizable error. From interviews with municipality officials, we concluded that a method that accurately estimates the amount of waste for each area is required for planning garbage collection schemes based on regional seasonal variations in the amount of solid waste. This information will enable municipalities to minutely estimate future solid-waste amounts, thus increasing the efficiency of waste management. The regional garbage amount information is also important to promote citizen awareness and reduce the amount of waste.
To meet the above requirements, we proposed a method for estimating the regional amounts of solid waste based on the garbage collection duration in each area and the waste weight measured at incineration plants. The garbage collection duration at garbage collection place in each house or apartment building is estimated from the garbage truck's vibration that is caused when it scoops up garbage with a rotating plate. We mounted motion sensors on garbage trucks to measure and detect specific vibration patterns when collecting garbage, driving, idling, and so on. Figure 4 shows examples of the acceleration sensor data of the horizontal axis parallel to the truck's traveling direction and their spectrograms. Peak acceleration frequencies differ depending on the situation of the garbage trucks.
Acceleration measurement patterns and their spectrograms while collecting garbage, driving, and idling.

We annotated the sensor data with labels based on their situations by listening to the sounds recorded by microphones attached to the garbage trucks. By applying a standard supervised learning method, such as a support vector machine, to the extracted spectrogram features of the accelerometer data, we can classify and spot temporal durations that correspond to garbage collection. The estimated temporal durations of the garbage collection are recorded with the truck's locations from a GPS receiver. When the garbage truck arrives at the incineration plant, the total weight of its garbage is measured. We then calculate the amount of solid waste by region by distributing the weight from the operating duration of the rotating plate. Here we assume that the operating duration of the rotating plate is proportional to the amount of solid waste.
Figure 5 shows a screenshot of our regional garbage amount visualization system. Its right side shows a map that compares the estimated regional solid-waste collecting spots for two different weeks. The color dots (orange, blue, green) correspond to estimated garbage collection spots by different operator companies and/or municipality sections. Currently, 60 of 100 garbage trucks are sensorized. The bottom-left of Fig. 5 shows choropleth maps of the total amount of solid waste summarized weekly by town region. By accumulating long-term spatio-temporal garbage amount data, we can analyze spatial and seasonal tendencies along with census statistics of the city. Furthermore, by creating a system to provide feedback of the above information, we can expect to quantitatively evaluate the effectiveness of our approach for waste reduction.
Screenshot of regional garbage amount visualization system.

III. SPATIO-TEMPORAL MULTIDIMENSIONAL DATA ANALYSIS
In this section, we describe our two representative results of spatio-temporal multidimensional data analysis. The first is a method for pattern discovery and missing value completion from spatio-temporal counting data. The second is a method for estimating people flow from spatio-temporal population data.
A) Spatio-temporal pattern discovery and missing value completion
Various kinds of spatio-temporal data, such as traffic flow, purchasing records, and weather data, are observed by sensor monitoring systems in smart cities. These data are utilized to understand the dynamics of a city's human activities and its environmental conditions [Reference Roddick and Spiliopoulou13]. However, as the number of sensor nodes increases, it becomes humanly impossible to check every dimension of these spatio-temporal data. Current monitoring systems are not always stable and often fail to observe data, because of problems with sensor nodes and data transmission errors. Thus, in practice we need to deal with missing values that are included in spatio-temporal data.
Non-negative tensor completion (NTC) [Reference Xu, Yin, Wen and Zhang14], which was proposed for missing value completion, is an extension of non-negative tensor factorization (NTF) that simultaneously extracts latent factors from observed values and infers the missing values. Tensor is a generalization of a matrix that can represent a high-dimensional data array without any loss of data attributes. NTF decomposes a non-negative value tensor into sparse and reasonably interpretable latent factors and is widely used for many applications [Reference Cichocki, Zdunek, Phan and Amari15]. However, the conventional NTC does not fully utilize such spatio-temporal data properties as the orders of time points and the topology of sensors, although these structures should be utilized to regularize the latent factors. To address this problem, we proposed a new NTC method [Reference Takeuchi and Ueda4].
As a discrepancy metric and spatio-temporal structures, the generalized Kullback–Leibler (gKL) divergence was employed as regularizers. We used a gKL that fits particularly well if the data are non-negative integer values. To incorporate spatio-temporal structures, we introduced a graph Laplacian-based regularizer and used it for inducing latent factors to represent auxiliary structures. This modification enabled us to extract more meaningful latent factors than the conventional methods without considering spatio-temporal structures. The formalization details are given in Appendix. Moreover, we developed a computationally efficient learning algorithm that only needs to solve linear equations [Reference Takeuchi and Ueda4].
Figure 6(a) shows the total vehicle counts for 2 weeks, and Fig. 6(b) shows them at each site of the automobile traffic data provided by CityPulse collected in Aarhus, Denmark [16]. The horizontal and vertical axes in Fig. 6(a) correspond to the times and the vehicle counts. Figure 6(a) shows the daily periodicity of the vehicle counts, and we identified a temporal continuity for them between two adjacent times. The arrows in Fig. 6(b) correspond to the start and the end points of each monitoring site. The red and blue arrows, respectively, correspond to the large and small vehicle counts at the sites. From Fig. 7(b), we confirmed the spatial continuity of the vehicle counts among neighboring sites with similar directions.
CityPulse dataset.

Extracted latent factors for CityPulse dataset.

Examples of extracted spatial and temporal factor segments from CityPulse of our proposed method and NTC with the Euclid distance are shown in Fig. 7. By utilizing our graph-based regularizer, our proposed method extracted interpretable factors. With day and time mode factors, different temporal dynamics were extracted in Figs 7(a) and 7(b). With the site mode factors, different spatial flows of vehicles were extracted in Figs 7(c), 7(d), and 7(e), showing that factor 2 revealed a traffic pattern that occurred on weekday mornings where vehicles were heading toward downtown Aarhus.
The above result only reflects the count data, but the method is extendable to multidimensional data. Figure 8 illustrates the conceptual idea for multidimensional cases. Various kinds of input data are simultaneously analyzed to find the latent structure over different kinds of observed data. Such analysis is important in the sense that it can discover latent factors that could not have been obtained from individual data.
Latent structure extraction by multidimensional complex data analysis.

B) People-flow estimation from spatio-temporal population data
Due to the prevalence of mobile phones and GPS devices, spatio-temporal population data can now be obtained easily. For example, mobile spatial statistics [Reference Terada, Nagata and Kobayashi17] contain hourly population figures in 500 m grid squares in Japan's urban areas, calculated from mobile network operational data. To effectively utilize population data, we estimate the people flow from the data. Of course, if we could obtain the tracking data of individuals, then we would not need to estimate the people flow. However, such privacy data are often hard to obtain. Therefore, estimating people flow only from population data is challenging. Estimated people flows can be used for a wide variety of applications, which include simulating people movements during a disaster, detecting anomalous people movements, predicting future spatial populations given the current spatial population, and designing transportation systems.
The spatio-temporal population data we use as input are the populations in each grid cell over the time shown in Fig. 9. The spatio-temporal population data, which consist of aggregated information about many individuals, are aggregated to preserve privacy or because of the difficulty of tracking individuals over time. For instance, mobile spatial statistics [Reference Terada, Nagata and Kobayashi17] are preprocessed for privacy protection, and no one can follow a particular user, which allows mobile phone operating companies to publish population data that are calculated based on information of about 60 million mobile phone users. If the trajectories for each individual are given, people flow can be estimated straightforwardly by counting the number of people who move between grid cells, that is, the transition population. However, with aggregated data, we can directly determine the size of the transition population. This is why we call this “collective data analysis”.
Spatio-temporal population data: (a) Tokyo on July 1, 2013 and (b) Osaka on August 8, 2013. Darker colors represent higher population densities in each grid cell.

To overcome this problem of modeling individual behavior given aggregated data, we proposed a mixture of collective graphical models [Reference Iwata, Shimizu, Naya and Ueda18]. Our proposed model assumes that individuals move by transition probabilities that depend on their locations and time points. Since the transition populations are not given, we treat them as hidden variables. The hidden transition populations are related to the observed populations in each cell; the population in a cell equals the sum of transition populations from it, and the population in a cell in the next time point equals the sum of the transition populations to it. By using these relations that represent flow conservation as constraints, the hidden transition populations and transition probabilities are inferred simultaneously.
The proposed model can handle people-flow changes over time by segmenting time-of-day points into multiple clusters, where different clusters have different transition probabilities. For our task that models people flow, incorporating time information is crucial. For example, people move from the suburbs to the city center for work in the morning, return to the suburbs in the evening after work, and rarely travel in the middle of the night. The proposed model is an extension of collective graphical models [Reference Sheldon and Dietterich19,Reference Song, Zhang, Sekimoto, Horanont, Ueyama and Shibasaki20] for handling changes over time. Since it does not use trajectory information, when we have enough population data that approximate the actual population distribution, we can estimate the people flow.
We evaluated the proposed method using real-world spatio-temporal population datasets obtained in Tokyo and Osaka (Fig. 9). In all of the datasets, the grid cells are square, and the neighbors are the surrounding eight cells and the cell itself. Figure 10 shows people flows estimated by the proposed method. With the Tokyo data, from midnight to 6:00, the flows are sparse, which is reasonable since most people are sleeping. From 8:30 to 11:00, people move to the center of Tokyo from the suburbs for work. Flows continue to the city center from 14:30 to 15:00. From 18:30 to 23:00, flows from the city center to the suburbs were estimated since at that time people are returning home from their offices. With the Osaka data, similar temporal flow patterns were extracted. We also evaluated the prediction of errors for people flows that was averaged over all the time points and found that our proposed method outperformed the conventional related methods [Reference Iwata, Shimizu, Naya and Ueda18].
Estimated people flows for each time-of-day cluster for Tokyo and Osaka data. Arrows denote a direction.

Although our results are encouraging, our framework can be improved in a number of ways. For example, we should incorporate the spatial correlation of flows using location-dependent mixture models. Moreover, we want to extend the proposed model to include information about the day of the week and study its effectiveness with different grid sizes, time intervals, and neighborhood settings.
IV. REAL-TIME AND PROACTIVE NAVIGATION BASED ON SPATIO-TEMPORAL PREDICTIONS
A) Spatio-temporal predictions
To achieve the proactive navigation mentioned in Section I, our approach detects future congestion with a spatio-temporal statistical method that predicts people flow. The people flow (or velocity) can be used to measure congestion by extrapolating velocities to determine where congestion will occur in the near future. We assume that a set of trajectories is observed in the current time slots by a positioning sensor such as GPS. The positioning trajectory data are simple time series of coordinate values with which we construct spatio-temporal data. The observed spatio-temporal data are usually very sparse, and the ratio of the number of observations to the time stamps over a certain time interval is minute for each region. Therefore, we need to interpolate velocities that are not observed over time.
More specifically, for each region we interpolate and extrapolate eight-directional velocities during a certain time interval. Interpolation means an estimation of the unknown past velocities, while extrapolation means the prediction of near-future velocities. For this purpose, we first employed a spatio-temporal statistical approach based on the kriging approach, which is commonly utilized in fields like geology and climatology [Reference Cressie and Christopher21] and is equivalent to Gaussian process prediction in machine learning. As for extrapolation, we also compare the kriging approach with the representative time-series analysis, which is the vector auto-regression (VAR) model [Reference Ueda, Naya, Shimizu, Iwata, Okawa and Sawada10]. In our experiment, the kriging approach slightly outperformed VAR [Reference Hamilton22].
However, we found that these methods are inadequate for cases where people flows rapidly change because the observed values are assumed to be second-order stationary random variables in the conventional methods. That is, the mean and the variance of the observed values should be constant, which is unreasonable for actual people-flow data. To solve this problem, we developed a new method based on a machine learning approach. A set of kernel functions is trained using observed people-flow data for each time step for the spatial interpolation, and then the trained time-series kernel parameters are used for extrapolation.
Figure 11 shows the processing flow for our spatio-temporal predictions. Figure 11(a) shows an example of observed statistics such as people counts. In practice, since observation locations are limited and often sparse in spatio-temporal domains, we performed interpolation using the above spatio-temporal kriging approach to obtain dense statistics (Fig. 11(b)). Then we estimated a kernel regression function over the near-past time domain by fitting a set of kernel functions to each of the near-past dense statistics (Fig. 11(c)). Since we used a radial basis function as a kernel function, the obtained regression function is a mixture of radial basis functions.
Processing flow for future prediction.
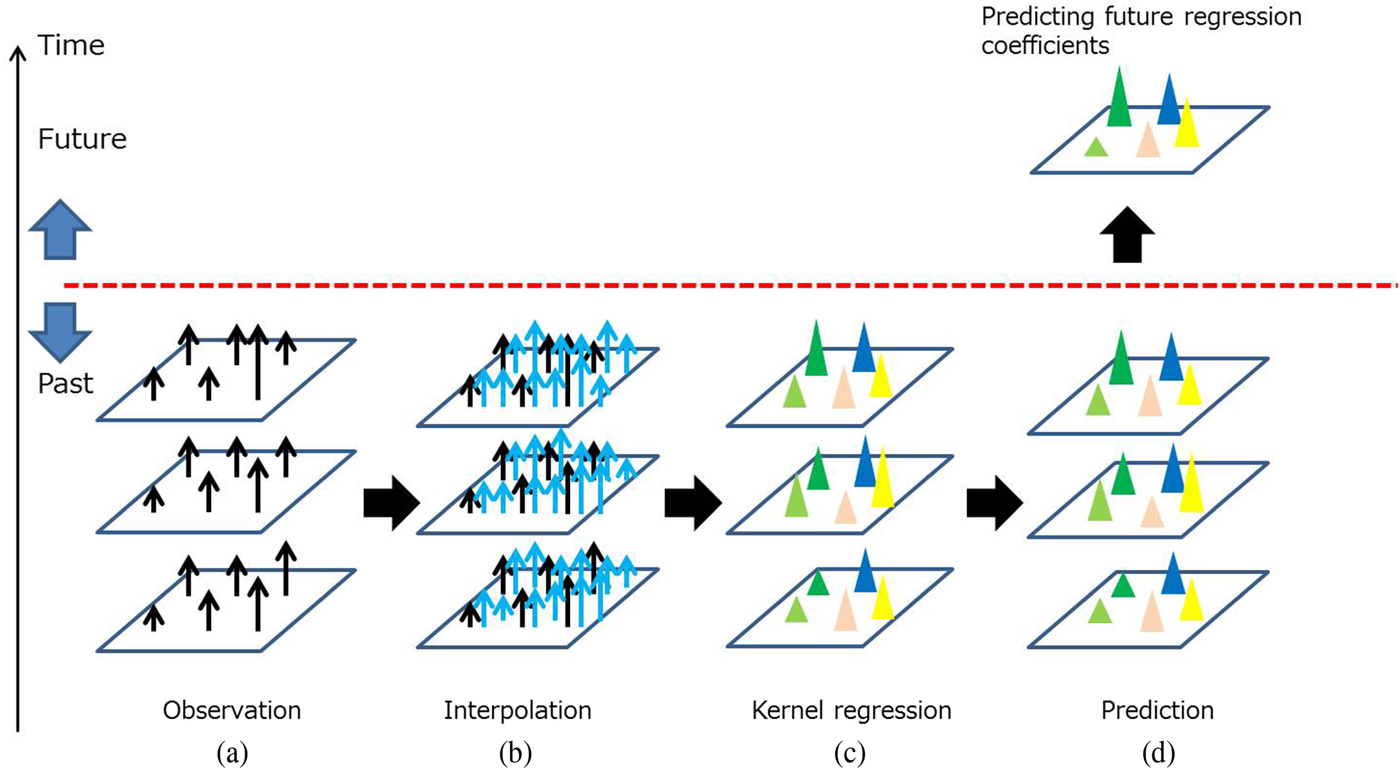
Once we have the time-consecutive kernel functions, we estimate the near-future kernel parameters from the near-past kernel parameters by linear regression. We found that kernel parameter prediction is more robust and accurate than the direct prediction of statistics because the kernel function is smoother than the statistics themselves. Since the kernel function is continuous, we can also estimate the statistics for any places.
Since this approach does not assume a second-order stationary condition, it can provide more accurate extrapolation results. We applied our method to the population data collected in an actual event venue (about 110 m × 360 m), which more than 20 000 people visit per day. The population data were collected once a minute by 24 Wi-FiFootnote 1 access points installed in the venue. The prediction performance comparison between an existing method (Gaussian process) and the proposed method is shown in Fig. 12. The proposed method obtained better prediction results, especially for the 20 and 30 min predictions.
Prediction performance comparison and heat map of people-flow prediction.

B) Learning multi-agent simulation
We examined the effectiveness of our spatio-temporal prediction method using actual people-flow data. By exploiting our method, we can predict the near-future congestion risk just from near-past, people-flow observations. The next step is designing an optimal navigation plan for a group of people to avoid such congestion risks in real time. To tackle this problem, we have been developing a learning multi-agent simulation (MAS). Starting with real-space information on people or vehicles collected from real-time observations, we input this information online into a simulation environment in cyber space, model its spatio-temporal features, instantaneously predict the immediate congestion risk, and pre-emptively and optimally navigate the crowd to avoid that risk.
MAS is a widely used technique for modeling the individual behavior of such autonomous entities (=agents) as people, cars, and animals by modeling their micro interactions with the surrounding environment and analyzing and predicting macro phenomena that develop from the interactions among multiple agents and their interactions with their environment. Analytical techniques using MAS have been widely investigated in fields called complex systems, where such overall macro behaviors as social activities, brain activities, and weather phenomena cannot be broken down into the behavior of the individual elements of people with which society is comprised, neurons that constitute the neural networks in the brain, and molecules and atoms in the atmosphere. These techniques are recently being used in sensor networks, smart grids, and intelligent transport systems as well as in evacuation guidance simulations for disaster countermeasures.
As an example, consider a navigation scene of tens of thousands of spectators exiting a stadium. In this case, the individual spectators are agents who are leaving the stadium from their current locations and moving toward their train station destinations. In the movement of spectators, a commonly used model considers the average walking speed (e.g. 4 km/h) related to such attributes of individual spectators as age and gender as well as the attenuation of that walking speed in proportion to the congestion conditions (crowd density). Crowd control manuals [23] state that overtaking becomes difficult and walking speed begins to decrease at a crowd density of 1.2 persons/m2 and that movement grinds to a halt at 4 persons/m2. Crowd density is also called the “service level” [Reference Fruin24], and the road width, space, and flow rate can be secured in pedestrian lanes that maintain a certain service level for satisfying safety standards.
In conventional analysis methods using MAS, it is common to manually design such parameters as walking speed and navigation plans (including pedestrian routes and flow rate) by conducting simulations to evaluate their effects in advance. Such methods have been applied when actually implementing crowd control (Fig. 13(a)). However, these parameters and navigation plans are limited to a few pre-determined combinations and do not necessarily match the observation results of actual person movement or navigation operations.
Differences between conventional and learning MAS.

Today, however, where IoT and sensing technologies are rapidly advancing, local people-flow and congestion conditions in the real world can be measured in real time using a variety of positioning means, such as surveillance cameras, GPSs, Wi-Fi, and beacons. With this in mind, NTT laboratories continue to develop a learning-MAS system that transfers events in the real world, such as people flow observed in real time to a simulation environment in cyber space, automatically learns modeled parameters based on observations, and predicts the spatio-temporal development of events (Fig. 13 (b)). Data assimilation [Reference Law, Stuart and Zygalakis25] technique can be applied to learn agent model parameters such as probability distribution of crowd walking speed based on people-flow observations. The aim here is to establish a technology based on a learning-MAS to predict immediate congestion risks, automatically derive an optimal navigation plan online at any time to avoid them, and support navigation by security guards and police.
C) Automatic derivation of an optimal navigation plan
An example of an immediate prediction of congestion risk is shown in Fig. 14. First, people-flow data are obtained from real-time observations and input into a simulation environment. The prediction process takes some of those data, perhaps from the immediately preceding 15 min, to simulate subsequent spatio-temporal behavior. In combination with the spatio-temporal multidimensional collective data analysis described above, the spatio-temporal congestion risk in the immediate future in 5, 10, and 20 min periods is predicted with high accuracy. In an example of the flow of spectators moving toward a stadium from neighboring train stations, the process predicts that congestion will occur 20 min later, particularly around the stadium's north side entrance (Fig. 14).
Example of immediate congestion risk prediction.

The next step is to automatically generate navigation plan candidates by computer to solve this congestion risk and identify an optimal navigation plan (Fig. 15). In this example, we assume that one navigation plan will temporarily close one of the six stadium entrances and funnel spectators toward other entrances (plan B in Fig. 15). However, the number of possible combinations becomes onerous when considering which entrances to close and when and for how long to do so or whether to completely or partially close a particular entrance. Among such huge numbers of navigation plan candidates, this process efficiently prunes and discards those that would have little effect on navigation, those that cannot actually be put into operation at the site, and those that may generate confusion, and then it immediately searches for an optimal navigation plan.
Automatic generation of candidate navigation plans and searching for optimal plan.

Various criteria can be addressed here for optimality, such as the shortest time required for all spectators to enter the stadium or the minimum time or area where congestion causes delays. However, it is difficult to directly evaluate which navigation plan gives optimal criterion value, and performing an exhaustive search of this massive search space is unrealistic.
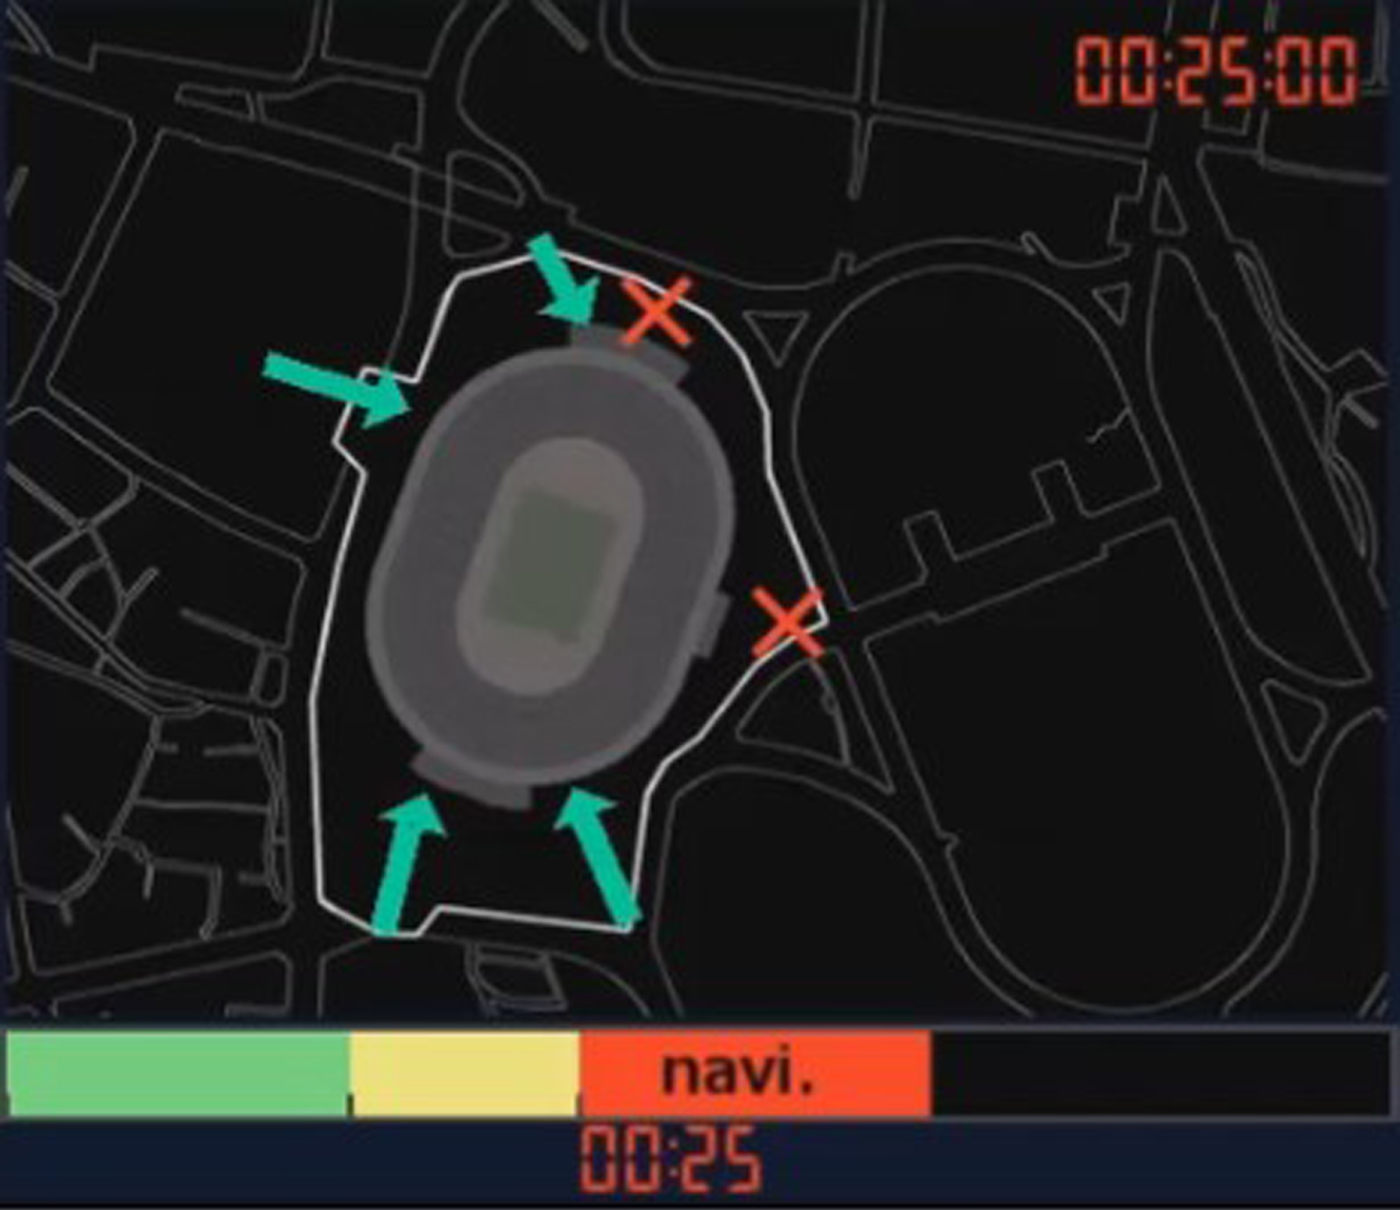
To solve this problem, we use a machine learning technique called Bayesian optimization that efficiently searches for promising candidates from a small number of search results to derive an optimal navigation plan. Each navigation plan is represented by parameters such as which entrance to close and when to bypass the crowd. From the simulation results of navigation plan candidates after a certain time period (e.g. 5 min), we can evaluate the number of spectators arrived at the stadium by each plan. Maximizing the number of spectators arriving at the stadium after a certain time period can be chosen as optimal criterion. By applying Bayesian optimization, we can effectively search promising parameter space to meet the criterion. In this example, from the search results in Fig. 15, this technique derives a navigation plan that closes two of the stadium entrances at the 25 min point (Fig. 16). This plan can be presented to security personnel to help them navigate incoming spectators. Here we expect spectator behavior to generally change due to such navigation, even though not all the spectators will necessarily comply. Accordingly, our proposed method incorporates continuous observations and repeats a series of feedback loops that search for optimal navigation plans and performs actual crowd control when a new congestion risk is predicted.
Automatically derived optimal plan.
D) Examples of navigation application
The simulation comparison results for a scene with 80 000 spectators entering a stadium with and without optimal navigation are shown in Fig. 17. Figure 17(a) shows the people flow at 1 h and 20 min after spectators begin to arrive and head toward the stadium. For the case without navigation shown in the figure's left, the concentration of nearby train stations on the stadium's north side causes congestion at the entrances near those stations and waiting lines of spectators on public roads who are stuck and cannot move forward.
Simulation results with optimal navigation plans for entering stadium.

In contrast, for the case with navigation (shown in the figure's center), congestion at particular entrances is avoided by blocking access to north-side entrances at key locations to minimize lines on public paths. With this navigation plan, all spectators can arrive at the stadium in about 2 h (Fig. 17(b), center). However, without navigation (Fig. 17(b), left), time is needed to naturally untangle congestion, and it took about another hour until all of the spectators entered the stadium. Graphs are shown in which the horizontal axis represents the time and the vertical axis represents the number of people in lines (Figs 17(a) and 17(b), lower right). With navigation, the number of people waiting is lowered. Therefore, reducing the number of people waiting is critical, particularly for events held during summer's heat. Our proposed method effectively addresses this issue.
Next, we consider a scene of 80 000 spectators leaving a stadium and heading toward nearby train stations. We scrutinize a scenario where unexpected situations (e.g. accidents) or those unforeseen in prior studies in conventional navigation planning occur in rapid succession at four locations within 20 min after exiting begins (Fig. 18). We assume that the flows of people walking toward and leaving the stations become enmeshed, narrowing some roads, for example, due to the arrival of emergency vehicles (locations A, B, and D) and closing a road (path closed) due to an accident (location C).
What-if scenarios for exiting stadium.

The results of simulations that determined whether the proposed method can derive an optimal navigation plan, even under such unforeseen conditions, are shown in Fig. 19. First, the simulation results are shown in Fig. 19(a) 20 min after people begin exiting the stadium and after all the accidents at the four locations have already occurred. At this time, the flow of people is the same regardless of the navigation, but a red congestion spot occurs due to the effects of the path closure in the map's upper right.
Simulation results with optimal navigation plans for exiting stadium.

Next, simulation results at 30 min are shown in Fig. 19(b). With navigation, the proposed method dissolved the congestion by directing people to a detour to avoid the congestion caused by the above road closure. The results for the point 2 h later (Fig. 19(d)) indicate that all the people arrived at their target stations. Without navigation, however, congestion occurs at various locations 1 h and 20 min later (Fig. 19(c)). Even 2 h later (Fig. 19(d)), congestion remains a problem, and compared with the navigation results, many people have to wait 30 min or longer. In this way, the proposed technology is not limited to the occurrence of accidents envisioned beforehand; it can also predict immediate congestion for multiple and ongoing occurrences of unforeseen situations and automatically derive an optimal navigation plan at any time.
V. CONCLUSIONS
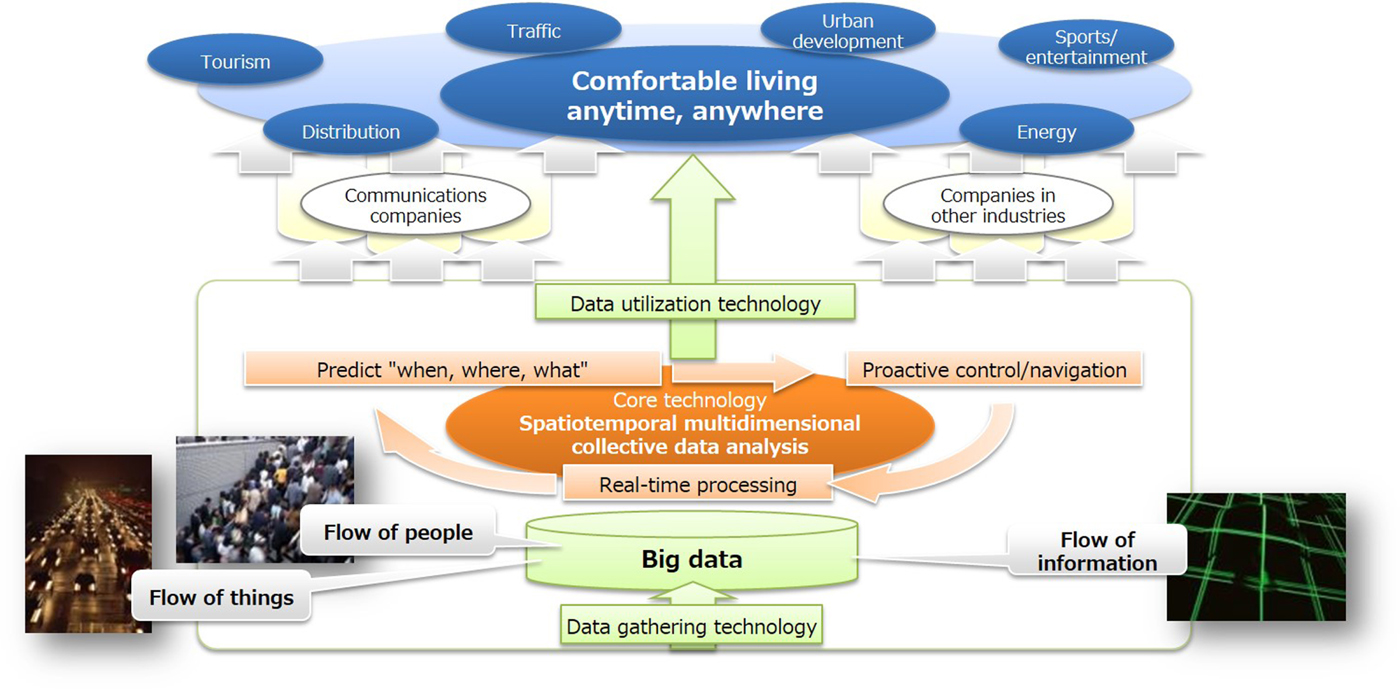
We briefly described the concept of spatio-temporal multidimensional collective data analysis, which is NTT R&D's solution in the IoT era. We are developing innovative spatio-temporal multidimensional collective data analysis techniques that model the temporal relationships of multidimensional data and predict future events. Spatio-temporal multidimensional collective data analysis considers four data elements (time, space, multidimensional, and collective) for gaining insight into near-future events. The collective element estimates the spatio-temporal flow of people or traffic in cases where individuals cannot be recognized, such as when counting the number of persons or vehicles in a spatial mesh and only aggregated statistical data are available. This challenging research remains in its infancy, and the real-time, proactive navigation of people flow introduced in this paper is positioned as just one application of the R&D vision described in Fig. 1. Looking toward 2020, our R&D will continue to use spatio-temporal multidimensional collective data analysis techniques and real-time observation data to anticipate such near-future events as congestion and implement proactive navigation for congestion relief at large-scale event venues and stabilize communication infrastructure. As shown in Fig. 20, we at NTT will continue to develop core technologies and intelligent systems to provide comfortable living anytime and anywhere.
NTT R&D solution for era of big data and Internet of Things.
APPENDIX: NON-NEGATIVE TENSOR COMPLETION
Let 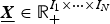 $\underline{\bi X} \in {\open R}_+^{I_{1} \times \cdots \times I_{N}}$ denote the Nth order non-negative tensor. Here I n (n = 1, …, N) is the number of features in the nth mode. An element and the entire set of elements in $\underline{\bi X}$ are represented as i = (i 1, …, i N) and ${\cal D}$, respectively. A mask tensor is defined as, where m i = 0 indicates that an element is missing and m i = 1 indicates otherwise:
 $$m_i = \left\{\matrix{0 \hfill &\hbox{if}\, x_i\, \hbox{is}\, \hbox{missing}, \hfill \cr 1 \hfill &\hbox{otherwise.} \hfill} \right.$$
Let K be the number of the tensor factors. Factor matrix A(n) of the nth mode whose columns consist of factor vectors ak(n) is defined as:
 $${\bi a}_k^{(n)} \in {\open R}_+^K, A^{(n)} = ({\bi a}_1^{(n)}, \ldots, {\bi a}_K^{(n)})\in {\open R}_+^{I_n \times K}.$$
Let  ${\cal A} = \{{\bi a}_{k}^{(n)} \vert \forall (n,k)$ denote a set of factor matrices. Let $\underline{\bi Z}$ be an estimation of $\underline{\bi X}$ with set ${\cal A}$. Then element z i of $\underline{\bi Z}$ is defined as a sum of latent factors:
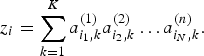 $$z_i =\sum\limits_{k=1}^K {a_{i_1,k}^{(1)}} a_{i_2 ,k}^{(2)} \ldots a_{i_N ,k}^{(n)}.$$
Then a loss of the non-negative tensor completion (NTC) is defined as a weighted sum of a divergence that indicates a discrepancy between x i and z i:
 $$f({\cal A}) = \sum\limits_{i\in {\cal D}} m_i \ d(x_i \parallel z_i).$$
A problem with NTC is to obtain minimizer  ${\cal A}^{\ast}$ of the loss under a non-negative constraint:
 $${\cal A}^{\ast} = {\mathop{\hbox{argmin}}\limits_{{\cal A}}} \, f({\cal A})\,\hbox{subject to}\,{\bi a}_r^{(n)} \ge 0 \, \forall (n,r).$$
Even though a family of divergences might be a candidate divergence for NTC, the existing NTC employed only the Euclid distance. The Euclid distance is known to be unsuitable for analyzing integer valued data. We thus employ the generalized Kullback–Leibler (gKL) divergence as the divergence of the NTC given by
 $$\eqalign{& d(x_i \parallel z_i) \cr & \quad = \left\{\matrix{-x_i \log (z_i )+z_i + \hbox{const} \hfill &(\hbox{if}\, x_i \gt 0\, \hbox{and} \cr & \quad z_i \gt 0), \cr z_i + \hbox{const} \hfill &(\hbox{if}\, x_i = 0\, \hbox{and} \hfill \cr & \quad z_i \gt 0), \cr {+\infty} \hfill &\hbox{otherwise}.\hfill} \right.}$$
Minimizing the gKL divergence fits particularly well if the data are integer values.
To use the spatio-temporal structures of the data attributes, we propose graph-based regularizers for NTC. We denote an adjacency matrix for the nth mode as  ${\bi W}^{(n)} = {\bi W}^{{(n)}^{T}}\in {\open R}_+^{I_{n} \times I_{n}} \ (n=1, \ldots, N)$, where element w i, j indicates the weight between the ith and jth features in the nth mode. We define a regularizer for the nth mode using a divergence as:
 $$\eqalign{\Omega ({\bi A}^{(n)}) &= {1 \over 2} \sum\limits_{i=1}^{I_n} \sum\limits_{i\prime =1}^{I_n} \sum\limits_{k=1}^K w_{i,j}^{(n)} (d(a_{i,k}^{(n)} \parallel a_{i\prime,k}^{(n)}) \cr &\quad +d(a_{i\prime,k}^{(n)} \parallel a_{i,k}^{(n)})).}$$
By combining the loss of NTC and our regularizers, we formulate the objective of our method as:
 $$g({\cal A}) = f({\cal A}) + \sum\limits_{n=1}^N \lambda_n \Omega ({\bi A}^{(n)}),$$
where we denote the hyperparameters for a regularizer on the nth mode as λn.
Then the problem of our method is to attain minimizer  ${\cal A}^{\ast}$ of $g({\cal A})$ under a non-negative constraint:
 $${\cal A}^{\ast} =\mathop{\hbox{argmin}}\limits_{{\cal A}} g({\cal A})\,\hbox{subject to}\,{\bi A}^{(n)}\ge 0, \forall n.$$
ACKNOWLEDGEMENT
A part of this work was supported by “Research and Development on Fundamental and Utilization Technologies for Social Big Data”, the Commissioned Research of the National Institute of Information and Communications Technology (NICT), Japan.
Naonori Ueda received a B.S., an M.S., and a Ph.D. in communication engineering from Osaka University in 1982, 1984, and 1992. In 1984, he joined the NTT Electrical Communication Laboratories, where he researched image processing, pattern recognition, and computer vision. In 1991, he joined the NTT Communication Science Laboratories. From 1993 to 1994, he was a visiting scholar at Purdue University, Indiana, USA. He was a director of NTT Communication Science Laboratories (from April 2010 to March 2013). Currently, he is an NTT Fellow, the Head of Ueda Research Laboratory and Director of Machine Learning and Data Science Center, NTT Communication Science Laboratories. He also serves as a deputy director of the RIKEN Center for Advanced Intelligence Project, established in April 2016. He is also a visiting professor at the{} Graduate School of Informatics, Kyoto University, and at the National Institute of Informatics (NII).
Futoshi Naya received a B.E. in electrical engineering, an M.S. in computer science, and a Ph.D. in engineering from Keio University, Kanagawa, in 1992, 1994, and 2010. He joined NTT Communication Science Laboratories in 1994. From 2003 to 2009, he was with the Intelligent Robotics and Communication Laboratories, Advanced Telecommunications Research Institute International (ATR). Currently, he is an executive research scientist, Research Planning Section, NTT Communication Science Laboratories. His research interests include communication robots, sensor networks, pattern recognition, and data mining in cyber physical systems. He is a member of the Institute of Electrical and Electronics Engineers (IEEE), the Society of Instrument and Control Engineers, and the Institute of Electronics, Information and Communication Engineers (IEICE).


 Open access

