

Long-chain PUFA (LCPUFA) in breast milk, specifically arachidonic acid (AA, 20 : 4n-6) and DHA (22 : 6n-3), may have beneficial effects on the development of the immune system in breast-fed infants( Reference Lauritzen and Carlson 1 ). This is speculated because LCPUFA are precursors of a range of immune-modulating signalling molecules( Reference Funk 2 , Reference Das 3 ). The diet is the most important determinant of breast milk LCPUFA content( Reference Lauritzen, Jørgensen and Hansen 4 ), but the content is also affected by the maternal capacity to convert the precursor molecules to LCPUFA products( Reference Caspi, Williams and Kim-Cohen 5 , Reference Steer, Davey Smith and Emmett 6 ) catalysed by desaturases and elongases.
Studies have reported that especially marine n-3 LCPUFA can modify immunological responses and change the T-helper cell (Th) type-1 (Th1)/Th2 balance( Reference Das 7 , Reference D’Vaz, Meldrum and Dunstan 8 ) in infants as well( Reference D’Vaz, Meldrum and Dunstan 8 – Reference Furuhjelm, Jenmalm and Fälth-Magnusson 10 ). It has been suggested that such alterations might have an epigenetic origin( Reference Lee, Barraza-Villarreal and Hernandez-Vargas 11 ), thus imposing more sustained changes on the immunological phenotype. In vitro studies have further confirmed the effect of LCPUFA on cytokine production and proliferation of T-cells( Reference Djelti, Merzouk and Merzouk 12 ).
Maternal intake of PUFA during lactation has been shown to modulate breast milk DHA content and the immune responses in infants in a number of observational as well as a few randomised controlled trials( Reference Hoppu, Isolauri and Laakso 13 – Reference Nasser, Stephen and Goh 16 ). However, assessing diet is connected to a high risk of confounding interactions, and the randomised trials have not been conclusive. Moreover, to our knowledge, no one has reported on the influence of LCPUFA in breast milk in relation to other than Th1- and Th2-based responses, such as the IL-17-producing Th17, and IL-10 from regulatory T-cells (Treg). Most cytokines are produced by more than one cell type, but type-1 immune responses usually refer to cytokines produced by Th1, cytotoxic T-cells (Tc), natural killer cells and type-1 innate lymphoid cells, and the cardinal cytokines of this type of response are interferon-γ (IFN-γ) and TNF-α, whereas type-2 responses are based on Th2 cells and type-2 innate lymphoid cells and characterised by IL-4, IL-5 and IL-13. The type-17 response is based on Th17 and type-3 innate lymphoid cells producing IL-17A and on the regulatory-type response of Treg, regulatory dendritic cells and monocytes, which all produce IL-10.
Recent studies have shown that SNP in the fatty acid desaturase gene cluster (FADS) can affect maternal plasma and breast milk PUFA composition( Reference Moltó-Puigmartí, Plat and Mensink 17 , Reference Lattka, Illig and Koletzko 18 ). As the genetic variants are ‘randomised’ during meiosis, the FADS SNP can serve as a randomising instrument independent of possible confounders( Reference Lawlor, Harbord and Sterne 19 ). FADS SNP have been shown to be associated with various health outcomes, including markers of the metabolic syndrome and the plasma lipid profile in children( Reference Moltó-Puigmartí, Jansen and Heinrich 20 , Reference Standl, Lattka and Stach 21 ), as well as neurodevelopmental outcomes in breast-fed children( Reference Caspi, Williams and Kim-Cohen 5 , Reference Steer, Davey Smith and Emmett 6 , Reference Morales, Bustamante and Gonzalez 22 , Reference Martin, Benyamin and Hansell 23 ). Moreover, it has been shown that the polymorphism in FADS genes can influence the risk of allergic diseases in children( Reference Standl, Sausenthaler and Lattka 24 ). FADS genes also seem to alter the effect of breast-feeding on risk of asthma, as a significant effect of breast-feeding on the development of asthma was only seen in minor allele carriers( Reference Standl, Sausenthaler and Lattka 25 ).
The aim of this study was to analyse the influence of FADS SNP in the mother and infant on the profile and function of T-cells isolated from infants at 6 months of age enrolled in the Copenhagen Prospective Study of Asthma in Childhood (COPSAC2000) birth cohort. We also analysed the associations between maternal FADS SNP and breast milk LCPUFA content as well as the association between breast milk LCPUFA levels and infant immune responses.
Methods
Cohort
The COPSAC2000 is a single-centre, birth cohort study, with the objective to assess the interaction between genes and environment in infants and young children with high risk of asthma in order to identify early-life exposures with a putative role in the development and course of atopic diseases. The cohort consists of 411 children of mothers with asthma recruited between 1998 and 2001. Premature children (gestational age<36 weeks) as well as children suspected of chronic diseases or lung symptoms before inclusion were excluded. The COPSAC study is conducted in accordance with the Declaration of Helsinki and is approved by the Copenhagen Ethics Committee (KF 01-289/96 and KF 11-107/02) and the Danish Data Protection Agency (2008-41-1754). Oral and written informed consent was obtained from both parents during enrolment( Reference Bisgaard 26 ).
Breast milk samples
Breast milk samples (2–5 ml) were collected at approximately 4 weeks postpartum. After addition of 0·01 % 2,6-Di-tert-butyl-4-methylphenol (Sigma Chemical Co.), the breast milk aliquots were frozen at −80°C. The analyses of the samples were completed within 1 year after sample collection. The fatty acid composition of breast milk was determined by extraction, KOH-catalysed trans-methylation, GLC (Hewlett-Packard Inc.) and use of commercial standards (Nu-Chek-Prep Inc.) as previously described( Reference Lauritzen, Halkjaer and Mikkelsen 27 ). Total values of the n-3 and n-6 PUFA families as well as the total of PUFA were calculated using the full set of eleven PUFA( Reference Lauritzen, Halkjaer and Mikkelsen 27 ), but in this study we focused on linoleic acid, γ-linolenic acid (GLA, 18 : 3n-6), dihomo-γ-linolenic acid (dGLA, 20 : 3n-6), AA, α-linolenic acid, EPA (20 : 5n-3) and DHA.
T-cell phenotyping
Peripheral blood mononuclear cells (PBMC) were isolated by density centrifugation from 4 ml peripheral blood drawn at the 6-month routine visit (mean age at the visit 6·35 (sd 0·64) months) to the clinical research unit. The PBMC were stored at −140°C for up to 12 years until the cells were analysed in 2011. The overall composition of the T-cell compartment in PBMC was assessed by cluster of differentiation (CD) markers using flow cytometry with a pre-defined gating strategy (online Supplementary Fig. 1): Tc (CD3+CD8+), Th (CD3+CD4+) and Treg (CD3+CD4+CD127loCD25hi). The fraction of Tc and Th were calculated relative to total CD3+ cells and Treg cells relative to CD3+CD4+ cells. In brief, the methodology was as follows: Unstimulated PBMC (5×10⁵ cells) were washed once in FACS buffer (PBS containing 0·1 % sodium azide and 1 % heat-inactivated fetal bovine serum). Cells were stained with a pre-titrated fluorochrome-conjugated antibody mixture designed to characterise the T-cell compartment (CD3/eFlour450 (clone UCHT1), CD8/FITC (clone OKT8), CD127/APC-eFlour780 (clone A7R34) (all from eBioscience) as well as CD4/V500 (clone RPA-T4; BD Biosciences) and CD25/PC7 (clone B1.49.9; Beckman Coulter)). In all, 400 000 cells were analysed on a BD FACSCanto™ II flow cytometer (BD Biosciences).
Polyclonal T-cell activation and cytokine analysis
PBMC (>95 % viable) were cultured in a concentration of 2×10⁵ cells/200 µl culture medium (RPMI 1640 containing 2 mm-l-glutamine (Cambrex); 0·1 m-HEPES (Lonza); 100 U/ml penicillin/streptomycin (Lonza); and 10 % heat-inactivated fetal bovine serum (Cambrex)) in U-bottomed ninety-six well plates. T-cells were activated polyclonally using anti-CD3/28 expander beads (Dynabeads Human T-Activator CD3/CD28; Invitrogen), added at a beads:cell ratio of 1:2. Unstimulated cells were added to the culture medium alone. The PBMC were stimulated for 40 h in a humidified 37°C, 5 % CO2 incubator, and the response was assessed as cytokine production in cell-free culture supernatants. Supernatant cytokines IFN-γ, TNF-α, IL-17A, IL-5, IL-13, IL-10 and IL-2 were analysed using a custom multiplex assay and read on a Sector Imager 6000 from Meso Scale Discovery (MSD). The cytokine levels detected in unstimulated PBMC were subtracted from that of activated cells. All concentrations were above zero, after adjustment for background cytokine production as well.
FADS gene variants
Using a QIAamp DNA Blood Maxi Kit (Qiagen Inc.), DNA was purified from blood samples of children and mothers and stored at −80°C. Genotyping was performed for both the child and the mother, by high-throughput genome-wide SNP genotyping, using the Illumina Infinium II HumanHap550 BeadChip technology (Illumina) as described previously( Reference Paternoster, Standl and Chen 28 – Reference Taal, Pourcain and Thiering 30 ), and hereafter non-assessed SNP were imputed using the 1000 genomes reference CEU panel as previously described( Reference Kreiner-Møller, Bisgaard and Bønnelykke 31 ). Five candidate SNP were chosen (rs174545, rs174546, rs174556, rs174561 and rs174575), which were all shown to be associated with PUFA metabolism in previous studies( Reference Standl, Sausenthaler and Lattka 24 ). The SNP rs174561 and rs174556 were in total alignment and they were tightly linked to rs174545 and rs174575 as well (see online Supplementary Table S1). The rs174575 SNP was the least well imputed (only 90 % exact) and had the lowest minor allele frequency, and thus there were only eight minor allele homozygotes in our population. Thus, to reduce redundancy, we considered only rs174546 and rs174556 – the two SNP that were originally genotyped. These two SNP had a minor allele frequency of 31 and 30 %, respectively, and the lowest degree of linkage disequilibrium (r 2 0·778).
Data handling and statistics
From the COPSAC2000 cohort of 411 children, ninety infants were excluded as they were not breast-fed for more than 1 month (n 38) or their mothers failed to provide a breast milk sample (n 52). A further 190 infants did not have data on T-cell immunology, leaving 131 infants with complete milk and T-cell immunology data. Of these, genotyping data were unavailable for twenty-two mothers, resulting in 109 with complete data (online Supplementary Fig. S2).
Samples were handled in a random manner by the researchers performing the laboratory analyses. Results are presented as mean values and standard deviations or medians and 25th, 75th percentiles for normally and non-normally distributed data, respectively. Due to non-normal distribution of the cytokines, all correlations between breast milk PUFA, FADS SNP, cytokines and T-cell distribution were tested using the non-parametric Spearman method. SNP were analysed in additive genetic models (effect per minor allele). For tables, genotypes were converted to best-guess genotypes. The statistical data analysis was performed with SPSS (version 20.0; SPSS Inc.). To examine the patterns in the cytokine profile, we used principal component analysis (PCA) performed using Matlab (version 2013a; MathWorks) and subsequently used the two first principal components as continuous variables. Spearman correlations were also used to study correlations of the PCA scores and the FA, T-cell count and SNP. The content of individual fatty acids are presented as a percentage of total fatty acids by weight (FA%). Microsoft Office Excel 2007 software was used to create the heat-maps illustrating the correlation patterns between breast milk PUFA, FADS SNP and cytokines. The results were considered significant when P≤0·05.
Results
The baseline description of the study population compared with the infants with incomplete data is shown in Table 1.
Demographic characteristics of the studied infants and the rest of the Copenhagen Prospective Study of Asthma in Childhood (COPSAC2000) birth cohort (Mean values and standard deviations; number of subjects and percentages)

* Analysed by Pearson’s χ 2 test.
† Analysed by independent sample t test.
‡ Low (elementary school or college graduate), medium (tradesman or medium length education), high (university candidate).
Infant immune profiles at 6 months of age
The T-cell phenotype distribution and mean ex vivo cytokine production after polyclonal activation in infants at 6 months of age are represented in Table 2. The overall infant cytokine response was analysed using a multivariate PCA, and the two principal components (PC1 and PC2) were found to explain 74 and 8·5 % of the variation, respectively. PC1 separated the infants based on the overall level of cytokines produced, whereas PC2 segregated infants with a profile dominated by IFN-γ (type-1) and IL-2 from infants with a profile associated mainly with IL-5 and IL-13 (type-2), IL-17 (type-17) and IL-10 (regulatory cells) (Fig. 1(a)). We analysed the overall cytokine profile in the infants in relation to the maternal FADS genotype by colour-coding according to the rs174556 gene variants. Some clustering of the infant cytokine profiles appeared to be based on maternal FADS genotype, and PC1 (overall cytokine level) correlated significantly with maternal gene variants of rs174556 (Fig. 1(b) and 2). The separation was, however, far from complete and the associations were studied further by univariate correlation analysis.
Multivariate principal component analysis of cytokines produced by ex vivo stimulation of infant peripheral blood mononuclear cells at 6 months of age. The data are shown as the score plot displaying the dispersion of each individual (as each dot represents one individual) with regard to the combined production of the seven cytokines, colour-coded according to the maternal fatty acid desaturase rs172556 genotype (![]() , major allele homozygote;
, major allele homozygote; ![]() , heterozygote;
, heterozygote; ![]() , minor allele homozygote; and
, minor allele homozygote; and ![]() , mean values for each genotype). The cytokines separated as shown in the inserted loading plot. Variance explained by each component is placed on the axes.
, mean values for each genotype). The cytokines separated as shown in the inserted loading plot. Variance explained by each component is placed on the axes.

Heat-map illustrating the patterns in correlations between breast milk PUFA, maternal and infant fatty acid desaturase variants (rows) and ex vivo-induced cytokines, T-cell counts, as well as combined cytokine profiles from principal component (PC1) and PC2, derived from Fig. 1 (columns). White boxes represent negative correlations and black boxes represent positive correlations. The saturation of the colour is a representation of the size of the Spearman correlation coefficients. Bold underlined values indicate that the correlation is statistically significant. Results are presented as correlation coefficient with the P value placed in the brackets below. IFN-γ, interferon-γ; Tc, cytotoxic T-cell; Th, T-helper cell; Treg, regulatory T-cell; GLA, γ-linolenic acid; dGLA, dihomo-γ-linolenic acid; AA, arachidonic acid.

Infant blood T-cell counts (as percentage of CD3+ cells) and ex vivo-stimulated cytokine production (pg/ml) at 6 months of age (Median values and 25th, 75th percentiles)
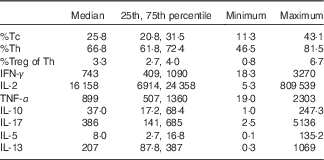
Tc, cytotoxic T-cell; Th, T-helper cell; Treg, regulatory T-cell, IFN-γ, interferon-γ.
Maternal FADS SNP effects on immunological responses in infants
All individual cytokines were negatively correlated with the maternal FADS SNP (Fig. 2; online Supplementary Fig. S3), and the correlations were significant for IL-17 v. both FADS as well as for IL-10, IL-5 and PC1 (which is a score for all cytokine productions) with rs174556. No significant correlation was found between FADS SNP in the infants and the ex vivo-induced cytokine production (Fig. 2).
Breast milk concentrations of PUFA
The overall fatty acid composition of breast milk was 42·0 (sd 4·3) FA% SFA, 40·5 (sd 3·4) FA% MUFA and the mean total content of PUFA was 13·7 (sd 2·6) FA% with a n-6:n-3 PUFA ratio of 6·0 (sd 1·8). The breast milk PUFA distribution was associated with the maternal FADS SNP (Table 3), as minor allele-carrying mothers of both SNP had lower AA levels in their breast milk. The breast milk level of EPA was also decreased in minor allele carriers of rs174546, and tended to be so for rs174556, whereas no significant effects were seen on other PUFA. Notably, none of the PUFA were found to be highest in breast milk from minor allele carriers.
Breast milk PUFA composition at 4 weeks postpartum in fatty acid desaturase (FADS) SNP major allele homozygotes (MM), heterozygotes (Mm) and minor allele homozygotes (mm) (percentages by weight of all breast milk fatty acids) (Mean values and standard deviations; if not normally distributed, median values and 25th, 75th percentiles)

LA, linoleic acid; GLA, γ-linolenic acid; dGLA, dihomo-γ-linolenic acid; AA, arachidonic acid; ALA, α-linolenic acid.
* Statistical comparisons were performed by one-way ANOVA.
† Statistical comparisons were performed by the Kruskal–Wallis test.
Breast milk PUFA and immunological response in infants
Univariate correlation analyses of breast milk PUFA and ex vivo-produced cytokines revealed that generally breast milk PUFA were inversely associated with cytokine production, except for breast milk EPA, which was significantly associated with an increased number of Tc and less Th and also associated (although not significantly) with increased cytokine secretion from activated T-cells (Fig. 2). AA was inversely correlated with IL-10, IL-17, IL-5 and IL-13, and GLA was inversely correlated with IL-17, IL-5 and IL-13.
When analysing correlations between the relative numbers of Tc, Th and Treg in blood from the infants and maternal breast milk PUFA, we found an overall negative correlation between all breast milk PUFA and Treg counts, which was significant for dGLA and total n-6 PUFA (Fig. 2; online Supplementary Fig. S3). As expected, PUFA showed opposing correlations with %Tc and %Th, but this was only significant for EPA, which was negatively correlated with %Th and positively correlated with %Tc (Fig. 2; online Supplementary Fig. S3). The combined cytokine profile from PC1 (Fig. 1(a) and (b)) revealed a significant inverse correlation with breast milk GLA and AA, whereas PC2 was positively correlated with dGLA, but not with any other of the studied breast milk PUFA (Fig. 2; online Supplementary Fig. S3).
Discussion
Our results showed that infants of mothers carrying minor alleles of FADS rs174556 had higher ex vivo-stimulated production of IL-10, IL-17 and IL-5 from PBMC. We also found that higher breast milk LCPUFA content was generally associated with lower infant cytokine production. The association was significant for AA and GLA levels as well as for IL-5 and IL-13, IL-17 and IL-10, but not for IFN-γ. AA levels in breast milk were associated with maternal FADS gene variants.
The main strength of our study is that, unlike most studies on the role of PUFA in the regulation of infant immunological responses, our study did not include oil supplementation, but rather focused on maternal FADS genotype and natural LCPUFA concentrations in breast milk. Thus, our study simulated a randomised study using the genetic variants as a randomisation variable independent of possible confounding factors (Mendelian randomisation analysis). The accuracy of our findings would have probably been improved if we had performed repeated breast milk sampling to rule out short-term fluctuations in LCPUFA content. Fluctuations are largest in the n-3 LCPUFA that to a greater extent depend on the dietary intake( Reference Lauritzen, Jørgensen and Hansen 4 ), and thus also are more prone to confounding. One limitation of our study is the relatively small sample size. Moreover, the long-term storage of PBMC have been shown to affect the ex vivo cytokine responses( Reference Germann, Oh and Schmidt 32 ), but as all samples were stored in the same way and were found to have a viability >95 % they were not likely to change the associations with maternal FADS and breast milk PUFA.
We examined a large number of associations, but did not correct for multiple testing due to the strong correlations between the cytokines and between the SNP and LCPUFA, which allows for treating them as non-independent variables; instead, we focused on the consistency in the results to exclude type-1 errors. A high consistency observed in the described correlations is unlikely to be the effect of chance. The same cytokines (IL-10, IL-5, IL-13 and IL-17) that showed to be significantly associated with the GLA and/or AA were also significantly associated (borderline tendency for IL-13) with maternal SNP rs174556. Furthermore, we found more associations than that expected by chance.
The breast milk fatty acid composition was determined prospectively 5 months before the assessment of the infant cytokine profile and a shorter period or simultaneous measurements might perhaps result in stronger associations. However, the time gap indicates that the effect of infant LCPUFA supply remains significant over time and that in utero or early PUFA intake may have a programming effect on the immune response. Randomised trials with maternal n-3 LCPUFA supplementation indicate that the former could be the most likely( Reference Klemens, Berman and Mozurkewich 33 ), whereas it cannot be neglected that more long-lasting effects can be imposed on the immune system via epigenetic changes, as was previously demonstrated for n-3 LCPUFA in the study by Lee et al.( Reference Lee, Barraza-Villarreal and Hernandez-Vargas 11 ).
FADS variants affect lipid metabolism and levels of specific PUFA and served here as a randomisation instrument, which indicated that the observed effect of maternal polymorphism on the child’s immunity could be due to changes in the breast milk LCPUFA. Experimental studies are necessary to explore the putative causal effect of this association. Although both the associations between maternal FADS SNP and breast milk AA and breast milk AA and infant ex vivo cytokine production were more pronounced than associations with any of the other LCPUFA, this does not necessarily indicate that the effect is due to AA. Other studies on maternal FADS polymorphism and the PUFA composition in breast milk also indicate that the content of AA is influenced by FADS variants to a larger extent than that of n-3 LCPUFA( Reference Sergeant, Hugenschmidt and Rudock 34 , Reference Mathias, Vergara and Gao 35 ). A longitudinal study of FADS variants and breast milk PUFA found significant associations with AA and the AA:dGLA ratio, but no associations for n-3 LCPUFA( Reference Lattka, Rzehak and Szabó 36 ). However, Xie & Innis( Reference Xie and Innis 37 ) reported that FADS minor allele homozygotes had lower breast milk levels of both AA and EPA, but one of the examined SNP also decreased DHA, and another study reported lower proportions of breast milk DHA in FADS minor allele homozygous mothers( Reference Morales, Bustamante and Gonzalez 22 ). FADS SNP have been found to influence changes in the breast milk fatty acid composition during the course of lactation, as the concentrations of SFA and trans-fatty acids increase markedly over time in the milk of the minor allele-carrying mothers, whereas no effect was seen on the time course in AA( Reference Lattka, Rzehak and Szabó 36 ). Colostrum AA levels have also been found to be decreased in minor allele carriers of a number of FADS SNP, but a few of the SNP was also reported to result in a decrease in colostrum DHA( Reference Morales, Bustamante and Gonzalez 22 ). Furthermore, our recent study of FADS SNP and LCPUFA status in infants showed that the effect of various SNP may differ and vary over time( Reference Harsløf, Larsen and Ritz 38 ). It is, therefore, not possible to determine either the timing of the effect or the responsible LCPUFA from the current study.
Studies on the role of breast milk PUFA composition on offspring health have shown conflicting results( Reference Guilbert and Wright 39 – Reference Mandhane, Greene and Sears 41 ). Most of the studies investigating the effect of dietary PUFA on infant cytokine responses have focused on the effect of fish oil supplementation. D’Vaz et al. ( Reference D’Vaz, Meldrum and Dunstan 8 ) found that direct supplementation of infants with fish oil from birth resulted in decreased Th2 responses (IL-13 and IL-5) to allergens, and an increased polyclonal Th1 response as seen by increased IFN-γ and TNF-α, but no effect was seen on the IL-17 in response to mitogenic stimulation of PBMC at 6 months of age. Another study on a fish oil supplementation of healthy infants from 9 to 12 months of age demonstrated higher IFN-γ levels and a tendency for lower IL-10 production in stimulated whole-blood cultures( Reference Damsgaard, Lauritzen and Kjaer 42 ). An increased production of IFN-γ was also observed in lipopolysaccharide-stimulated whole-blood cultures from 2·5-year-old children of mothers supplemented with fish oil during the first 4 months of lactation, but there was no difference in IL-10 production( Reference Lauritzen, Kjaer and Fruekilde 43 ). In the present study, we observed significant changes in the production of IL-17, IL-5 and IL-13, which all correlated negatively with breast milk AA and GLA. EPA was associated with an increase in the serum Tc% and a concomitant decrease in Th as well as with an overall, although insignificant, increase in the infant cytokine production. As Tc% also correlated positively with IFN-γ levels, it could be speculated that EPA may have an effect on T-cell immunology in the same direction as observed in the fish oil supplementation studies. However, with the indicated opposing effect of EPA and AA and the enhancement of both EPA and AA by maternal FADS genotypes, it will presumably be difficult to observe a significant effect of EPA under non-supplemented conditions. Regarding the potential effect of n-3 LCPUFA, the fact that the association with cytokine production was mainly seen for EPA – rather than for DHA – does not mean that only EPA is promoting the effect, as EPA could merely be a better indicator of the variation in n-3 LCPUFA metabolism.
Studies have indicated an association between infant FADS variants and the development of eczema and asthma( Reference Standl, Sausenthaler and Lattka 25 , Reference Lattka, Illig and Heinrich 44 , Reference Chisaguano, Montes and Pérez-Berezo 45 ). These variants have similarly been shown to alter the association between breast-feeding and risk of childhood asthma as well as the impact of dietary fatty acids on the risk of asthma, which has been shown to be the strongest among homozygous major allele carriers( Reference Standl, Sausenthaler and Lattka 24 , Reference Standl, Sausenthaler and Lattka 25 ). We speculate that the altered capacity of cytokine secretion might influence predisposition for the development of immune-mediated diseases such as asthma. We have observed the association of breast milk PUFA to be the strongest with regard to reduction of the cytokines mostly attributed to the activity of type-2, type-17 and regulatory responses as opposed to those from type-1 responses. Aberrant type-2 cell responses are commonly associated with asthmatic inflammation, and additionally the type-17 cytokines have been shown to enhance type-2 cell-mediated allergic inflammation, contributing to severe asthma( Reference Nakajima and Hirose 46 ). Our results, therefore, suggest that the decrease of asthma and allergy risk by LCPUFA supply could be due to reduced type-2 and type-17 activity in early life.
In conclusion, our results indicate that maternal FADS SNP through a higher infant supply of LCPUFA are associated with a decrease in the production of cytokines related to type-2, type-17 and regulatory immune activity in the infant. Furthermore, our results indicate that breast milk n-6 and n-3 LCPUFA may have opposite effects and that breast milk n-3 LCPUFA stimulate overall infant cytokine production. By changing the type of the immune cell response, infant LCPUFA supply could modulate the susceptibility of the child to immune disorders such as asthma and allergies; however, further studies are necessary to elucidate the mechanisms.
Acknowledgements
The authors gratefully express their gratitude to the children and families of the COPSAC2000 cohort study for all their support and commitment. They acknowledge and appreciate the unique efforts of the COPSAC research team.
COPSAC is funded by private and public research funds listed on www.copsac.com. The Lundbeck Foundation; The Danish Strategic Research Council; the Pharmacy Foundation of 1991; Augustinus Foundation; the Danish Medical Research Council; and The Danish Pediatric Asthma Centre provided the core support to COPSAC research centre. This study was supported by European Academy of Allergy and Clinical Immunology (EAACI) through the fellowship award programme. No pharmaceutical company was involved in the study. The funding agencies did not have any role in the design and conduct of the study; collection, management and interpretation of the data; or preparation, review or approval of the manuscript.
H. B. was responsible for the design, initiation and conduct of the COPSAC2000 cohort. L. L., H. B., S. Bi., S. Br. and E. K.-M. designed the present sub-study. J. M. L. conducted the PBMC activation analyses. M. M. and S. Bi. was responsible for the statistical analyses. M. M. and L. L. drafted the manuscript. All the authors contributed to writing of the manuscript, the analyses and interpretation of the data, and have provided important intellectual input and approval of the final version of the manuscript. The corresponding author had full access to the data and had the final responsibility for the decision to submit the manuscript for publication.
None of the authors has conflicts of interest to declare.
Supplementary Material
To view supplementary material for this article, please visit http://dx.doi.org/10.1017/S0007114515002561


