

Obesity is perceived to be the most significant health issue in companion animal nutrition with reports indicating that up to 65 % of cats and dogs are overweight/obese( Reference Lund, Armstrong and Kirk 1 – Reference Tarkosova, Story and Rand 4 ). Multiple factors are likely to be involved in weight gain and the development of obesity in cats, such as neutering, level of spontaneous physical activity (SPA) as well as the amount and composition of the food consumed. In companion animals, where food is supplied predominantly if not exclusively by the carer, the amount provided should be easily controlled to avoid weight gain, but marked variability in the measuring of food portions and the feeding of extra ‘treats’ have been observed to significantly affect body weight( Reference Kienzle and Bergler 5 , Reference German, Holden and Mason 6 ). The effects of dietary factors on intake regulation and body weight (BW) maintenance when food is offered in excess of energy requirements are therefore of interest.
There is some debate and ambiguity about the role of nutrition and especially the macronutrient composition of the diet in weight gain and weight loss. In humans, much emphasis has been placed on the intake of simple carbohydrates and fat, although it still remains unclear which of these macronutrients plays the bigger role in weight gain( Reference Willett 7 – Reference Acheson 10 ). The relationship between dietary macronutrient profile (MNP) and weight loss is equally unclear as diets of different macronutrient composition can produce similar levels of weight loss in obese individuals( Reference Sacks, Bray and Carey 11 , Reference Bray, Smith and DeJonge 12 ). The situation is similarly complicated in cats with differing risk factors implicated. The findings of an epidemiological study suggested that dietary carbohydrate may be a risk factor for the development of obesity since cats fed high carbohydrate (HC) commercially manufactured extruded diets had an increased risk of obesity compared with cats fed low carbohydrate (LC) canned/pouch-type diets( Reference Scarlett, Donoghue and Saidla 13 ). Subsequent studies have demonstrated that dietary fat rather than carbohydrate is linked to weight gain. Sexually intact, young cats fed a high fat (21 % w/w DM), dry diet ad libitum gained more weight than cats fed a low-fat diet (11 % w/w dry matter)( Reference Nguyen, Dumon and Siliart 14 ). In another study( Reference Backus, Cave and Keisler 15 ), young, sexually intact cats were allowed ad libitum access to one of four diets containing either 9, 25, 44 or 64 % of metabolisable energy (ME) from fat (although dietary energy density was not matched). Weight gain was greatest in those fed the highest fat (and lowest carbohydrate) diet. Further, in a study where cats were fed one of two diets (moderately high in fat (34 % fat energy ratio (FER)/26 % carbohydrate energy ratio (CER)) or high in carbohydrate (11 % FER/47 % CER)) to similar dietary energy/kg BW, those fed the high-fat diet significantly increased body fat weight (P=0·043), whilst BW did not differ between groups( Reference Gooding 16 ).
In both rodent and human studies protein consumption appears to be more strongly regulated than carbohydrate or fat, leading to the protein leverage hypothesis( Reference Simpson and Raubenheimer 17 ). This hypothesis proposes that a physiological need to prioritise protein intake to a target above the nutritional requirement drives excess energy intake (EI) when the dietary ratio of protein to fat and carbohydrate is reduced, possibly encouraging the development of obesity( Reference Gosby, Conigrave and Lau 18 , Reference Martinez-Cordero, Kuzawa and Sloboda 19 ). A similar situation may be the case for cats when provided with a choice of foods: cats have been observed to adjust their intake to achieve a target intake of macronutrients( Reference Hewson-Hughes, Hewson-Hughes and Miller 20 ). Although these authors reported studies with short-term (3-d monadic feeding), EI varied according to the dietary MNP offered suggesting this could have a marked influence on long term energy balance. They also reported a ‘carbohydrate ceiling’ of approximately 300 kJ/d above which intake was suppressed, a finding consistent with other reports of carbohydrate limiting EI in cats( Reference Backus, Cave and Keisler 15 , Reference Coradini, Rand and Morton 21 , Reference Salaun, Blanchard and Le Paih 22 ). These data together suggest that when given a choice cats discriminate between diets based on macronutrient composition and can regulate intake to prioritise protein and limit carbohydrate intake. These studies provide evidence of a potential role for dietary macronutrients, particularly protein and carbohydrate in the regulation of BW in cats. To identify diet compositions supporting healthy BW maintenance, this study aimed to investigate the effect of dietary MNP on EI, BW, body composition and SPA in meal-fed adult cats offered food in excess of energy requirements. In addition, to develop an understanding of how exposure to a diet alters its perceived palatability, preference tests before and following the offered excess phase were carried out.
Methods
Work was approved by the WALTHAM Animal Welfare and Ethical Review Body, conducted under licenced authority according to the Animals (Scientific) Procedures Act 1986 and followed United Kingdom Home Office Code of Practice guidelines for animal welfare.
Animals
The study was of a randomised parallel design with 120 neutered adult cats (fifty-four female and sixty-six male) aged between 14 and 37 months (at start), assigned to one of six treatment groups balanced for age, sex and BW. Cats were examined by a veterinarian at the start of the study and deemed to be clinically healthy and within 5 % of ideal BW (using the Size, Health and Physical Evaluation (SHAPE) guide( Reference German, Holden and Moxham 23 )). Cats were group-housed in environmentally enriched social rooms with free access to water except twice daily for a period of 30 min, when they were individually-housed for feeding. Structured socialisation with animal care staff was provided daily.
Study design
The study design required fifteen cats per diet group for at least 80 % power to detect effect sizes of 3 % of body weight, 15 g/d or 50 kJ/d for intake, 7 % for body fat and 25 000 total units/d for activity. Cats were removed from the study on the advice of the veterinary surgeon if they gained weight over 20 % of their ideal, or lost weight in excess of 10 % under ideal. An additional five cats per group were included as a contingency.
Baseline phase; for the first 4 weeks, cats received diet 4 (Table 1) representing the ‘target’ MNP previously identified for the adult cat( Reference Hewson-Hughes, Hewson-Hughes and Miller 20 ), in amounts to meet 100 % of their individual maintenance energy requirements (MER). The MER was calculated using an average energetic intake estimated for each cat based on individual feed intakes required to maintain an ideal body condition score gathered as part of normal husbandry practice. During the baseline period measurements of intake, BW and body composition were taken. In all, three cats were removed from the study before treatment phase for reasons unrelated to the study (from diet groups 1, 4 and 5).
Macronutrient composition of the diets used* (Mean values and ranges)
P, protein; F, fat; C, carbohydrate; ME, metabolisable energy; MP, moderate protein; LC, low carbohydrate; MC, moderate carbohydrate; HP, high protein; HC, high carbohydrate.
*Mean and range of macronutrient composition for batches of diet used.
† Carbohydrate calculated as 100−(moisture+protein+fat+crude fibre+ash). All diets were composed using varying proportions of two poultry meals (with plasma as a partial replacement in diet 6), and rice flour to provide the differing macronutrient compositions and consistent proportions of taurine, and vitamin and mineral mixes (online Supplementary Table S1).
‡Proximate analysis and modified Atwater factors (protein 16·32 kJ/g, fat 32·22 kJ/g, digestible CHO 12·55 kJ/g) were used to calculate the predicted ME of each diet.
Treatment phase; for the next 28 d, cats were offered one of the test diets (Table 1) at 200 % of MER. During this period, further measurements of intake, BW and body composition were taken. Using the removal criteria described above, six cats (n 1, 2, 1, 0, 2, 0 from diet groups 1–6, respectively) were removed over the course of the study. In addition, nine cats from diet 1 and eight from diet 3 were taken off the trial after day 24 (when dual-energy X-ray absorptiometry (DXA) was carried out) with all data whilst on trial used in data analysis.
Diets and feeding: homogenised wet diets were made to specific macronutrient compositions (Table 1) with either a moderate (MP) or high (HP) level of protein (approximately 22 and 46 % ME, respectively) and three levels of carbohydrate (LC, approximately 10 %; medium (MC), approximately 25 %; high (HC), approximately 40 % ME) and varying fat (17–65 % ME). Diets were derived from the same raw materials with the exception of diet 6 in which one exchange was made to allow the HP, HC profile to be achieved (online Supplementary Table S1). All diets were analysed (Eurofins Food Testing UK Limited), and were compliant with both the American Association of Feed Control Officials( 24 ) and the National Research Council( 25 ) recommended allowances for adult cats except for vitamin D3 (online Supplementary Table S2). Cats were therefore supplemented with 200 IU (5 μg) vitamin D3 daily (Pet-Cal™; Pfizer Animal Health). Cats were individually housed during feeding and habituated to 2, 30-min meal times each day. During the baseline phase 50 % of MER was offered at each meal and 100 % of MER at each meal during the treatment phase. Small adjustments in diet amounts were made to maintain a stable BW during the first 2 weeks of the baseline phase after which the ration was fixed.
Difference tests
At the end of each period a difference test was carried out to assess the preference for diet 4 compared with the test diet being offered during the treatment phase. During the last 2 d of the baseline phase cats received 50 % of their maintenance ration (diet 4, Table 1) as the first meal. At the second meal cats were offered 200 g each of diet 4 and the test diet allocated for the treatment phase and were allowed to select the amount of each diet consumed over a 30-min period, described as initial palatability. During the last 2 d of phase 2, cats were offered 50 % MER of the test diet as the first meal and offered 200 g each of diet 4 and the test diet in the second meal. Food bowls were placed in the feeding box before the cat, and left/right position reversed between days to account for any side bias.
Measures
Intake was recorded at the end of the feeding period, in grams consumed (mass of diet offered minus mass of diet refused). Body weight was recorded weekly in kg in the fasted (at least 12 h) state. Body condition score was recorded weekly using the validated WALTHAM SHAPE guide( Reference German, Holden and Moxham 23 ). Body composition was assessed in week 4 of each phase using DXA (Lunar Prodigy; GE Healthcare). Cats were sedated with Hypnovel (0·3 mg/kg) (Roche Products Ltd), Sedastart (20 μg/kg) (Animalcare Ltd) and Torbugesic (0·3 mg/kg) (Pfizer UK) then reversed with Sedastop (75 μg/kg) (Animalcare Ltd). SPA levels were assessed (average count for 24 h periods over three consecutive days during week 3 of each phase) using Actical devices (Philips Respironics).
Statistical analysis
A total of five linear mixed-effects models were fitted. The responses were treatment phase BW (kg) as a percentage of treatment phase starting BW (kg), treatment phase intake (kJ) as a percentage of average baseline phase intake (kJ), percentage body fat, percentage lean mass and activity (counts). BW and intake were fitted against diet, week in phase and diet by week interaction as fixed effects. Body fat, lean mass and activity were fitted against diet, phase and diet by phase interaction as fixed effects. Cat with week nested in cat was the random structure for intake and cat was the random effect for the other models. Visual inspection of model residuals led to a log10 transformation of body fat, lean mass and activity to address heteroscedasticity.
A corrected significance level of 1 % was applied to account for the five primary end points. Estimates are reported with 99 % CI. Comparisons between diets within each phase or week and between phases or weeks within each diet are reported as differences (or fold changes for log transformed responses) with 99 % CI and P-values.
For the two bowl preference tests, a mixed model analysis was performed on the difference in intake (g), including cat (random) as a factor and weighting by grouped cat specific variability. This was used to assess the mean difference in intake between the two diets, at the 5 % significance level.
Results
When offered food in excess, dietary protein affected energy intake
In cats offered excess of diets with MP, there was a significantly lower EI compared to when fed the target diet at MER (baseline phase) in diets 1 (MP–LC) and 2 (MP–MC) (weeks 4 and weeks 3 and 4, respectively), whilst there was no significant effect of diet 3 on EI (MP–HC). In cats offered excess of diets with HP, EI increased significantly in all diets (with two exceptions; for cats fed diet 4 (HP–LC) in week 4 and for cats fed diet 5 (HP–MC) in week 1). EI did not significantly differ during the course of the study in cats fed diets 3 (MP–HC), 4 (HP–LC) and 5 (HP–MC). However, EI reduced significantly across the time course for diets 1 and 2 (MP–LC and MP–MC), whilst EI of cats offered excess of diet 6 (HP–HC) fluctuated. These observations are consistent with some form of EI regulation in cats associated with the MNP.
A pair-wise comparison of EI between diet groups within week showed significant differences between diets (Fig. 1) though no significant differences were observed between any pairwise comparisons of the three MP diets or of the three HP diets across the 4 weeks. These data indicated that the CER, FER or CER:FER has no detectable effect on the intake response to protein at approximately 22 % or approximately 46 % protein energy ratio (PER). However, intake at similar CER was significantly different between the two protein levels from weeks 2 to 4 (Fig. 1) for all three comparisons.
Energy intake (kJ as a percentage of average baseline phase intake in kJ) (dotted line at 100 %). Error bars represent 99 % CI and * represents significant difference between diet groups within phase week. This shows no significant effect of CER:FER within each protein band but a significant difference in energy intake within each carbohydrate pair in weeks 2–4. Diet 1, moderate protein, low carbohydrate; diet 2, moderate protein, moderate carbohydrate; diet 3, moderate protein, high carbohydrate; diet 4, high protein, low carbohydrate; diet 5, high protein, moderate carbohydrate; diet 6, high protein, high carbohydrate.

Body weight change in cats offered energy in excess was dependent on dietary macronutrient profile
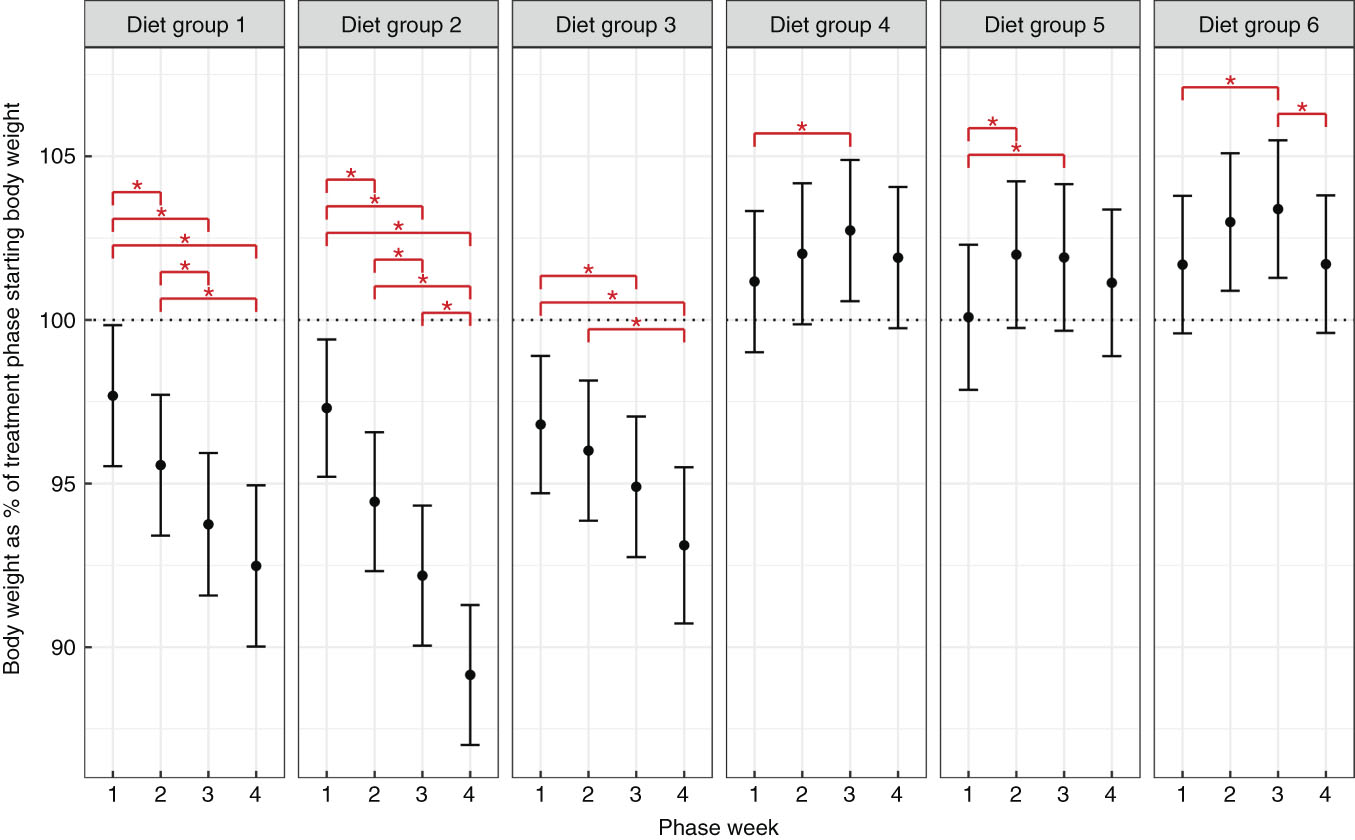
When offered excess diet with MP content, cats did not overconsume energy content to achieve a protein target consumption and instead reduced EI (Fig. 2). The decrease in intake was gradual and declined across the time course for diets 1 and 2, whilst for diet 3 it was lower but not significantly so (83–92 % of average baseline phase intake). In all cases, MP diets offered in excess resulted in significant decreases in body weight (Fig. 3) (minimum mean BW: 89 (99 % CI 87, 91) %, diet 2 week 4). However, when offered HP diets cats gained weight compared with their starting BW, significantly so in weeks 2 and 3 (maximum mean BW: 103 (99 % CI 101, 106) %, diet 6, week 3) (Fig. 3). However, weight reduced to be non-significantly different from their starting body weight by the end of the fourth week. The small increase and reductions in intake and weight within 4 weeks of being in an offered excess feeding environment is evidence that when offered excess of diets with HP, cats display a phenomenon consistent with self-regulation of EI. No significant effect on percentage fat mass or percentage lean mass was observed across the 4-week period or between cats on different diets (online Supplementary Fig. S1). Measurement of SPA identified a significant reduction in SPA in those cats offered diet 5 compared with baseline and also between those cats and the cats offered diets 1 and 2 (online Supplementary Fig. S2).
Energy intake (kJ as a percentage of average baseline phase intake in kJ) (dotted line at 100 %). Error bars represent 99 % CI and * represents significant difference between phase week within diet group. Diet 1, moderate protein, low carbohydrate; diet 2, moderate protein, moderate carbohydrate; diet 3, moderate protein, high carbohydrate; diet 4, high protein, low carbohydrate; diet 5, high protein, moderate carbohydrate; diet 6, high protein, high carbohydrate.

Body weight (kg as a percentage of starting body weight in treatment phase) (dotted line at 100 %). Error bars represent 99 % CI and * represents significant difference between phase week within diet group. Diet 1, moderate protein, low carbohydrate; diet 2, moderate protein, moderate carbohydrate; diet 3, moderate protein, high carbohydrate; diet 4, high protein, low carbohydrate; diet 5, high protein, moderate carbohydrate; diet 6, high protein, high carbohydrate.
Palatability difference tests indicate that the target macronutrient profile was significantly preferred to four of the five diets after 4 weeks solus feeding
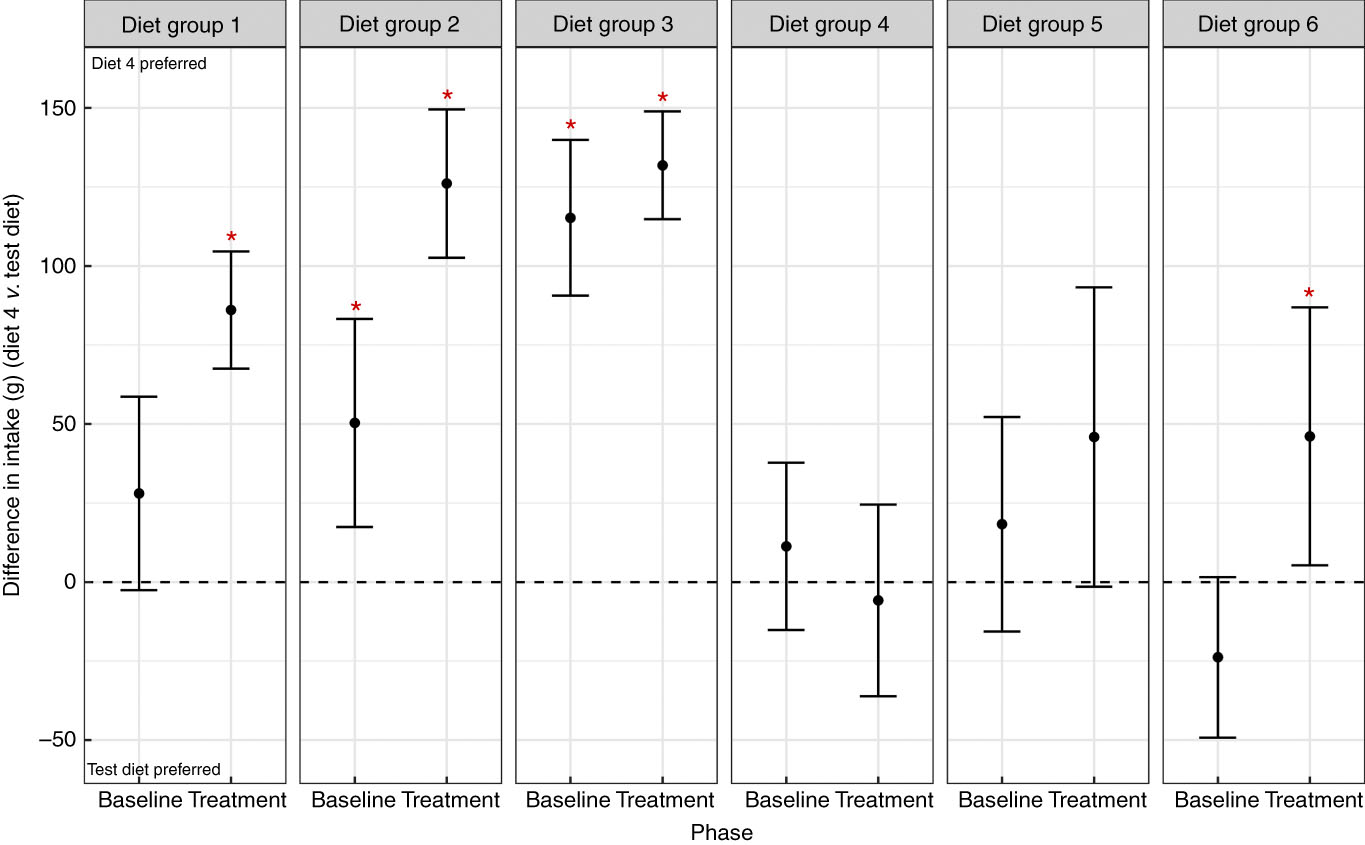
Palatability tests against the target MNP (diet 4) were performed over 2 d after the baseline phase and again in the fourth week of being offered excess. On first exposure (baseline) there was a significant preference for diet 4 compared with diets 2 and 3, indicating that during first exposure cats found diets 2 and 3 less palatable (Fig. 4). After 4 weeks of being offered excess of the diets, the target diet (diet 4) was significantly preferred to an additional two diets, diets 1 and 6, but not to diet 5 (Fig. 4).
Palatability test comparing the intake of diets to the target macronutrient profile diet in baseline phase and treatment phase. Diet 1, moderate protein, low carbohydrate; diet 2, moderate protein, moderate carbohydrate; diet 3, moderate protein, high carbohydrate; diet 4, high protein, low carbohydrate; diet 5, high protein, moderate carbohydrate; diet 6, high protein, high carbohydrate. * Significant difference in intake between diet 4 and the test diet. Diet 4 preferred is above the dashed line; test diet preferred is below the dashed line.
Carbohydrate consumption can exceed the published carbohydrate ceiling
Previously, a number of reports have identified a carbohydrate ceiling, indicating that irrespective of other macronutrient compositions cats tend to not consume more than 300 kJ (approximately 20 g) carbohydrate/d( Reference Hewson-Hughes, Hewson-Hughes and Miller 20 , Reference Hewson-Hughes, Hewson-Hughes and Colyer 26 ). In this study, it was possible for cats on diets 3 and 6 to consume in excess of this value. Whilst cats fed diet 3 consumed close to but not above this amount (online Supplementary Table S3), consistent with the existence of a carbohydrate ceiling, consumption of all MP diets was insufficient to maintain BW and therefore it is not possible to declare this as a simple response to a carbohydrate ceiling. However, the average intake of cats on diet 6 breached the carbohydrate ceiling (with an average 26 g carbohydrate/d). One explanation is that the ceiling is dependent upon other factors (such as source of carbohydrate) and that in this extremely low-fat diet, outside of the range of commercial diets, carbohydrate consumption above this proposed ceiling is tolerated.
Discussion
Energy intake
The protein leverage hypothesis suggests that excess energy content may be consumed in diets with lower protein content to meet a protein intake target( Reference Simpson and Raubenheimer 17 ). As cats are obligate carnivores, with a constitutively high rate of protein oxidation( Reference Rogers, Morris and Freeland 27 ) it has been considered one explanation for why they may be prone to overconsuming commercial diets lower in protein( Reference Scarlett, Donoghue and Saidla 13 ). Whilst some studies have observed no difference in EI in adult cats consuming either a MP or HP diet (35 and 52 % PER( Reference Russell, Murgatroyd and Batt 28 ); or 27 and 50 % PER( Reference Green, Ramsey and Villaverde 29 )), an increase in the EI of cats offered a diet at 27 % PER compared with 47 % PER diet( Reference Wei, Fascetti and Liu 30 ), was consistent with the protein leverage hypothesis. However, those diets had varying ratios of carbohydrate and fat which may have confounded a single interpretation of the results. In the present study, cats were offered diets with a moderate, but lower amount of protein than these previous studies (approximately 22 % PER, 7 % w/w) compared with an amount able to provide their MNP target profile (diet 4) (approximately 46 % PER, 10 % w/w). To overcome issues with diet matrix these were provided as a wet loaf format, which enables a wide range of carbohydrate to be provided (10, 25 or 40 % CER). This structure allowed the effect of macronutrient balance on EI when offered in excess to be evaluated, with fixed proportions of protein and carbohydrate within a background of varying fat content. Irrespective of CER and FER, the higher protein diets had a significantly greater EI (kJ/kg) compared with MP diets, a finding that was not consistent with these previous studies( Reference Russell, Murgatroyd and Batt 28 – Reference Wei, Fascetti and Liu 30 ). The data reported here do not support the hypothesis that cats will overconsume a MP diet to achieve a target intake. Furthermore, the data showed that, following an initial phase of weight gain, cats fed a HP diet modified intake to return to the baseline body weight within 28 d.
The results may be confounded by an unexpected response to the MP diets, where initial palatability and potential physiological responses to their consumption led to an insufficient intake to maintain starting body weight. It is interesting to note that the intakes of cats offered MP diets fell gradually over the 4 weeks of the study, when it might be expected that a lack of palatability would be overcome when insufficient energy was being consumed to maintain body weight. It is possible that the ability to consume sufficient MP diet to attain a target amount of protein was confounded by high levels of dietary fat. Excess fat has been shown to impose a constraint on protein intake in cats, although this was reported to have less of an effect compared with that of carbohydrate( Reference Hewson-Hughes, Hewson-Hughes and Miller 20 ). Other studies building on the findings observed here will be reported in the future.
As obligate carnivores, cats have a number of sensory and metabolic adaptations that reflect their expected HP, LC intake( Reference Eisert 31 ) and may explain a preference for HP diets. When offered a range of different MNP diets, cats have been shown to regulate their intake to a target macronutrient composition high in protein (PER of approximately 50 %( Reference Hewson-Hughes, Hewson-Hughes and Miller 20 )). The relative levels of the other macronutrients may also have influenced intake. For example, the ‘carbohydrate ceiling effect’, where cats were observed to process ingested carbohydrate up to a certain level (approximately 300 kJ or approximately 20 g of carbohydrate/d( Reference Hewson-Hughes, Hewson-Hughes and Miller 20 )), above which energetic intake was restricted. Furthermore, reduced EI were observed on a HC (47 % CER) diet when offered ad libitum compared with a HP (47 % PER) diet( Reference Farrow, Rand and Morton 32 ). In the current study, no significant difference in EI was observed within each protein range, between the three CER:FER.
Body weight and body composition
It has been reported that when lean cats were fed either a MP (27 % PER) or HP (47 % PER) diet in amounts intended to maintain ideal BW, those consuming the HP diet showed no change in BW but gained lean body mass, whilst those fed the MP diet lost BW without losing lean body mass( Reference Nguyen, Dumon and Siliart 14 ). In contrast to this, BW and body composition were unaltered in cats allowed ad libitum consumption of a HP diet in relation to a MP diet( Reference Green, Ramsey and Villaverde 29 , Reference Wei, Fascetti and Liu 30 ). These reports differ to those of the present study where cats offered the HP diets in excess of requirements significantly increased body weight while those offered the MP diets significantly reduced BW. However, those studies were over an extended time period, likely to vary in diet formulations and palatability and results may not be contradictory.
The hypothesis under test was that when offered excess of a MP diet cats would overconsume energy content to meet a protein target intake and thus gain weight. The data not only do not support this but, unexpectedly, cats consuming MP diets lost weight across the whole study irrespective of the fat:carbohydrate. The rate of weight loss varied, with diet 2 resulting in the largest loss in weight (approximately 10 %, despite no significant effect on body composition).
No significant effect of dietary carbohydrate on BW was observed in diets of the same protein content offered in excess of requirements, albeit that this is also confounded by the change in dietary fat and previous studies indicated that the dietary fat content rather than carbohydrate content is linked to weight gain in cats. Previously( Reference Nguyen, Dumon and Siliart 14 ), sexually intact, young (approximately 8 months) cats fed a high fat (21 % w/w dry matter) dry diet ad libitum were reported to gain more weight than cats fed a low-fat diet (11 % w/w) and this effect was even more pronounced in neutered cats. Since the protein content of the diets was the same, the greatest weight gain was seen in cats fed the diet with the lowest carbohydrate content. In another study( Reference Backus, Cave and Keisler 15 ), young (6–9 months), sexually intact cats were allowed ad libitum access to one of four diets containing either 9, 25, 44 or 64 % FER and weight gain was greatest in those fed the highest fat (and lowest carbohydrate, approximately 3 % CER) diet. In the present study, no differences were seen in BW between HP diets even though diet 4 (HP–LC) contained a relatively high proportion of fat (45 % FER) compared with diets 5 and 6 (30 and 17 % FER, respectively). It may be that between-diet differences in BW would have been observed if the excess feeding phase of the study had been extended beyond 4 weeks. Previously, feeding a 27 % PER diet to lean cats in amounts intended to maintain ideal BW resulted in reduced BW but no loss of lean body mass( Reference Nguyen, Dumon and Siliart 14 ). Data presented here for the 22 % PER diets are similar, though our study was only powered to detect a mean change of 7 % fat mass. Significant effects may have been detected in a longer trial, for example, over 2–6 months.
Palatability
Though palatability is likely to impact EI in the short term we have previously observed that palatants are ineffective at masking macronutrient selection within a few days( Reference Hewson-Hughes, Colyer and Simpson 33 ) and so chose not to attempt to equilibrate initial palatability preferences. However, the initial palatability test did show that diet 4 was preferred to diets 2 and 3 before phase 2 and additionally diets 1 or 6 after 4 weeks of solus consumption. This change in palatability response is not solely a response to the monotonic consumption of a diet as cats fed diet 5 solus did not show this effect. An appealing hypothesis is that after solus feeding on these diets (1 and 6) representing the extremes of fat content, cats were seeking to compensate in a way not necessary for diet 5.
Limitations
To our knowledge the study is the largest reported to date, using 120 cats from three different genetic stocks, all of which were relatively young (1–4 years old), neutered and living in a similar environment where individual feeding had helped maintain a healthy body condition score through their development. The study also attempted to overcome a number of concerns related to diet composition confounders by using the same ingredients to supply a very broad range of MNP (exceeding the range of normal commercial diets). The PER included a MP content lower than previously reported in similar studies and adjusted CER and FER to provide fixed ratios of PER:CER. A consequence of this approach was that the PER:CER pairwise comparisons were not readily interpretable since the FER was not consistent between these diets. We also chose not to use additives to provide diets of equal energy density. It is also possible that ad libitum feeding rather than meal feeding employed here could have yielded greater differences as in the current study cats could not display any diet-induced changes in feeding pattern that may contribute to differences in BW gain. However, such a study design may have added confounders related to individual cat feeding behaviour strategies.
In summary, the protein leverage hypothesis may not be applicable to cats even though they are obligate carnivores and have been shown to regulate their protein intake( Reference Hewson-Hughes, Hewson-Hughes and Miller 20 ). The current study indicates that consumption of MP diets is impacted by palatability but the continued weight loss may indicate other negative physiological consequences. The study also indicated that cats do not immediately regulate intake of HP diets and can gain weight in an offered excess environment, emphasising the importance of portion control. Furthermore, at the levels contained in the diets offered, no significant effect of carbohydrate content was observed on intake at the same protein content, and cats were able to exceed the reported carbohydrate ceiling.
Acknowledgements
The authors would like to thank all colleagues at WALTHAM for their care and expertise in welfare and training of the cats used in this study.
The work was funded by Mars Petcare UK, and the funders had no role in the design, analysis or writing of this article.
D. A., A. H.-H., P. M. and J. A. formulated the research question and designed the study. C. H. d. A. and J. A. carried out the study. D. A., R. S. and J. A. analysed the data. D. A. and J. A. have written the article.
All authors were employed by Mars Petcare UK at the time of the study.
Supplementary material
For supplementary material/s referred to in this article, please visit https://doi.org/10.1017/S000711451800257X


