





1. Introduction
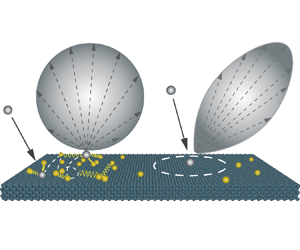
When the condition of local quasi-thermodynamic equilibrium breaks down, dilute fluid flows are no longer governed by the Navier–Stokes equations with stick boundary conditions, and kinetic theory is required. The fluid behaviour must then be described by the Boltzmann equation, or a kinetic model equation, supplemented by boundary conditions that model the gas–surface interactions. These molecular interactions are typically formulated via the so-called scattering kernel (SK), which provides the probability density function of the molecules scattered back into the gas after striking the surface. Typically, SKs contain a few parameters, referred to as accommodation coefficients (ACs), which describe how some physical properties of the impinging molecular flux (e.g. momentum and energy) accommodate to the state of the surface. SKs are of paramount importance in non-equilibrium gas dynamics simulations because they determine the velocity slip and temperature jump at the surface, which are the macroscopic hallmarks of the fluid non-equilibrium conditions, and, in turn, affect the overall flow field increasingly with the gas rarefaction.
The most famous and extensively used SK was proposed by Maxwell (Reference Maxwell1879). The Maxwell model assumes that a fraction of incident gas molecules are diffusely reflected, while others are re-emitted specularly. Despite being widely used, the Maxwell model is unable to reproduce the lobular re-emission patterns that are experimentally observed when a nearly monoenergetic atomic beam hits the surface (Cercignani & Lampis Reference Cercignani and Lampis1971). Much effort has been employed over the years towards developing more accurate SKs that incorporate the gas–surface interactions.
Epstein (Reference Epstein1967) extended the Maxwell model by replacing the constant accommodation coefficient with a function of the molecular velocity to reflect the dependency of the scattering dynamics on the velocity of the incident particle. Furthermore, Klinc & Kuščer (Reference Klinc and Kuščer1972) considered the particular case of diffuse-elastic scattering, where molecules are isotropically back-scattered into the gas but conserve their impinging speed. A more general SK is the Cercignani–Lampis (CL) model (Cercignani & Lampis Reference Cercignani and Lampis1971; Cercignani Reference Cercignani1972) that was derived by solving the half-space transport equation describing the dynamics of gas atoms within the wall modelled as a homogeneous and non-polar medium. It is worth stressing that the CL model was also obtained by using different approaches (Kuščer, Mozina & Krizamič Reference Kuščer, Mozina and Krizamič1971; Williams Reference Williams1971; Cowling Reference Cowling1974; Takata, Akasobe & Hattori Reference Takata, Akasobe and Hattori2021) and was proved to be the most general mathematical expression consistent with the basic properties that all SKs are expected to fulfil (see § 2 for more details of these basic kernel properties).
SKs have also been proposed that linearly combine the models above. Struchtrup (Reference Struchtrup2013) combined the Maxwell model with the diffuse-elastic SK. The resulting model provides results similar to the CL model but has a simpler mathematical expression that makes it easier to derive boundary conditions for extended moment equations. In the Yamamoto–Takeuchi–Hyakutake (YTH) model (Yamamoto, Takeuchi & Hyakutake Reference Yamamoto, Takeuchi and Hyakutake2007), it is assumed that a fraction of scattered molecules follow a CL-like model, while the remaining molecules are diffusely reflected. This model provides scattering patterns in better agreement with molecular dynamics (MD) simulations when the surface is contaminated with a fixed amount of heavy molecules while bombarded with lighter gas. However, the YTH model does not contain links with the contaminant information nor the adsorption physics. It is a phenomenological model where the AC functions are fitted from specific simulations conditions and are thus not general. The combination of Epstein and CL models was also proposed, and it was shown that it more accurately captures the trajectory of molecules in the scattering process (Yakunchikov, Kovalev & Utyuzhnikov Reference Yakunchikov, Kovalev and Utyuzhnikov2012), while providing an accurate description of both the Poiseuille and thermal transpiration flows (Wu & Struchtrup Reference Wu and Struchtrup2017).
Despite the many studies devoted to gas–surface interactions, relatively little attention has been paid to the development of SKs that incorporate adsorption (Kuščer Reference Kuščer1978; Borman, Krylov & Prosyanov Reference Borman, Krylov and Prosyanov1988; Aoki & Giovangigli Reference Aoki and Giovangigli2019; Brancher et al. Reference Brancher, Stefanov, Graur and Frezzotti2020; Aoki & Giovangigli Reference Aoki and Giovangigli2021; Aoki, Giovangigli & Kosuge Reference Aoki, Giovangigli and Kosuge2022). Yet, experimental, theoretical and numerical evidence clearly indicates that neglecting the presence of adsorbed molecules oversimplifies the scattering dynamics and introduces inaccuracies in the resulting prediction of fluid flow. This was first highlighted in a pioneering experimental study, where it was shown that ACs of gases in contact with single-crystal silicon approach unity as pressure increases (Arkilic, Breuer & Schmidt Reference Arkilic, Breuer and Schmidt2001). Thereafter, this has been attributed to adsorption, as ACs have been found to significantly increase if the surface gets adsorbed with gas molecules, reaching unity when a full adsorbed layer is formed (Sazhin, Borisov & Sharipov Reference Sazhin, Borisov and Sharipov2001; Yamamoto, Takeuchi & Hyakutake Reference Yamamoto, Takeuchi and Hyakutake2006; Finger, Kapat & Bhattacharya Reference Finger, Kapat and Bhattacharya2007; Chew Reference Chew2009; Nejad et al. Reference Nejad, Nedea, Frijns and Smeulders2020).
A better understanding of how adsorption affects the scattering dynamics is not only of theoretical interest, but also has relevant practical implications. Examples range from a more accurate prediction of aerodynamic drag forces on satellites operating on very low Earth orbits, where these forces are strongly dependent on the variation of the atomic-oxygen adsorption with altitude (Pilinski et al. Reference Pilinski, Argrow, Palo and Bowman2013; Livadiotti et al. Reference Livadiotti2020), to the enhancement of the manufacturing throughput of microprocessor chips in low vacuum photolithography machines, where adsorption of contaminants is detrimental (Chen Reference Chen2005). More generally, adsorption is expected to significantly affect the transport of nanoscale confined fluid flows (Shan et al. Reference Shan, Wang, Wang, Zhang and Guo2022), such as hydrocarbons inside tight shale reservoirs (Wang et al. Reference Wang, Li, Gibelli, Guo and Borg2021), and the heat transfer efficiency in micro-electro-mechanical systems (MEMS) due to the large surface-area-to-volume ratios characterising these problems (Cao et al. Reference Cao, Sun, Chen and Guo2009).
This paper aims to derive a new SK that captures the effect of adsorption, arising from van der Waals interactions only (also known in the literature as physisorption), on the scattering dynamics, and unravel the resulting density-dependence on the ACs. The proposed kernel is the linear combination of the CL model for a clean, smooth surface and the fully diffusive Maxwell model for a surface covered by a dense gas layer, with the weight of the combination proportional to the Langmuir adsorption isotherm (Langmuir Reference Langmuir1916). The proposed kernel is validated using high-fidelity MD simulations with Lennard–Jones (LJ) potentials that accurately resolve the trajectories of molecules interacting with each other in the adsorbed layer and with the surface.
It is important to emphasise that our study takes a different approach to model the physics of adsorption than most past research. In particular, while we propose an SK to capture the overall effects of adsorption, previous studies have attempted to derive models from first principles. For example, Borman et al. (Reference Borman, Krylov and Prosyanov1988) proposed a kinetic equation to study the dynamics of gas molecules in a potential field generated by surface atoms, with molecule–phonon collisions accounting for fluctuations, and this approach has recently been extended to include adsorption and chemical reactions on crystal surfaces (Aoki & Giovangigli Reference Aoki and Giovangigli2019, Reference Aoki and Giovangigli2021; Aoki et al. Reference Aoki, Giovangigli and Kosuge2022). Despite its ability to precisely capture the intricate physics of adsorption, this kinetic equation-based modelling is computationally demanding and not suitable for engineering simulations. Our modelling approach has similarities with the pioneering work of Kuščer (Reference Kuščer1978) and more recently of Brancher et al. (Reference Brancher, Stefanov, Graur and Frezzotti2020). However, our focus is primarily on the case of a steady adsorbed gas layer adjacent to the walls, whereas these two references mainly explore non-equilibrium adsorption–desorption phenomena. A more in-depth comparative analysis of these studies is presented in § 3.
The remaining structure of this paper is as follows. The definition of SKs is outlined in § 2. The new SK, which encompasses the effect of adsorption, is derived in § 3. The set-up of high-fidelity MD simulations used in this work is presented in § 4. In § 5, an extensive validation study is carried out to evaluate the scattering patterns and the ACs as functions of the gas bulk density. Finally, concluding remarks are given in § 6.
2. Scattering kernels and their accommodation coefficients
The scattering kernel  $\mathcal {R}(\boldsymbol {\xi }' \rightarrow \boldsymbol {\xi }; \boldsymbol {r}, t; \boldsymbol {\epsilon }, \tau )$ gives the probability density that a molecule striking the surface at position $\boldsymbol {r}-\boldsymbol {\epsilon }$ and time $t-\tau$ with a velocity range of $[\boldsymbol {\xi }', \boldsymbol {\xi }' + \text{d}\boldsymbol {\xi }']$, re-emerges away from the surface at position $\boldsymbol {r}$ and time $t$ with a velocity range of $[\boldsymbol {\xi }, \boldsymbol {\xi } + \text{d}\boldsymbol {\xi }]$, where $\boldsymbol {\epsilon }$ is the distance travelled by the molecule in its adsorbed state and $\tau$ is the adsorption time (Cercignani Reference Cercignani1988). The balance of mass at the surface yields:
 \begin{align} \xi_n
\,f(\boldsymbol{\xi}, \boldsymbol{r}, t)
=\int_{-\infty}^{\infty} {\rm d}\boldsymbol{\epsilon}
\int_{0}^{\infty} {\rm d} \tau \int_{\boldsymbol{\xi}_n' <
0} |\xi_n'| \mathcal{R}(\boldsymbol{\xi}' \rightarrow
\boldsymbol{\xi}; \boldsymbol{r}, t; \boldsymbol{\epsilon},
\tau) f(\boldsymbol{\xi}', \boldsymbol{r} -
\boldsymbol{\epsilon}, t -\tau) \,{\rm d}\boldsymbol{\xi}',
\end{align}
\begin{align} \xi_n
\,f(\boldsymbol{\xi}, \boldsymbol{r}, t)
=\int_{-\infty}^{\infty} {\rm d}\boldsymbol{\epsilon}
\int_{0}^{\infty} {\rm d} \tau \int_{\boldsymbol{\xi}_n' <
0} |\xi_n'| \mathcal{R}(\boldsymbol{\xi}' \rightarrow
\boldsymbol{\xi}; \boldsymbol{r}, t; \boldsymbol{\epsilon},
\tau) f(\boldsymbol{\xi}', \boldsymbol{r} -
\boldsymbol{\epsilon}, t -\tau) \,{\rm d}\boldsymbol{\xi}',
\end{align}
where  $f(\boldsymbol {\xi }', \boldsymbol {r} - \boldsymbol {\epsilon }, t - {\tau })$ and $f(\boldsymbol {\xi }, \boldsymbol {r}, t)$ are the incident and reflected velocity distribution functions, respectively, and the subscript $n$ denotes the normal velocity component along the unit vector normal to the surface pointing into the gas. If the gas–surface interactions are dominated by physical van der Waals forces only, the adsorption time interval $\tau$ and the re-emission displacement $\boldsymbol {\epsilon }$ are typically much smaller than the characteristic time and length scales of the interactions between fluid molecules, and the SK simplifies to $\mathcal {R}(\boldsymbol {\xi }' \rightarrow \boldsymbol {\xi })$. This condition is particularly valid for steady flow problems and is met in many situations of practical importance, including the scattering from porous organic kerogen surfaces (Chen et al. Reference Chen, Li, Datta, Docherty, Gibelli and Borg2022).
SKs must satisfy the basic properties of:
(i) positiveness,
(2.2) \begin{equation} \mathcal{R}(\boldsymbol{\xi}' \rightarrow \boldsymbol{\xi}) \geq 0; \end{equation}
(ii) normalisation,
(2.3)if the surface is impermeable and permanent adsorption is excluded; and\begin{equation} \int_{\xi_n > 0} \mathcal{R}(\boldsymbol{\xi}' \rightarrow \boldsymbol{\xi}) \,{\rm d}\boldsymbol{\xi} = 1, \end{equation}(iii) reciprocity,
(2.4)where\begin{equation} |\xi_n'| \,f_0(\boldsymbol{\xi}') \mathcal{R(\boldsymbol{\xi}' \rightarrow \boldsymbol{\xi})} = |\xi_n| \,f_0(\boldsymbol{\xi}) \mathcal{R}(-\boldsymbol{\xi} \rightarrow -\boldsymbol{\xi}'), \end{equation}$f_0(\boldsymbol {\xi })$ is the non-drifting Maxwellian distribution having the temperature of the wall. The reciprocity indicates that microscopic scattering dynamics is time-reversible and the surface is assumed to be in a local equilibrium state, undisturbed by the impinging molecules (Kuščer Reference Kuščer1971; Cercignani Reference Cercignani1988). Specifically, the number of molecules scattered from a velocity range $[\boldsymbol {\xi }', \boldsymbol {\xi }' + {\rm d}\boldsymbol {\xi }']$ to a velocity range $[\boldsymbol {\xi }, \boldsymbol {\xi }+{\rm d}\boldsymbol {\xi }]$ (per unit area and unit time) is equal to the number of molecules scattered from any velocity within $[-\boldsymbol {\xi }, -\boldsymbol {\xi } - {\rm d}\boldsymbol {\xi }]$ to a velocity within $[-\boldsymbol {\xi }', - \boldsymbol {\xi }' - {\rm d} \boldsymbol {\xi }']$.


Cercignani (Reference Cercignani1988) proved that the simplest mathematical expression consistent with these properties takes the general form:
 \begin{equation} \mathcal{R}_{{G}}(\boldsymbol{\xi}' \rightarrow \boldsymbol{\xi}) = \mathcal{R}_{{G}, t} (\boldsymbol{\xi}'_t \rightarrow \boldsymbol{\xi}_t) \mathcal{R}_{{G}, n} (\xi'_n \rightarrow \xi_n), \end{equation}
where
 $$\begin{gather} \mathcal{R}_{{G}, t} (\boldsymbol{\xi}'_t \rightarrow \boldsymbol{\xi}_t) =\frac{(1-q^{2})^{{-}1}}{2 {\rm \pi}R T_{0}} \exp \left\{ -\frac{1}{1-q^{2}} \frac{ ( \boldsymbol{\xi}_{t} -q \boldsymbol{\xi}_{t}^{\prime} )^2}{2 R T_{0}} \right\},\quad q\in[{-}1,1], \end{gather}$$
 $$\begin{gather}\mathcal{R}_{{G}, n} (\xi'_n \rightarrow \xi_n) =\frac{(1 - p)^{{-}1} \xi_n}{R T_0} \exp \left\{-\frac{\xi_n^2 + p\xi_{n}'^2}{2 R T_0 (1 - p)} \right\} I_0 \left( \frac{\sqrt{p}}{1- p} \frac{\xi_n \xi_{n}'}{R T_0} \right), \quad p\in[0,1], \end{gather}$$
where  $\boldsymbol {\xi }_t$ is the two dimensional vector lying on the surface with velocity components $\xi _{t_1}$ and $\xi _{t_2}$ (for an isotropic surface, the scattering dynamics of $\xi _{t_1}$ and $\xi _{t_2}$ are equivalent), $R$ is the specific gas constant, $T_0$ is the wall temperature, and $I_0$ is the modified Bessel function of the first kind and zeroth order.
The parameters  $p$ and $q$ can be related to the so-called ACs that possess a more transparent physical meaning. These give the tendency of the gas property associated with a specified molecular velocity function $\varphi (\boldsymbol {\xi })$ to accommodate to the state of the wall. The general ACs are typically defined as (Kuščer Reference Kuščer1974; Cercignani Reference Cercignani1988; Sharipov Reference Sharipov2002)
 \begin{equation} \alpha(\varphi)=\frac{\displaystyle\int_{{\xi}_n' <0} \varphi(\boldsymbol{\xi}') |{\xi}_n'| \,f(\boldsymbol{\xi}') \,{\rm d} \boldsymbol{\xi}' -\int_{{\xi}_n >0} \varphi(\boldsymbol{\xi})|{\xi}_n| \,f(\boldsymbol{\xi}) \,{\rm d} \boldsymbol{\xi}}{\displaystyle\int_{{\xi}_n'<0} \varphi(\boldsymbol{\xi}') |{\xi}_n'| \,f(\boldsymbol{\xi}') \,{\rm d} \boldsymbol{\xi}'-\int_{{\xi}_n>0} \varphi(\boldsymbol{\xi})|{\xi}_n|\, f_{0}(\boldsymbol{\xi}) \,{\rm d} \boldsymbol{\xi}}, \end{equation}
where  $f_0(\boldsymbol {\xi })$ is the wall Maxwellian velocity distribution function. As an example, by setting $\varphi (\boldsymbol {\xi })=\boldsymbol {\xi }_t,\, \xi _n^2/2,\, \boldsymbol {\xi }^2/2$, the accommodation coefficients for the tangential momentum (TMAC, $\alpha _t$), normal kinetic energy (NEAC, $\alpha _{E_n}$) and kinetic energy (EAC, $\alpha _E$) are obtained. Note that beam ACs $\alpha ^{b}(\varphi )$ are also used that correspond to the cases of monoenergetic impinging beams (Kuščer Reference Kuščer1974), i.e. $f(\boldsymbol {\xi }')=n_b \delta (\boldsymbol {\xi }'- \boldsymbol {\xi }_b)$ with $n_b$ being the density of the beam and $\boldsymbol {\xi }_{b}$ a fixed velocity.
It is worth stressing that the definition of the accommodation coefficients, (2.6), has two shortcomings. First, for an SK in the form of (2.5), only TMAC and NEAC are independent of the impinging velocity distribution (Cercignani Reference Cercignani1988). Second, when the system is close to the equilibrium state, i.e.  $f(\boldsymbol {\xi }') \approx f(\boldsymbol {\xi }) \approx f_0(\boldsymbol {\xi })$, both numerator and denominator in (2.6) approach zero and numerical inaccuracies arise, which require specific procedures to cope with these instances (Kuščer Reference Kuščer1974; Cercignani Reference Cercignani1988; Spijker et al. Reference Spijker, Markvoort, Nedea and Hilbers2010).
All the existing SKs can readily be obtained by the general form of (2.5) (or by linearly combining expressions of this form) along with ACs, e.g.
 $$\begin{gather} \text{Maxwell model:} \quad q_1 = 0, \ q_2 = 1, \quad p_1 = 0, \ p_2 = 1, \end{gather}$$
 $$\begin{gather}\text{Cercignani-Lampis model:} \quad q = 1 - \alpha_t, \quad p = 1 - \alpha_{E_n}, \end{gather}$$
 $$\begin{gather}\text{YTH model:}\quad q_1 = 0, \ q_2 = (1 - \alpha_t^b)^{1/2}, \quad p_1 = 0, \ p_2 \approx 1 - \alpha_{E_n}^{b}. \end{gather}$$
3. A new scattering dynamics model: incorporating adsorption
We present a new scattering model that incorporates the effect of gas adsorption on smooth surfaces. Note the SK model we propose here is applicable to standard temperatures or higher, so that quantum effects (Goodman & Wachman Reference Goodman and Wachman1976b; Bird Reference Bird1994b) do not play a role and the classical scattering description is applicable. For simplicity, the effect of wall roughness is omitted from this work.
Molecules impinging on smooth solid surfaces may be divided into two groups. The first group comprises adsorbed molecules, namely molecules that are momentarily trapped and suffer multiple collisions with the surface and/or other fluid molecules before moving away, and as a result, are more likely to accommodate thermally with the surface (Kuščer Reference Kuščer1978; Rettner, Schweizer & Mullins Reference Rettner, Schweizer and Mullins1989; Bird Reference Bird1994a; Butt, Graf & Kappl Reference Butt, Graf and Kappl2003; Arya, Chang & Maginn Reference Arya, Chang and Maginn2003; Myong Reference Myong2004; Cao, Chen & Guo Reference Cao, Chen and Guo2005). The second group is composed of molecules that, after hitting the clean part of the surface (i.e. where no adsorption occurs locally), are immediately reflected back to the bulk of the gas, and their behaviour is only expected to depend on the local microscopic features of the surface. The scattering dynamics of these two groups are very different, as depicted in the schematic of figure 1(a), and the rate of these contributions depends on the bulk density. In the limit of high gas bulk density, the first scattering group dominates, while the second scattering group is seen more in the limit of low gas bulk density.
(a) Schematic of scattering dynamics of gas molecules near a smooth surface. During the scattering process, incident gas molecules (grey) could either suffer single or multiple collisions (both with the wall and other momentarily adsorbed gas molecules). (b) Example density profiles in the presence of argon (Ar) molecules near the platinum (Pt) surface at an equilibrium temperature of 300 K, with distinguishable features of bulk and elevated adsorption densities.

Our SK is therefore a linear combination of these two limiting scattering contributions, namely the fully diffuse Maxwell model,  ${\mathcal {R}}_{d}$, which properly captures the effect of multiple collisions suffered with adsorbed molecules (often seen in the limit of high density), and the CL model, ${\mathcal {R}}_{CL}$, which is deemed to provide the most accurate description of the interactions of molecules with a clean, smooth surface (often seen in the limit of low density):
 $$\begin{gather} {\mathcal{R}}_{new, t} = \theta_1 (\eta_b) {\mathcal{R}}_{d, t} + [1 - \theta_1(\eta_b)] {\mathcal{R}}_{CL, t} (\alpha_{t, 0}), \end{gather}$$
 $$\begin{gather}{\mathcal{R}}_{new, n} = \theta_2 (\eta_b) {\mathcal{R}}_{d, n} + [1 - \theta_2(\eta_b)] {\mathcal{R}}_{CL, n} (\alpha_{E_n, 0}), \end{gather}$$
where  $\alpha _{t, 0}$ and $\alpha _{E_n,0}$ are the TMAC and NEAC of a smooth surface being free of adsorption, and are called the intrinsic coefficients. In principle, these coefficients can be obtained either from beam experiments performed in low vacuum systems (Goodman & Wachman Reference Goodman and Wachman1976a) or by using approximate theoretical models (Goodman Reference Goodman1974). It is worth stressing that from the derivation of the CL model, the details of a collision between a gas molecule and a solid atom (i.e. hard collisions) are assumed to be negligible compared with the effect of simultaneously grazing collisions (Cercignani Reference Cercignani1988). Therefore, the accuracy of the CL model may decrease when a corrugation effect exists from the crystal structure, as would be the case in the MD simulations, which may contain a subtle corrugation in the gas–surface potential energy landscape.
In (3.1), the function  $\theta _1$ represents the probability that a molecule striking the surface behaves as an adsorbed molecule in the tangential component, and it is anticipated to be an increasing function of the reduced bulk number density $\eta _b = n_{bulk} {\rm \pi}\sigma _{\textit {gas-gas}}^3/6$, where $n_{bulk}$ is the bulk number density, $\sigma _{\textit {gas-gas}}$ is the diameter of a gas molecule; the function $\theta _2$ has a similar meaning, although for the normal component, but must be treated separately because the tangential component is known to exhibit a faster accommodation rate to the state of the surface than the normal one (Cercignani Reference Cercignani1988; Chen et al. Reference Chen, Li, Datta, Docherty, Gibelli and Borg2022).
The function  $\theta _1$ can be naturally related to the gas/surface coverage, defined as the ratio between the occupied sites and the maximum binding sites available on the surface. Indeed, a denser adsorbed gas layer (i.e. a higher peak density $\eta _a$ shown in figure 1b) next to the surface results in a higher probability that the gas molecule accommodates to the state of the surface. The surface coverage can be predicted based on the classical Langmuir adsorption isotherm (Langmuir Reference Langmuir1916) when a monolayer adsorption forms adjacent to the surface (see figure 1b for example density profiles). As for the function $\theta _2$, the simplest direct proportionality relation is presumed also to exist with the surface coverage. Accordingly, in dimensionless units, the combination coefficients read:
 \begin{equation} \theta_1 = \frac{\hat{K}_L \eta_b}{1 + \hat{K}_L \eta_b}, \quad \theta_2 = C \frac{\hat{K}_L \eta_b}{1 + \hat{K}_L \eta_b}, \end{equation}
where  $C \in [0, 1]$ is a fitting constant and $\hat {K}_L$ is the Langmuir constant. It is worth stressing that the Langmuir adsorption isotherm has already been used by Goodman (Reference Goodman1974) and Pilinski et al. (Reference Pilinski, Argrow, Palo and Bowman2013) for assessing the effect of adsorption on the energy and thermal accommodation coefficients, and it is chosen here for its simplicity. However, in principle, more sophisticated isotherm models can also be used, such as the Freundlich model (Freundlich Reference Freundlich1922) for heterogeneous surfaces and the Brunauer–Emmett–Teller (BET) model for multilayer adsorption (Brunauer, Emmett & Teller Reference Brunauer, Emmett and Teller1938).
Note that, according to (3.1), the TMAC and NEAC of the new SK read:
 $$\begin{gather} \alpha_t = \theta_1 + (1 - \theta_1) \alpha_{t, 0}, \end{gather}$$
 $$\begin{gather}\alpha_{E_n} = \theta_2 + (1 - \theta_2) \alpha_{E_n, 0}. \end{gather}$$
As expected, the ACs recover their intrinsic values for clean, smooth surfaces, i.e.  $\alpha _{t}\rightarrow \alpha _{t, 0}$, $\alpha _{E_{n}}\rightarrow \alpha _{E_{n}, 0}$ in the limit when $\theta _1$ and $\theta _2$ go to zero.
It is worth noting that Brancher et al. (Reference Brancher, Stefanov, Graur and Frezzotti2020) have proposed an SK with many similarities to ours, namely a linear combination of Maxwell fully diffuse and CL (or Maxwell with incomplete accommodation). Unlike our model, which focuses solely on the effect of an adsorbed gas layer in dynamic equilibrium, this model can explain the time variation of the adsorbed surface coverage, which simplifies to the Langmuir isotherm when the adsorption and desorption rates are in balance. However, the assumptions on the scattering dynamics underlying this model differ from our model, as can be clearly seen by considering the two limiting cases of clean and fully adsorbed surfaces. In particular, in the case of clean surfaces, our SK simplifies to CL, while that of Brancher et al. (Reference Brancher, Stefanov, Graur and Frezzotti2020) remains a linear combination of Maxwell fully diffuse and CL, where the coefficient of the combination is the adsorption probability. In the case of fully adsorbed surfaces, our SK simplifies to Maxwell fully diffuse, while that of Brancher et al. (Reference Brancher, Stefanov, Graur and Frezzotti2020) simplifies to the CL model. As discussed in detail in the next section, our different modelling choices allow us to obtain scattering patterns in overall good agreement with those predicted by MD.
4. Modelling the scattering using molecular dynamics
In this work, the scattering dynamics of gas molecules is simulated by the MD method using the LAMMPS software (Plimpton Reference Plimpton1995). By numerically integrating Newton's equations of motion, MD is able to deterministically resolve the trajectories of gas molecules interacting with the surface atoms.
In our simulations, surface atoms are constructed in a face-centred cubic (FCC) arrangement with a lattice parameter of 3.92 Å, as shown in figure 1(a), and gas molecules are modelled as monatomic for simplicity. It is worth stressing that very heavy gas molecules with high intermolecular attraction, such as xenon, shall not be considered, as they could ‘permanently’ stick to the surface, which violates the assumption of negligible residence time. To extend the validation of scattering models from moderately heavy to light gas molecules and keep the gas–surface interaction unreactive, two distinct groups of gas–surface combinations have been considered: argon–platinum (Ar-Pt) and helium–gold (He-Au), respectively. Each combination has been investigated under various reduced bulk gas densities  $\eta _b$, thereby permitting one to consider adsorption of different degrees. The velocity-Verlet algorithm is implemented for the trajectory integration with a time step of 1 fs, and interactions among atoms are described by the standard 12-6 Lennard-Jones (LJ) potential:
 \begin{equation} U_{LJ}(r) = 4 \epsilon \left[ \left( \frac{\sigma}{r} \right)^{12} - \left( \frac{\sigma}{r} \right)^{6} \right], \end{equation}
where  $r$ is the distance between pairs of atoms, $\epsilon$ is the interatomic potential well depth and $\sigma$ is the distance where the potential is zero. The interactions parameters for Ar-Pt and He-Au, which are obtained from Spijker et al. (Reference Spijker, Markvoort, Nedea and Hilbers2010) and Liao et al. (Reference Liao, Grenier, To, de Lara-Castells and Leonard2018), respectively, are listed in table 1 with an LJ cutoff distance $r = r_c = 15$ Å.
Interatomic Lennard-Jones potential parameters ( $\sigma, \epsilon$) used in the MD simulations. Molecular masses $m$ [u]: ${\rm Ar}=39.948$; ${\rm He}=4.0026$; ${\rm Pt}=195.084$; ${\rm Au}=196.967$.

Each MD simulation run is divided into two steps: equilibration and production. During equilibration, both gas molecules and wall atoms are kept at a constant temperature, using the Nosé–Hoover thermostat, with a time constant of 100 fs in the NVT ensemble. Here, two temperatures are considered: 300 K, for typical room temperature of MEMS devices, and 423 K, which we considered in an earlier scattering study (Chen et al. Reference Chen, Li, Datta, Docherty, Gibelli and Borg2022) and is used here as a test of an elevated temperature condition on our scattering model. Each parallel wall has an outer edge of rigid wall molecules, which prevents any movement of the wall. Following equilibration, the thermostat on the gas molecules is switched off such that their scattering dynamics are not biased. The production run provides access to all Lagrangian information from which the scattering data of interest can be calculated. Our scattering results are recorded by placing an artificial virtual plane at a distance  $r_c$ away from and parallel to the surface, within which a gas molecule and a wall atom can still feel each other. When a molecule from the bulk crosses the virtual plane, its incident information (e.g. $\boldsymbol {\xi }', \boldsymbol {r} - \boldsymbol {\epsilon }, t - {\tau }$) is recorded. The reflected information of the same molecule will be recorded again (e.g. $\boldsymbol {\xi }, \boldsymbol {r}, t$) when it crosses the plane back into the bulk, as illustrated in figure 2(a) (inset). Furthermore, the collisions of gas molecules within the near-wall region can be tracked. To accurately describe the scattering behaviour and construct the scattering function $\mathcal {R(\boldsymbol {\xi }' \rightarrow \boldsymbol {\xi })}$, collisions $O(10^{6})$ are generally required, which leads to $O(10^{-9})$ seconds of a production run, depending on the dimension and density of the system. Further details of the technique for measuring molecule scattering information can be found from Chen et al. (Reference Chen, Li, Datta, Docherty, Gibelli and Borg2022).
Scattering process of argon molecules on a platinum surface at 423 K. (a) Probability histogram of the number of collisions, with the inset indicating the tracking of the scattering process. (b) TMAC vs number of collisions. (c) NEAC vs number of collisions. (d) Qualitative schematics of odd vs even collisions. Contributions to (e) TMAC and ( f) NEAC of molecules suffering two, for TMAC, and up to four, for NEAC, collisions (green colour) and multiple collisions (black colour) as functions of the reduced bulk density. Solid symbols are MD results and solid lines are the predictions of our calibrated SK, (3.3).

5. Results and validation
In this section, we first assess the accuracy of the assumptions underpinning our model (§ 5.1). Afterwards, we calibrate the parameters of the proposed SK to best fit the MD results for TMAC and NEAC in the range of gas bulk densities explored in this work (§ 5.2). Finally, we show that the proposed SK well describes the interplay between momentum and energy accommodation coefficients (§ 5.3.1), and more accurately predicts the scattering patterns of monoenergetic beams (§ 5.3.2) provided by the MD simulations for different gas bulk densities and gas–surface systems.
5.1. Assessment of model assumptions
Our proposed SK relies on three key modelling assumptions. First, a higher density of adsorbed gas layer results in a higher fraction of molecules suffering multiple collisions (assumption 1). Second, molecules suffering multiple collisions are more likely to accommodate to the state of the surface, where the rate of accommodation of the normal component is slower than the tangential one (assumption 2). Third, the fraction of molecules that are completely accommodated to the state of the surface can be identified with the surface coverage as given by the Langmuir isotherm (assumption 3). In the following, these assumptions will be assessed for the Ar-Pt system at a temperature of 423 K. However, similar qualitative trends were found for all systems carried out in this work, which are not reported here for brevity.
Assumptions 1 and 2 are examined in figure 2(a), which shows the probability histogram of the individual gas collisions that occur between the virtual plane and the wall; a collision occurs when a molecule's velocity component changes sign, which captures both gas–gas and gas–surface collisions. It is apparent that when the surface is clean ( $\eta _a = \eta _b = 0$), a gas molecule has the highest probability of colliding only once, whereas the probability of multiple collisions increases with the density of the gas layer, as indicated by the larger tail of the histogram for larger $\eta _b$. Furthermore, figure 2(b,c) support assumption 2 by showing that molecules accommodate more strongly to the state of the surface if they collide multiple times (i.e. the ACs approach unity with higher number of collisions, where here the ACs refer to beams composed of molecules grouped based on the number of collisions they suffered), and the accommodation rate is faster for TMAC than for NEAC. It is worth noticing that TMAC shows a zig-zag-like behaviour. From a qualitative standpoint, we can explain this phenomenon using the illustration in figure 2(d) of some sample collisions: the number of changes in the tangential velocity component, denoted by $N_t$, occur more frequently on even collisions (e.g. $N = 2,4,\ldots$) and this increases the rate of accommodation, leading to the higher TMACs observed in figure 2(b). The same argument explains why the behaviour of the NEAC is instead almost monotonic.
Assumption 3 is examined in figure 2(e, f). Molecules were first grouped in two categories depending on whether they collided twice (solid green symbols) or more than twice (solid black symbols) with the surface, and the TMAC of each group is computed as a function of the reduced bulk density. As shown in figure 2(e), the TMACs of the two groups follow trends that qualitatively match those of the solid lines that represent the two contributions featuring in the proposed SK, i.e.  $\theta _1$ and $(1-\theta _1) \alpha _{t,0}$, respectively (these contributions were computed using the model calibrated as discussed in § 5.2). In figure 2( f), a similar comparison is presented for NEAC. However, the criterion used here to define the two groups is slightly different; namely, a higher collision threshold was considered (four collisions instead of two) to account for the expected lower accommodation rate of the normal velocity component compared with the tangential one. A good qualitative agreement is seen in this case as well.
5.2. Model calibration
The proposed SK features two groups of parameters, namely  $(\alpha _{t,0},\alpha _{E_n,0})$, which describe the re-emission dynamics from a clean, smooth surface, and $(\hat {K}_L,C)$, which account for the effects of the adsorbed gas layer. The first group of parameters was evaluated by computing TMAC and NEAC based on MD simulations in which gas–gas interactions are switched off. Afterwards, the second group of parameters were calibrated by fitting (3.3), alongside (3.2), to the values of TMAC and NEAC corresponding to different reduced bulk densities provided by MD simulations, which include gas–gas interactions. Here, the two groups of parameters, obtained from our considered systems, are listed in table 2 for reference. The AC results measured from the MD are shown in figure 3 for the sample cases of Ar-Pt and He-Au systems at two different temperatures (solid symbols), along with the fitting curves (solid lines). An excellent agreement is found except for the larger values of the reduced bulk density, e.g. at $T = 300$ K, deviations are less than 4 % for the Ar-Pt system, and reduce to 2 % for the He-Au system. These deviations can be explained by the inability of the Langmuir isotherm to capture the interactions between adsorbed gas molecules that arise when a high-density gas layer covers the surface. However, by including the effect of repulsive lateral interactions on the adsorption and desorption rates (Butt et al. Reference Butt, Graf and Kappl2003), we verified that all MD data can be fitted within an accuracy of $3\,\%$.
Variation of the general accommodation coefficients with bulk densities  $\eta _b$ given by MD results for the Ar-Pt system at (a) 300 K and (b) 423 K; the He-Au system at (c) 300 K and (d) 423 K.

Reference values for the intrinsic accommodation coefficients ( $\alpha _{t, 0}, \alpha _{E_n, 0}$) and the calibrated constants ( $\hat {K}_L, C$).

Two remarks are worth making about the results reported in figure 3. First, the slope of NEAC is smaller than that of TMAC regardless of the temperature and gas–solid combination. This clearly highlights the slower accommodation of the energy to the state of the surface and, therefore, the need to introduce the constant  $C$ in (3.2). Second, the general ACs take smaller values as the temperature increases for the Ar-Pt system, while the opposite has been observed for the He-Au system.
5.3. Assessment of model predictivity
5.3.1. Correlation between accommodation coefficients
The fundamental aspects of gas–surface interactions are fully encompassed in the SK, but ACs are also useful in that they provide some coarse-grained information about the dynamics of molecules impinging on the surface. As the SKs represented by (2.5) only contain one disposable parameter in the tangential component and another one in the normal component, relations must exist between ACs of quantities defined along the same directions. The relations between TMACs and tangential kinetic energy accommodation coefficients (TEACs) of the SKs considered in this study are listed in table 3, whereas those between normal momentum accommodation coefficients (NMACs) and NEACs were determined numerically because the presence of the Bessel function prevents one to easily obtain results in closed form. Note that the relations between TMACs and TEACs do not depend on the impingement distribution, but this is not the case for the relations between NMACs and NEACs. The results presented in this section refer to a Maxwellian impingement that typically occurs when considering low-speed gas flows.
Relation between the TMAC ( $\alpha _t$) and the TEAC ( $\alpha _{Et}$) for various SKs.

Figure 4 shows the relations between TMAC and TEAC (panel a) and between NMAC and NEAC (panel b) provided by MD simulations for various reduced densities (solid symbols), along with the predictions of the SKs (solid lines). It is apparent that the proposed SK provides the best match with MD results in the range of explored reduced densities. The predictions of the Maxwell model are in poor agreement with MD results, especially for the smaller values of  $\eta _b$. The CL model agrees reasonably well with our MD results in this limit, whereas large discrepancies of the CL model can be clearly seen in figure 4(a) when the surface adsorption increases. The YTH model shows an agreement at intermediate densities. Note, here we carry out the same phenomenological fit for the YTH model with our MD simulations, using the general accommodation coefficients.
Relation between momentum and energy accommodation coefficients for the He-Au system at 423 K, given by our MD results and predicted by various SKs. (a) TEAC vs TMAC; (b) NMAC vs NEAC. Density of data points correspond to those in figure 3(d).

5.3.2. Scattering patterns
A more accurate assessment of the SKs is here carried out by comparing the scattering patterns of monoenergetic beams provided by each model against MD simulation results. In these numerical experiments, a monoenergetic beam is obtained by selecting only those molecules bombarding the surface which have their tangential (normal) component of velocity in the range  $[\xi ', \xi ' + \varDelta \xi ']$, and re-emission probabilities of the velocity components are evaluated accordingly.
Figure 5(a,b) shows the reflected velocity distributions of argon molecules scattered from a platinum surface at 423 K. An example value of the reduced bulk density is presented here, i.e.  $\eta _b = 0.0011$, to highlight the different predictions of the SKs, since in the limiting cases of small and large reduced densities, similar behaviours are anticipated (e.g. in the limit when $\eta _b$ goes to zero, our SK simplifies to the CL model). As expected, the re-emission patterns are centred around the line of specular reflection with large tails at small velocities.
Re-emission probability distributions of the (a) tangential and (b) normal velocity for monoenergetic beams predicted by MD for the Ar-Pt system with a surface temperature of 423 K and  $\eta _b = 0.0011$. Velocities of the beams are normalised by the most probable speed $\sqrt {2 R T}$. (c,d) MD results compared against predictions of the SKs for an example of high impinging velocity of $\xi _{t_1}' = 1.9$ and $\xi _{n}' = 1.9$.

Figure 5(c,d) shows the comparison between the scattering patterns of a monoenergetic beam predicted by the different SKs, under a high incident velocity  $(\xi _{t_1}' = 1.9,\ \xi _{n}' = 1.9)$, which is chosen specifically to reveal high deviations from Maxwell's model. It is apparent that the tail of the re-emission pattern in the tangential direction is very well captured by our SK, while deviations can be clearly seen from the predictions of CL and YTH models. As for the normal direction, all the SKs provide satisfactory fits to MD data showing that the adsorbate does not affect significantly the scattering dynamics in this direction.
Figure 6 shows results similar to those in figure 5, but for the He-Au system. Compared with the case of argon molecules scattered by a platinum surface, the smaller degree of accommodation to the state of the surface makes the tangential distributions narrower near the specular-reflected velocity and the tails of the normal distributions thinner. In figure 6(c), a small discrepancy is found between the proposed model and the MD result. This is not unexpected since the fine details of the real scattering patterns depend on many additional features such as residence time, sticking probability and desorption rate, to name a few. Nevertheless, it should be emphasised that, despite its simplicity, the proposed model gives an overall good agreement with the scattering patterns, as shown in figure 6(c,d), confirming its applicability even for gas–surface interactions with intrinsically small momentum and energy accommodations (see table 2).
Re-emission probability distributions of the (a) tangential and (b) normal velocity for monoenergetic beams predicted by MD for the He-Au system with a surface temperature of 423 K and  $\eta _b=0.0051$. Velocities of the beams are normalised by the most probable speed $\sqrt {2 R T}$. (c,d) MD results compared against predictions of the SKs for an example case of a high impinging velocity of $\xi _{t_1}' = 1.9$ and $\xi _{n}' = 1.9$.

A more quantitative comparison of the scattering patterns of monoenergetic beams was performed by computing the  $L^2$-norm errors assuming the MD results as baseline for comparison:
 $$\begin{gather} \epsilon_{t_1}(\xi'_{t_1},\eta_b) = \| \mathcal{R}_{SK}(\xi_{t_1}' \rightarrow \xi_{t_1}; \eta_b) - \mathcal{R}_{MD}(\xi'_{t_1} \rightarrow \xi_{t_1}; \eta_b) \|_2, \end{gather}$$
 $$\begin{gather}\epsilon_n(\xi'_{n},\eta_b) = \| \mathcal{R}_{SK}(\xi'_{n} \rightarrow \xi_{n}; \eta_b) - \mathcal{R}_{MD}(\xi'_{n} \rightarrow \xi_{n};\eta_b) \|_2, \end{gather}$$
where
 \begin{equation} \|g\|_2=\left[ \int_{-\infty}^{\infty} g^2 \,{\rm d}\xi \right]^{1/2}. \end{equation}
 Figure 7 shows the  $L^2$-norm of the errors of CL, YTH and our SK for the Ar-Pt system at 423 K with $\eta _b = 0.0011$ and impinging velocities in the range of $[0, 2]$. Note that the results related to the normal component near the most probable speed have been removed as the mathematical definition of ACs is very sensitive to numerical errors in that region (see § 2). Interestingly, for small velocities, the errors related to the tangential component are almost constant, whereas those related to the normal component are large. This is likely to be attributed to the attractive force field exerted by the surface that is accounted for by none of the SKs. Nevertheless, the proposed SK outperforms others in accuracy for both tangential and normal scattering patterns.
Beam  $L^2$-norm errors between the reflected velocity distributions of monoenergetic beams predicted by existing SKs and MD results vs the impinging molecule velocity. The results refer to the Ar-Pt system at the surface temperature of 423 K and $\eta _b = 0.0011$ in the (a) tangential and (b) normal directions.

To check the accuracy of all SKs over a larger span of reduced densities, the error given by (5.1) was integrated with respect to the impinging velocity using the Maxwellian flux as a weight, and the results were normalised using the error of the Maxwell fully diffuse model:
 \begin{align} & \epsilon_{t_1} (\eta_b) = \frac{\displaystyle\int \epsilon_{t_1} (\xi'_{t_1},\eta_b) \, f_0 (\xi_{t_1}') \,{\rm d}\xi_{t_1}'}{\displaystyle\int\|\mathcal{R}_{d}(\xi_{t_1}) - \mathcal{R}_{MD}({\xi_{t_1}' \rightarrow \xi_{t_1}})\|_2 \ f_0 (\xi_{t_1}') \,{\rm d}\xi_{t_1}'}, \end{align}
 \begin{align} & \epsilon_{n} (\eta_b) = \frac{\displaystyle\int_{\xi_n' < 0} \epsilon_n(\xi'_n,\eta_b) \, f_0 (\xi_{n}') |\xi_n'| \,{\rm d}\xi_{n}'}{\displaystyle\int_{\xi_n' < 0}\|\mathcal{R}_{d}({\xi_n}) - \mathcal{R}_{MD}({\xi_n' \rightarrow \xi_n})\|_2 \, f_0 (\xi_n') |\xi_n'| \,{\rm d}\xi_n'}. \end{align}
 The error given by (5.2) is computed for the range of reduced densities considered in this study, and the results are reported in figure 8(a,b) for the tangential and normal directions, respectively. The proposed SK turns out to be the most accurate. In particular, it shows a similar accuracy as the CL model for clean, smooth surfaces (small  $\eta _b$), whereas it is closer to the YTH model as the degree of adsorption increases (large $\eta _b$). Note that, as already pointed out, the adsorbate has a comparatively minor impact on the normal component of the scattering patterns and this is clearly reflected by the smaller discrepancies between scattering models shown in figure 8(b). Finally, the proposed model is expected to have better overall accuracy over existing SKs when considering the He-Au system, where the intrinsic ACs are smaller (and the impact of adsorption is found to be more significant) compared with the Ar-Pt system.
General  $L^2$-norm errors, obtained by integrating the corresponding beam errors and using the Maxwellian flux as weighted factor, vs the reduced density. The results refer to the Ar-Pt system at the surface temperature of 423 K in the (a) tangential and (b) normal directions.

6. Concluding remarks
Existing scattering kernels (SKs) assume that gas molecules impinging on a surface only interact with wall atoms, whereas this assumption is inaccurate when an adsorbed layer forms next to a surface. In such a condition, gas–gas interactions affect the molecular scattering process, as clearly shown by the dependence of the accommodation coefficients (ACs) on the gas bulk density. To address this limitation, we have proposed an SK as a simple linear combination of the Cercignani–Lampis (CL) and Maxwell fully diffuse models, using the Langmuir isotherm as a weighting factor. The rationale behind our modelling approach is that the CL term accurately describes the scattering process from a clean, smooth surface, whereas the Maxwell fully diffuse term is expected to capture also the effect of multiple gas–gas interactions when an adsorbed gas layer forms next to the surface. The accuracy of various SKs were assessed using high-fidelity molecular dynamics (MD) simulations, and it was shown that the proposed SK gives the best performance across the range of explored bulk densities.
Future work will consider the implementation of the proposed scattering model in kinetic solvers and to test its performance in heat and flow simulations where adsorption is present. The possible extension of the proposed model to polyatomic molecules is also of interest. Although there are expressions of the Maxwell fully diffuse and CL models for this case (Lord Reference Lord1991, Reference Lord1995; Dadzie & Méolans Reference Dadzie and Méolans2004; Gorji & Jenny Reference Gorji and Jenny2014) and encouraging results in the literature suggesting that a linear combination may work (Yamamoto et al. Reference Yamamoto, Takeuchi and Hyakutake2007; Wu & Struchtrup Reference Wu and Struchtrup2017), a more detailed study using MD is needed to determine whether the coupling between internal and translational energy modes adds complexity and thereby require a more sophisticated modelling approach.
Funding
This research was funded in whole, or in part, by King Fahd University of Petroleum and Minerals (KFUPM), Saudi Arabia. M.K.B. and L.G. are funded by the Engineering and Physical Sciences Research Council (EPSRC) under grant numbers EP/V012002/1, EP/R007438/1. For the purpose of open access, the author has applied a CC BY public copyright licence to any Author Accepted Manuscript version arising from this submission.
Declaration of interests
The authors report no conflict of interest.
Data availability
The LAMMPS and post processing source codes that support the findings of this study are openly available in the Edinburgh DataShare repository at http://doi.org/10.7488/ds/7473.


 Open access

