


Introduction
The existence of plastic traits, whereby one genotype can produce multiple phenotypes depending on external cues (e.g., temperature-dependent sex ratios in reptiles [Sarre et al. Reference Sarre, Georges and Quinn2004], nutrition-determined caste assignment in female honeybees [Slater et al. Reference Slater, Yocum and Bowsher2020]), is ubiquitous. Development of a phenotype best suited to the prevailing environment increases an individual's chances of survival and enables individuals within a population to adapt rapidly to changing environmental conditions within a generation, rather than having to wait for the spread of favorable mutations (West-Eberhard Reference West-Eberhard2003). Especially when faced with regular change and/or extreme events, plastic traits in individuals can increase chances of population survival (Baldwin Reference Baldwin1896; Simpson Reference Simpson1953; Richter-Boix et al. Reference Richter-Boix, Llorente and Montori2006; Chevin and Lande Reference Chevin and Lande2009). Plastic traits potentially also enhance species survival over longer timescales. However, the effects of developmental plasticity on macroevolutionary processes and the emergence of new species have long been ignored (West-Eberhard Reference West-Eberhard2003, Reference West-Eberhard2008; Pfennig et al. Reference Pfennig, Wund, Snell-Rood, Cruickshank, Schlichting and Moczek2010; Pfennig Reference Pfennig and Pfennig2021), largely due to a lack of fossil records with the necessary fine-scale environmental resolution to identify what plasticity uses as a cue.
West-Eberhard (Reference West-Eberhard2003) argued that plastic traits can influence both phenotype and genotype frequency in a population through a process called genetic assimilation. A new environmental cue will cause a plastic trait to be expressed in a novel way, and if this new phenotype has a positive effect on fitness, it will likely be selected for, increasing the frequency of both the phenotypic and genetic components (West-Eberhard Reference West-Eberhard2003, Reference West-Eberhard2005). Plasticity is typically studied through single genotypes, either by examining among-individual variation within families or clones or by taking repeated measurements on the same individual exposed to different environments. The second of these routes is amenable to study in the fossil record (Lister Reference Lister and Pfennig2021) and our focus here. Modeling studies suggest that moderate plasticity, with plastic traits that are reasonably well, but not perfectly, adjusted are most likely to drive evolutionary innovation: suboptimal adaptation provides the opportunity to move to a new space on the adaptive landscape and can encourage the evolution of better-adapted traits (DeWitt et al. Reference DeWitt, Sih and Wilson1998; Price et al. Reference Price, Qvarnstrom and Irwin2003; Ghalambor et al. Reference Ghalambor, Hoke, Ruell, Fischer, Reznick and Hughes2015; Murren et al. Reference Murren, Auld, Callahan, Ghalambor, Handelsman, Heskel, Kingsolver, Maclean, Masel, Maughan, Pfennig, Relyea, Seiter, Snell-Rood, Steiner and Schlichting2015). Many studies have since recognized the potential evolutionary implications of developmental plasticity (e.g., Pigliucci et al. Reference Pigliucci, Murren and Schlichting2006; Pfennig et al. Reference Pfennig, Wund, Snell-Rood, Cruickshank, Schlichting and Moczek2010; Beldade et al. Reference Beldade, Mateus and Keller2011; Moczek et al. Reference Moczek, Sultan, Foster, Ledon-Rettig, Dworkin, Nijhout, Abouheif and Pfennig2011) and increasingly recognize it as a central aspect of evolution, rather than an occasional “add-on” (Laland et al. Reference Laland, Uller, Feldman, Sterelny, Muller, Moczek, Jablonka and Odling-Smee2015; Moczek Reference Moczek2015). As a result, several authors have proposed expanding the modern synthesis, which merged Darwinian natural selection and Mendelian inheritance and therefore focuses mainly on mutation-driven change, into an extended evolutionary synthesis (e.g., Pigliucci Reference Pigliucci2007; Pigliucci and Müller Reference Pigliucci, Müller, Pigliucci and Müller2010; Laland et al. Reference Laland, Uller, Feldman, Sterelny, Muller, Moczek, Jablonka and Odling-Smee2015). However, the need for an extended synthesis is still a topic of lively debate (e.g., Dickins and Rahman Reference Dickins and Rahman2012; Futuyma Reference Futuyma2017; Lu and Bourrat Reference Lu and Bourrat2018). Opponents argue that no conceptual change is necessary to incorporate developmental processes into the existing synthesis (Futuyma Reference Futuyma2017; Lu and Bourrat Reference Lu and Bourrat2018), as the structure and content of the extended synthesis are still incomplete (Fábregas-Tejeda and Vergara-Silva Reference Fábregas-Tejeda and Vergara-Silva2018; Buskell Reference Buskell2019). In the case of evolutionary developmental biology, this is largely due to a lack of empirical data (Levis and Pfennig Reference Levis and Pfennig2016, Reference Levis and Pfennig2020; Futuyma Reference Futuyma2017). To decide if, and if so, how much, the modern synthesis needs to be adjusted with regard to developmental plasticity, we must first know the frequency with which long-term plasticity-led evolution occurs in nature (Kovaka Reference Kovaka2019).
Most studies investigating the effects of developmental plasticity on evolution focus on extant populations. Laboratory studies on live individuals can determine the full range of responses to external cues as well as provide insights in the effects of plasticity over several generations (e.g., Waddington Reference Waddington1953). Field studies of wild populations provide evidence of genetic accommodation and adaptation by comparing reaction norms in closely related species (Schlichting and Wund Reference Schlichting and Wund2014), and many such studies have found signs of plasticity-led evolution. Work on spadefoot toads, for example, has shown that a novel diet released cryptic variation that resembled the derived feeding mechanism of its descendant (Ledon-Rettig et al. Reference Ledon-Rettig, Pfennig and Crespi2010), suggesting that developmental plasticity helped the descendant species adapt to a new diet.
However, there are several major drawbacks to studying the drivers of evolution using only extant populations. More than 99% of all species that ever lived are now extinct (Stearns and Stearns Reference Stearns and Stearns1999). Modern species provide no direct information on past evolutionary transitions, and therefore excluding extinct species will make it impossible to assess the frequency of plasticity-led evolution in the past and its relative importance in the winners and losers of historical ecological interactions (Quental and Marshall Reference Quental and Marshall2010). Fossils contain information on both macroevolutionary transitions and microevolutionary change, allowing morphological evolution to be quantified through time and across plausible ancestor–descendant pairs rather than an ancestor-proxy of the descendant's closest living relative (Love et al. Reference Love, Grabowski, Houle, Liow, Porto, Tsuboi, Voje and Hunt2021). The lack of contemporaneous environmental and morphological data in ancestral forms makes it harder to find direct evidence for plasticity-led evolution (Kovaka Reference Kovaka2019). In systems that ally strong phylogenetic understanding with high stratigraphic and environmental resolution, evolutionary change can be studied through speciation intervals and postspeciation divergence (Lazarus Reference Lazarus, McGowan and Smith2011; Pearson and Ezard Reference Pearson and Ezard2014).
Analyzing variation in somatic development of single genetic individuals is a particularly promising avenue for research into plasticity in the fossil record (Lister Reference Lister and Pfennig2021). Growth rates can be reconstructed from fossils when ontogeny is preserved in the skeleton, such as from lines of arrested growth in amphibians and reptiles. Several studies have indeed found evidence for plasticity in growth rates in dinosaurs (Sander and Klein Reference Sander and Klein2005) and extinct amphibians (Sanchez et al. Reference Sanchez, de Ricqlès, Schoch and Steyer2010; Gee et al. Reference Gee, Haridy and Reisz2020). However, patterns in highly variable traits can only be detected with large sample sizes (Gee et al. Reference Gee, Haridy and Reisz2020), which are rare in the vertebrate fossil record. As the fossil record contains no genetic information, and it is impossible to determine clonal reaction norms of extinct species by laboratory studies, the effects of environmentally dependent variation in somatic growth are still not well understood in deep time (e.g., Moss et al. Reference Moss, Ivany, Judd, Cummings, Bearden, Kim, Artruc and Driscoll2016).
Ideally, we would bring the past and present together by using techniques that span the two communities. The combination of somatic growth, senescent declines, reproductive windows, and trade-offs between survival and fertility adds fundamental biodemographic aspects critical to ecological dynamics. Here, we leverage one such approach with these capabilities—an integral projection model (Easterling et al. Reference Easterling, Ellner and Dixon2000)—to investigate the potential for such models to provide insight given the alternative temporal dimensions of paleobiological data. By embedding somatic growth and development centrally within the model assumptions (not all individuals are equally likely to reproduce nor to survive at each developmental stage [Caswell Reference Caswell2001]), we can better match an inferred historical population with an age profile closer to living populations rather than relying on the biased assemblage preserved in the sediment. Our conclusions chart a path to identify the most biodemographically relevant life-history traits to measure when investigating evolutionary ecology in deep time.
The Model
Integral projection models (IPMs) are drawn from population ecology to describe the dynamics of populations whose demography is regulated by a continuous trait, such as size, that grows in discrete intervals (Easterling et al. Reference Easterling, Ellner and Dixon2000; Ellner et al. Reference Ellner, Childs and Rees2016). The continuous trait impacts demographic probabilities of survival and reproduction. For example, larger individuals might have a different risk of mortality than smaller ones or might reproduce more successfully than smaller individuals, all else being equal. The outputs from the model track an individual's journey through life. The use of such structured population models therefore has the fundamental advantage over unstructured models, in that individuals do not need to be assumed as equally influential in determining population dynamics.
The fundamental building block of an IPM is the kernel (eq. 1). The kernel is a function that aggregates the chances of survival, growth, and reproduction of individuals into an efficient mathematical expression to project the population dynamics into the future. Different kernels can take on simpler or more complex forms depending on the intended demographic model; Rees et al. (Reference Rees, Childs and Ellner2014) provide step-by-step general instructions for implementing IPMs and further descriptions of adaptions for particular life-history scenarios. Since the introduction of IPMs, increasingly complex demographic scenarios have been envisaged and represented by increasingly complex birth and death models (Ellner and Rees Reference Ellner and Rees2006). We adapt one of the more straightforward scenarios from Ellner and Rees (Reference Ellner and Rees2006) to study the relative importance of births, deaths, and development on the evolution of the focal life history.
The kernel is used to project the population forward in time—the population at a point in time can be described by the sum of the demographic contributions from all individuals alive at the preceding time step:
 $$n( {z_{t + 1}, \;\;t + 1} ) = \mathop \int \limits_U^L K( {z_{t + 1}, \;\;z_t} ) n( {z_t, \;t} ) \;dz$$
Here n is a vector that describes the population given a continuous structuring trait z t (here: size) at time t. U and L represent minimum and maximum size, respectively. K is the kernel representing all possible transitions from size z t to size z t + 1, which can be more fully written as K(z t, z t + 1) = P(z t, z t + 1) + F(z t, z t + 1), where P represents survival and F represents fertility. Both P and F can be further split into constituent components: P is size-dependent survival from time t to t + 1 and contemporaneous progression (here: growth) from size z t to z t + 1; F represents the probability of reproducing as a function of z and potentially the number of offspring. K(z t, z t + 1) therefore is built from the key building blocks that track an individual's journey through a life cycle characteristic of the species.
Having established an integrable IPM, we then use eigendecomposition to probe the structure of K(z t, z t + 1) and distill key features of the population dynamics and life-history evolution (Ellner et al. Reference Ellner, Childs and Rees2016). By analyzing the IPM kernel, we can quantify the relative importance of the different demographic processes and their impact on mean population fitness. We do this in two principal ways. First, we use the right and left eigenvectors associated with the dominant eigenvalue to study, respectively, the population structure and reproductive value of each size class. By decomposing K into these two eigenvectors, we establish a simpler representation of the essential behavior of the system to estimate the proportion of individuals in each size class (the population structure) and the mean fecundity of the individuals that survived to each stage (the reproductive value). Both of these quantities are deeply relevant to project the population dynamics and the selective effects on individuals at different life stages (Taylor Reference Taylor1990) but are challenging to study in the fossil record. Second, we use elasticity analysis. Elasticities quantify the relative influence of each demographic rate on a demographic parameter of interest (Caswell Reference Caswell2007), in this case the projected population growth (λ 1), and thus mean population fitness, at equilibrium in a deterministic environment. A parameter with a higher elasticity is more influential in determining λ 1. Given the link between population growth and mean population fitness, elasticities are proportional to selection gradients. Elasticities are comparable relative to one another within a particular IPM, such that a rate with twice the elasticity is twice as important in determining population growth and assumed to be proportional to a selection pressure that is twice as strong. Elasticities of lower-level parameters can also be summed to get the overall influence of mortality, fertility, and somatic growth on the evolution of the life history. Taken together, these outputs of K(z t, z t + 1) thus provide insight into the population ecology and evolutionary pressures experienced by extinct organisms during their lives.
An IPM for Trilobatus sacculifer
Here we implement an IPM to the planktonic foraminifer Trilobatus sacculifer Brady, Reference Brady1877 (Spezzaferri et al. Reference Spezzaferri, Kucera, Pearson, Wade, Rappo, Poole, Morard and Stalder2015). Planktonic foraminifera have a life history that is ideally suited to representation as an IPM: they grow in discrete stages (chambers; see Fig. 1 and Caromel et al. [Reference Caromel, Schmidt, Fletcher and Rayfield2016]) deposited rapidly every two to three days and die after reproduction (Hemleben et al. Reference Hemleben, Spindler and Anderson1989). After death, shells settle on the seafloor, where their entire ontogeny is preserved in the sediment, resulting in a rich fossil record that reaches back to the Jurassic (Kendall et al. Reference Kendall, Gradstein, Jones, Lord and Schmidt2020). Plankton net and sediment trap studies allow linking of the developmental history and environmental records (Bijma et al. Reference Bijma, Erez and Hemleben1990; Bijma and Hemleben Reference Bijma and Hemleben1994; Mikis et al. Reference Mikis, Hendry, Pike, Schmidt, Edgar, Peck, Peeters, Leng, Meredith, Todd, Stammerjohn and Ducklow2019).
Trilobatus sacculifer internal structure. Every colored chamber represents a single step in the ontogeny.

We take survivorship and probability of reproduction data from laboratory culture experiments by Bijma and Hemleben (Reference Bijma and Hemleben1994) and the growth from one stage to the next from Schmidt et al.'s (Reference Schmidt, Rayfield, Cocking and Marone2013) X-ray computed tomography reconstruction of the developmental history. The chance of survival per size class from Bijma and Hemleben (Reference Bijma and Hemleben1994) is converted to chance of survival per ontogenetic step (i.e., addition of a chamber) by taking the n th root of survival per size class, with n being the number of ontogenetic steps per size class (Schmidt et al. Reference Schmidt, Rayfield, Cocking and Marone2013). Using the empirical size, survivorship, and probability reproduction data, we determine the remaining parameters of demographic equations (eqs. 2–4) commonly used in population ecology (e.g., Ellner and Guckenheimer Reference Ellner and Guckenheimer2006; Ellner and Rees Reference Ellner and Rees2006). We parameterize the smooth expressions describing the demographic rates of survival, reproduction, and growth as a function of size using nonlinear least-squares regression in the R environment for statistical and graphical computing (v. 4.0.2; R Core Team 2020). Our fully annotated and executable R script, from data entry through nls fitting and IPM implementation (based on an appendix to Ellner and Rees [Reference Ellner and Rees2006]), is in Supplementary Code 1.
The model for survivorship takes the form:
 $$s_1x + s_2e^{s_3x}$$
The model for the probability of reproduction takes a logistic form:
 $${{\,f_1} \over {( {1 + e^{\,f_2( {x\;-\;f_3} ) }} ) }}$$
The model for somatic growth from one stage (chamber) to the next is described by a mean change (eq. 4a) and the standard deviation around it (eq. 4b):
 $$\mu _x = g_1x$$
 $${\rm \sigma }_x = g_2e^{2g_3\mu _x}$$
Here x represents size, and μx and σx represent the mean and standard deviation of the size change from one stage to the next. All other parameters are obtained through nonlinear least-squares regression. Table 1 provides the numeric values obtained through nls() and verbal explanations for the interpretation of each parameter. Through equations (2–4), we can parameterize all demographic rates necessary for K(z t, z t + 1), except for the rate of recruitment to the breeding population, which, following previous practice, we set to ensure that the long-term growth rate of the population in a deterministic environment was 1.01 (Rees and Rose Reference Rees and Rose2002). Figure 2 shows the statistical fits to the raw data from Bijma and Hemleben (Reference Bijma and Hemleben1994) and Schmidt et al. (Reference Schmidt, Rayfield, Cocking and Marone2013) based on the parameters listed in Table 1. This approach allows us to study the composition of the projected population as it would have existed, but is not necessarily preserved in deep time, and the relative contribution of each size class to the next generation.
Survival (A), probability of reproduction (B), and size at stage t + 1 (C) data and model results from statistical fits to the relationships that feed into the integral projection model kernel. See Table 1 for coefficients.

Values fit to parameters stated in the vital rate expressions (eqs. 2–4) with descriptions of their interpretation.

Results
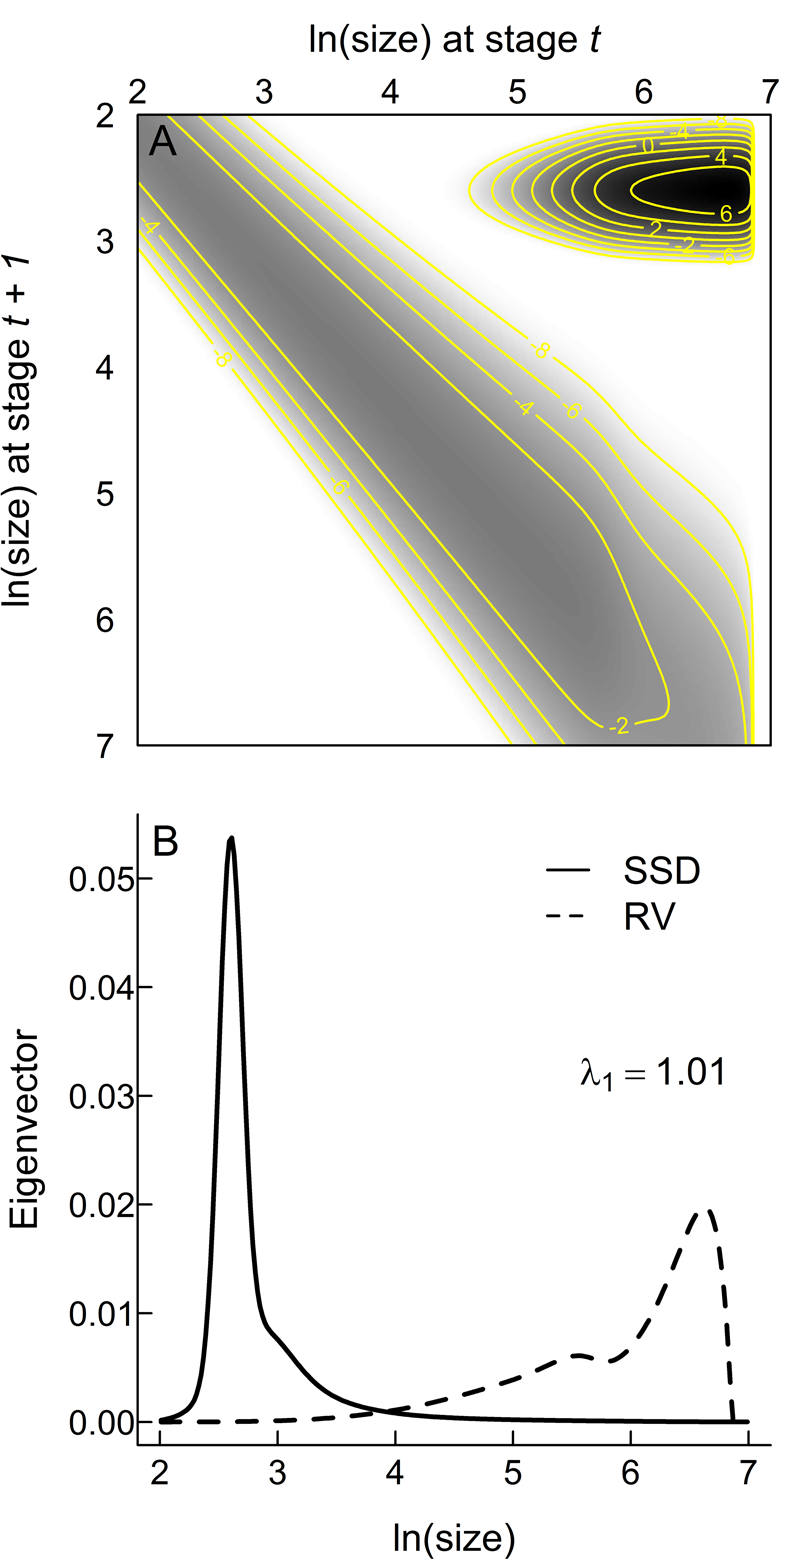
The assumed functional forms (eqs. 2–4) provide acceptable fits to the empirical data (Fig. 2), increasing confidence that an IPM based on these inferred relationships captures the core aspects of the life history of Trilobatus sacculifer. K(z t, z t + 1) and its constituent eigenvectors (Fig. 3) make a number of key life-history predictions. Most planktonic foraminifera within a single generation will be the youngest individuals (note the darkest colors in the IPM kernel are in the top right corner, which represents the transition from adults back to the earliest, one-chambered stage of life [proloculus] through successful reproduction [Fig. 3A] and the peak in the stable stage distribution that gives the relative numbers of individuals per generation at each size [Fig. 3B]). However, the largest rates of mortality are also from those youngest individuals at the beginning of the main developmental track (note the darkest colors in the IPM kernel in the top right, but how the main developmental track from top left to bottom right is a lighter gray; Fig. 3A). The most important individuals for the persistence of the population are the small numbers that reach reproductive maturity (note the reproductive value projection in Fig. 3B), which are those that have the best chance of preservation in the sediment.
Matrix visualization of the integral projection model kernel (A) and the right and left eigenvectors corresponding to the stable stage distribution (SSD) and reproductive value (RV), respectively (B). White areas in A are not accessed by the projected life cycle; grays and blacks indicate the proportions (on an ln scale) of individuals across the life cycle in each stage. The main developmental track is the gray band from top left to bottom right as individuals grow through successive discrete stages. The almost-black peak in the top right corner represents fertility—the transition from the largest stages (at one end of life) to the smallest stages in the next generation. Isolines represent values of the kernel K.
Somatic growth rate, g 1, is the major influence on λ 1 (Fig. 4). Summing across the lower-level parameters used in each of the four main demographic rates suggests that somatic growth rate is almost twice as important as survival, eight times more important than whether the individual probably reproduced, and three-and-a-half times more important than recruitment to the breeding population in determining the population ecology. This implies that selection should target somatic growth, because it is the major determinant of mean fitness in these plankton as well as other exponentially growing and size-regulated organisms well described by this semelparous life history. Therefore, the major signal we need to extract to best understand this population ecology is, reassuringly, something accessible to paleobiological study, as it is preserved in a diversity of organisms and sedimentary settings.
Elasticity represents the influence of each parameter on the long-term population growth rate in a deterministic environment λ 1. The three bars within each color indicate lower-level parameters in the order of Table 1 as used to define the aggregated demographic rates.
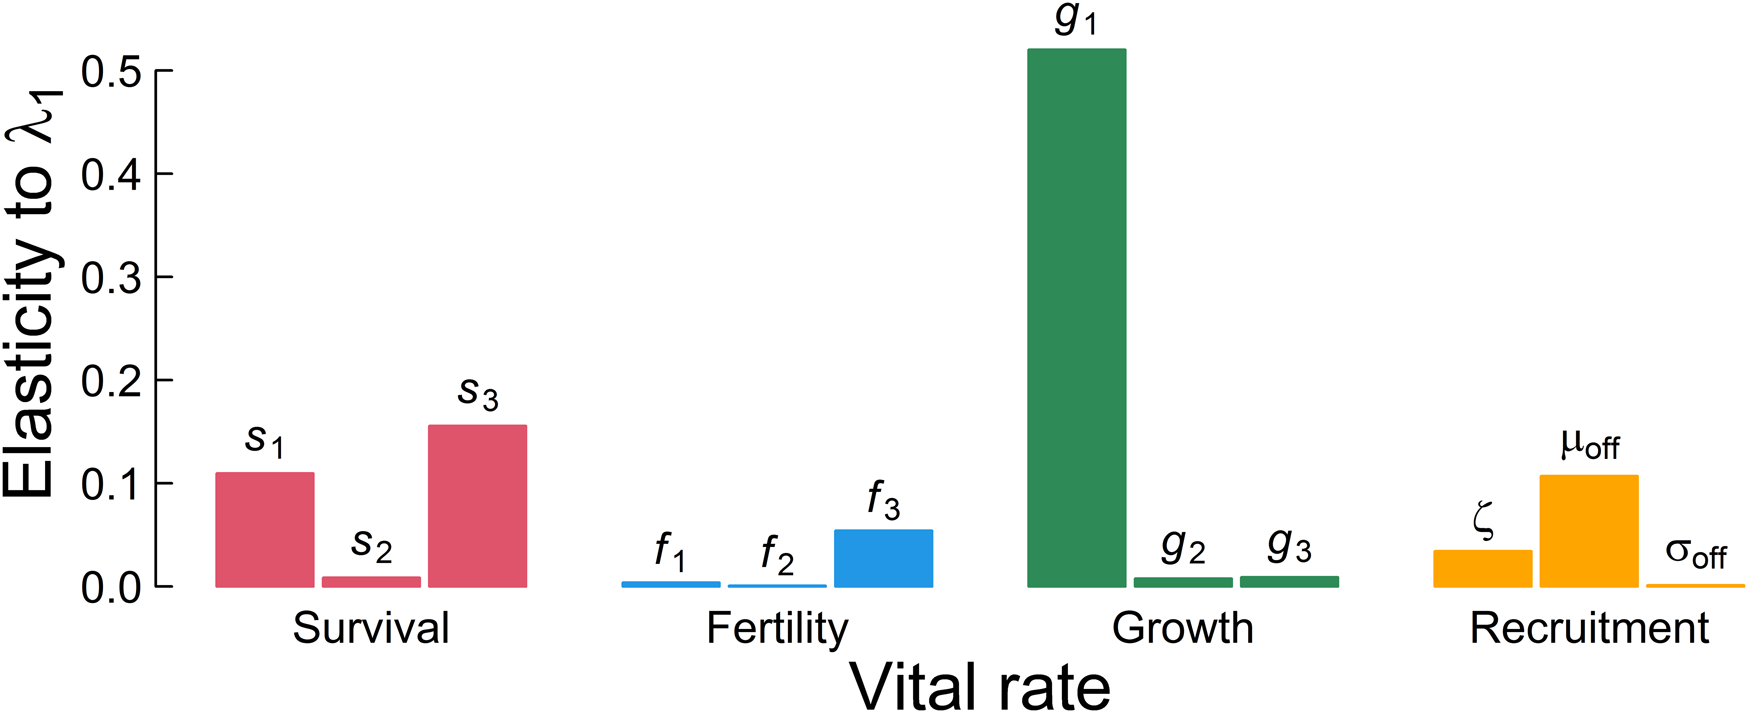
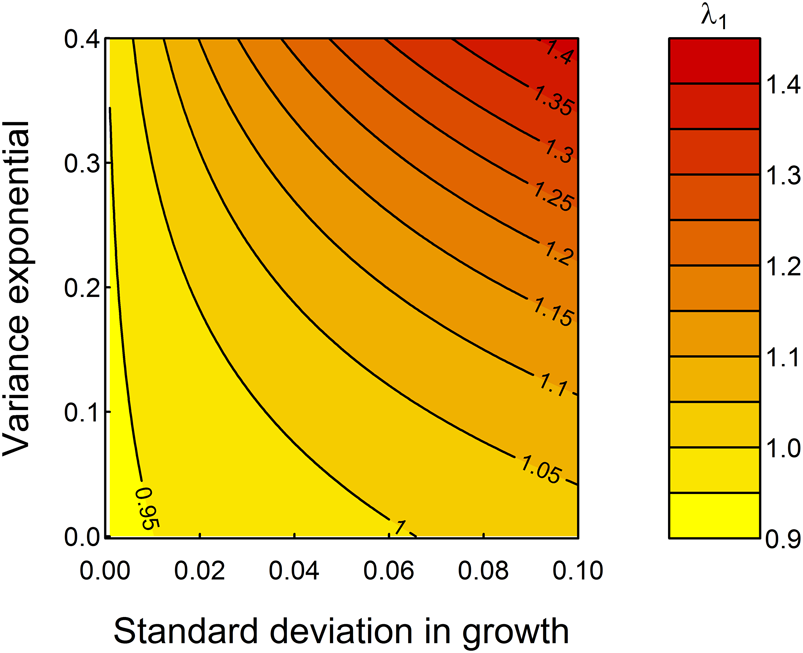
Figure 5 demonstrates the “what if” power of these models—the mean growth rate assumed is well described statistically (Fig. 2) but does not fully enable comprehensive studies of variation during an individual's growth. By looping across a range of possible parameter values for the standard deviation in somatic growth increments, g 2, and the expansion of variation among specimens in later life stages, g 3, as exemplified by the “saclike” final chamber of T. sacculifer compared with its ancestor species Trilobatus trilobus, we observe that increasing both parameters would increase λ1 (Fig. 5). Specifically, fitness is highest at highest growth rate variation among, as well as within, specimens. The relationship between g 2 and g 3 is not consistent: when g 2 is small, small increases in g 2 rapidly increase λ1, but the change to population mean fitness is more evenly balanced between g 2 and g 3 when these parameters are larger, and thus developmental plasticity is greater. Figure 5 predicts that, all else being equal, selection should seek to increase developmental plasticity (fitness is highest in the top right corner of Fig. 5). This, and the importance of growth on fitness imply that plasticity in growth is an ecologically meaningful metric of developmental plasticity that can be studied in deep time.
Increasing the extent of developmental plasticity by increasing g 2, the standard deviation in growth, and g 3, the variance exponential, would be adaptive in the sense of increasing λ1. The black contours represent different projections for λ1 holding ζ as listed in Table 1.
Discussion
Studies of growth rate variation through time can provide new information on the effects of developmental plasticity on long-term evolutionary change. While the fossil record holds an enviable record of temporal change at the largest scales, sufficiently quantifying fine-scale variation within an individual's journey through life or among individuals within populations is typically far less accessible given taphonomic challenges. Our IPM predicts that a focus on individual (somatic) growth for organisms with a semelparous lifestyle can yield biologically relevant traits expected to be under the strongest selection pressure (Fig. 4). The model helps to determine the paleoecological population context (Fig. 5) that is deeply relevant yet often absent in deep time, even for the most well-studied and charismatic species (e.g., Marshall et al. Reference Marshall, Latorre, Wilson, Frank, Magoulick, Zimmt and Poust2021).
Outputs from models such as the IPM we present can shape new directions in inferring relevant ecological and evolutionary processes in deep time. Planktonic foraminifera are ideally suited in this regard due to their abundant preservation in seafloor sediments (e.g., Hemleben et al. Reference Hemleben, Spindler and Anderson1989; Fraass et al. Reference Fraass, Kelly and Peters2015; Fenton et al. Reference Fenton, Woodhouse, Aze, Lazarus, Renaudie, Dunhill, Young and Saupe2021), the existence of a species-level phylogeny for all Cenozoic macroperforate planktonic foraminifera (Aze et al. Reference Aze, Ezard, Purvis, Coxall, Stewart, Wade and Pearson2011), and the capacity to extract tied morphological and environmental signals from the same specimens (Kearns et al. Reference Kearns, Bohaty, Edgar, Nogué and Ezard2021). Predictions based on this group have broader utility due to the generality of logarithmic spires in nature (McGhee Reference McGhee2007) and the common preservation of ontogenetic information via morphology in organisms as diverse as bivalves (Moss et al. Reference Moss, Ivany, Judd, Cummings, Bearden, Kim, Artruc and Driscoll2016), trilobites (Whittington Reference Whittington1957), fish (Trueman et al. Reference Trueman, Chung and Shores2016), trees (Falcon-Lang Reference Falcon-Lang2015), and dinosaurs (Sander and Klein Reference Sander and Klein2005; Sanchez et al. Reference Sanchez, de Ricqlès, Schoch and Steyer2010).
Isolating developmental or phenotypic plasticity in the fossil record is challenging, as it is typically unclear whether an observed morphological pattern arose through plasticity or genetic mutation. Strong evidence for trait plasticity is provided when a single genetic individual or clonal system shows changes in trait expression throughout its life (Lister Reference Lister and Pfennig2021). Under stable environmental conditions, expression of life-history traits with the highest influence on population growth were traditionally expected to be resistant to environmental change (Hilde et al. Reference Hilde, Gamelon, Sæther, Gaillard, Yoccoz and Pélabon2020; but see McDonald et al. Reference McDonald, Franco, Townley, Ezard, Jelbert and Hodgson2017). In our IPM, evolution should promote developmental plasticity, because higher levels of variation in growth increments increase mean population fitness (Fig. 5). More generally, selection can favor phenotypic plasticity when a nonlinear positive relationship between the vital rate and environment leads to increased population growth (Koons et al. Reference Koons, Pavard, Baudisch and Metcalf2009). That we do not see unfettered increases in plasticity is due, in part, to morphological constraints limiting evolutionary divergence (Goswami et al. Reference Goswami, Smaers, Soligo and Polly2014). Devoting more energy to measuring trait (co)variability among further morphological traits promises to be instructive in tracking expected evolutionary changes (Renaud et al. Reference Renaud, Auffray and Michaux2006; Hunt Reference Hunt2007; Puttick et al. Reference Puttick, Thomas and Benton2014; Haber Reference Haber2016), particularly the viability of certain trait combinations (Raup Reference Raup1967). Mutation-driven change is predicted to alter the mean trait expression without a simultaneous change in variation among individuals. As soon as the environment changes and different traits are expressed plastically, variation among individuals increases and there is more raw material for rapid diversification (Masel Reference Masel2005; Suzuki and Nijhout Reference Suzuki and Nijhout2006; Moczek Reference Moczek2008; Ledon-Rettig et al. Reference Ledon-Rettig, Pfennig and Crespi2010; Küttner et al. Reference Küttner, Parsons, Easton, Skulason, Danzmann and Ferguson2014; Zheng et al. Reference Zheng, Payne and Wagner2019; Vanadzina and Schmidt Reference Vanadzina and Schmidt2021).
Given a sufficiently highly resolved temporal fossil sequence, initial stasis followed by increased variation during environmental instability can be strong evidence of evolution driven by developmental plasticity (Jackson Reference Jackson2020). A handful of studies has previously focused on variation in the fossil record as evidence of developmental plasticity, but none provided data of change in this plasticity through time. For example, Anton and Kuzawa (Reference Anton and Kuzawa2017) show differences in body size variation in Homo erectus populations migrating to subtropical and temperate areas, while Schoch (Reference Schoch2014) interpreted high variation among populations from different environmental settings as a fossil reaction norm, but both studies dealt with individual snapshot populations, so variation could not be studied through time. We do not see unfettered increases in developmental plasticity in Trilobatus sacculifer under different laboratory conditions, nor departures from logarithmic spires (Bé Reference Bé1980; Bé et al. Reference Bé, Caron and Anderson1981). This implies a strong morphological constraint on plasticity in this species that regulates growth and thus maintains one-step deviations in growth rates in the yellow areas of Figure 5. When these constraints are relaxed, plasticity is expected to increase. Changing variation through time is stronger evidence for plasticity-led evolution than variation within a single population (Jackson Reference Jackson2020) and could be coupled with data on single genetic individuals or clonal systems (Lister Reference Lister and Pfennig2021) as well as environmental context. Focusing on groups with enviable stratigraphic records (Lazarus Reference Lazarus1994, Reference Lazarus, McGowan and Smith2011) is one promising route to studying greater population context on temporally replicated samples.
Levis and Pfennig (Reference Levis and Pfennig2016) propose that a release of cryptic genetic variation following environmental change is an indicator of plasticity-led evolution in extant populations. The challenge is in contextualizing developmentally sensitive variation into variance within individuals, among individuals, and among populations. Levis and Pfennig (Reference Levis and Pfennig2016) described four criteria to provide evidence of plasticity-led evolution in extant populations: (1) an environmentally induced target trait, (2) release of cryptic variation in a derived environment, (3) change in regulation and/or form in the target trait following environmental change, and (4) adaptive refinement of the target trait in the derived lineage. Jackson (Reference Jackson2020) described how criterion 2 could be observed in a very-high-resolution fossil record, but extracting criterion 4 will, even in the presence of a proxy for every individual's microenvironment, rely on model-based inference via statistical tracking of intraspecific variability alongside an independent metric of environmental change. The most promising systems to examine would be a population adapting to a new environmental optimum (Hunt et al. Reference Hunt, Bell and Travis2008) as an indication of an altered adaptive landscape (Simpson Reference Simpson1953; Arnold et al. Reference Arnold, Pfrender and Jones2001).
Genes can, given sufficient time, combine in many ways to form the same trait (Pfennig et al. Reference Pfennig, Wund, Snell-Rood, Cruickshank, Schlichting and Moczek2010; Moczek et al. Reference Moczek, Sultan, Foster, Ledon-Rettig, Dworkin, Nijhout, Abouheif and Pfennig2011). Following a release of cryptic variation, further evidence that plasticity successfully led to innovation and speciation can be found through ancestor–descendant comparisons that implement the approaches outlined earlier. A change in form of the target trait in the derived lineage compared with the ancestor would suggest genetic accommodation (Levis and Pfennig Reference Levis and Pfennig2016). Traits showing subsequent adaptive refinement in the descendant lineage are a particularly strong indicator of successful plasticity-led evolution (Levis and Pfennig Reference Levis and Pfennig2016). Direct inference of ecologically informative trait evolution in a phylogenetic context is available in highly resolved systems where environmental data can also be resolved on a sub-individual basis (Sadekov et al. Reference Sadekov, Eggins, De Deckker, Ninnemann, Kuhnt and Bassinot2009). Under divergent selection, it is more important to understand the contemporaneous environmental context than always to seek to isolate a particular genetic mechanism (Schluter Reference Schluter2000; Nosil Reference Nosil2012). This context can be observed in the fossil record of, for example, foraminifera (Aze et al. Reference Aze, Ezard, Purvis, Coxall, Stewart, Wade and Pearson2011) and bryozoans (Liow et al. Reference Liow, Reitan, Voje, Taylor and Di Martino2019) by comparing ancestor and descendant trait distributions before, during, and after speciation as a response to biotic and abiotic ecological and environmental change. Growth traits are readily quantifiable and testable in trait-based ecosystem models (Grigoratou et al. Reference Grigoratou, Monteiro, Ridgwell and Schmidt2021) that investigate the coevolution of life and the planet and alter the longer-term environmental context.
As growth rate is the largest determinant of fitness in our model (Fig. 4), adaptive evolution in growth rates is expected to increase the descendant's population size and, all else being equal, provide a competitive advantage over the ancestor species or ecological competitors. The use of modeling frameworks such as the IPMs presented here focus attention beyond counts and toward ecological significance (Ezard et al. Reference Ezard, Quental and Benton2016). Focusing on traits such as growth rate increases our ability to make ecologically relevant inferences and build a more comprehensive picture of the paleoecological context when these species were evolving millions of years ago.
Acknowledgments
We would like to thank M. Weinkauf and an anonymous reviewer for providing constructive comments on earlier versions of this article. This work was supported by the Natural Environment Research Council awards NE/J018163/1 and NE/P019269/1. D.N.S. would like to acknowledge the Royal Society for a Wolfson Merit award.
Data Availability Statement
Data available from the Dryad Digital Repository: https://doi.org/10.5061/dryad.t1g1jwt53.


 Open access