

Measuring the glycaemic impact of foods is of interest because increased postprandial glucose or high-glycaemic-load diets are associated with a reduced risk of CVD, diabetes and certain cancers(Reference Barclay, Petocz, McMillan-Price and Brand-Miller1). In addition, diets with a low glycaemic index (GI) may be useful in the management of diabetes, insulin resistance and obesity(Reference Wolever2, Reference Wolever3).
The clinical utility of GI depends on accurate and precise results. For GI testing, it is recommended that a drink should be consumed with the test meals. We usually allow subjects to drink coffee or tea(Reference Fernandes, Velangi and Wolever4), but this practice is not widely accepted because these drinks contain caffeine which acutely decreases insulin sensitivity(Reference Greer, Hudson and Ross5) and causes transient glucose intolerance(Reference Thong and Graham6). Coffee and tea contain many other compounds which may counteract the effects of caffeine on glucose responses(Reference Battram, Arthur and Weekes7) and they are potent stimulants of gastric emptying(Reference Lien, Chen and Chang8, Reference Dubey, Sundram and Nundy9). Because of concerns about the confounding effects of coffee and tea on glycaemic responses, it has been recommended that subjects drink only water during GI testing(Reference Brouns, Bjorck and Frayn10). However, the effect of caffeinated beverages on the results of GI tests is not known. Therefore, our aim was to determine the effects of drinking coffee or tea, compared with water, on the results of GI tests.
Materials and methods
The protocol was approved by the University of Toronto Research Ethics Board and all subjects gave written consent to participate.
Healthy subjects (six females and four males; aged 31 (sem 10) years; BMI 25 (sem 4·7) kg/m2) were studied on ten separate mornings after 10–14 h fasts. After being weighed and giving a fasting finger-prick blood sample, subjects ate a test meal within 15 min and further blood for glucose analysis (YSI model 2300 STAT; Yellow Springs Instruments, Yellow Springs, WI, USA) was taken at 15, 30, 45, 60, 90 and 120 min after starting to eat.
There were three different test meals:
(1) 109 g white bread (WB; baked in a bread maker(Reference Fernandes, Velangi and Wolever4); 1050 kJ, 1 g fat, 8 g protein, 50 g carbohydrate, 1 g fibre);
(2) 84 g cheese puffs (CP; Pirates Booty brand (Robert's American Gourmet, Sea Cliff, NY, USA); 2070 kJ, 15 g fat, 6 g protein, 50 g carbohydrate, 5 g fibre);
(3) 64 g fruit leather (FL; Original Sweet Strawberry flavour (Stretch Island Fruit Co., Allyn, WA, USA); 840 kJ, 0 g fat, 0 g protein, 50 g carbohydrate, 5 g fibre).
The term ‘carbohydrate’ means available carbohydrate calculated as total carbohydrate minus dietary fibre. All subjects tested CP and FL twice, once with 250 ml water and once with 250 ml coffee or tea. WB was tested thrice with water and thrice with coffee or tea. Tea was prepared by steeping one tea bag (Lipton's Red Rose; Unilever, Toronto, ON, Canada) in 250 ml boiling water for 30 s. Coffee was prepared in a drip filter coffeemaker using one tablespoon of coffee (Maxwell House Original Roast; Kraft Canada, Toronto, ON) per 300 ml water. Subjects could have 30 ml of 2 % milk and/or an artificial sweetener with the coffee or tea, but the drink and additives chosen remained constant throughout the study.
Results are expressed as mean values with their standard errors. Incremental areas under the curves (AUC) above fasting glucose were calculated geometrically(Reference Brouns, Bjorck and Frayn10). The CV (CV = 100 × sd/mean) of the AUC for the three WB tests with water and the three with coffee or tea in each subject were calculated and the mean of the resulting values termed reference CV. GI values were calculated as 100 × F/W, where F is the AUC for food and W is the mean AUC after WB for the same drink and subject. Blood glucose concentrations and reference CV values for water v. coffee or tea were compared by paired t test. AUC and GI values were analysed by repeated-measures ANOVA examining for the effects of food, drink, and food × drink interaction. The GI values with water and coffee or tea were subjected to separate ANOVA to compare percentage of total variance (sums of squares) due to foods, subjects and residual error. The significance of differences in residual variation for water v. coffee or tea was determined from the ratio of the error mean square terms using the F test. The criterion for significance was taken to be two-tailed P < 0·05.
Results
The effects of tea in the five tea-drinkers were similar to those of coffee in the five coffee-drinkers, so the results were pooled. Coffee or tea significantly increased blood glucose compared with water at 30 min after WB and CP, but the AUC did not differ significantly (Fig. 1). Coffee or tea had no effect on the glycaemic response elicited by FL and there was no significant food × drink interaction. Coffee and tea increased glucose peak rise (mean for all three test meals) by 0·25 (sem 0·09) mmol/l (P = 0·02), with the difference in tea-drinkers (0·23 (sem 0·11) mmol/l) being similar to that in coffee-drinkers (0·26 (sem 0·16) mmol/l).
Blood glucose responses elicited by the three test meals (fruit leather (a), cheese puffs (b) and white bread (c)) taken with 250 ml water (–●–) or 250 ml coffee (n 5) or tea (n 5) (–○–). Values are means for ten healthy subjects, with standard errors represented by vertical bars. * Mean value was significantly different from that after consuming coffee or tea (P < 0·05). Insets show the incremental areas under the curve (AUC; mmol × min/l). C/T, coffee or tea.
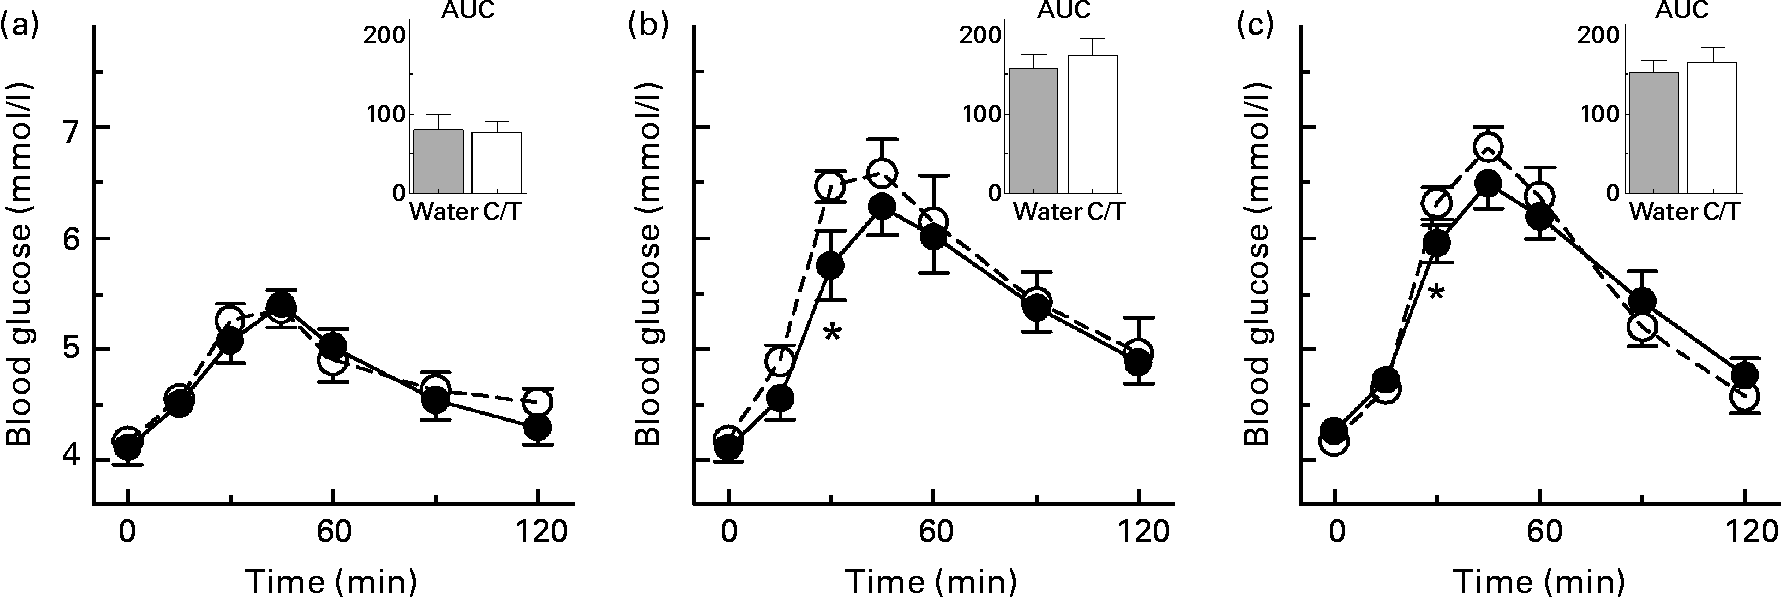
Mean reference CV in both tea- and coffee-drinkers was 21 %. In all subjects, reference CV for coffee and tea (21 (sem 3) %) was non-significantly less than for water (30 (sem 5) %).
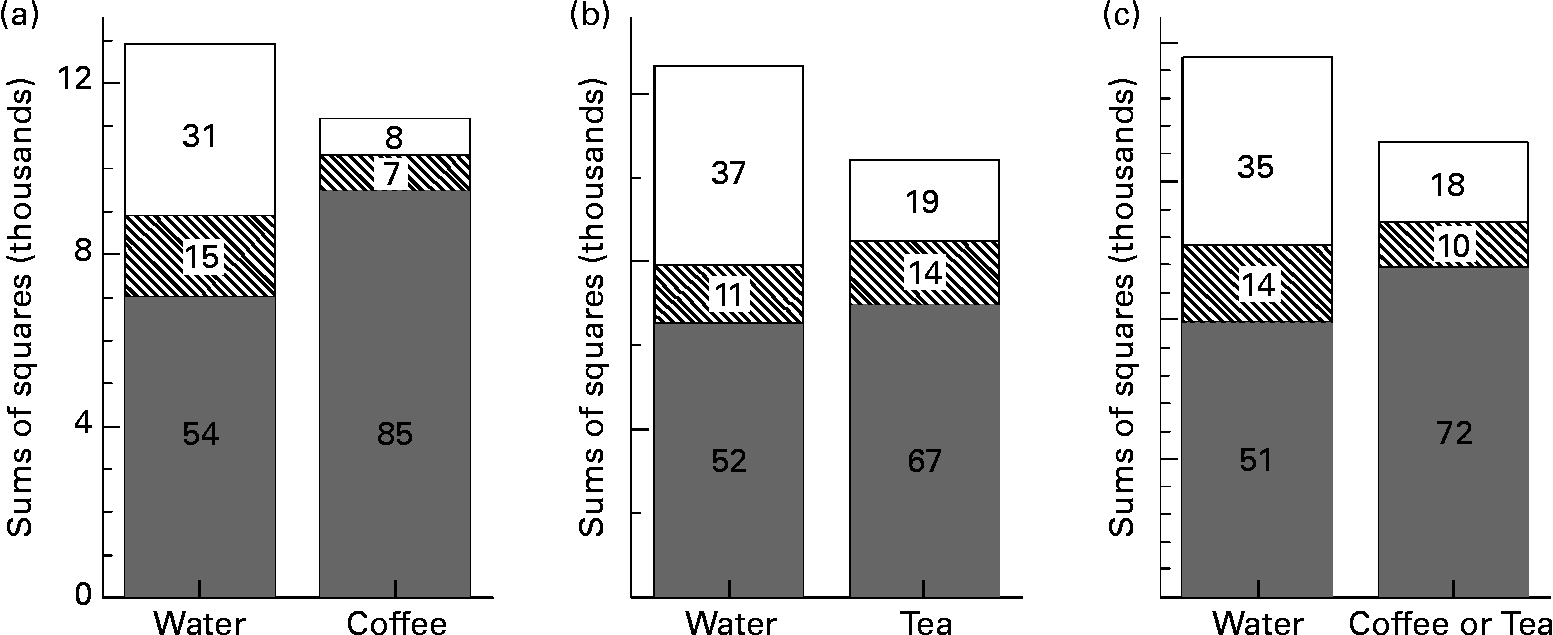
The mean GI values for FL and PB, respectively, with coffee or tea (31 (sem 4) and 76 (sem 6)) did not differ significantly from those with water (35 (sem 7) and 75 (sem 8)); however, the sem values were 25–40 % less. Tea-drinkers had significantly higher AUC than coffee-drinkers (168 (sem 18) v. 101 (sem 22) mmol × min/l), but their mean GI values were similar (61 (sem 3) v. 59 (sem 4)). In both coffee- and tea-drinkers v. water, a larger proportion of the total variation in GI values was due to differences between foods and less due to error (Fig. 2). In all ten subjects, the error variation of GI values was significantly less with coffee or tea (error mean square = 162) than with water (error mean square = 375; F(18, 18) = 2·31; P = 0·04).
Partitioning of variance of glycaemic index values; sums of squares terms from ANOVA for foods (![]() ), subjects (between-subject variation) (▧) and error (within-subject variation) (□) comparing tests when water was consumed as the beverage with those for tests when coffee or tea was the beverage. The percentage of total variation from the different sources is indicated. Results for the five coffee-drinkers (a), the five tea-drinkers (b) and the combined group (c) are shown. The P values representing the significance of the reduction in error variation with coffee or tea v. water are P = 0·02 for coffee-drinkers, P = 0·11 for tea-drinkers and P = 0·04 for the combined group.
), subjects (between-subject variation) (▧) and error (within-subject variation) (□) comparing tests when water was consumed as the beverage with those for tests when coffee or tea was the beverage. The percentage of total variation from the different sources is indicated. Results for the five coffee-drinkers (a), the five tea-drinkers (b) and the combined group (c) are shown. The P values representing the significance of the reduction in error variation with coffee or tea v. water are P = 0·02 for coffee-drinkers, P = 0·11 for tea-drinkers and P = 0·04 for the combined group.
Discussion
These results show that drinking coffee or tea with test foods during GI testing did not affect the mean but reduced the sem, resulting in a more precise estimate of the GI than when the drink was water. This may reflect an ability of coffee and tea to reduce day-to-day (within-individual) variation of glycaemic responses. Mean reference CV, a measure of within-individual variation of AUC, was 33 % lower with coffee or tea than water (not significant). However, the error variation from ANOVA was significantly smaller with coffee or tea than water. Error variation is that part of total variation not due to foods or subjects and, hence, represents the sum of analytical and within-individual variation. Since analytical variation was equal for coffee or tea and water (the same blood sampling and analytical methods were used), this suggests that reduced error variation reflects reduced within-individual variation.
These results are consistent with our previous study(Reference Young and Wolever11) and that of most(Reference Battram, Arthur and Weekes7, Reference Johnston, Clifford and Morgan12, Reference Bryans, Judd and Ellis13), but not all(Reference Feinberg, Sandberg and De Castro14), others in showing that drinking coffee or tea increases blood glucose and/or insulin responses compared with the same volume of water. These effects are usually considered to be due to caffeine, which increases insulin resistance(Reference Greer, Hudson and Ross5) and increases blood glucose and insulin responses by 25–50 %(Reference Thong and Graham6). We saw a smaller effect possibly because we used solid test meals rather than glucose solutions as in most other studies and because coffee and tea contain compounds such as chlorogenic acid and quinide which may offset the glucose-raising effect of caffeine(Reference Battram, Arthur and Weekes7, Reference Johnston, Clifford and Morgan12). Increased gastric emptying is another possible mechanism for the effect of coffee and tea on glucose responses.
In the fasting state the proximal digestive tract undergoes periods of quiescence alternating with contractile motor activity consisting of a period of irregular contractions followed by a shorter phase of regular contractions with a frequency of three per min in the stomach and eleven per min in the small intestine(Reference Stanciu and Bennett15). After meal ingestion, the stomach remains quiescent for a time (lag phase), the length of which is inversely related to meal size. After subjects ingested 650 g (5440 kJ (1300 kcal)) or 217 g (1800 kJ (430 kcal)) meals of beef in tomato sauce, the lag phase lasted 13 (sem 3) min for the large meal and 29 (sem 7) min for the small one(Reference Doran, Jones and Andrews16). Thus, the size of meal required to stimulate prompt gastric emptying may be larger than the 840–1880 (200–450 kcal) typically ingested for GI testing.
Gastric emptying is an important determinant of glycaemic responses. The rate of gastric emptying was positively correlated with glycaemic responses in both normal(Reference Horowitz, Edelbroek and Wishart17) and hypertensive subjects(Reference Phillips, Salman and McMahan18). Consuming glucose solution during gastric quiescence elicits a glucose response >50 % less than ingesting glucose during a period of gastric motor activity(Reference Thompson, Wingate and Thomas19). Indeed, taking 20 mg metoclopramide (a drug which stimulates gastric emptying) 15 min before glucose reduced the day-to-day variation of the rate of rise of blood glucose by 50 %(Reference Thompson, Wingate and Thomas19). Since coffee and tea stimulate gastric motility(Reference Lien, Chen and Chang8, Reference Dubey, Sundram and Nundy9), consuming them with a test meal may reduce the day-to-day variation of glycaemic responses by promoting more prompt and consistent gastric emptying; however, further work is needed to prove this.
We conclude that drinking coffee or tea with test meals does not affect the mean GI value obtained, but may reduce variability and, hence, improve precision.
Acknowledgements
The present study was supported by Glycaemic Index Testing, Inc. and Glycaemic Index Laboratories, Inc. A. A. received a Government of Kuwait Graduate Student Scholarship.
T. M. S. W. is the President of Glycaemic Index Laboratories, a contract research organisation, and of Glycaemic Index Testing, which provides services to research laboratories. A. A. declares no relevant conflicts.
Both authors were involved in study design and data analysis/interpretation. The manuscript was drafted by A. A. and revised by T. M. S. W. Funding was obtained by T. M. S. W.


