Water environment is closely related to the growth and survival of organisms, especially for aquatic animals that provide human with high-quality protein(Reference Semary1). Aquaculture environment has become increasingly prominent for the public to pay attention to water pollution and sewage treatment along with the development of aquaculture. As where aquatic animals live, water is an interesting issue for investigating the relationship between aquatic animals and water environment. High concentration of ammonia-N (NH3/NH4 +) is a serious aquaculture water environmental issue in aquaculture, which threatens the survival of aquatic animals(Reference Romano and Zeng2,Reference Zhao, Li and Zhang3) , but usually it was ignored in the aquaculture industry. Ammonia-N that comes from the decomposition of residues and organic wastes could lead to endocrine system disorder and physiological dysfunction in hydrobios and cause reduction in aquaculture output(Reference de Lourdes Cobo, Sonnenholzner and Wille4–Reference Wang, Yang and Wang6). It limits the development of crustacean farming because crustaceans are bottom-living and susceptible to ammonia-N. Recently, some researchers have investigated the effects of ammonia-N on the physiological functions of crustaceans by focusing on immune defence(Reference Liu, Li and Yu7,Reference Zhang, Pan and Xu8) , osmoregulation(Reference Yuan, Zhang and Liu9) and ammonia-N excretion(Reference Weihrauch and Allen10), while research on energy metabolism is scarce.
Some studies have reported that environmental stress leads to abnormal physiological metabolism in aquatic animals. Disorders of haemolymph glucose level, TAG and other indicators were observed in crustaceans after ammonia-N(Reference Shan, Geng and Ma11), salinity(Reference Esparza-Leal, Ponce-Palafox and Cervantes-Cervantes12,Reference Chen, Li and Xu13) and hypoxia stress(Reference Aparicio, Pinon and Racotta14). Haemolymph glucose (a sort of monosaccharide) affects the energy supply of the body, which is closely related to glycogen metabolism (synthesis and decomposition), gluconeogenesis (GNG) and GLY. However, the study on glucose metabolism in crustaceans under environmental stress is limited. Glycogen synthase (GCS) and glycogen phosphorylase (GP), the key enzymes of glycogen metabolism, have been identified in crustaceans(Reference Li, Zhu and Ren15,Reference Zhang, Li and Yao16) . Previous study has shown that crustacean hyperglycaemic hormone (CHH) was a critical environmental stress response neuroendocrine factor, with the capability to regulate the expression of GCS and GP genes(Reference Nagai, Nagata and Nagasawa17), which indicated that the neuroendocrine factors contributed to the glycogen metabolism regulation in crustaceans. Moreover, it was reported in fish that dietary carbohydrate supplementation(Reference Zhang, Wei and Liu18), starvation stress(Reference Yang, Deng and Pan19), temperature stress(Reference Guillen, Borges and Herrerias20) and hypoxia stress(Reference Sun, Zhao and Wu21) had impact on the expression of rate-limiting enzymes in GLY including hexokinase (HK), pyruvate kinase (PK) and phosphofructokinase (PFK) and critical enzymes in GNG, such as phosphoenolpyruvate carboxykinase (PEPCK), fructose diphosphate enzyme (FBP) and glucose-6-phosphatase (G6P). In addition, several genes involved in GLY and GNG in crustaceans were changed under salinity stress(Reference Guo, Wang and Dong22,Reference Schein, Chitto and Etges23) , though no regulatory pathways have been reported yet. Still, little is known about the metabolic pathways of glycogen metabolism, GLY and GNG in crustaceans under ammonia-N stress.
White shrimp (Litopenaeus vannamei), an important aquaculture organism, contributes a considerable amount of production to crustacean culture around the world. In 2018, the annual output of white shrimp reached 4·9662 million tonnes, accounting for 82·71 % of the total output of crustaceans (FAO, 2020). Therefore, to provide a reference for the healthy breeding of crustaceans, many researchers have used L. vannamei as a model to explore the physiological regulation mechanism under water environmental stress. Previous studies have shown that after environmental exposure (salinity, ammonia-N, dissolved oxygen, etc.), neuroendocrine factors of shrimp changed significantly before acting on the target cells to perform corresponding physiological regulatory functions, such as CHH and biogenic amines (dopamine, DA; serotonin, 5-HT; norepinephrine, NE),(Reference Aparicio, Pinon and Racotta14,Reference Zhao, Pan and Ren24,Reference Si, Pan and Wang25) . CHH is one of the most important neuroendocrine hormones in crustaceans. According to whether it has CHH precursor-related peptide, it can be divided into two subgroups: CHH I (CHH) and CHH II (moult-inhibiting hormone, vitellogenesis inhibitory hormone, gonad inhibition hormone, etc.)(Reference Kleijn and Herp26), in which CHH, a type of critical environmental stress response neuroendocrine factor, also has different subtypes. It has been shown that CHH has a variety of physiological functions, including haemolymph glucose regulation (GenBank number: HM748790, AY434016 and AY167046)(Reference Xu, Pan and Zhang27,Reference Wanlem, Supamattaya and Tantikitti28) , ammonia-N excretion (GenBank number: HM748790)(Reference Zhang, Pan and Wei29) and immune regulation (GenBank number: HM748790, AY434016 and AY167046)(Reference Xu, Pan and Zhang27,Reference Wanlem, Supamattaya and Tantikitti28,Reference Wang, Chen and Xu30) . Besides, in the studies of biogenic amines, DA was reported to be more effective than 5-HT and NE in the regulation of glucose in crustacean haemolymph(Reference Aparicio-Simón, Pión and Racotta31,Reference Babu, Kalarani and Padmavati32) . For example, DA enhanced the level of haemolymph glucose in L. vannamei (Reference Camacho-Jimenez, Diaz and Munoz-Marquez33), Penaeus monodon (Reference Kuo, Hsu and Lin34), Squilla mantis (Reference Lorenzon, Brezovec and Ferrero35), Astacus leptodactylus (Reference Lorenzon, Brezovec and Ferrero35) and Procambarus clarkii (Reference Sarojini, Rachakonda and Fingerman36). On the one hand, many studies suggested that DA stimulated hyperglycaemia via the release of CHH, while on the other hand, one report showed that DA inhibited the release of CHH and caused hypoglycaemia without a significant CHH effect in eyestalkless animals(Reference Lorenzon, Brezovec and Ferrero35). Although CHH and DA promote the haemolymph glucose content in shrimp, the regulatory relationship between them and the signalling transduction pathways are still not very clear. Moreover, studies on the immune defence and ammonia-N excretion in crustaceans have shown that CHH and DA act on the intracellular signalling transduction pathways (second messengers – protein kinases – nuclear transcription factors) by transferring signalling into target cells through their membrane receptors (membrane-bound guanylyl cyclase, GC; DA receptors) to exert physiological effects(Reference Wanlem, Supamattaya and Tantikitti28,Reference Si, Pan and Zhang37,Reference Tong, Wei and Pan38) . In addition, it has been reported in mammals that the regulatory enzyme AMP active protein kinase (AMPK), a central metabolic regulator with three subunits, including AMPKα, AMPKβ and AMPKγ, not only controlled glucose uptake and GLY through GLUT but also regulated glycogen metabolism and GNG(Reference Ha, Guan and Kim39,Reference Angin, Beauloye and Horman40) . Although it has been reported that the three subunits of AMPK are involved in the regulation of glucose metabolism, the relationship among the three subunits in the process is still unclear. Furthermore, studies in vertebrates have shown that nuclear transcription factor cyclic AMP response element-binding protein (CREB) regulates glycogen synthesis, glycogen decomposition and GNG in the liver(Reference Chi, Feng and Wang41,Reference Chen, Zhang and Mi42) . Two glucose transporters (GLUT1 and GLUT2) have been identified in L. vannamei (Reference Martinez-Quintana, Kikuta and Felix-Portillo43,Reference Wang, Li and Chen44) . However, the information on the regulatory mechanism of glucose metabolism in crustaceans is still limited, and the signalling transduction pathways of CHH and biogenic amines in glucose metabolism under environmental stress have not been reported yet.
In this study, we used RNA interference technology to knock down the CHH expression level of shrimp under ammonia-N exposure to explore the physiological metabolism mechanism of L. vannamei. Subsequently, the changes in critical factors related to neuroendocrine system, hepatocyte membrane receptors, intracellular signal transduction pathways, glycogen synthesis and decomposition, GLY and GNG were detected. This study analysed the regulatory pathways of CHH on glucose metabolism in shrimp after ammonia-N exposure, and attempting to provide the reference for the exploration of physiological metabolism regulation mechanism of crustaceans under environmental stress.
Materials and methods
In this study, all experiments followed the guidelines on animal experiments of Ocean University of China (The Animal Care and Use Committee of Ocean University of China), under permit No. SCXY-B20190122.
Experimental shrimp, experimental design and sampling
L. vannamei with average body length of 10·9 (SEM 1·1) cm and average body weight of 16·1 (SEM 1·9) were obtained from a farm in Shazikou Town, Qingdao. Before formal experiment, all the shrimp were acclimated in tanks (50 cm × 60 cm × 40 cm) containing aerated filtered seawater (salinity 31, pH 8·0, water temperature 20·4–21·4 oC) with an air pump for 1 week. Shrimp during the intermolt stage were chosen in this study. Seawater was renewed twice per day about 3–1 volume of the water. During the acclimation period, the shrimp were given oriented compound feed (crude protein 47·5 %, crude fat 8·3 %, coarse fibre 3·3 %, crude ash 11·2 % and moisture 7·2 %; Hengxing Group Co. Ltd) until 48 h before the formal experiment.
Procedures and methods of the preparation of CHH (GenBank number: HM748790) and green fluorescent protein (GFP, GenBank number: SRR346404) dsRNA were described in our previous work(Reference Zhang, Pan and Wei29). Briefly, the L. vannamei CHH and GFP (as a non-specific dsRNA control) dsRNA were obtained by a T7 RiboMAX Express RNAi Kit (Promega). The primers were designed with Primer premier 5.0 in online Supplementary Table 1. The dsRNA products were stored at –80°C. In this study, dsCHH and dsGFP were dissolved in shrimp normal saline (NaCl 0·40 mol/l, CaCl2·2H2O 0·01 mol/l, Na2HPO4·12H2O 0·0004 mol/l, KCl 0·009 mol/l, MgCl2·6H2O 0·02 mol/l, TRIS 0·035 mol/l, pH 7·45, osmolality 780 mOsm/kg). The pre-experiment was performed in the normal seawater (20 µg dsRNA dissolved in 50 µl saline, tail ganglion muscle injection; three groups: dsCHH, dsGFP and saline) before the formal experiment. The interference efficiency of dsCHH was measured as described in section RNA extraction, cDNA synthesis and quantitative PCR analysis.
In the formal experiment, L. vannamei were randomly divided into three groups including Saline group, GFP-dsRNA group and CHH-dsRNA group, which were cultured under 20 mg/l ammonia-N stress according to previous studies(Reference Zhang, Pan and Xu8,Reference Si, Pan and Wang25) . Ammonia-N concentration was measured every 12 h when water was changed and adjusted by NH4Cl stock solution (10 g/l). During the experiment, no shrimp died. According to the results of pre-experiment, 20 µg CHH dsRNA was injected into shrimp by 1 ml sterile injection syringe and dsGFP and shrimp saline were injected as two control groups. The tissues of shrimp hepatopancreas and muscle were sampled at 0, 3, 6, 12, 24, 48 and 72 h after injection, and haemolymph was collected by 1 ml sterile injection syringe with shrimp anticoagulant (450 mmol/l NaCl, 10 mmol/l KCl, 10 mmol/l EDTA-Na2 and 10 mmol/l HEPES, pH 7·45, 780 mOsm/kg) in a 1:1 ratio from the shrimp ventral sinus at the same time points. Six replicates with ten shrimp per replicate in every treatment and nine shrimp per replicate were sampled and numbered at each time points. Hepatopancreas and muscles were frozen by liquid N2 and stored at −80°C. After sampling, the haemolymph was immediately centrifuged for 10 min (4°C, at 700 g) and then plasma was also numbered and stored at −80°C.
Determination of glucose level in plasma
Plasma glucose level was measured by a Glucose Assay kit (Glucose oxidase method, No. A154-1-1, Nanjing Jiancheng Bioengineering Institute, China). The experimental process was carried out based on the manufacturer’s instruction. In brief, 10 μl plasma sample, 10 μl calibration solution and 10 μl distilled water were mixed with 1000 μl working solution. Then, they were reacted at 37°C for 10 min, and the absorbance was determined using a colorimetric cup (Optical path 1 cm) and adjusting the blank tube to zero at the wavelength of 505 nm. The final glucose concentration was calculated by the ratio of sample absorbance:calibration solution absorbance and then multiplied by the concentration of calibration solution (the concentration of calibration solution is 5·55 mmol l–1).
Determination of neuroendocrine factors concentration in plasma
The concentrations of neuroendocrine factors (CHH and DA) in shrimp plasma were measured as described previously(Reference Xu, Pan and Zhang27). CHH concentration was detected using ELISA method, and DA concentration was determined using HPLC-Electrochemical Detection method. Briefly, for the determination of CHH concentration, the titter of antibody was measured and the standard curve was finished after the preparation of CHH (GenBank number: HM748790) polyclonal antibody from rabbit and then the CHH concentration was detected in combination with the standard curve. The preparation of CHH polyclonal antibody and the detection method of CHH are described in our previous report(Reference Xu, Pan and Zhang27). In addition, for the determination of DA concentration, solution (1000 µl), TRIS buffer (500 µl) and acidic alumina (10 mg) were mixed, centrifuged and discarded the supernatant. Then, ultra-pure water (1000 µl) was added and centrifuged, and the precipitation was retained. Subsequently, perchloric acid (0·1 m, 500 µl) was added and centrifuged, and then the supernatant was collected. Besides, DA standard curve was finished with DA standard product. Moreover, DA concentration in the supernatant was assayed (n 6) by HPLC-Electrochemical Detection and then determined by comparing with the DA standard curve.
Determination of intracellular second messenger content in hepatopancreas
Shrimp hepatopancreas was pestled in liquid N2 and then weighed 100 mg tissue, and PBS was added. Subsequently, samples were homogenised in ice bath and centrifuged (3000 rpm, 20 min), and then the supernatant was taken. The concentration of cyclic AMP (cAMP), cyclic GMP (cGMP) and diacylglycerol (DAG) in hepatopancreas was determined by shrimp cAMP ELISA kit (BPE94058, Shanghai Lengton Bioscience Co. Ltd), shrimp cGMP ELISA kit (BPE94048, Shanghai Lengton Bioscience Co. Ltd) and shrimp DAG ELISA kit (BPE94095, Shanghai Lengton Bioscience Co. Ltd), respectively. All of them were detected based on the manufacturer’s instructions.
Determination of glycogen content
In this study, the contents of glycogen in hepatopancreas and muscle were determined by anthrone colorimetry. In brief, 100 mg hepatopancreas or muscle was washed twice with PBS; then, they were ground, ultrasonic-crushed and mixed well with 500 μl deionised water. Then, 500 μl 30 % KOH was added, reacted in water bath (100°C) for 10 min and cooled at room temperature. Subsequently, 30 % KOH was added until reached to 5 ml and mixed well. Besides, 1·5 ml absolute ethanol was added, centrifuged (3000 rpm, 30 min) and retained the precipitate. Moreover, 500 μl distilled water was added, shook and mixed well, then 0·2 % anthrone was added (1000 μl, 100°C for 15 min in water bath) and cooled under ambient condition. Finally, the absorbance of glucose standard solution and samples was determined at 620 nm. The glucose concentration in the sample was confirmed based on the glucose standard curve, and then the glycogen content was calculated.
Analysis of glycogen synthase and glycogen phosphorylase activities
The activities of GCS and GP in hepatopancreas and muscle were investigated in this study. On the one hand, GCS activity was determined by a GCS assay kit (Micro method, NO. ml077003, Shanghai Enzyme-linked Biotechnology Co. Ltd) and the operation process was carried out according to the manufacturer’s instruction. Combined with the total protein content of samples, the GCS activity of hepatopancreas and muscle was determined. On the other hand, for the preparation of enzyme solution, 100 mg hepatopancreas or muscle was homogenised 3 min with three times the volume of 200 mm TRIS-HCl buffer (pH 7·4, include 5 mm β-mercaptoethanol), then they were centrifuged at 4°C for 15 min and retained supernatant to determine GP activity. Subsequently, 25 μl enzyme solution was added into the 1 ml reaction mixture (every 1 ml containing 1 mg glycogen, 50 µm pH 7·4 phosphate buffer, 0·36 µm NADP+, 0·5 Unit glucose phosphate isomerase, 0·5 Unit 6-phosphate glucose dehydrogenase, 25 µm MgCl2, 0·6 µm EDTA, 0·45 µm β-mercaptoethanol) and immediately mixed well at 25°C, and then the absorbance at 340 nm (A340nm) was measured every 1 min for 10 min. Using A340nm to graph the time, take the initial linear part of the reaction, and then calculate the △A340nm/min. Finally, the GP activity of hepatopancreas or muscle was confirmed by combing with the total protein content of corresponding sample.
In this study, total protein was measured based on Bradford’s method(Reference Bradford45) by a standard (bovine serum albumin solutions). All absorbance values were determined by a Molecular Devices Spectra Max 190 Plus microtitre plate spectrophotometer.
RNA extraction, cDNA synthesis and quantitative PCR analysis
Total RNA from hepatopancreas were isolated by RNAiso Plus, and cDNA was synthesised using a PrimeScript™ RT Reagent Kit (TaKaRa) according to the manufacturer’s instructions. RNA quantity was confirmed by electrophoresis, and optical density absorption ratio was determined by a photometer at 260 and 280 nm (Bio-Rad). Every sample 1 µg high-quantity RNA (A260/A280 > 1·8) was used for cDNA synthesis. Gene expressions were determined using real-time quantitative PCR, and these primers are shown in online Supplementary Table 1. The quantitative PCR was carried out using SYBR® PrimeScript™ RT-PCR Kit (TaKaRa). For each sample, quantitative PCR was performed in triplicate on a CFX Real Time PCR Detection System (Bio-Rad) in 25 μl of reactions, including cDNA (1 μl), SYBR Premix EX Taq (12·5 μl), each primer (0·5 μl) and ddH2O (10·5 μl). Moreover, the reaction without cDNA or only added ddH2O as the negative control and blank control, respectively. Both β-actin and elongation factor-1 α (EF1α) were used as reference genes in this study. According to all standard curves, the primers amplification efficiencies of all these investigates genes were 98·1–99·8 % and 0·978 < R 2 < 0·998, respectively. All target genes were normalised to two reference genes (geometric mean value of β-actin Ct and EF1α Ct), and expression levels were calculated using 2–△△Ct method(Reference Livak and Schmittgen46).
Statistical analyses
The data were expressed as mean values with their standard errors. Statistical analyses were performed using SPSS (version 22.0) statistical software (SPSS Inc.). One-way ANOVA was utilised to examine the differences among control and treated groups. Significant differences were considered at P < 0·05. Duncan Multiple Range test was employed to recognise significant differences among the treatments at the same time point.
Results
Effects of crustacean hyperglycaemic hormone RNA interference on the level of plasma glucose in Litopenaeus vannamei under ammonia-nitrogen stress
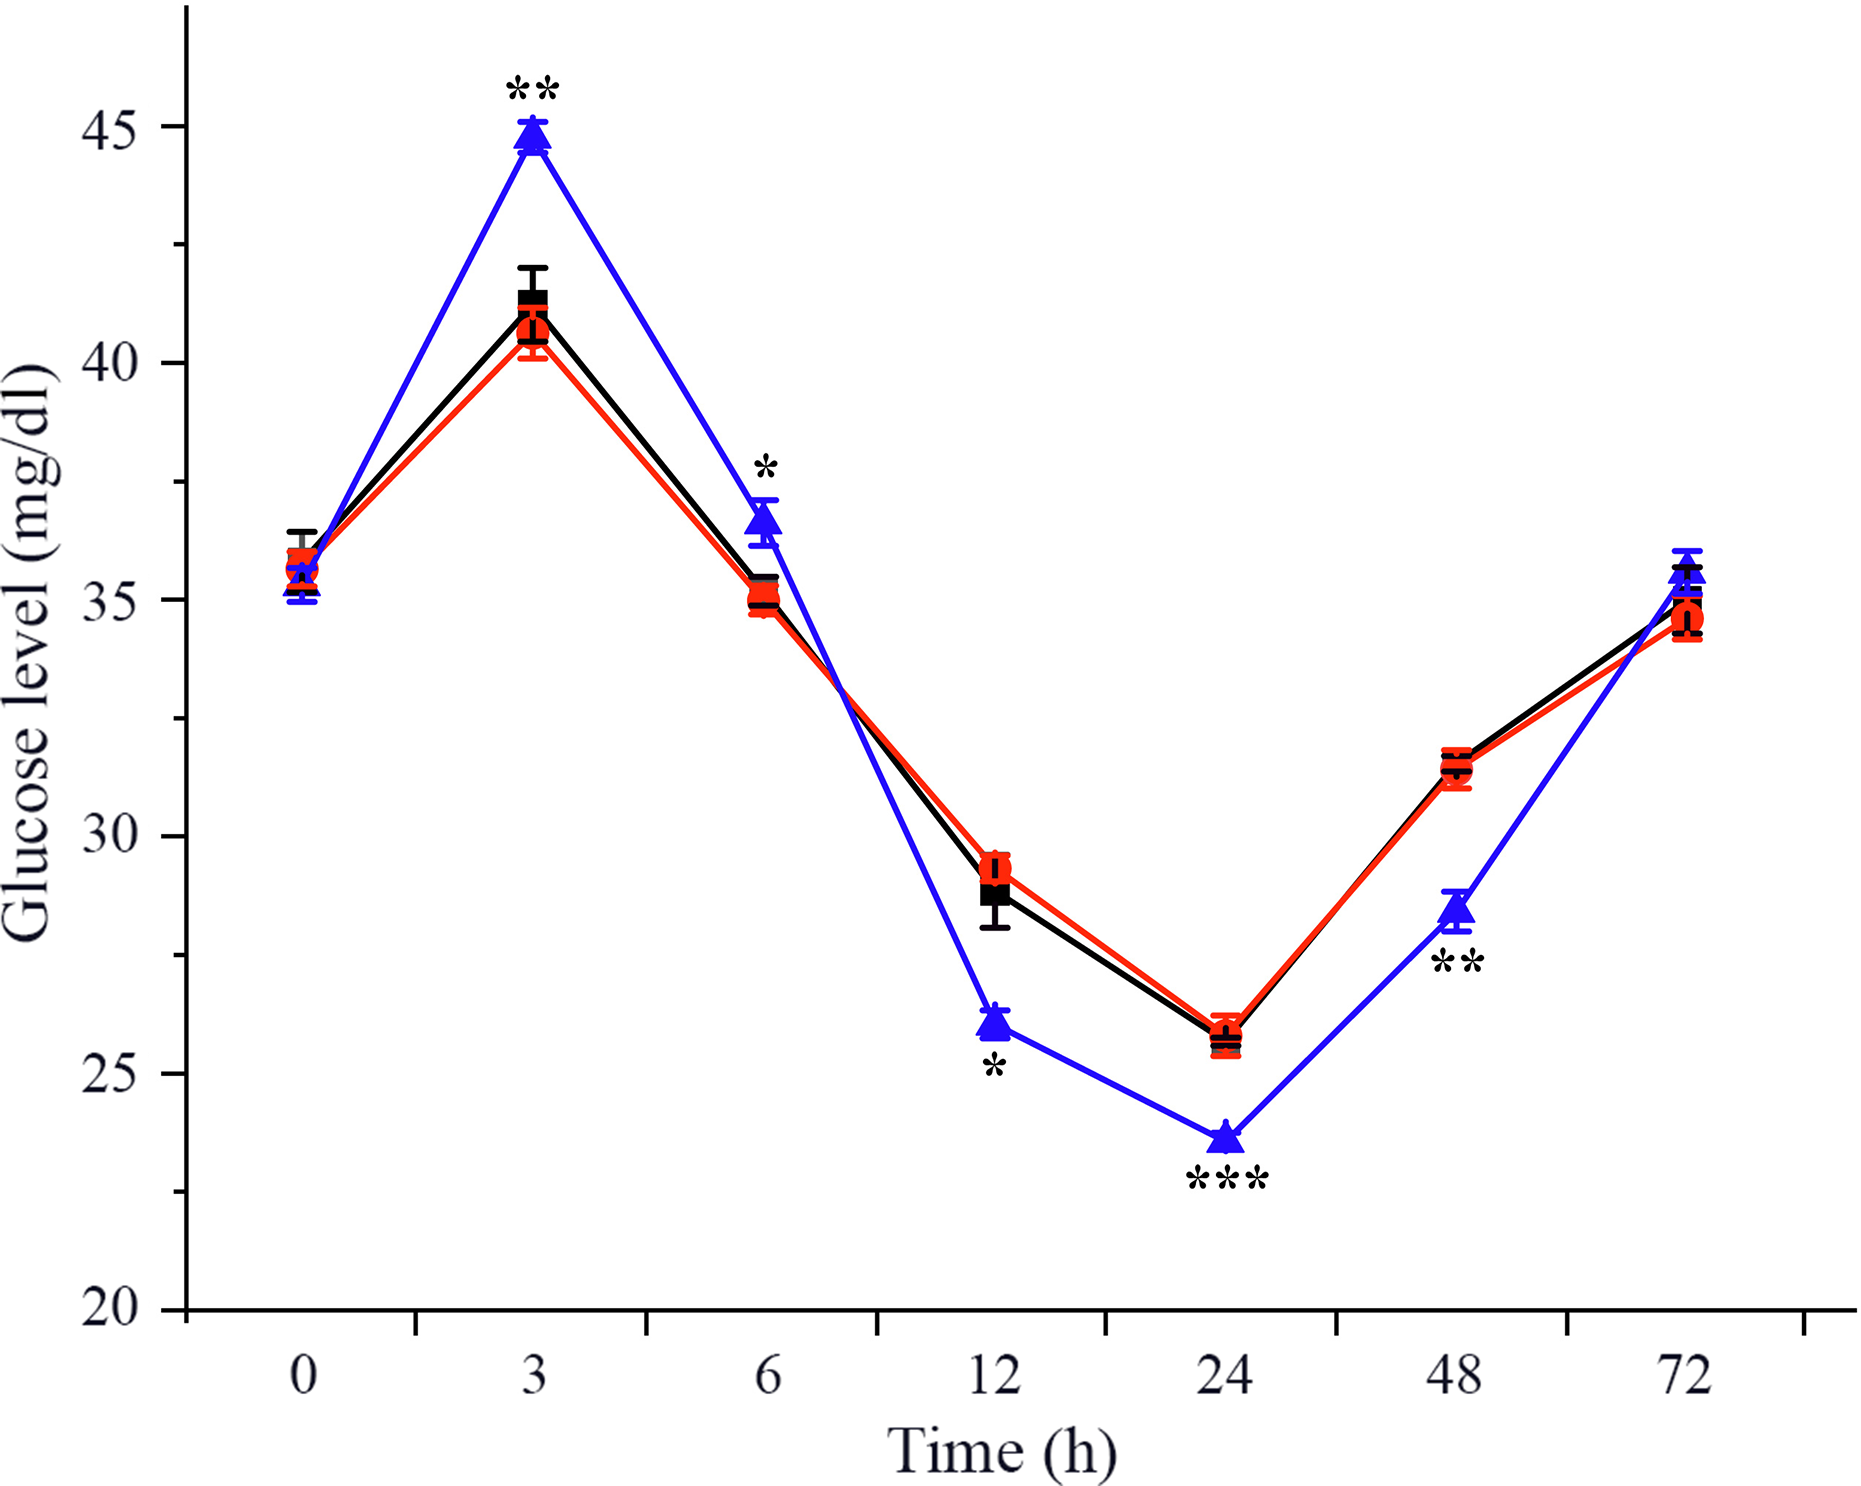
To investigate the effects of CHH on glucose metabolism of L. vannamei under ammonia-N stress, plasma glucose level was measured in dsCHH, dsGFP and Saline groups at different time points during 72 h. The results showed that the concentration of glucose in haemolymph increased obviously at 3 h and then decreased gradually during 6–24 h after ammonia-N exposure (Fig. 1). Besides, the level of plasma glucose reached minimum at 24 h before being returned to the initial level at 72 h under ammonia-N stress (Fig. 1). Moreover, after CHH knock-down, the haemolymph glucose level also increased to the highest level at 3 h and then decreased gradually to the lowest value at 24 h (Fig. 1). However, the haemolymph ammonia concentration in CHH dsRNA group was significantly higher than that in the two control groups during 3–6 h (P < 0·01, 3 h; P < 0·05, 6 h), but it was significantly lower during 12–48 h (P < 0·05, 12 h; P < 0·001, 24 h; P < 0·01, 48 h) and also returned to the control groups’ levels at 72 h under ammonia-N stress (Fig. 1).
Effects of RNA interference knock-down of crustacean hyperglycaemic hormone (CHH) on the concentration of haemolymph glucose in Litopenaeus vannamei after ammonia-nitrogen exposure 72 h. Data (mean values with their standard errors; n = 6 × 9 shrimp per treat = 54 shrimp) at the same exposure time marked with ‘*’ are significantly different (ANOVA, *P < 0·05, **P < 0·01, ***P < 0·001). ![]() , Saline;
, Saline; ![]() , dsGFP;
, dsGFP; ![]() , dsCHH. GFP, green fluorescent protein.
, dsCHH. GFP, green fluorescent protein.
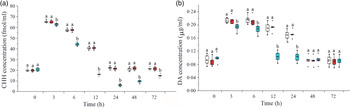
Effects of crustacean hyperglycaemic hormone RNA interference on the level of plasma crustacean hyperglycaemic hormone and DA in Litopenaeus vannamei under ammonia-nitrogen stress
As shown in Fig. 2(a), plasma CHH concentration significantly increased during 3–12 h, reached the maximum at 3 h and returned to the initial level after 24 h under ammonia-N stress. Compared with the two control groups, CHH concentration in plasma in CHH dsRNA group significantly decreased during 3–72 h after ammonia-N exposure and reached to the minimum at 24 h (Fig. 2(a)). Similarly, DA content also increased in the two control groups during 3–24 h and then returned to the initial level at 48 h in plasma of L. vannamei under ammonia-N stress (Fig. 2(b)). After CHH RNA interference, the concentration of DA decreased significantly compared with the two control groups during 3–24 h and returned to the control level after 48 h (Fig. 2(b)). Moreover, no significant difference was observed in the concentrations of CHH and DA between two control groups in same time point during the whole experiment (Fig. 2).
Effects of RNA interference knock-down of crustacean hyperglycaemic hormone (CHH) on the concentration of CHH (a) and DA in haemolymph of Litopenaeus vannamei after ammonia-nitrogen exposure 72 h. Data (mean values with their standard errors; n = 6 × 9 shrimp per treat = 54 shrimp) at the same exposure time marked with different letters are significantly different (ANOVA, P < 0·05). ![]() , Saline;
, Saline; ![]() , GFP dsRNA;
, GFP dsRNA; ![]() , CHH dsRNA. GFP, green fluorescent protein.
, CHH dsRNA. GFP, green fluorescent protein.

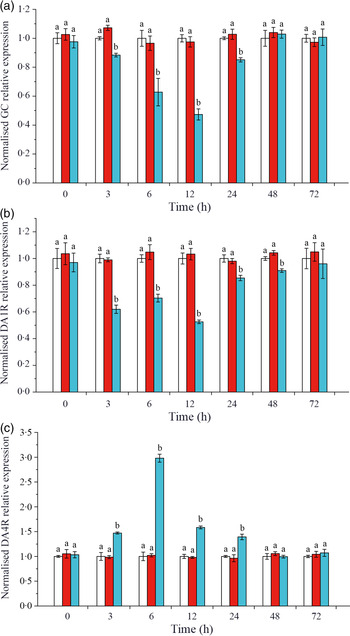
Effects of crustacean hyperglycaemic hormone RNA interference on the expressions of crustacean hyperglycaemic hormone and DA receptors in hepatopancreas of Litopenaeus vannamei under ammonia-nitrogen stress
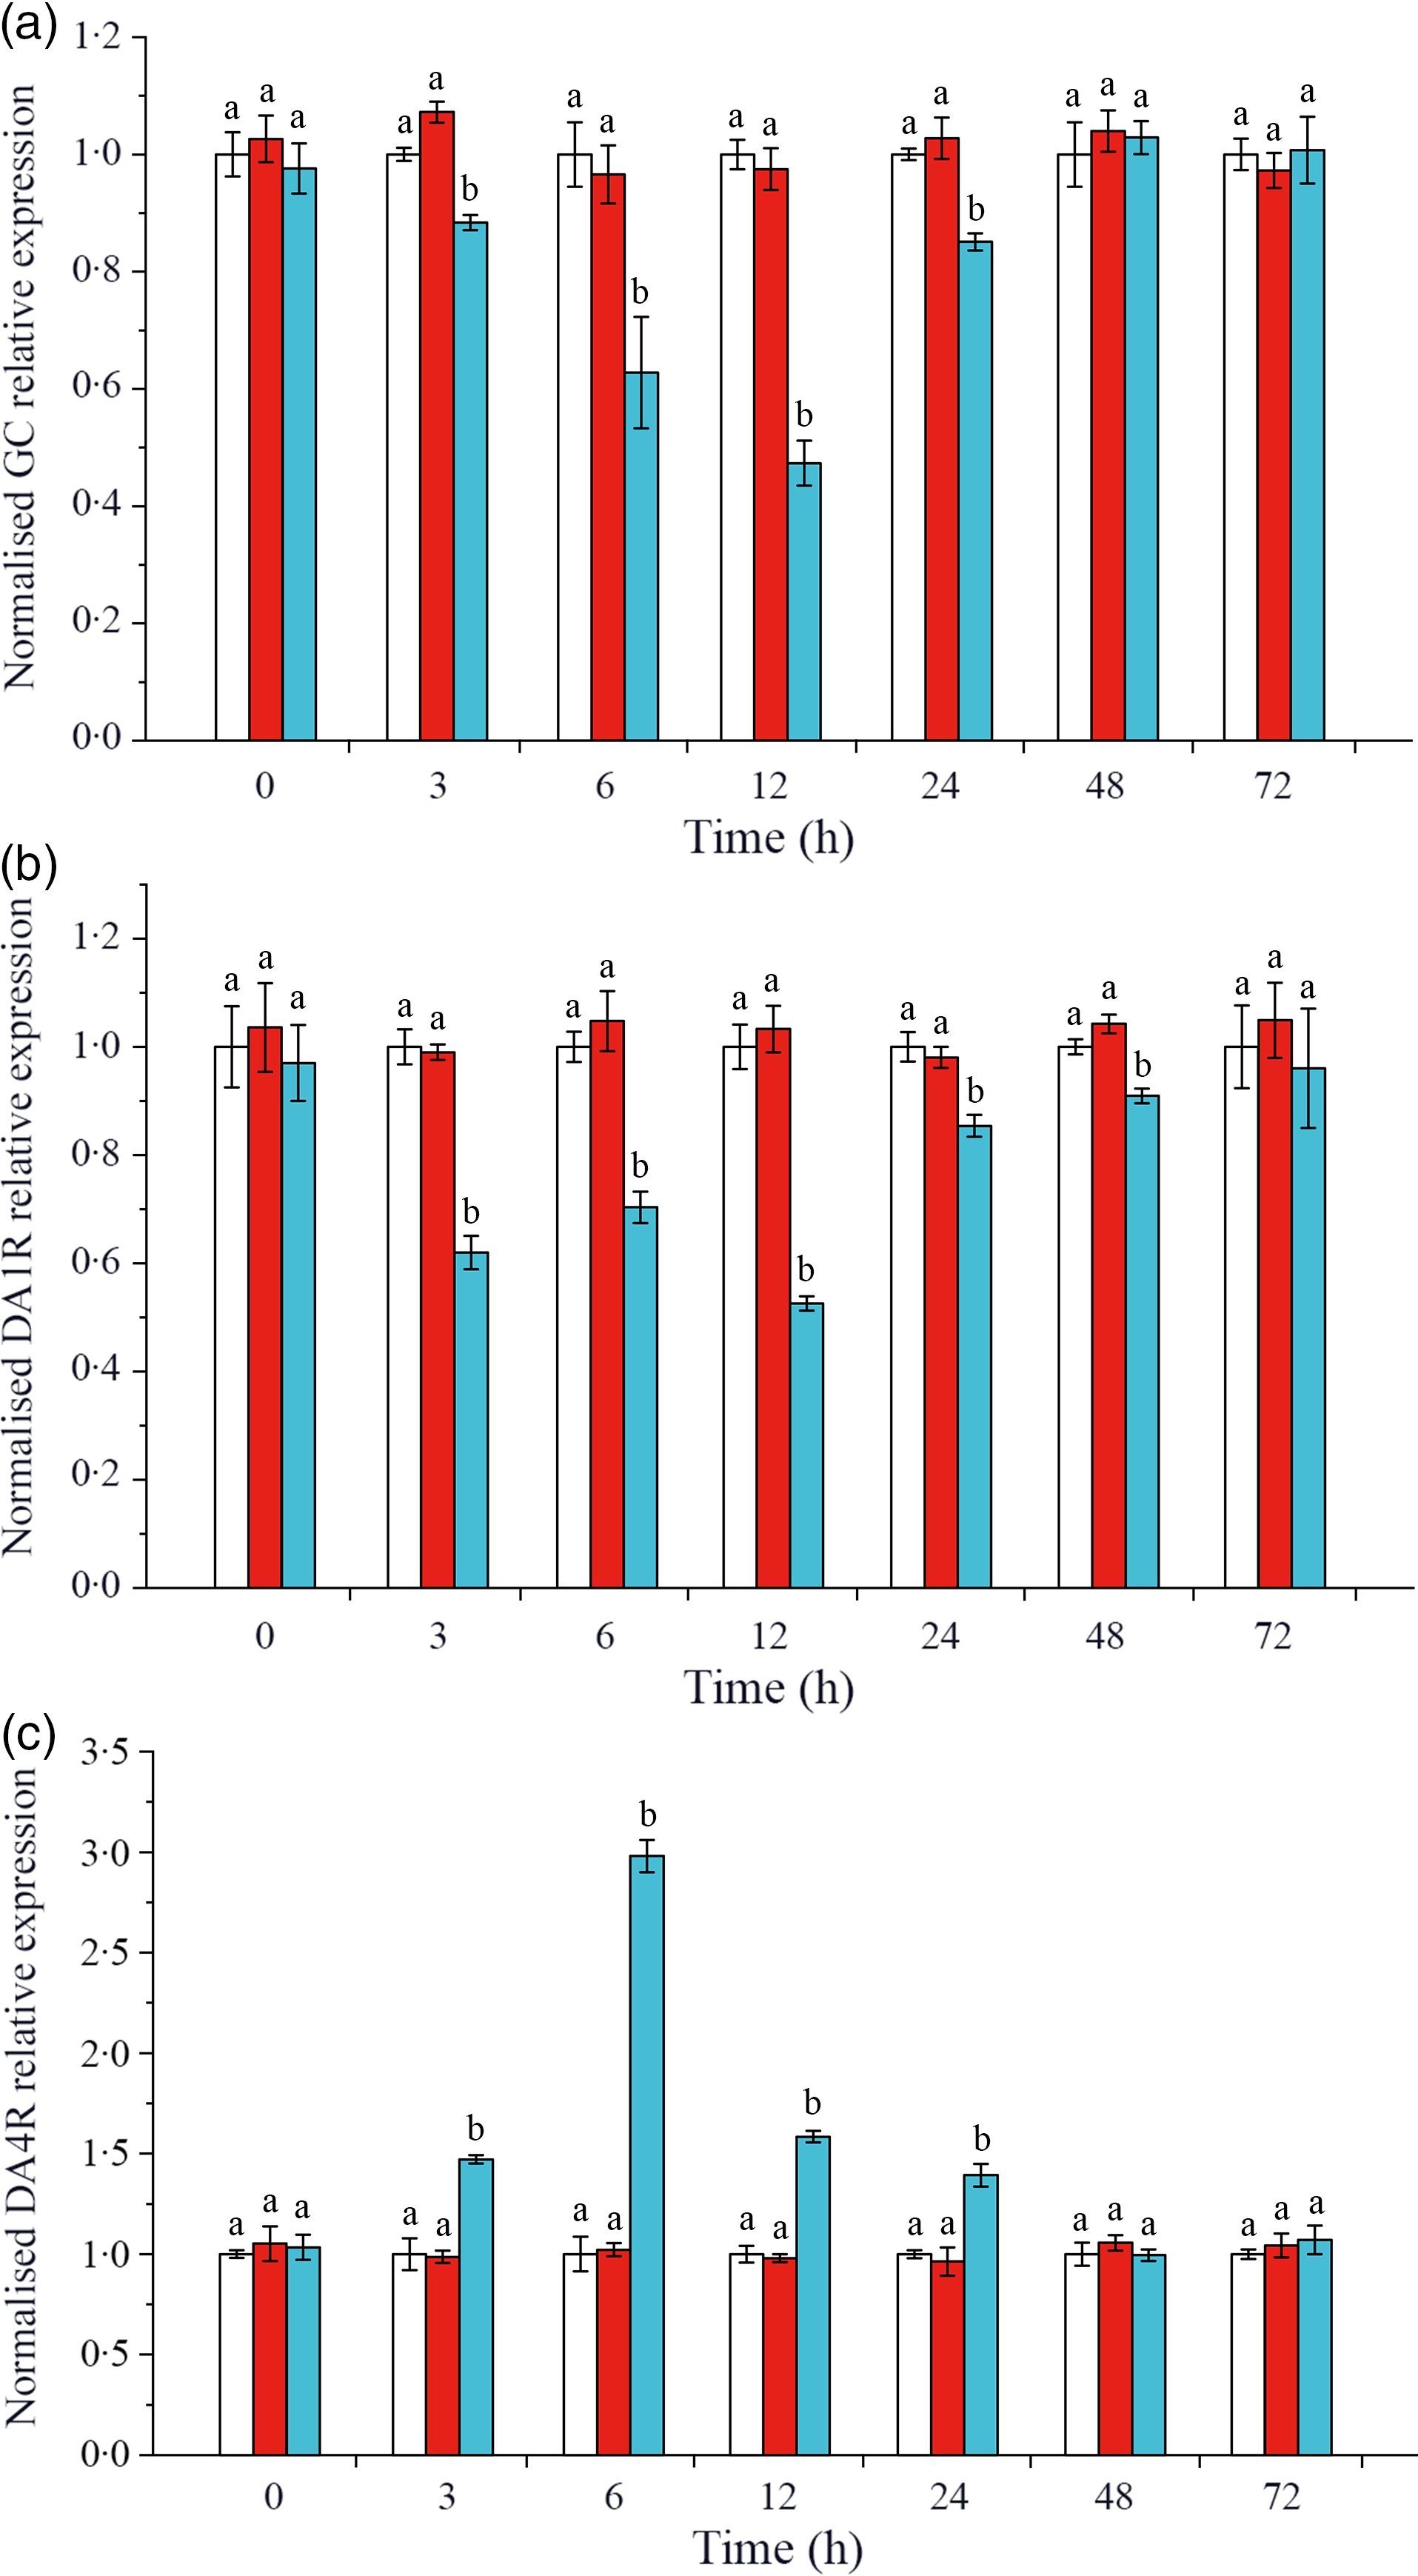
The expressions of CHH and DA membrane receptors GC, DA1R and DA4R were detected on L. vannamei hepatopancreas. As shown in Fig. 3(a), when CHH was knocked down, the level of CHH membrane receptor GC down-regulated significantly during 3–24 h, reached the minimum at 12 h and returned to the control level after 48 h in hepatopancreas of L. vannamei under 20 mg/l ammonia-N stress. Besides, in the CHH dsRNA group, the level of DA receptor DA1R (type 1) reduced significantly during 3–48 h and recovered to the control groups’ level at 72 h (Fig. 3(b)). However, the expression level of DA receptor DA4R (type 2) was significantly higher after CHH knock-down than that in Saline group and GFP dsRNA group during 3–24 h (Fig. 3(c)). It reached to the highest level at 6 h and then achieved stable state after 48 h with no significant change compared with the two control groups (Fig. 3(c)). Moreover, in this experiment, there was no significant change in the levels of GC, DA1R and DA4R between Saline group and GFP dsRNA group (Fig. 3).
Effects of crustacean hyperglycaemic hormone (CHH) RNA interference on the expression of CHH receptor GC (a), DA 1 type receptor (DA1R) (b) and DA 2 type receptor (DA4R) (c) in the hepatopancreas of Litopenaeus vannamei after ammonia-nitrogen exposure 72 h. The mRNA expression was normalised to β-actin and EF1α genes, and the level of target gene mRNA expression in saline group was set equal to 1.0. Data (mean values with their standard errors; n = 6 × 9 shrimp per treat = 54 shrimp) at the same exposure time marked with different letters are significantly different (ANOVA, P < 0·05). ![]() , Saline;
, Saline; ![]() , GFP dsRNA;
, GFP dsRNA; ![]() , CHH dsRNA. GFP, green fluorescent protein.
, CHH dsRNA. GFP, green fluorescent protein.
Effects of crustacean hyperglycaemic hormone RNA interference on changes of intracellular glucose metabolism signalling pathway factors in hepatopancreas of Litopenaeus vannamei under ammonia-nitrogen stress
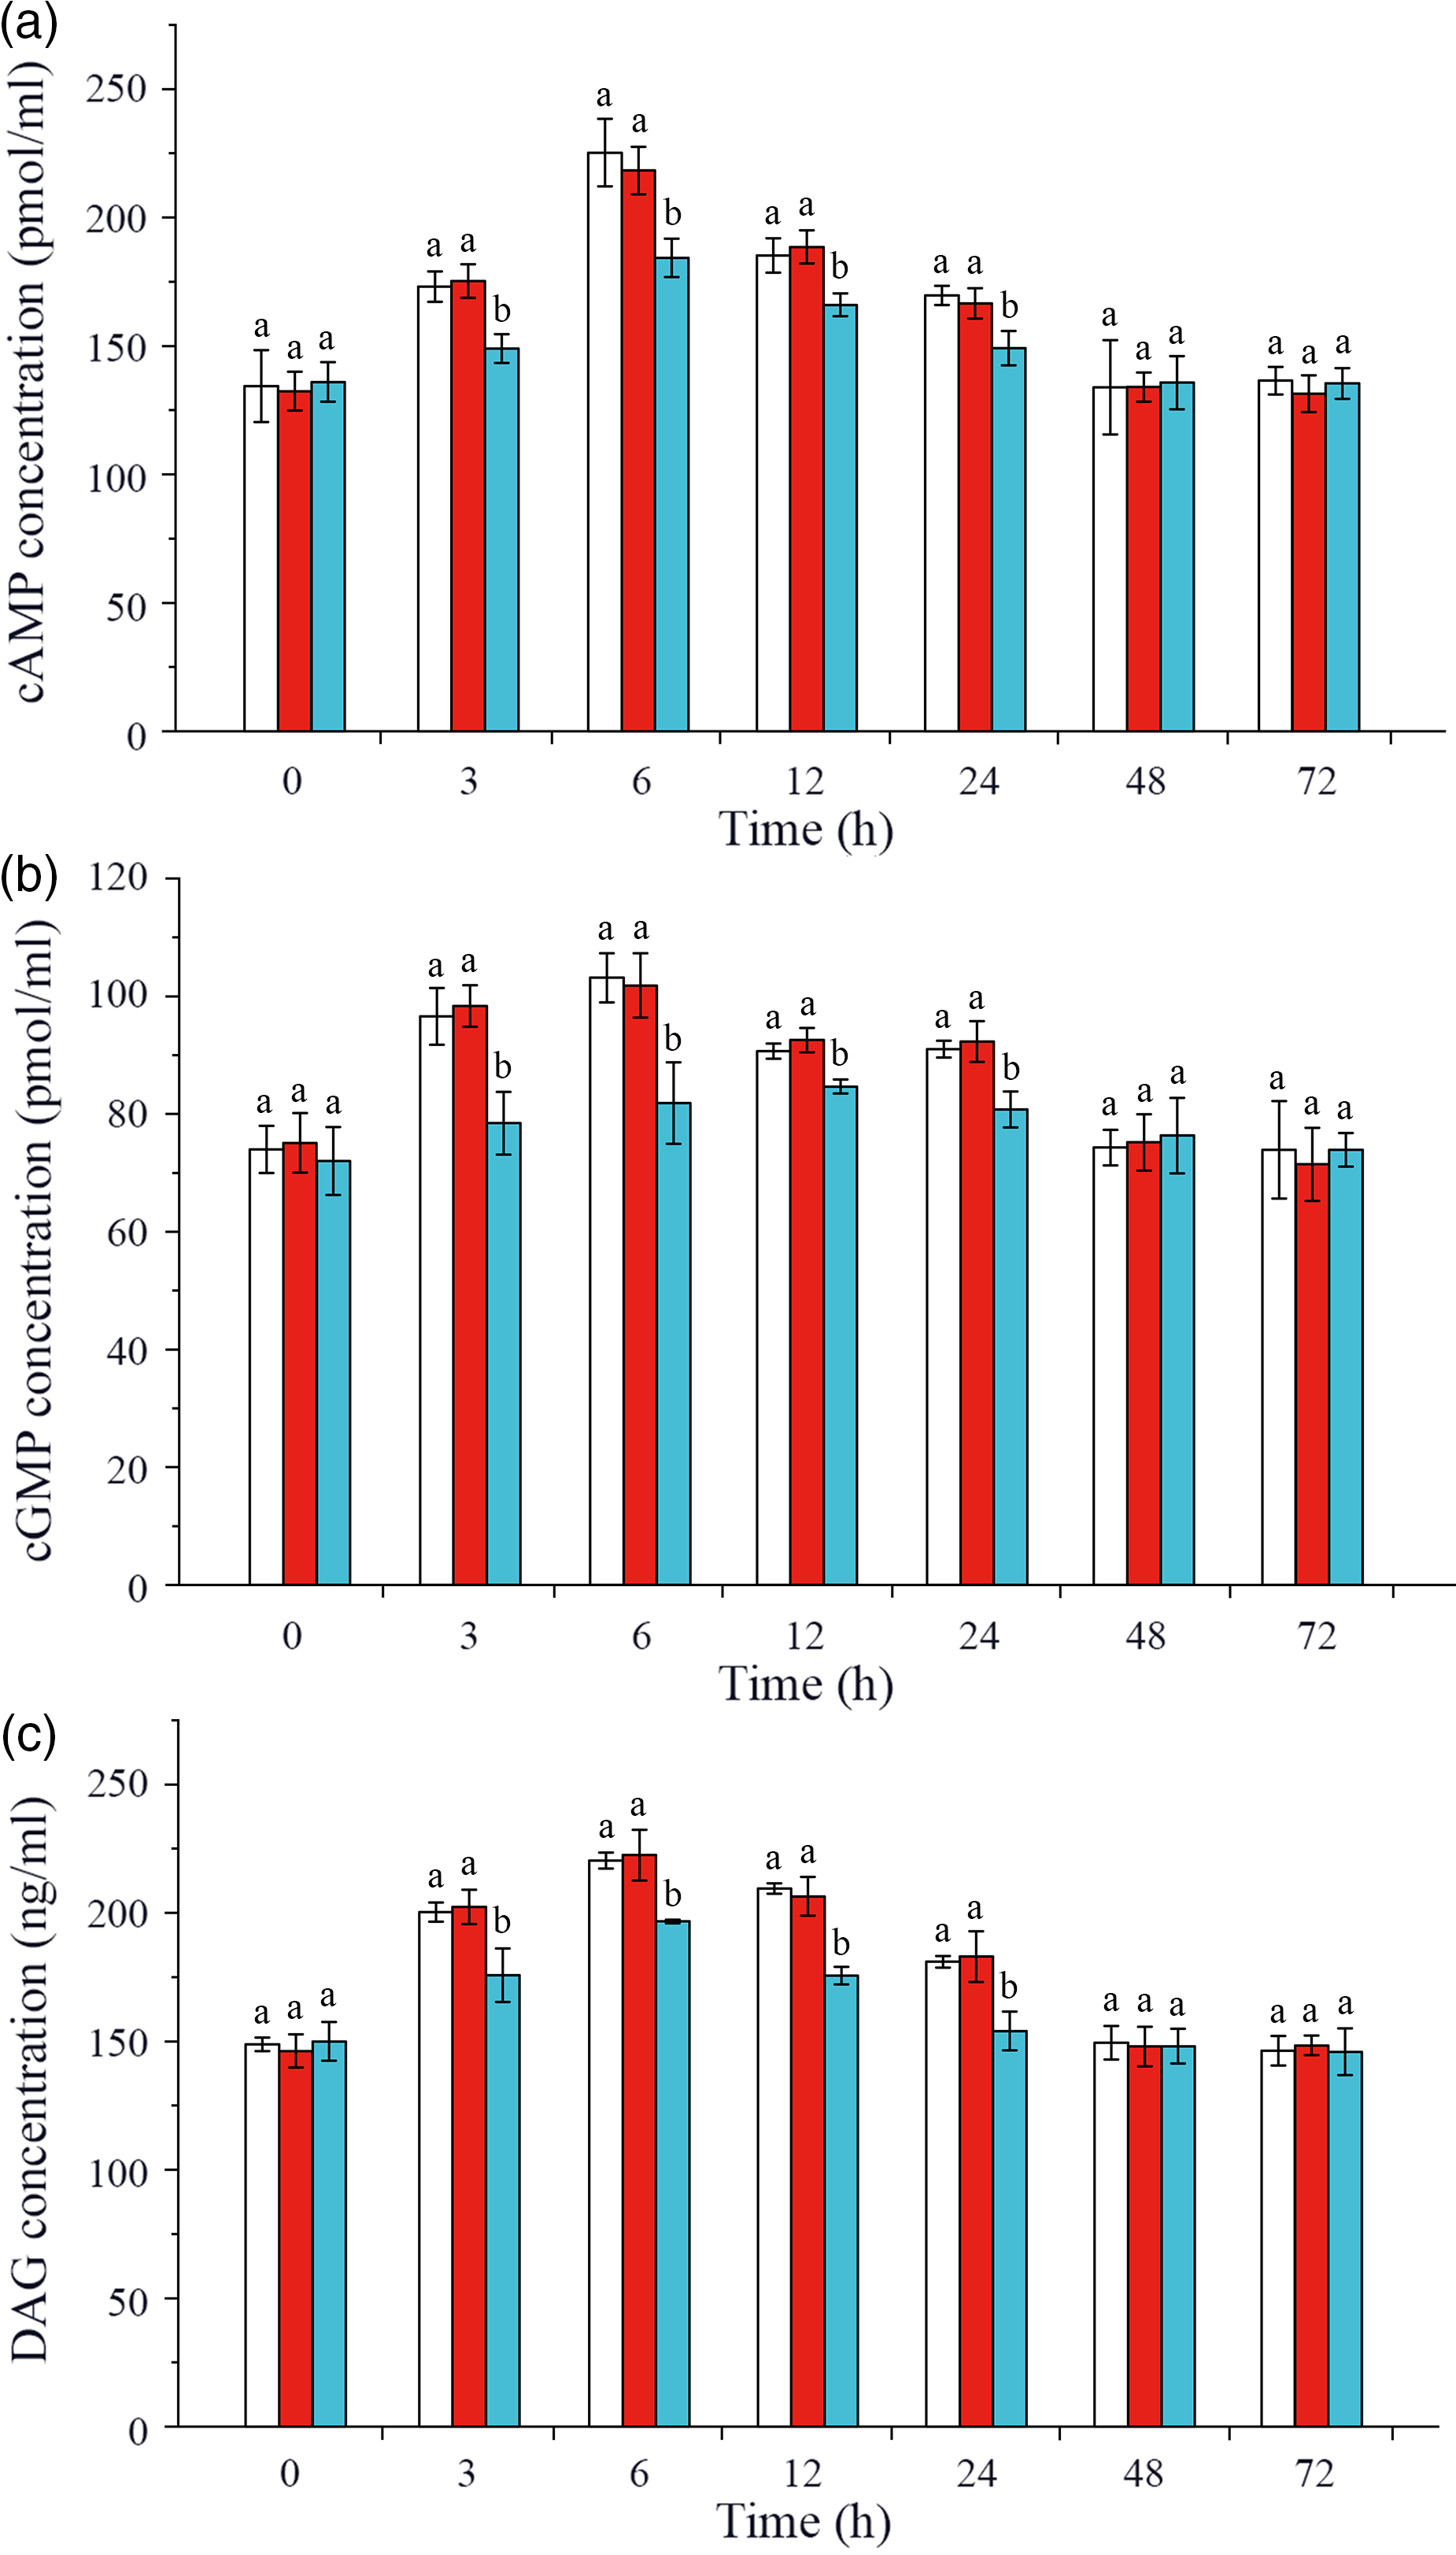
In this study, intracellular signalling pathway factors related to glucose metabolism, including second messengers, protein kinases, regulatory enzyme AMPK, nuclear transcription factor and glucose transporters, were detected in hepatopancreas of L. vannamei after ammonia-N exposure (Figs. 4 and 5). The results showed that the concentrations of cAMP, cGMP and DAG increased after ammonia-N exposure from 3 to 24 h, and all the highest values appeared at 6 h and then returned to the initial level after ammonia-N exposure for 48 h (Fig. 4(a)). Besides, cAMP concentration in CHH dsRNA group was significantly lower than that in the GFP dsRNA group and Saline group during 3–24 h and returned to the level of Saline control group after 48 h in hepatopancreas of L. vannamei under ammonia-N stress (Fig. 4(a)). Similarly, the concentrations of cGMP and DAG in CHH knock-down group were significantly lower than those in the two control groups during 3–24 h after ammonia-N exposure, and there was no significant change between two control groups at 48 and 72 h (Fig. 4(b) and (c)).
Effects of crustacean hyperglycaemic hormone (CHH) RNA interference on the concentrations of second messenger cyclic AMP (cAMP), cyclic GMP (cGMP) and diacylglycerol (DAG) in hepatopancreas of Litopenaeus vannamei after ammonia-nitrogen exposure 72 h. Data (mean values with their standard errors; n = 6 × 9 shrimp per treat = 54 shrimp) at the same exposure time marked with different letters are significantly different (ANOVA, P < 0·05). ![]() , Saline;
, Saline; ![]() , GFP dsRNA;
, GFP dsRNA; ![]() , CHH dsRNA. GFP, green fluorescent protein.
, CHH dsRNA. GFP, green fluorescent protein.
Effects of crustacean hyperglycaemic hormone (CHH) RNA interference on the expressions of protein kinase A (PKA), protein kinase C (PKC), protein kinase G (PKG), AMPK α subunit (AMPKα), AMPK β subunit (AMPKβ), AMPK γ subunit (AMPKγ), cyclic AMP response element-binding protein (CREB), GLUT1 and GLUT2 in the hepatopancreas of Litopenaeus vannamei after ammonia-N exposure 72 h. The mRNA expression was normalised to β-actin and EF1α genes, and the mean values of target gene normalised transcript levels in each treatment were used to draw the heat map (n = 6 × 9 shrimp per treat = 54 shrimp). Data at the same exposure time marked with different letters are significantly different (ANOVA, P < 0·05).
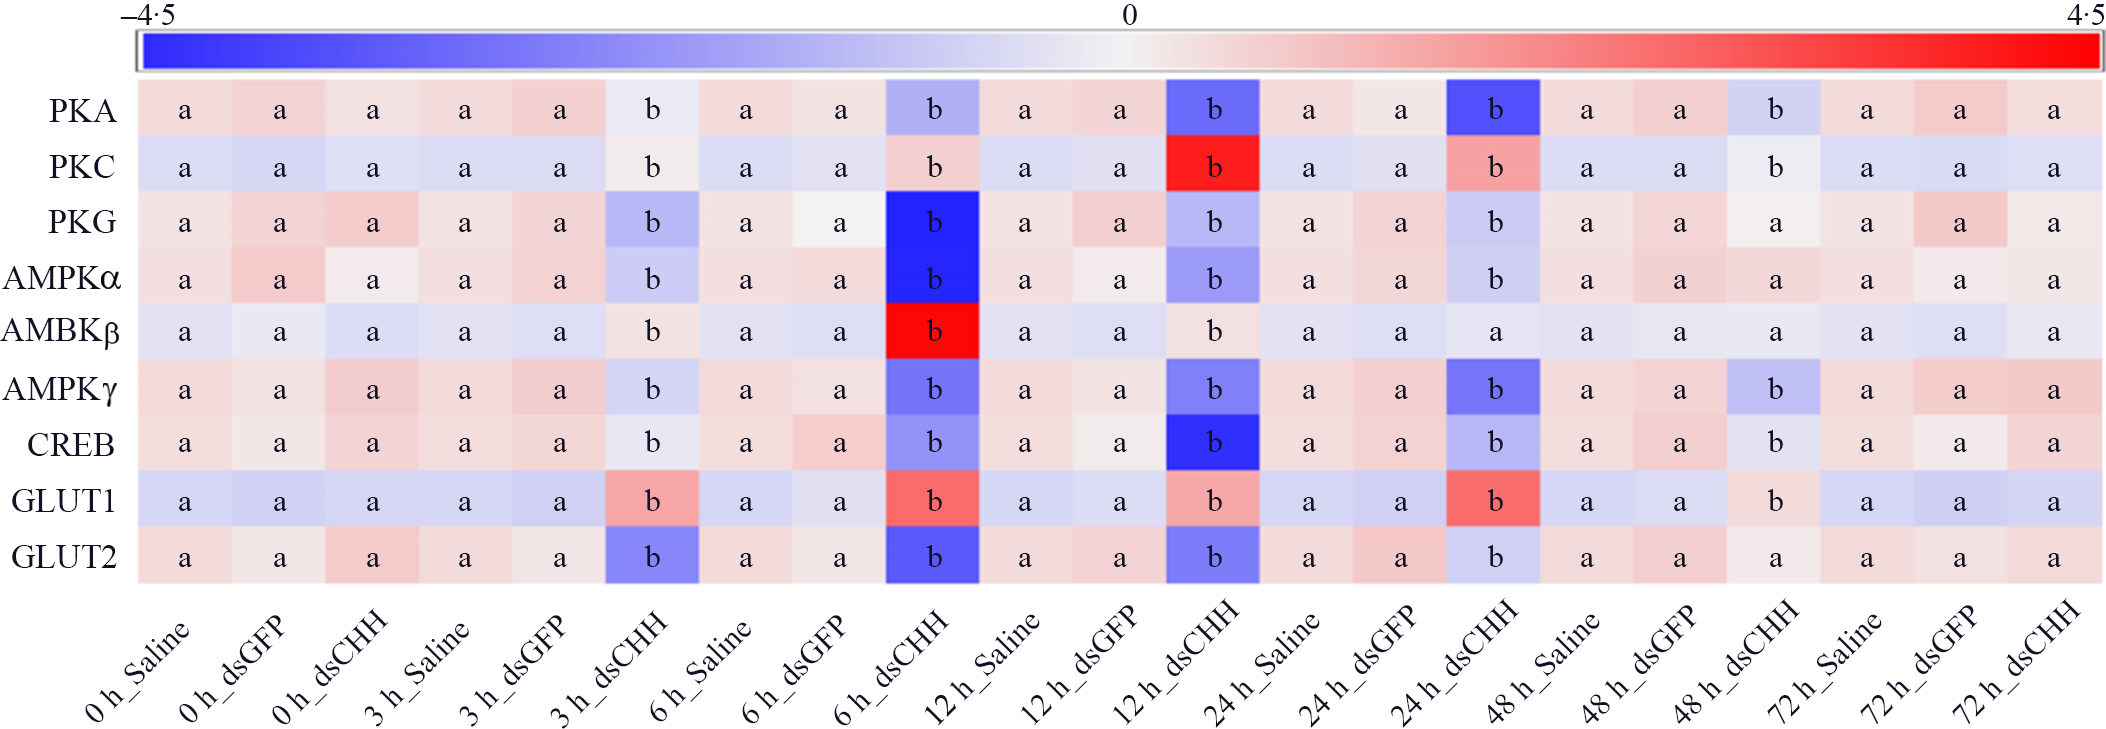
Moreover, the expression levels of protein kinase A (PKA), protein kinase C (PKC) and protein kinase G (PKG) were detected (Fig. 5). The results showed that the level of PKA in CHH dsRNA group was significantly reduced compared with Saline group and GFP dsRNA group during 3–48 h with the lowest value at 24 h, which was only 46·4 % of PKA expression in Saline group, and then it recovered to the level of Saline group 72 h (Fig. 5). However, after ammonia-N exposure, the expression of PKC up-regulated significantly during 3–48 h in CHH dsRNA group, in which the maximum appeared at 12 h (its expression level was 3·67 times of Saline group level), and returned to the level of Saline group at 72 h (Fig. 5). In addition, similar to the expression of PKA, the level of PKG in CHH dsRNA group was significantly lower than those in two control groups during 3–24 h and recovered to the level of Saline group after 48 h (Fig. 5).
In addition, this study detected the gene expression of intracellular glucose metabolism regulatory enzymes-AMPK, including AMPKα, AMPKβ and AMPKγ (Fig. 5). As shown in Fig. 5, the expression of AMPKα in CHH interference group significantly reduced compared with the Saline group during 3–24 h. The lowest value of AMPKα appeared at 6 h which was only 0·36 times as the level of Saline group and then recovered to control levels after 48 h in hepatopancreas of L. vannamei under ammonia-N stress (Fig. 5). The level of AMPKβ in CHH dsRNA group was significantly increased at 3, 6 and 12 h, and the maximum value appeared at 6 h, which was 1·58 times higher than that in Saline group. And there was no significant difference among three groups after 24 h (Fig. 5). Moreover, after CHH knock-down, the level of AMPKγ down-regulated significantly during 3–48 h and then returned to the level of Saline group at 72 h (Fig. 5).
Similarly, the expression of CREB in CHH dsRNA group was significantly lower than those in both Saline group and GFP dsRNA group during 3–48 h and reached the lowest value at 12 h, which was only 37·4 % of the Saline group’, then it recovered to the level of two control groups at 72 h (Fig. 5). Besides, expressions of glucose transporters GLUT1 and GLUT2 were also measured in this study. The results showed that the absence of CHH significant up-regulated the expression of GLUT1 from 3 to 48 h and reached the maximum at 6 h. While contrary to GLUT1, the level of GLUT2 reduced significantly during 3–24 h and also reached the minimum at 6 h (Fig. 5). Moreover, after CHH knock-down, GLUT1 returned to the control level at 72h while GLUT2 48 h later (Fig. 5). In addition, during the experiment, there was no significant difference between GFP dsRNA group and Saline group in these indexes (Figs. 4 and 5).
Effects of crustacean hyperglycaemic hormone RNA interference on glycogen synthesis and decomposition of Litopenaeus vannamei under ammonia-nitrogen stress
Glycogen content, GCS activity and GP activity in hepatopancreas and muscle were detected in this study to understand the glycogen synthesis and decomposition process in L. vannamei under ammonia-N stress (Fig. 6). The results showed that after ammonia-N exposure, the content of glycogen in hepatopancreas increased during 6–24 h (the maximum value at 12 h) and returned to the initial level after 48 h, while muscle glycogen content enhanced during 3–48 h (the highest value at 6 h) and recovered to the initial concentration at 72 h (Fig. 6(a) and (b)). When CHH was silenced, the levels of glycogen in both hepatopancreas and muscle were significantly higher than Saline group’s during 6–48 h (Fig. 6(a) and (b)). Besides, in CHH dsRNA group, the highest value of hepatopancreas glycogen appeared at 12 h and the maximum of muscle glycogen at 6 h, and both returned to the level of Saline group at 72 h (Fig. 6(a) and (b)).
Effects of crustacean hyperglycaemic hormone (CHH) RNA interference on glycogen content in hepatopancreas (a), glycogen content in muscle (b), glycogen synthetase (GCS) activity in hepatopancreas (c), GCS activity in muscle (d), glycogen phosphorylase (GP) activity in hepatopancreas (e) and GP activity in muscle (f) of Litopenaeus vannamei after ammonia-nitrogen exposure 72 h. Data (mean values with their standard errors; n = 6 × 9 shrimp per treat = 54 shrimp) at the same exposure time marked with different letters are significantly different (ANOVA, P < 0·05). ![]() , Saline;
, Saline; ![]() , GFP dsRNA;
, GFP dsRNA; ![]() , CHH dsRNA. GFP, green fluorescent protein.
, CHH dsRNA. GFP, green fluorescent protein.
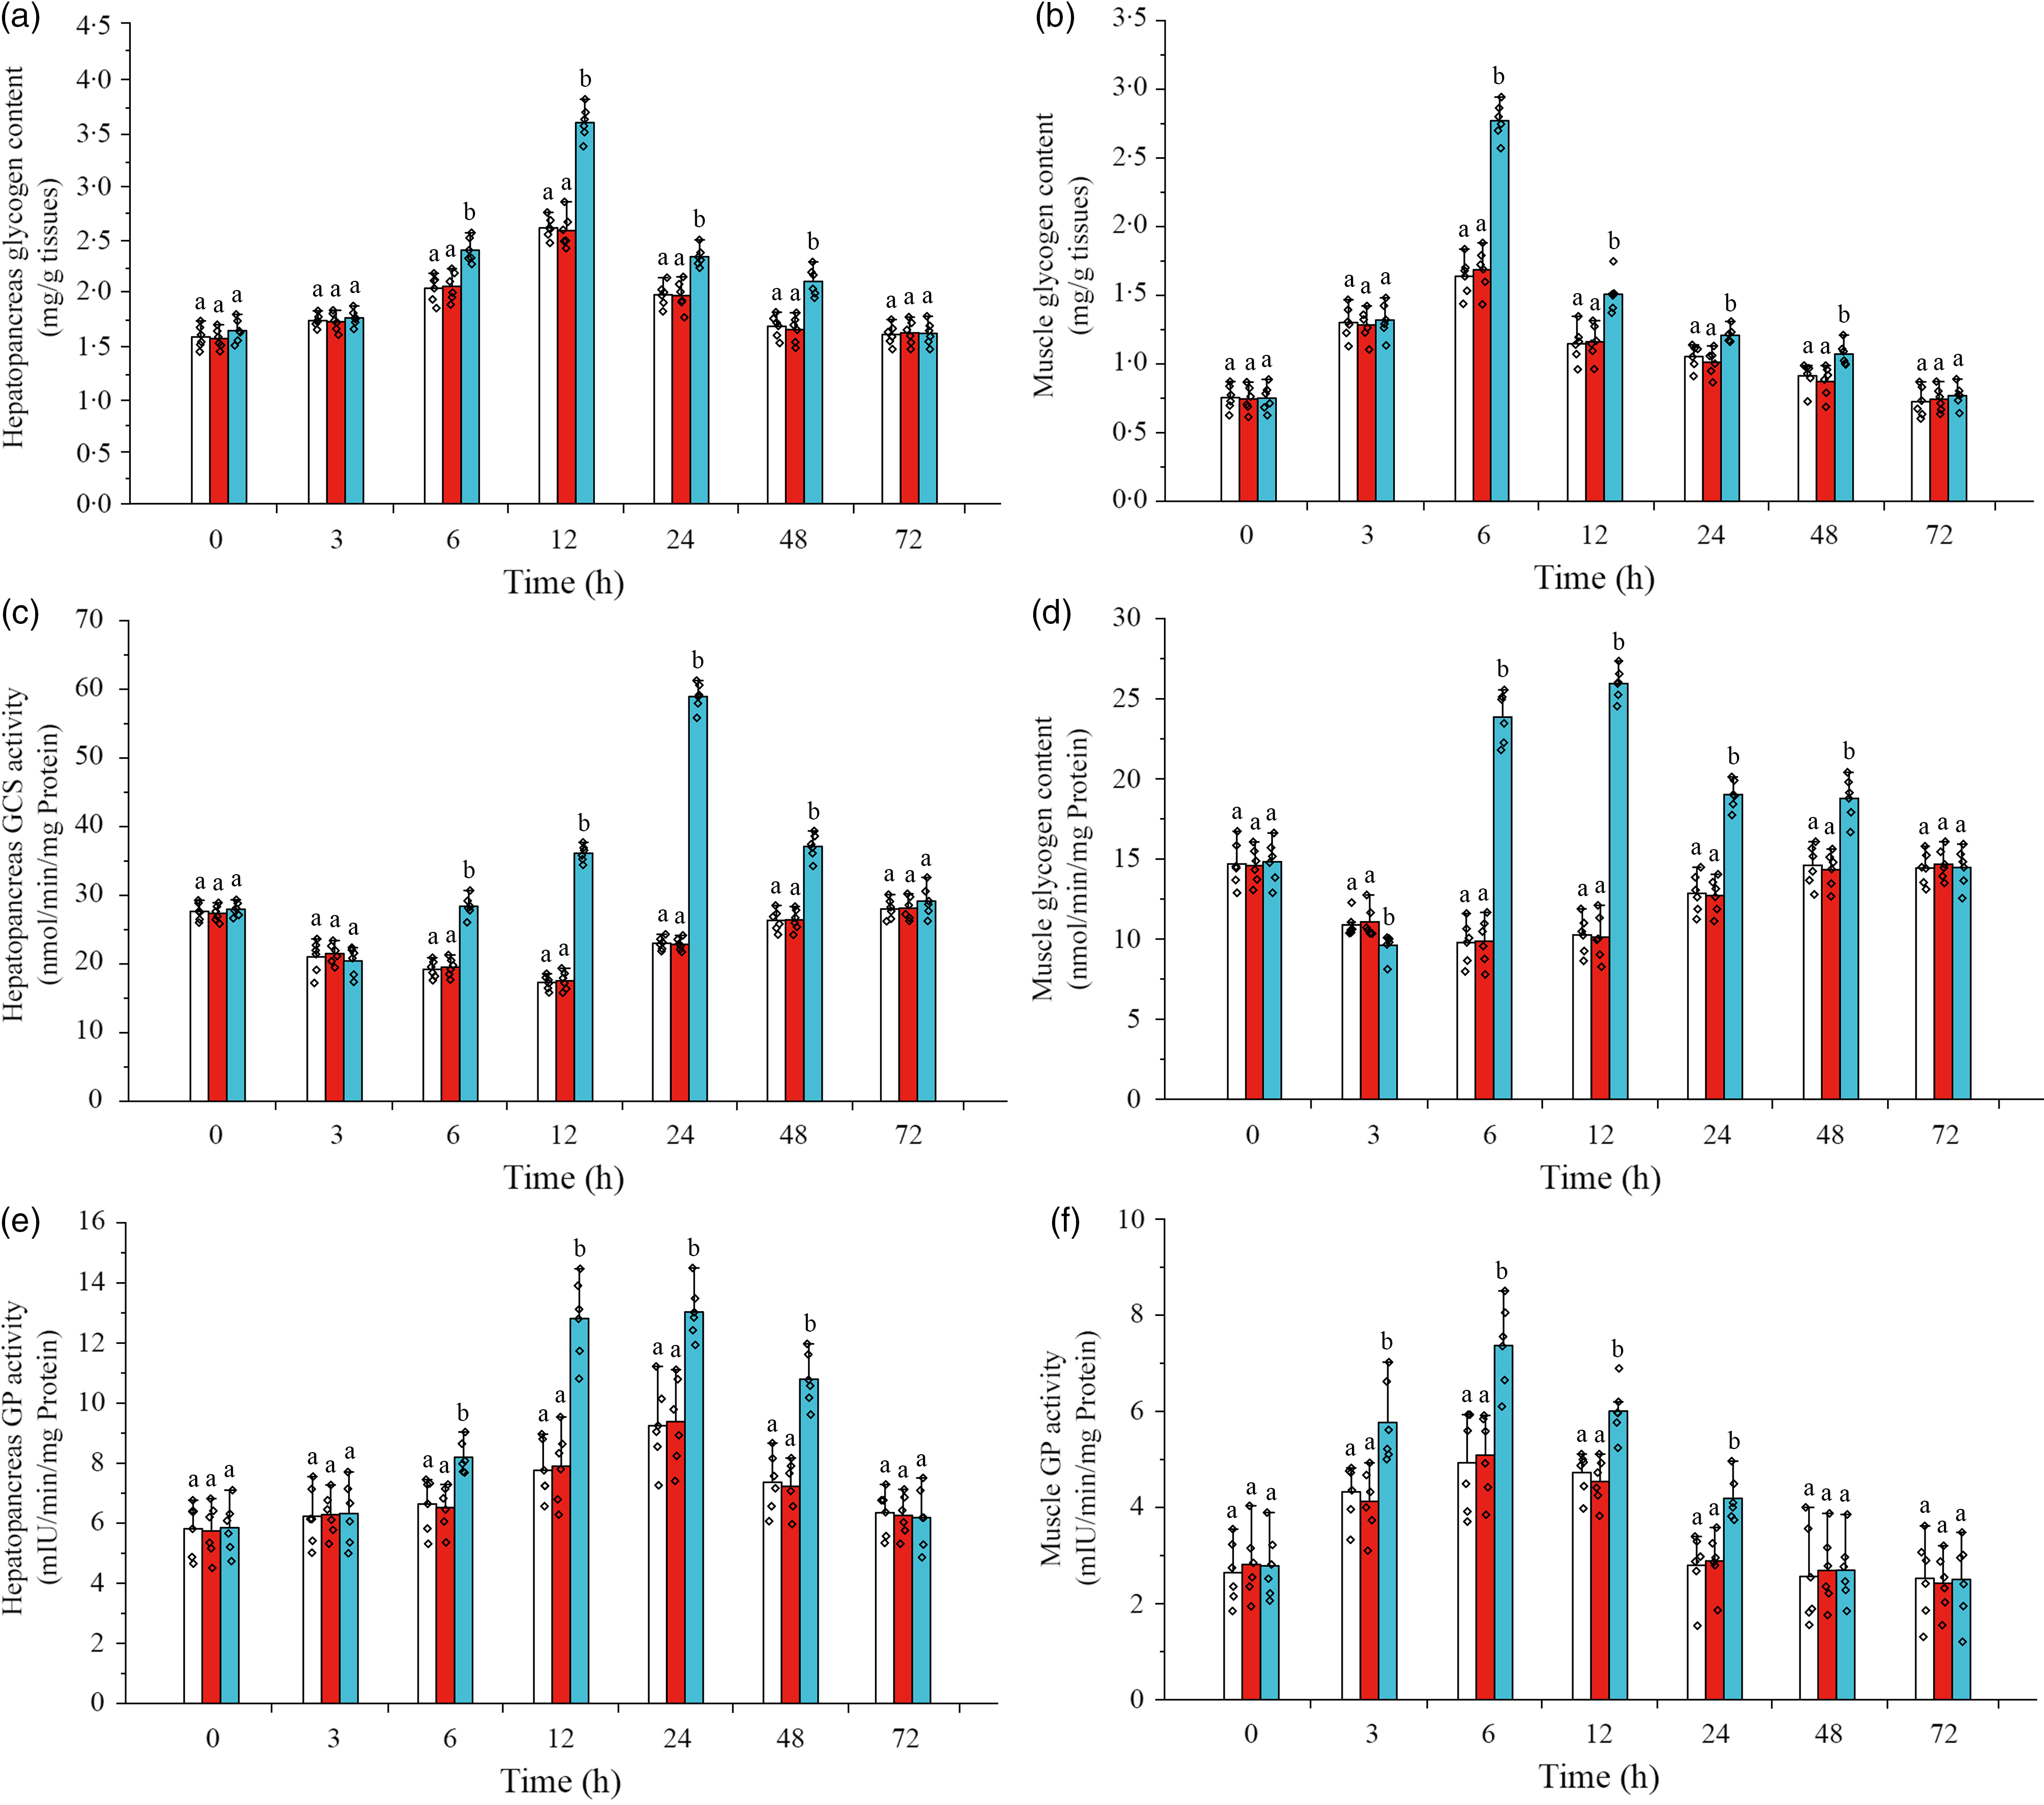
Moreover, it was shown that the activity of GCS in hepatopancreas decreased gradually after ammonia-N exposure, reached the minimum at 12 h and then gradually returned to the initial level after 48 h (Fig. 6(c)). After CHH knock-down, the activity of GCS was significantly higher than that in Saline group during 6–48 h (the highest value at 24 h) and recovered to the control level at 72 h in hepatopancreas of L. vannamei under ammonia-N stress (Fig. 6(c)). Similarly, under ammonia-N stress, the activity of GCS in the muscle decreased first and then gradually recovered (the minimum value at 6 h) to the initial activity after 48 h (Fig. 6(d)). However, in the CHH dsRNA group, muscle GCS activity was significantly down-regulated at 3 h but significantly up-regulated during 6–48 h compared with GCS activity in two control groups (Fig. 6(d)). Besides, the maximum value of muscle GCS activity appeared at 12 h in the CHH dsRNA group with no significant difference among the three groups at 72 h (Fig. 6(d)).
As shown in Fig. 6(e), GP activity increased gradually in hepatopancreas of L. vannamei under ammonia-N stress, reached the maximum value at 24 h and returned to the initial activity at 72 h (Fig. 6(e)). However, the muscle GP activity increased during 3–24 h after ammonia-N exposure (peaked at 6 h) and recovered to its original activity after 48 h (Fig. 6(f)). Under ammonia-N stress, the activity of hepatopancreas GP was significantly higher than that in the control group during 3–24 h after CHH silence with no significant change among three groups at 72 h (Fig. 6(g)). While in the CHH dsRNA group, GP activity in muscle increased significantly during 3–24 h (the highest activity appeared at 6 h) and returned to the level of two control groups after 48 h (Fig. 6(g)). In addition, no significant difference in glycogen content, GCS activity and GP activity of hepatopancreas and muscle between GFP dsRNA group and Saline group was detected (Fig. 6).
Effects of crustacean hyperglycaemic hormone RNA interference on the expression of glycolysis and gluconeogenesis pathway factors in hepatopancreas of Litopenaeus vannamei under ammonia-nitrogen stress
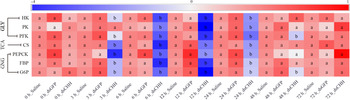
In this study, the expression of HK, PK and PFK in GLY, citrate synthase in tricarboxylic acid (TCA) cycle and PEPCK, FBP and G6P in GNG were detected in hepatopancreas (Fig. 7). The level of HK in CHH dsRNA group was significantly lower than that in two control groups from 3 to 24 h. The minimum value of HK was 0·58 times of Saline group’s level at 12 h, but there was no significant difference among three groups after 48 h (Fig. 7). However, after CHH knock-down, the level of PK decreased significantly during 6–24 h and the lowest level of PK also appeared at 12 h, which was similar to the alteration of HK (Fig. 7). Besides, the level of PFK decreased significantly from 3 h and reached the minimum at 12 h (45·4 % of Saline group’s level) in hepatopancreas of L. vannamei under NH3-N stress, then increased gradually and returned to the level of two control groups at 72 h (Fig. 7). Moreover, the expression of citrate synthase was significantly decreased from 3 to 24 h in the CHH dsRNA group, whose minimum was 0·436 times of Saline group’s level at 6 h, recovering to the control level after 48 h (Fig. 7).
Effects of crustacean hyperglycaemic hormone (CHH) RNA interference on the glycolysis (GLY), tricarboxylic acid cycle (TCA) and gluconeogenesis (GNG) in hepatopancreas of Litopenaeus Vannamei after ammonia-nitrogen exposure, including the expressions of GLY rate-limiting enzymes hexokinase (HK), pyruvate kinase (PK) and phosphofructokinase (PFK), TCA key enzymes citrate synthase (CS), and GNG critical enzymes phosphoenolpyruvate carboxykinase (PEPCK), fructose diphosphate (FBP) and glucose-6-phosphatase (G6P). The mRNA expression was normalised to β-actin and EF1α genes, and the mean values of target gene normalised transcript levels in each treatment were used to draw the heat map (n = 6 × 9 shrimp per treat = 54 shrimp). Data at the same exposure time marked with different letters are significantly different (ANOVA, P < 0·05).
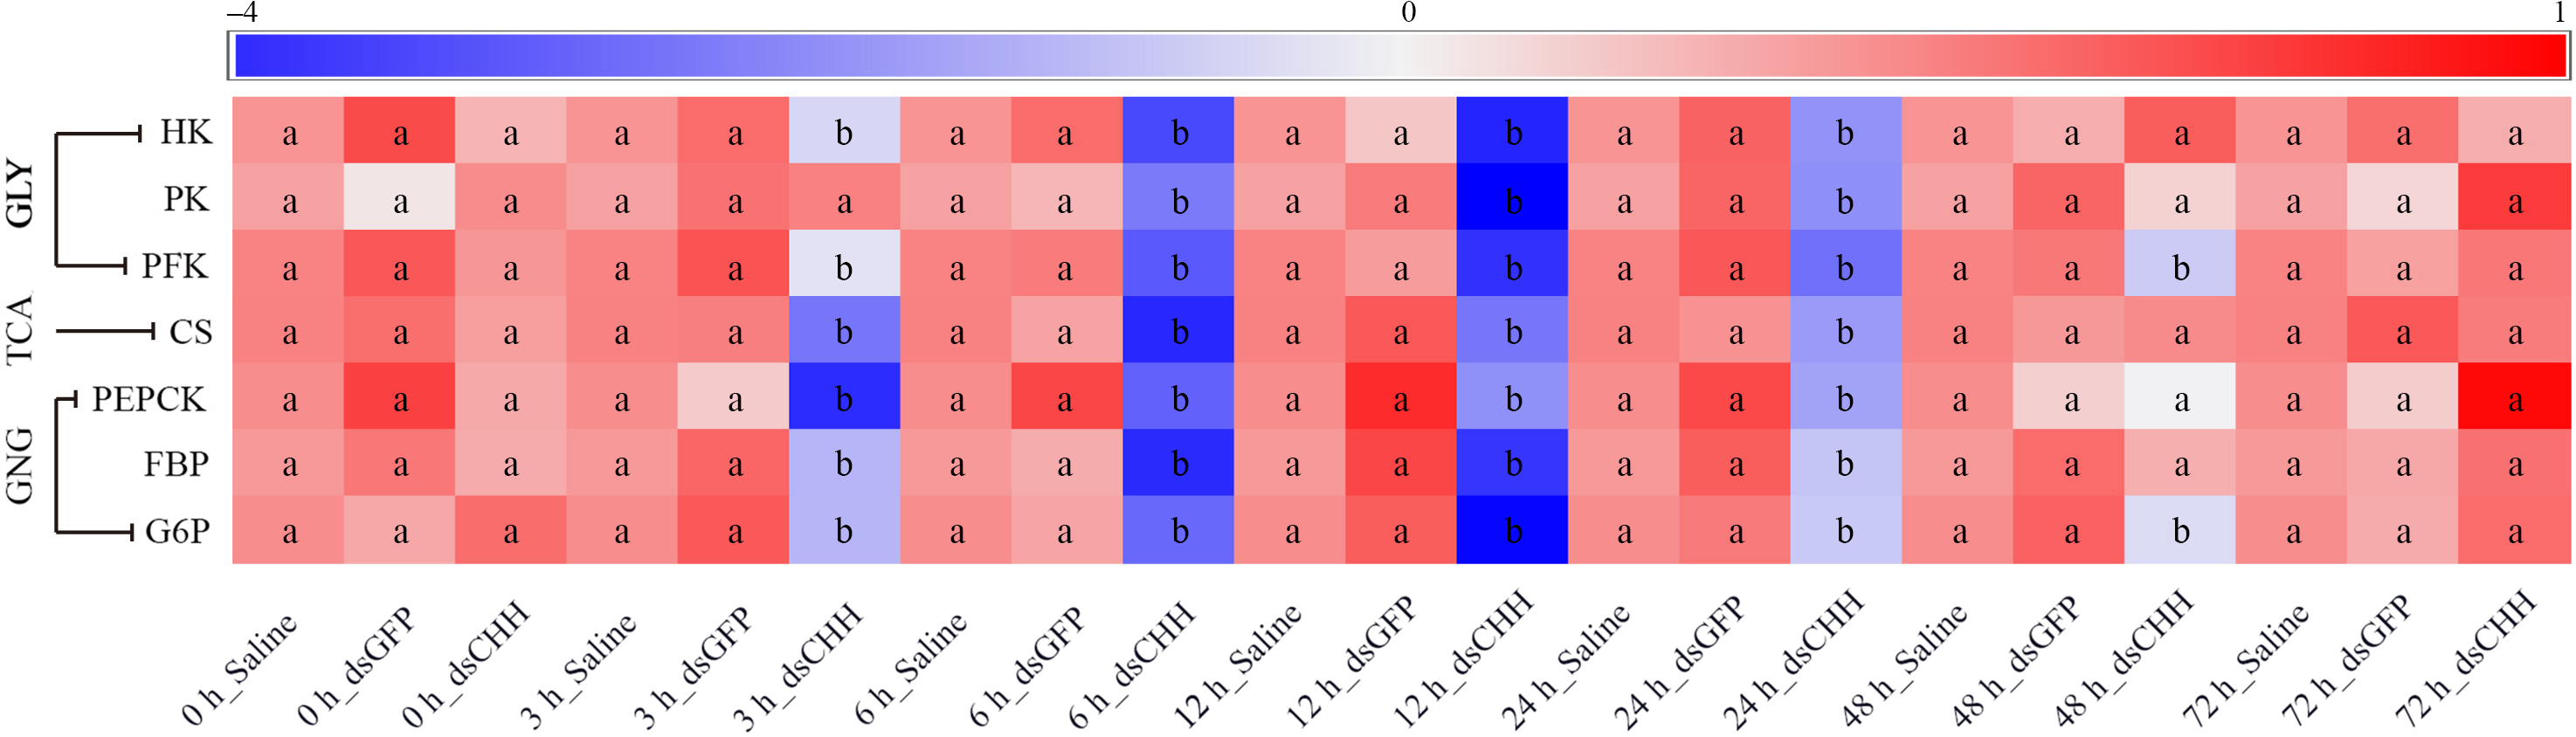
In addition, the expression pattern of GNG enzymes was similar to the expression of GLY and TCA enzymes. After CHH knock-down, the level of PEPCK, FBP and G6P decreased in varying degrees and returned to the Saline group’s level at 48, 48 and 72 h, respectively (Fig. 7). Among them, the expression of PEPCK in CHH dsRNA group reached the lowest value at 3 h, which was significantly lower than that in Saline group and GFP dsRNA group during 3–24 h (Fig. 7). Similarly, after CHH interference, the expression of FBP in hepatopancreas of L. vannamei decreased significantly from 3 to 24 h and reached the minimum at 6 h, which was 0·548 times as Saline group’s (Fig. 7). However, the level of G6P in CHH silencing group decreased significantly during 3–48 h, and the minimum value appeared at 12 h (only 52·6 % of Saline group’s level) (Fig. 7). In addition, the expression of these critical enzymes in GLY, TCA and GNG did not change significantly between Saline group and GFP dsRNA group (Fig. 7).
Discussion
Effects of crustacean hyperglycaemic hormone on neuroendocrine factors and hepatopancreas intracellular glucose metabolism signalling transduction pathways of Litopenaeus vannamei after ammonia-nitrogen exposure
Studies on the regulation mechanism of glucose metabolism in crustaceans under environmental stress are limited, but reports on immune and ammonia-N excretion indicate that the regulatory pathway is the process by which neuroendocrine factors act on intracellular signalling transduction pathways (second messengers – protein kinases – nuclear transcription factors) by binding to their corresponding cell membrane receptors(Reference Zhang, Pan and Xu8,Reference Si, Pan and Wang25,Reference Tong, Wei and Pan38) . Previous studies have confirmed the function of neuroendocrine factors (CHH and biogenic amines) on haemolymph glucose in crustaceans(Reference Camacho-Jiménez, Sánchez-Castrejón and Ponce-Rivas47,Reference Komali, Kalarani and Venkatrayulu48) , while the regulatory pathways are still unclear. The recent research of our group showed that CHH (HM748790) significantly increased the level of haemolymph glucose in L. vannamei (Reference Xu, Pan and Zhang27). In this study, the level of haemolymph glucose increased after ammonia-N exposure for 3 h. Similarly, it was found that the haemolymph glucose of shrimp increased significantly after acute handling stress at 1 and 2 h(Reference Wang, Chen and Xu30). In Neohelice granulata, the content of glucose in haemolymph also increased significantly after 1 h salinity stress(Reference Model, Dos Santos and Da Silva49). Moreover, the results of pre-experiment showed that in the normal seawater, the interference efficiency of dsCHH was 69·2 % at 24 h, but no significant changes in the expressions of other related genes were detected. Previous studies have showed that the interference efficiency of dsCHH in Scylla paramamosain was 55 % at 24 h(Reference Liu, Liu and Chen50) and 20 μg CHH dsRNA also significant decreased haemolymph glucose concentration at 24 h in Litopenaeus schmitti (Reference Lugo, Morera and Rodríguez51). Therefore, our study indicates that dsCHH RNA significantly inhibits the transcription level of CHH in L. vannamei. In addition, after CHH knock-down, haemolymph glucose content increased significantly in L. vannamei under ammonia-N stress, then decreased remarkably compared with the two control groups and returned to the original level at 72 h. These results suggest that CHH affects the level of haemolymph glucose in L. vannamei under ammonia-N stress, so in order to explore the glucose metabolism signalling transduction pathways, the changes of neuroendocrine factors, hepatopancreas signalling transduction-related factors, glycogen metabolism, GNG and GLY were measured in this study.
Previous studies have confirmed that the increase in CHH and biogenic amines after ammonia-N stress can significantly up-regulate the level of haemolymph glucose in crustaceans(Reference Si, Pan and Wang25,Reference Xu, Pan and Zhang27,Reference Wang, Chen and Xu30,Reference Camacho-Jiménez, Sánchez-Castrejón and Ponce-Rivas47) . Among the biogenic amines (DA, 5-HT and NE), DA has the strongest function of regulating haemolymph glucose(Reference Aparicio-Simón, Pión and Racotta31,Reference Babu, Kalarani and Padmavati32) . To explore the regulatory pathways of glucose metabolism in L. vannamei after ammonia-N exposure, the contents of neuroendocrine factors (CHH and DA) were detected. Besides, the changes of CHH and DA cell membrane receptors, second messengers, protein kinases/regulatory enzymes, nuclear transcription factor and GLUT were measured in hepatopancreas which is the target organ of glucose metabolism. The results showed that under ammonia-N stress, the levels of CHH and DA increased significantly, while after CHH knock-down, they were significantly lower than those of Saline and GFP dsRNA groups. Our results showed that there is a similar trend among the change patterns of CHH, DA and glucose in haemolymph (first increase, then decrease and recovery), suggesting that the haemolymph glucose was regulated by the neuroendocrine factors (CHH and DA) under ammonia-N stress. Subsequently, the expressions of GC and DA membrane receptors (DA1R and DA4R) in the hepatopancreas were detected, which showed significant decrease in GC and DA1R (type 1 receptor), compared with the obvious increase in DA4R (type 2 receptor). Previous studies have shown that these two types of DA receptors can be divided into promoting type receptor and inhibiting type receptor, in which DA1R is promoting type receptor that activates cAMP to transmit signalling in Marbled crayfish (Reference Shiratori, Suzuki and Momohara52), P. monodon (Reference Sukthaworn, Panyim and Udomkit53) and Macrobrachium rosenbergii (Reference Chang, Ke and Chang54), while DA4R is inhibiting type receptor that inhibits cAMP but activates DAG to transmit signalling in L. vannamei (Reference Zhang, Pan and Xu8,Reference Zhao, Pan and Ren24,Reference Tong, Wei and Pan38) . The expression patterns of GC, DA1R and DA4R in haemocytes and gills of L. vannamei under salinity and ammonia-N stress were similar to this study(Reference Zhao, Pan and Ren24,Reference Si, Pan and Wang25,Reference Zhang, Pan and Wei29) . Besides, the contents of cAMP, cGMP and DAG in the hepatopancreas were increased after ammonia-N exposure, while they were significantly down-regulated post CHH-silenced. Correspondingly, the levels of protein kinases (PKG and PKA), the downstream of second messengers, were significantly decreased in the CHH dsRNA group, while the level of PKC was significantly increased. Similarly, the expression of CREB decreased significantly when CHH was silenced. In crustaceans, previous reports showed that CHH acted on cGMP-PKG-CREB signal transduction pathway via GC, and DA worked on cAMP-PKA-CREB and DAG-PKC-CREB pathways through affecting DA1R/DA4R(Reference Si, Pan and Wang25,Reference Zhang, Pan and Wei29) . The results of this study combined with these reports suggest that CHH and DA can transmit glucose metabolism signals into hepatocytes through the membrane receptors of L. vannamei under ammonia-N stress. In addition, as a key regulatory enzyme of glucose metabolism, AMPK is widely involved in this process (glycogen synthesis and decomposition, GNG and GLY) and it has been reported that there are three subunits AMPKα, AMPKβ and AMPKγ in mammals and teleost(Reference Ha, Guan and Kim39,Reference Angin, Beauloye and Horman40) . The sequences of AMPK three subunits have also been reported in L. vannamei (GenBank: KP272116, KP272117 and KP272118), but there are few studies on their involvement in glucose metabolism. In the present study, the expressions of AMPKα and AMPKγ were significantly down-regulated in CHH silenced group, while the level of AMPKβ was significantly up-regulated. It has been reported that PKA affects the physiological function via AMPK, and several studies have found that AMPK can regulate the expression of CREB(Reference Djouder, Tuerk and Suter55,Reference Yuan and Piao56) . Moreover, studies have shown that PKC and PKG can also act on AMPK and then perform its physiological functions(Reference Cho, Casteel and Prakash57–Reference Yasuhiro, Tetsuji and Takayuki59). Therefore, our results suggest that under ammonia-N stress, CHH acts on the cGMP-PKG-AMPKα pathway by the CHH receptor GC and then functions on CREB in L. vannamei. And DA can also affect CREB through the cAMP-PKA-AMPKγ and DAG-PKC-AMPKβ pathways after affecting DA receptors.
In addition, sodium-dependent glucose transporter and facilitated diffusion GLUT have been reported in vertebrates, and these two types of GLUT are important factors involved in glucose transport(Reference Conde-Sieira and Soengas60,Reference Liu, Deng and Sampath61) . It was found that the cAMP-PKA-CREB pathway regulated glucose intake through GLUT1 and CREB also participated in this process via GLUT3 in humans and mammals(Reference Chi, Feng and Wang41,Reference Chen, Zhang and Mi42,Reference Jin, Wei and Yin62) . Besides, dietary carbohydrate supplementation significantly increased the expression of GLUT2 in the hepatopancreas of turbot Scophthalmus maximus (Reference Zhang, Wei and Liu18). Currently, only two kinds of glucose transporters GLUT1 and GLUT2 have been reported in crustaceans. It was found that salinity stress increased the expression of GLUT1 in the hepatopancreas of L. vannamei, while hypoxia also enhanced the expressions of GLUT1 and GLUT2(Reference Martinez-Quintana, Kikuta and Felix-Portillo43,Reference Wang, Li and Chen44,Reference Martínez-Quintana, Peregrino-Uriarte and Gollas-Galván63) . In this study, after CHH interference, the expression of GLUT1 in the hepatopancreas of L. vannamei was significantly up-regulated, while the level of GLUT2 was significantly down-regulated, and both of them returned to the level of control groups at 72 h under ammonia-N stress. It indicates that the functions of GLUT1 and GLUT2 may be different in L. vannamei under ammonia-N stress. Thus, our results suggest that GC activated by CHH can affect CREB to regulate glucose metabolism via cGMP-PKG-AMPKα pathway in the hepatopancreas of L. vannamei under ammonia-N stress, while DA influences cAMP-PKA-AMPKγ and DAG-PKC-AMPKβ pathways involved in these processes after affecting DA1R/DA4R. Subsequently, AMPK and CREB regulate glucose transport by affecting the expression of CLUT to control haemolymph glucose, in which AMPKα and AMPKγ may act on GLUT2 via CREB, similarly, AMPKβ may function on GLUT1 through CREB.
Effects of crustacean hyperglycaemic hormone on glycogen metabolism, glycolysis and gluconeogenesis of Litopenaeus vannamei after ammonia-nitrogen exposure
In order to better understand the glucose metabolism mechanism of shrimp under ammonia-N stress, glycogen metabolism (synthesis and decomposition) of hepatopancreas and muscles, GNG and GLY of hepatopancreas were detected. The results showed that both hepatopancreas glycogen and muscle glycogen increased significantly after ammonia-N stress, and the content of hepatopancreas glycogen was always higher than muscle glycogen during the whole experiment. Similarly, Racotta & Hernández-Herrera(Reference Racotta and Hernández-Herrera64) reported that high concentration of ammonia-N induced a significant increase in glycogen content in the hepatopancreas and muscle of Penaeus vannamei. In addition, the GCS enzyme in the hepatopancreas and muscle decreased before recovered, while glycogen-decomposing enzyme GP first increased and then recovered. Combined with the results of glycogen metabolism and haemolymph glucose, it indicates that in the early stage of ammonia-N stress, the synthesis of glycogen was inhibited and the decomposition of glycogen was enhanced, which leads to an increase in haemolymph glucose at 3 h. In addition, the increase in CHH and glucose levels in the first hours in three groups could be due to the liberation of stored CHH hormones from the sinus gland complex, or other CHH subtypes which were not knocked down might also increase the level of haemolymph glucose in L. vannamei. Therefore, it is necessary to design experiments to further explore the reasons for the increase of haemolymph glucose in shrimp at the early stage of ammonia-N stress in the future. Subsequently, in the middle and late stage, the content of glycogen increased and the synthesis and decomposition of glycogen were up-regulated simultaneously. Thus, the haemolymph glucose level decreased during 12–48 h under ammonia-N stress. It showed that instead of decomposing glycogen, shrimp maintain the stability of haemolymph glucose by synthesising a large amount of glycogen to adapt to the high ambient ammonia-N in the middle and late stage. Therefore, the glucose level of haemolymph in the CHH interference group was significantly higher than that in the Saline group at 3 h. These results suggest that CHH can affect glycogen and haemolymph glucose levels by regulating the activities of GCS and GP. It was reported that the activities of GCS and GP in the hepatopancreas increased after eyestalk resection 2 d in Marsupenaeus japonicus (Reference Nagai, Nagata and Nagasawa17), which was consistent with the change pattern in this study. Moreover, previous reports showed the ability of AMPKα to inhibit the synthesis of glycogen(Reference Ha, Guan and Kim39,Reference Jørgensen, Nielsen and Birk65) . In this study, AMPKα decreased significantly after knock-down of CHH, while the levels of GCS and glycogen increased significantly. Combined with the results of signal transduction pathways in hepatopancreas, it suggests that CHH regulates glycogen metabolism through the cGMP-PKG-AMPKα pathway or through the DAG-PKC-AMPKβ pathway by affecting DA. CHH inhibits glycogen metabolism (both glycogen synthesis and glycogen decomposition) in L. vannamei under ammonia-N stress, which also shows that the regulation of glycogen metabolism by CHH is not as simple as expected; further study needs to explore how CHH inhibits both glycogen synthesis and glycogen decomposition in L. vannamei.
The changes of glycogen and haemolymph glucose are closely related to the process of GLY and GNG. In order to further explore whether CHH regulates the GLY and GNG in shrimp, we detected the expression levels of key enzymes involved in these processes in the hepatopancreas. Previous studies have shown that environmental stress induced significant changes in the levels of GLY-related enzymes in the hepatopancreas of crustacean, including the decrease in HK and PK activities in Portunus trituberculatus (Reference Dai, Wang and Fang66) and L. vannamei (Reference Guo, Wang and Dong22) under low-temperature stress, the up-regulation of PFK in L. vannamei under hypoxia stress(Reference Dai, Wang and Fang66), and the enhance of HK, PK and PFK in L. vannamei under ammonia-N stress(Reference Shan, Geng and Ma11). Besides, environmental stress also affects CHH content in the haemolymph of crustaceans, for example, the content of haemolymph CHH increased significantly in L. vannamei after ammonia-N exposure(Reference Si, Pan and Wang25). These results suggest that CHH may be involved in the regulation of GLY in crustaceans. In this study, after CHH knock-down, the levels of HK, PK and PFK decreased significantly in the hepatopancreas of L. vannamei under ammonia-N stress. And the expression of citrate synthase in TCA was also significantly down-regulated. The results of this study indicate that after CHH silenced, the processes of GLY and TCA in the hepatopancreas of L. vannamei are inhibited under ammonia-N stress, which combines with the increase in level of glycogen finally led to the significant decrease in haemolymph glucose. Thus, CHH can enhance the GLY and TCA of L. vannamei after ammonia-N exposure. Therefore, this study confirms the complexity of the regulation mechanism of physiological metabolism in shrimp under ammonia-N stress, indicating that the energy consumption of shrimp is increased in the early stage of ammonia-N stress, and CHH promotes the processes of GLY and TCA to enhance energy production, which may be used for ammonia-N excretion and immune defence. With the adaptation to the environment, energy consumption gradually recovered, causing the key enzymes of GLY and TCA and haemolymph glucose levels returned to the control group’s level at 72 h. Although the upstream regulatory pathway of GLY has not been reported in crustaceans, studies have shown that glucose will be rapidly phosphorylated by HK and then activates PFK to realise the GLY process when it is ingested into cells by GLUT in vertebrates(Reference Ha, Guan and Kim39,Reference Angin, Beauloye and Horman40) . Besides, previous studies have shown that AMPK activated PFK to regulate the GLY process in heart(Reference Marsin, Bertrand and Rider67), monocytes(Reference Marsin, Bouzin and Bertrand68) and cancer cells(Reference Bando, Atsumi and Nishio69). In this study, the similar change patterns of PKA, PKG, AMPKα, AMPKγ, GLUT2 and PFK were observed in the hepatopancreas of L. vannamei after CHH was knocked down. Moreover, it was reported that in both human oral squamous cell carcinoma and human hepatoma cells, the process of GLY is regulated by the PKA-CREB pathway(Reference Sun, Zhao and Chen70,Reference Lin, Tu and Ma71) . Therefore, combined with the results of signalling transduction factors in the hepatopancreas, this study suggests that CHH affects DA to regulate the GLY mainly through PKA-AMPKγ-CREB-GLUT2 pathway or participate in this process by PKG-AMPKα-CREB-GLUT2 pathway in L. vannamei under ammonia-N stress.
In addition, the expressions of PEPCK, FBP and G6P in the hepatopancreas of L. vannamei decreased significantly at the early stage of ammonia-N stress after CHH knock-down and returned to the Saline group’s at 72 h. It indicates that CHH promoted the GNG of L. vannamei after ammonia-N exposure. Similarly, whether in winter or summer, the expression and activity of PEPCK in crabs (Chasmagnathus granulata) were significantly increased under hypertonic stress, and the GNG was also significantly enhanced under hypoxia stress(Reference Schein, Chitto and Etges23,Reference Schein, Waché and Etges72–Reference Oliveira, Eichler and Rossi74) . Besides, hypoxia also induced the expressions of PFK and FBP in the hepatopancreas of L. vannamei (Reference Cota-Ruiz, Peregrino-Uriarte and Felix-Portillo75), and the GNG rate of L. vannamei also increased significantly after sulphide exposure(Reference Li, Li and Suo76). In catfish, the activities and protein levels of PEPCK, FBP and G6P in the hepatopancreas were also significantly up-regulated under high salinity stress(Reference Saha, Jyrwa and Das77). While the expressions of PEPCK and FBP did not change significantly in the hepatopancreas of M. japonicus after eyestalk ablation(Reference Nagai, Nagata and Nagasawa17). These results suggest the complexity of glucose metabolism regulation in shrimp under environmental stress. Combined with the change pattern of haemolymph glucose, it can be inferred that CHH maintained the haemolymph glucose level by promoting GNG of L. vannamei under ammonia-N stress. Moreover, Kim et al. (Reference Kim, Lee and Park78) reported that the cAMP-PKA-CREB-GLUT pathway promoted GNG in mouse embryonic stem cells. Potthoff et al. (Reference Potthoff, Boney-Montoya and Choi79) also reported that CREB regulated the changes in key GNG enzymes G6P and PEPCK, thereby affecting the rate of GNG in mice. Furthermore, several studies in mammalian showed that AMPK was involved in the regulation of GNG(Reference Angin, Beauloye and Horman40,Reference Foretz, Hébrard and Leclerc80,Reference Guo, Zheng and Liu81) . For example, it has been reported that AMPK controlled the GNG by affecting the change in PEPCK in mice(Reference Santos, Moura and Vitorino82). Combined with the change patterns of intracellular signalling transduction factors, it suggests that CHH specifically affects GC and then acts on cGMP-PKG-AMPKα-CREB pathway to regulate GNG, while DA mainly affects through DA1R to act on the cAMP-PKA-AMPKγ-CREB pathway, or functions on DAG-PKC-AMPKβ-CREB pathway after affecting DA4R to play a role in this process.
Conclusion
In conclusion, this study confirmed that under ammonia-N stress, CHH affects GC and DA affects DA1R and DA4R, thereby transmitting glucose metabolism signals into the hepatopancreas of L. vannamei. After CHH was knocked down, CHH (through cGMP-PKG-AMPKα-CREB pathway) and DA (through cAMP-PKA-AMPKγ-CREB pathway and DAG-PKC-AMPKβ-CREB pathway) regulated glucose transporters (GLUT1 and GLUT2), then promoted glycogen synthesis and decomposition (glycogen content, GCS and GP activities), inhibited GLY (HK, PK, PFK, citrate synthase) and suppressed GNG (PEPCK, FBP and G6P). Thus, they eventually led to an up-regulation of haemolymph glucose synthesis at first and down-regulation subsequently when CHH was silenced. In this study, shrimp showed high tolerance to ammonia-N stress and most of the indicators returned to their initial levels at 72 h. Therefore, this study indicates that CHH inhibits glycogen metabolism and promotes GNG and GLY under ammonia-N stress. This study enriched the physiological adaptation mechanism of shrimp under ammonia-N stress, especially the molecular regulation pathways of CHH on the glucose metabolism in L. vannamei, which provided a foundation for further exploring the physiological metabolic mechanism of crustaceans under environmental stress.
Acknowledgements
The authors would like to thank all the staffs of Laboratory of Environmental Physiology of Aquatic Animal for assistance in the sampling.
The work was supported by the Research and Development Projects in Key Areas of Guangdong Province, China (No. 2020B0202010009).
Conceived and designed the experiments: L. P. and X. Z. Performed the experiments: X. Z., R. T., Y. L., Y. C., M. W. and Q. W. Analysed the data: X. Z. and R. T. Contributed reagents/materials/analysis tools: L. P. and X. Z. Wrote the paper: X. Z. Revising the paper: L. P., Y. L. and L. S.
The authors declare no competing or financial interests.
In this study, all experiments followed the guidelines on animal experiments of Ocean University of China (The Animal Care and Use Committee of Ocean University of China), under permit No. SCXY-B20190122.
Supplementary material
For supplementary material referred to in this article, please visit https://doi.org/10.1017/S0007114521001574