

The increased quality and accessibility of public LiDAR datasets can improve our understanding of archaeological landscapes and enhance future applications of remote sensing and non-destructive approaches. Furthermore, in Italy, where 36.08 per cent of the national territory is covered by forest (ISPRA 2017: 107), landscape archaeology requires adequate tools to pursue research in different types of terrain.
The use of airborne laser applications (ALS or LiDAR) is a well-established research technique in many disciplines. Major efforts have been made to review the use of LiDAR in archaeology and heritage studies, as well as the numerous improvements made to visualisation tools (Opitz & Cowley Reference Opitz and Cowley2013; Forte & Campana Reference Forte and Campana2017). A key issue yet to be addressed, however, is the lack of global coverage of LiDAR datasets, which often hinders access to relevant archaeological sites or research areas. The lack of free global LiDAR datasets contrasts with other well-known imagery services, such as Google Earth or Bing, multispectral imagery services, such as the recent Sentinel 2, or other, coarser, elevation models, such as SRTM (provided by NASA) or TamDEM hosted by the German Space Agency DLR (TanDEM-X n.d.).
Archaeological LiDAR in Italy
This paper focuses on the availability of Italian LiDAR data as a tool to improve archaeological research in mountainous areas, particularly in the southern regions. Remarkable results from early trials of ALS on the Italian Peninsula include the discovery of Etruscan road-systems (Cifani et al. Reference Cifani, Opitz and Stoddart2007a & Reference Cifani, Opitz and Stoddartb). This has increased knowledge of ancient landscape use in the Ager Faliscus (territory of the Etruscan city of Falerii Novi, north of Rome), and has also provided a basis for field survey and heritage management. Campana et al. (Reference Campana, Bianchi, Fichera, Lai and Sordini2012) were involved in advancing the combination of remote sensing and field techniques, including the early use of LiDAR data in their study of Grosetto and Siena, and as a research tool within the BREBEMI project.
The datasets from these early LiDAR applications arose from the private sector, created by private companies under the order of public institutions and universities. The Ager Faliscus datasets, for example, were derived from a partnership between Cambridge University and the Natural Environmental Research Council Airborne Research and Survey Facility (Cifani et al. Reference Cifani, Opitz and Stoddart2007b: 169). No institutional data repository was, however, created for public use. This is not the only case; recently, the BBC sponsored a LiDAR flight over the ancient capital of Sarmizegetusa in Romania to gather data for a documentary, but which would later be used for an analysis of the region’s landscape (Fonte & Oltean Reference Fonte and Oltean2017).
A little bit of history
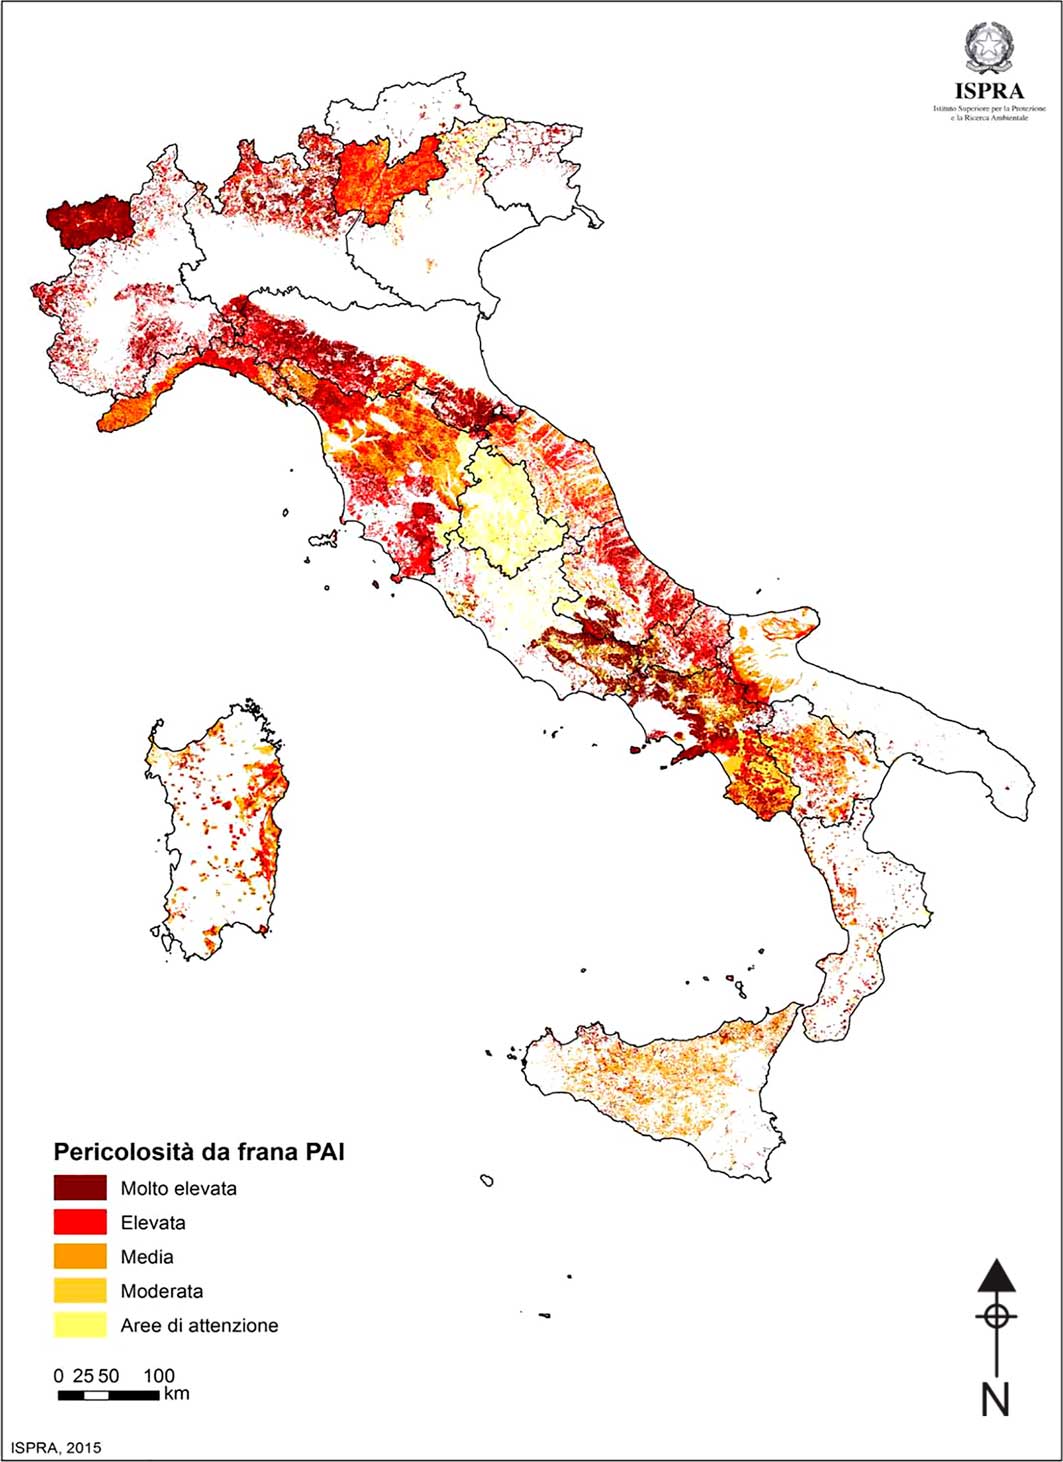
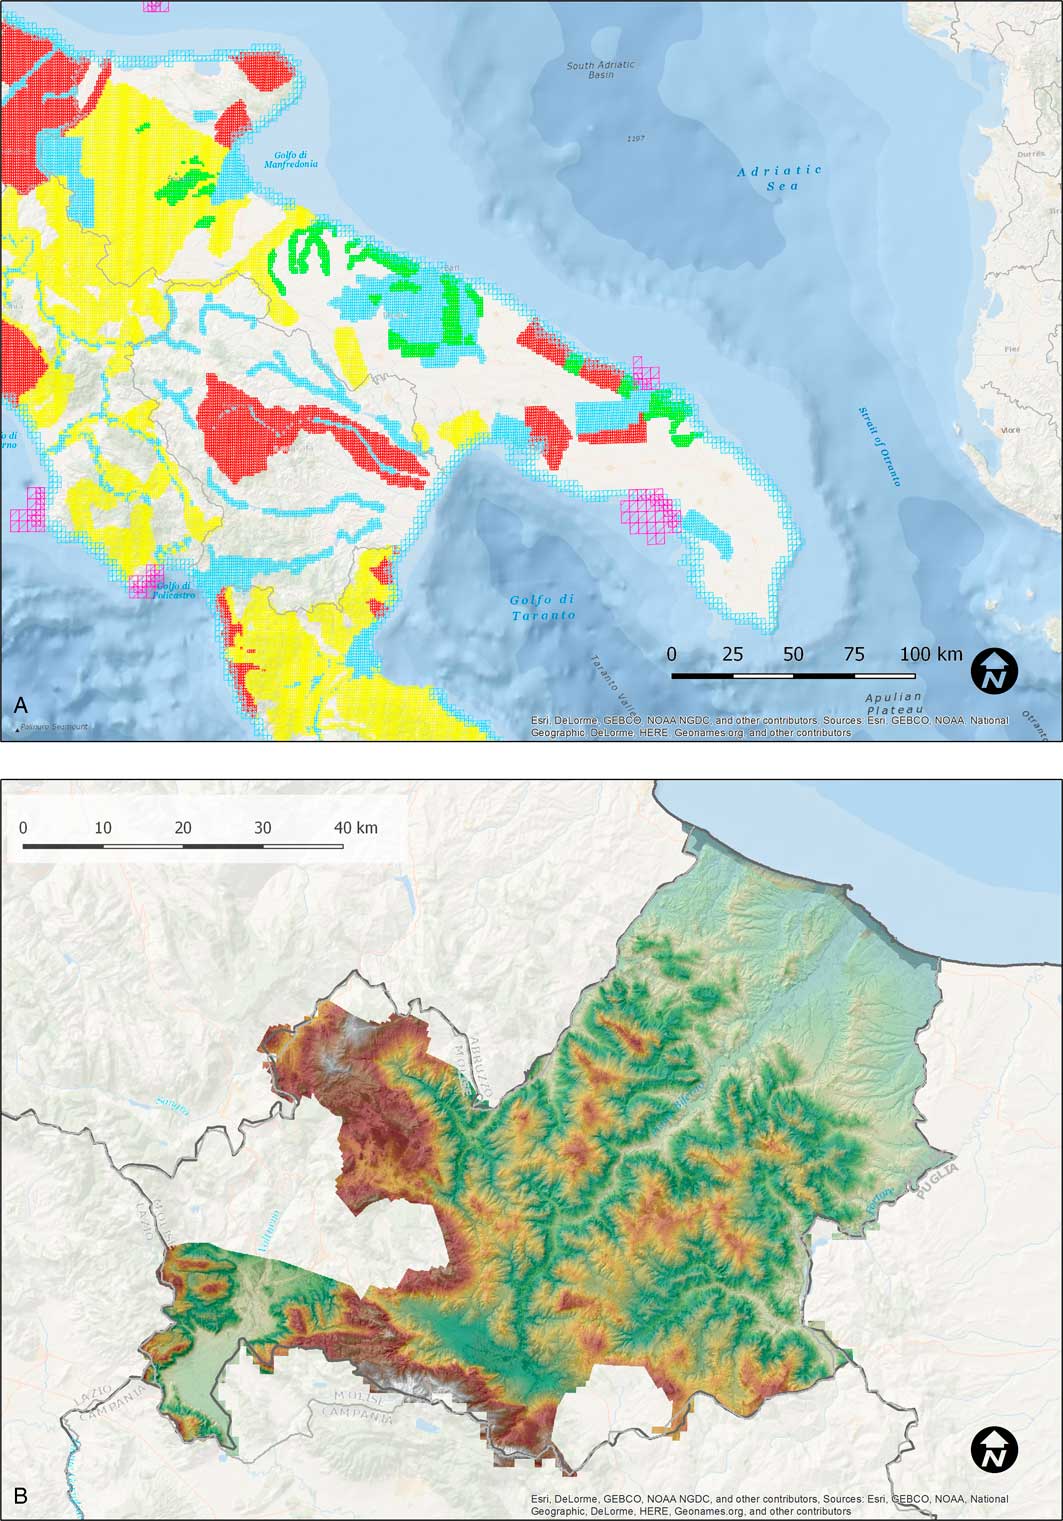
Public LiDAR datasets in Italy can be attributed to Parliamentary Act 179/2002 (Parlamento Italiano n.d.), which first identified the need for high-accuracy, remote-sensing products to monitor areas of high hydrogeological risk (Figure 1). The Piano Straordinario di Telerilevamento (Extraordinary Remote-Sensing Plan), or PST, was launched in 2006 to fulfil this Act, and has resulted in a radical change in the availability of LiDAR data for the Italian peninsula. The plan allows for public access to the acquired data through the cartographic server Portale Cartografico Nazionale, following the European INSPIRE Directive (Eur-Lex n.d.). The PST was achieved through three different phases (Figure 2):
— First phase (2008–2009): coverage of the coastline and main river beds.
— Second phase (2010–2011): coverage of areas with high hydrogeological risk.
— Third phase (2013–2015): coverage of areas at risk of landslides, and secondary fluvial networks.
Landslide risk according to ISPRA 2015 report (map by ISPRA).
A) Phasing of the LiDAR coverage by Quadro di unione. Blue: first phase; red: second phase; yellow and green: third phase. B) Digital terrain model LiDAR—derived from Molise region (figure by Jesús García Sánchez).
Other regions and institutions have also created their own LiDAR data. The GeoPortale Veneto, for example, provides access to data created by Regione Veneto, local institutions (e.g. BIM Adige, ETRA, Comune di Padova) and Treviso Province.
How to access Italian LiDAR data
As the GeoPortale Nazionale provides data in WMS (Web Map Service) format, the processed data and previously created digital terrain model (DTM) can be visualised openly and for free using desktop GIS (geographic information system) software, such as QGIS or ArcGIS. Aerial archaeology is, however, a mature discipline, and many archaeologists have developed sophisticated ways of assessing raw datasets (Opitz & Cowley Reference Opitz and Cowley2013; Forte & Campana Reference Forte and Campana2017). Where possible, I recommend using raw data, which are not accessible from the GeoPortale Nazionale. The point density of approximately one point per square metre means that these data can be used for a range of archaeological applications. The complete raw data includes the following files and formats:
1. Data
a Digital surface model first (return) (.asc)
b. Digital surface model last (return) (.asc)
c. Digital terrain model (.asc)
d. Intensity (.tif)
e. Metadata (.xml)
f. Point data (.xyz)
2. Grey data (as recorded by the airborne LiDAR sensor)
a. Lasclass (.las)
b. Metadata (.xml)
3. Tiles/Quadro unione (.shp)
The raw data can only be accessed by contacting the Ministero dell’Ambiente e della Tutal del Territorio e del Mare. (The email address for the distribution of the PST data is: datipst@minambiente.it.)
Ordering LiDAR data requires a brief description of the intended use, a shapefile indicating the spatial boundaries of the required data and the type of data required. The best practice for ordering data is as follows:
1. Load regional WMS data with LiDAR-derived DTM into a GIS project (regional WMS can be retrieved from http://www.pcn.minambiente.it/mattm/servizio-wms/).
2. Check the availability of data for the research area, and then draw a polygon of the area to be requested from the Ministero dell’Ambiente.
Once the application is approved, you will receive confirmation indicating the expenses incurred through searching the archive and preparing the data for submission, as well as copyright forms to be signed by the applicant. In due time, the datasets will arrive via FTP (file transfer protocol).
How to deal with the data
There are several methods available to analyse these datasets, depending on the complexity of the acquired files. Open-source and commercial tools may be combined to manage, visualise and analyse point data (.xyz). Appropriate analytical software includes:
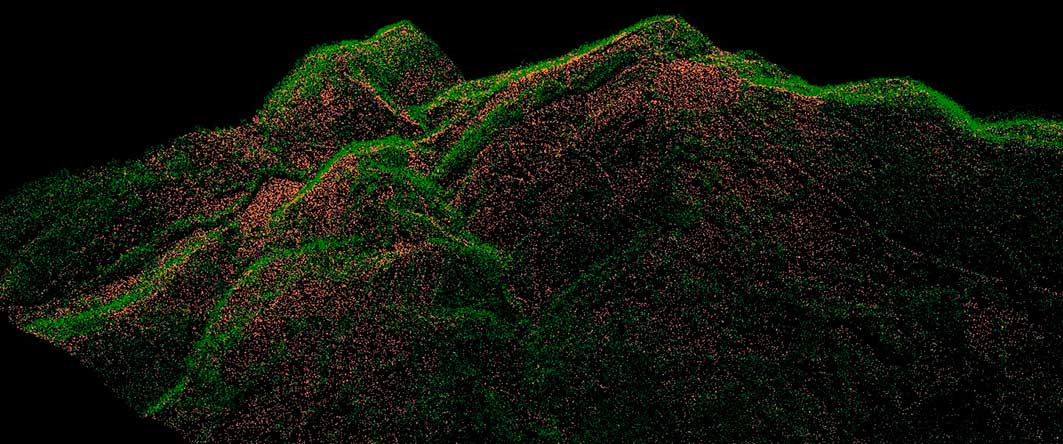
∙ Fugroviewer (to visualise datasets) (Figure 3).
∙ Lastools to perform classifications from the console or through ArcGIS.
∙ SAGA (QGIS) to rasterise and filter ground classifications (i.e. resampling filter; Conrad et al. Reference Conrad, Bechtel, Bock, Dietrich, Fischer, Gerlitz, Wehberg, Wichmann and Böhner2015).
∙ RVT (relief visualisation toolbox) to experiment with different data visualisation (Zaksek et al. Reference Zaksek, Ostir and Kokalj2011).
Castelriporso (Longano, Isernia) site point cloud in Fugroviewer. Brown: bare ground; green: vegetation (data by LERC Project; figure by Jesús García Sánchez).
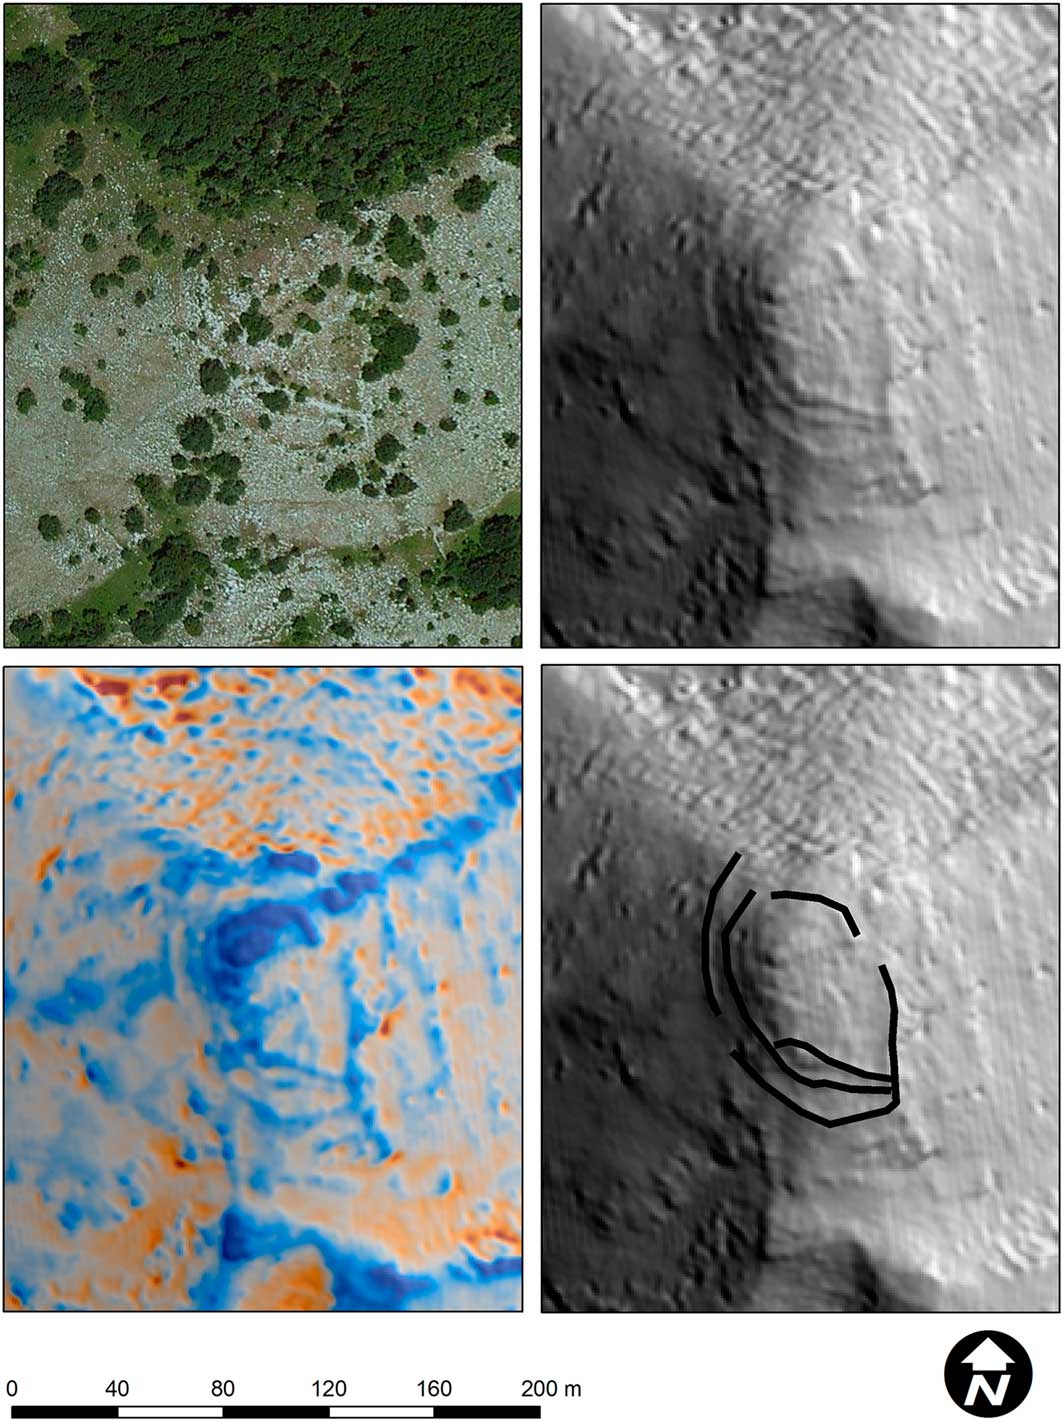
The workflow applied in our recent study of Samnite hillforts in Molise is a useful example here and has been described in a Lasmoon post (Rapidlasso n.d.). The main aim of this project is to produce and integrate non-invasive tools to study a non-urban society and one of its main phenomena—the habitation of hillforts. The creation of LiDAR visualisation and interpretation of large hillforts is being combined with intensive field survey of forest environments. Since 2015, a number of hillfort sites have been studied using similar LiDAR datasets and technical approaches allowing future comparison of results and procedures. The sites studied by the Leiden University field school (Stek et al. Reference Stek, Pelgrom, Casarotto, Garcia Sanchez, Gotz, Hamel, Iannantuono, Kalkers, Termeer and Waagen2016) are Lo Monaco, Monte San Paolo, Casteriporso, Civitella di Longano and Montagna di Gildone (Molise) (Figure 4). Moreover, other types of sites have been studied using available Italian LiDAR, such as the large Archaic and Hellenistic urban centres of Satricum (Lazio) (Figure 5) and Muro Tenente (Puglia), the former examined by Jesús García Sánchez, and the latter by Jitte Waagen, or Monte Vairano (Molise) (Figure 6). The output will contribute to a better understanding of the chronology and function of the occupation of these settlements.
Civitella (Longano, Isernia) hilltop site LiDAR. Top left) local relief model; top right) orthophoto Molise region 2007; bottom-left) multi-hillshade; bottom-right) Skyview factor calculated with relief visualisation toolbox. All processed in SAGA GIS (image after Stek et al. Reference Stek, Pelgrom, Casarotto, Garcia Sanchez, Gotz, Hamel, Iannantuono, Kalkers, Termeer and Waagen2016: fig. 8) (data by LERC Project; figure by Jesús García Sánchez).
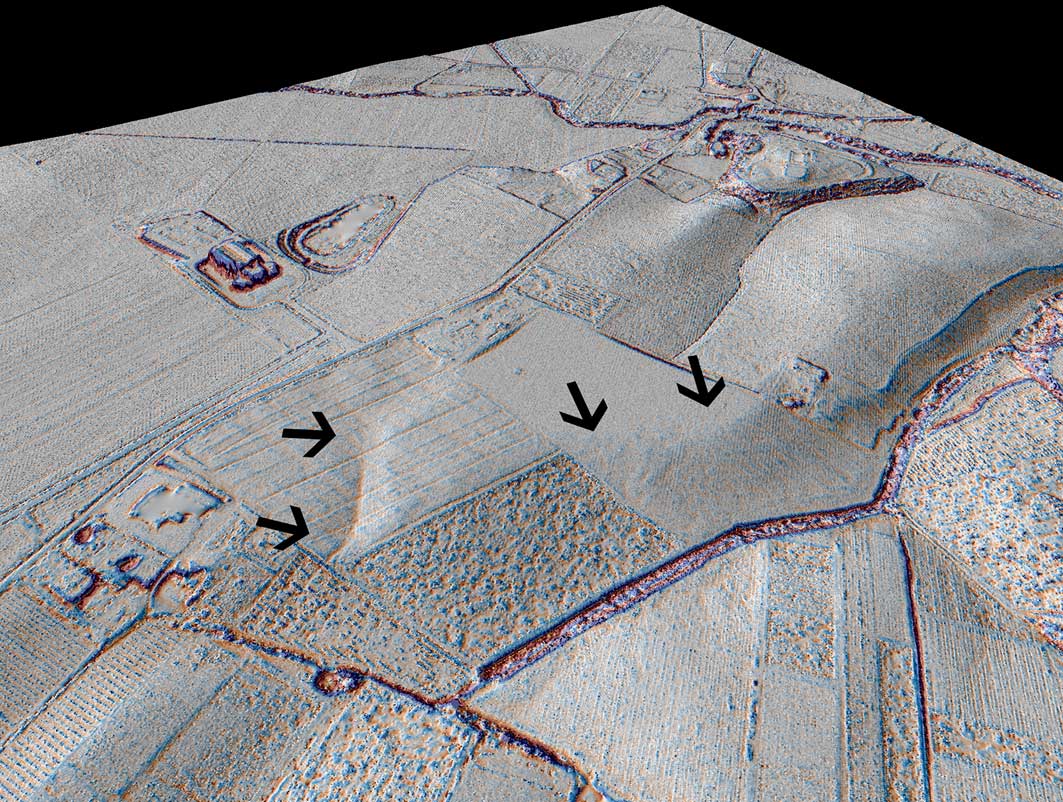
Archaic defensive system (agger and fossum, marked by arrows) in Satricum (Le Ferriere, Lazio). Resampling filter, radius=15+. Analytical hillshade, processed in SAGA GIS (data by Marijke Gnade-Satricum Project; figure by Jesús García Sánchez).
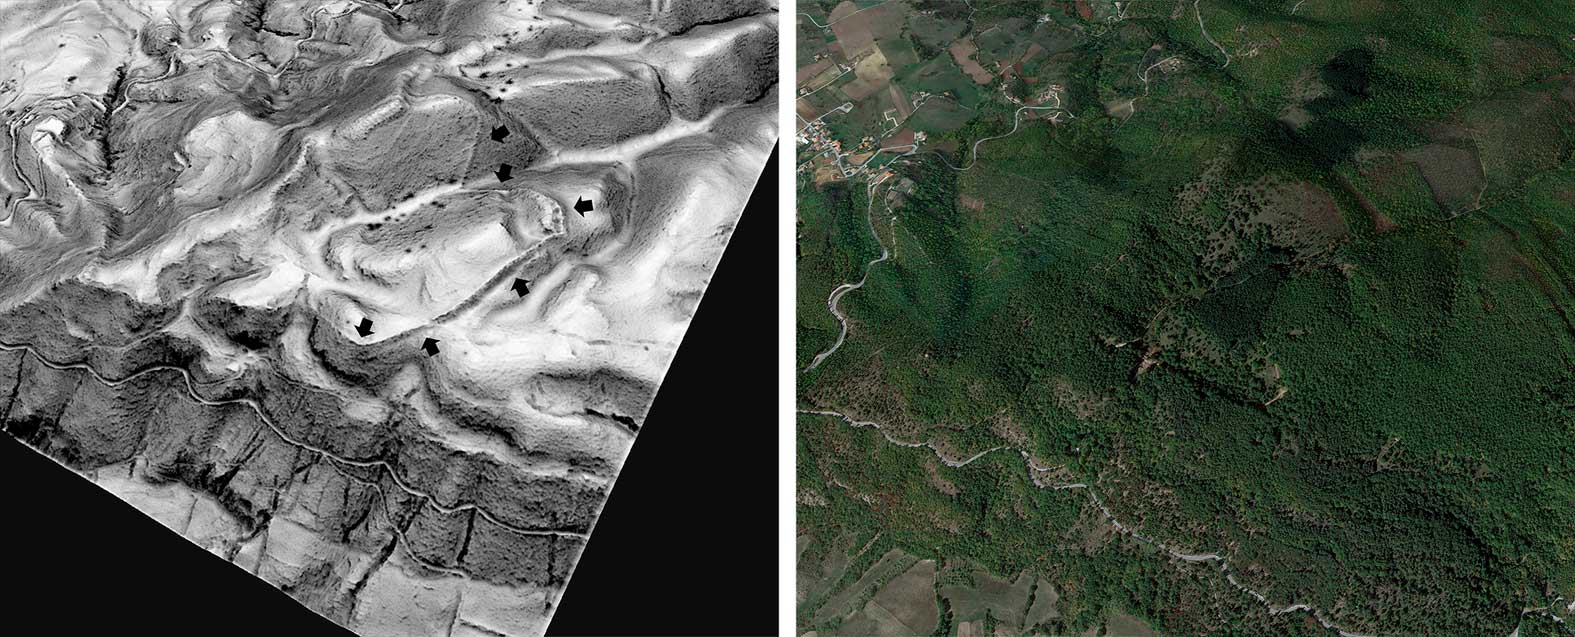
Monte Vairano (Busso, Campobasso) hillfort. Left) skyview factor calculated with relief visualisation toolbox and arrows pointing at the polygonal wall; right) same area covered by forest in Google Earth (data by LERC Project; figure by Jesús García Sánchez).
This brief overview of public LiDAR data demonstrates the possible usefulness of this remote-sensing method on regional-scale archaeological projects. It highlights the importance of working with raw data to produce models that fit the research question.
Acknowledgements
The research on LiDAR in Italy is part of the output of a Marie Curie FP7 project (‘A World of Villages’, T.D. Stek, Glasgow University) and the Dutch NOW project ‘Landscapes of Early Roman Colonization’. The latter project is coordinated by Tesse D. Stek and Jeremia Pelgrom (project number: 360-61) and is funded by the Netherlands Organisation for Scientific Research, based at Leiden University and the Royal Netherlands Institute in Rome. LiDAR data is the property of Ministero dell’Ambiente e della Tutela del Territorio e del Mare. Licence Creative Commons (CC BY-SA 3.0 IT).


