

1. Introduction
To attain ignition conditions, a laser driver for inertial confinement fusion (ICF) should have output energy of the order of megajoules at the appropriate wavelength over a pulselength of a few nanoseconds[Reference Gus’kov, Zmitrenko, Il’in and Sherman1–Reference Eliezer and Pinhasi4]. The rod and disk amplifiers for high-peak-power laser applications are the key components of Nd:glass ICF drivers, which provide the maximum laser energy and are pumped by flash lamps[Reference Bychkov, Modestov and Law5, Reference Tian, Chen, Zhang, Shan, Zhou, Liu, Bi, Zhang and Wang6]. Generally, the efficiency of the laser driver depends on the collection efficiency of the amplifier reflectors used to couple the flash lamp light to the Nd:glass[Reference Jia, Li, Liu, Li, Song and Li7–Reference Kim, Kim, Hong, Xu and Lee10]. Reflector design can minimize power and energy requirements of a flash lamp and increase laser efficiency and lamp life. However, no model has been developed that can adequately describe the radiation style of a flash lamp.
Two theoretical descriptions of the radiation model are presently available in the literature[Reference Linford11]. The first theory of the imaging reflector is based on the pumping system of a reflecting linear ellipse with flash lamps and Nd:glass at the foci. Here, rays are considered to leave normal to the surface of the lamp tube; this theory tends to regard the flash lamp as a point source that forms a cylindrical illuminant.
The second theory treats the xenon plasma as a graybody radiator, which can emit as well as absorb pump light. The radiating xenon plasma is optically thick, meaning that pump light emanates from the surface of the plasma and not from within its bulk. The absorption of emitted radiation by xenon plasma itself is relatively sensitive to the flash lamp parameters.
In this study, we assume that xenon plasma absorption coefficients change with current density, lamp diameter, and xenon pressure. Our key purpose is to provide an exact flash lamp radiation model for reflector design. The accuracy of the model is demonstrated by comparison with experimental data of absolute spectral-intensity measurements at one point on the surface of a lamp tube.
2. Calculation results
2.1. Physical description
Following Trenholme–Emmett[Reference Emmett, Schawlow and Weinberg12], we discovered that the radiation model was a uniform cylinder of hot plasma that filled or nearly filled the lamp bore, and the output spectral distribution of the flash lamp operating in the quasi-stationary regime was based on a large quantity of experimental data. These data were useful for the accurate prediction of radiant output over a wide range of parameters. Kirchhoff’s law[Reference Powell, Erlandson and Jancaitis13] stated that if the plasma absorption coefficient at wavelength ${\it\lambda}$
was given by
${\it\lambda}$
was given by ${\it\alpha}({\it\lambda})$
, then the emission intensity as viewed through a uniform plasma at temperature
${\it\alpha}({\it\lambda})$
, then the emission intensity as viewed through a uniform plasma at temperature $T$
and over a length
$T$
and over a length $l$
was given by
$l$
was given by
 $$\begin{eqnarray}I({\it\lambda},T)=[1-\exp (-{\it\alpha}({\it\lambda})l)]\ast I_{\text{bb}}({\it\lambda},T),\end{eqnarray}$$
where $I_{\text{bb}}({\it\lambda},T)$
was the blackbody intensity at temperature
$I_{\text{bb}}({\it\lambda},T)$
was the blackbody intensity at temperature $T$
.
$T$
.
The emissivity was defined as
 $$\begin{eqnarray}{\it\varepsilon}_{{\it\lambda}}=1-\exp (-{\it\alpha}({\it\lambda})l).\end{eqnarray}$$
The flash lamp radiation was made up of both line and continuum emission, similar to the absorption coefficient ${\it\alpha}({\it\lambda})$
, and could be approximated by
${\it\alpha}({\it\lambda})$
, and could be approximated by
 $$\begin{eqnarray}\displaystyle {\it\alpha}({\it\lambda}) & = & \displaystyle [{\it\alpha}_{c}({\it\lambda})+{\it\alpha}_{l}({\it\lambda})]\ast M(i,d,p),\end{eqnarray}$$
 $$\begin{eqnarray}\displaystyle {\it\alpha}_{c}({\it\lambda}) & = & \displaystyle {\it\alpha}_{1}\exp \{-[({\it\lambda}-{\it\lambda}_{1})/{\it\omega}_{1}]^{2}\}\nonumber\\ \displaystyle & & \displaystyle +\,{\it\alpha}_{2}\exp \{-[({\it\lambda}-{\it\lambda}_{2})/{\it\omega}_{2}]^{2}\},\end{eqnarray}$$
 $$\begin{eqnarray}\displaystyle M(i,d,p) & = & \displaystyle \exp [1.57\ln (i)+0.071\text{ln}^{2}(i)\nonumber\\ \displaystyle & & \displaystyle +\,0.19\ln (d)+0.46\ln (p)],\end{eqnarray}$$
where ${\it\alpha}_{c}({\it\lambda})$
was the continuum absorption coefficient;
${\it\alpha}_{c}({\it\lambda})$
was the continuum absorption coefficient; ${\it\alpha}_{1}=2.37\times 10^{-2}~\text{cm}^{-1}$
and
${\it\alpha}_{1}=2.37\times 10^{-2}~\text{cm}^{-1}$
and ${\it\alpha}_{2}=1.5\times 10^{-3}~\text{cm}^{-1}$
were two fitting coefficients;
${\it\alpha}_{2}=1.5\times 10^{-3}~\text{cm}^{-1}$
were two fitting coefficients; ${\it\lambda}_{1}=0.7~{\rm\mu}\text{m}$
and
${\it\lambda}_{1}=0.7~{\rm\mu}\text{m}$
and ${\it\lambda}_{2}=0.3~{\rm\mu}\text{m}$
were the central wavelengths of two Gaussian functions with bandwidths
${\it\lambda}_{2}=0.3~{\rm\mu}\text{m}$
were the central wavelengths of two Gaussian functions with bandwidths ${\it\omega}_{1}=0.33~{\rm\mu}\text{m}$
and
${\it\omega}_{1}=0.33~{\rm\mu}\text{m}$
and ${\it\omega}_{2}=0.14~{\rm\mu}\text{m}$
, respectively. Fitting the line absorption coefficient
${\it\omega}_{2}=0.14~{\rm\mu}\text{m}$
, respectively. Fitting the line absorption coefficient ${\it\alpha}_{l}({\it\lambda})$
at wavelength
${\it\alpha}_{l}({\it\lambda})$
at wavelength ${\it\lambda}$
by 20 Lorenz curves with central wavelengths, amplitudes, and line width was first implemented by Powell[Reference Powell, Erlandson, Jancaitis and James14].
${\it\lambda}$
by 20 Lorenz curves with central wavelengths, amplitudes, and line width was first implemented by Powell[Reference Powell, Erlandson, Jancaitis and James14]. $M(i,d,p)$
was the standardization factor,
$M(i,d,p)$
was the standardization factor, $i$
was the current density,
$i$
was the current density, $d$
was the lamp diameter, and
$d$
was the lamp diameter, and $p$
was the xenon pressure.
$p$
was the xenon pressure.
Given the relationship between the plasma temperature and the physical characteristics of the lamp, fitting the temperature function[Reference Holzrichter and Emmett15, Reference Dishington, Hook and Hilberg16] to the experimental results, we have
 $$\begin{eqnarray}T=9300i^{0.18}d^{0.092}p^{-0.017}.\end{eqnarray}$$
Then, having obtained the temperature for a given input electrical power from Equation (6), Equation (3) was used to calculate the absorption coefficient. Finally the radiation spectrum power would be calculated from Equation (1).
Flash lamps are filled with xenon and have variations in the bore diameter, constant 114-cm arc lengths, and walls made of cerium-doped quartz. A simplified equivalent drive circuit with two lamps connected in series is illustrated in Figure 1. This circuit has a capacitance of 125 ${\rm\mu}$
F and an inductance of 250
${\rm\mu}$
F and an inductance of 250 ${\rm\mu}$
H.
${\rm\mu}$
H.
Schematic diagram of the electrical circuit.

2.2. Calculated result
The absorption coefficients are presented in Figure 2(a) for 1.5-cm-bore flash lamps with a current density of 2.5–3.5 kA/cm2. The shape of these curves reflects the flash lamp efficiency in producing light in the Nd:glass pump region (wavelengths between 400 and 1000 nm). They also show that flash lamp opacity is a function of current density and wavelength. For a wavelength ${\it\lambda}$
less than 800 nm, the absorption coefficient rises linearly. For
${\it\lambda}$
less than 800 nm, the absorption coefficient rises linearly. For $800~\text{nm}<{\it\lambda}<850~\text{nm}$
, the absorption coefficient is a downward parabola, whereas for a wavelength
$800~\text{nm}<{\it\lambda}<850~\text{nm}$
, the absorption coefficient is a downward parabola, whereas for a wavelength ${\it\lambda}$
longer than 850 nm, the absorption coefficient noisily reduces. Figure 2(b) further illustrates how a larger current density provides a much better characterization of wavelength intensity. Figure 2(c) shows the lamp emissivity (
${\it\lambda}$
longer than 850 nm, the absorption coefficient noisily reduces. Figure 2(b) further illustrates how a larger current density provides a much better characterization of wavelength intensity. Figure 2(c) shows the lamp emissivity ( ${\it\lambda}=700~\text{nm}$
) versus plasma length at three lamp current densities. We interpreted the general shape of these curves to be caused by those reasons discussed for Figure 2(a). Figure 2(d) shows the dependence of the calculated emissivity on plasma length for three wavelengths. For the radiation transport in plasma longer than the lamp radius, the plasma is almost opaque when the wavelength is longer than 800 nm and the lamp radiation model is a hollow cylinder. For the radiation transport in plasma in a lamp bore, radiation will fill the lamp bore when the wavelength is shorter than 800 nm. Flash lamp radiation efficiency[Reference Tucker, Cochran and Morelli17, Reference Baksht, Lomaev, Panchenko, Rybka, Tarasenko, Krishnan and Thompson18] is defined as the radiant spectrum power divided by the electrical input energy
${\it\lambda}=700~\text{nm}$
) versus plasma length at three lamp current densities. We interpreted the general shape of these curves to be caused by those reasons discussed for Figure 2(a). Figure 2(d) shows the dependence of the calculated emissivity on plasma length for three wavelengths. For the radiation transport in plasma longer than the lamp radius, the plasma is almost opaque when the wavelength is longer than 800 nm and the lamp radiation model is a hollow cylinder. For the radiation transport in plasma in a lamp bore, radiation will fill the lamp bore when the wavelength is shorter than 800 nm. Flash lamp radiation efficiency[Reference Tucker, Cochran and Morelli17, Reference Baksht, Lomaev, Panchenko, Rybka, Tarasenko, Krishnan and Thompson18] is defined as the radiant spectrum power divided by the electrical input energy $p_{\text{in}}$
:
$p_{\text{in}}$
:
 $$\begin{eqnarray}{\it\eta}=\frac{\displaystyle \iint I({\it\lambda})\text{d}{\it\lambda}\text{d}t}{p_{\text{in}}}.\end{eqnarray}$$
According to Equation (7) and Figure 2(e), the observed decrease of radiation efficiency with increasing flash lamp current density is caused by a flash lamp opacity mechanism in which some of the light absorbed by the xenon plasma is not reradiated in the pump region.
Effect of current density on the xenon flash lamp absorption coefficient: (a) absorption coefficient; (b) lamp output spectrum; (c) plasma emissivity at different current densities with the same wavelength; (d) plasma emissivity at different wavelengths with the same current density; (e) relationship between current density and radiation efficiency.

For the circuit, we can represent the system using the following equation[Reference Efthymiopoulos and Garside19–Reference Edwards21]:
 $$\begin{eqnarray}\displaystyle & & \displaystyle L\frac{\text{d}i}{\text{d}t}+K_{0}|i|^{1/2}+\frac{1}{c}\int _{0}^{t}i\text{d}t+Ri=V_{0},\nonumber\\ \displaystyle & & \displaystyle \quad K_{0}=1.3\frac{s}{d}\left(\frac{P}{450}\right)^{0.2},\end{eqnarray}$$
where $V_{0}$
is the initial voltage on the capacitor,
$V_{0}$
is the initial voltage on the capacitor, $L$
is the inductance,
$L$
is the inductance, $C$
is the bank capacitor and
$C$
is the bank capacitor and $S$
is the total arc length.
$S$
is the total arc length.
Effect of lamp diameter and xenon pressure on the absorption coefficient: (a) current pulse shapes at different xenon lamp diameters; (b) schematic diagram of xenon plasma; (c) absorption coefficient; (d) lamp output spectrum; (e) plasma emissivity for ${\it\lambda}=700~\text{nm}$
at different xenon lamp diameters; (f) absorption coefficient at different xenon pressures; (g) lamp output spectrum.
${\it\lambda}=700~\text{nm}$
at different xenon lamp diameters; (f) absorption coefficient at different xenon pressures; (g) lamp output spectrum.

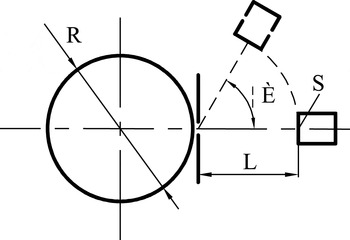
Schematic diagram of the test facility.
Current pulse shape: (a) experimental result; (b) calculated result.

We chose the equivalent current densities for the flash lamp bore from 0.8 to 2 cm. The electrical time dependences of the lamp current pulses were calculated by Equation (8). As shown in Figure 3(a), the lamp with 2-cm-bore current pulse peaks later than all other lamps. In addition, note that the peak time of current density is a function of bore diameter. This is likely caused by the arc expansion due to the plasma’s diffusion velocity and temperature gradient from the lamp centerline to the shell, as shown in Figure 3(b). We already know that the value of $M(i,d,p)$
is determined by lamp parameters and current density plays a leading role. It is evident from Equations (3) and (5) that there is little to be decreased in flash lamp absorption coefficient and wavelength intensity by varying the bore diameter, at least over the 0.8–2 cm range. After careful inspection of the curves in Figures 3(c) and 3(d), we believe that the slight difference in absorption coefficient is caused by mistaking the thermal conduction to the tube for the energy of reabsorbed plasma. Analysis of Figure 3(e) shows that the emissivity of the plasma is quite closely approximate to the performance of the absorption coefficient and spectral output. An empirical description of the voltage–current relationship of the lamp is given by[Reference Emmett, Schawlow and Weinberg12]
$M(i,d,p)$
is determined by lamp parameters and current density plays a leading role. It is evident from Equations (3) and (5) that there is little to be decreased in flash lamp absorption coefficient and wavelength intensity by varying the bore diameter, at least over the 0.8–2 cm range. After careful inspection of the curves in Figures 3(c) and 3(d), we believe that the slight difference in absorption coefficient is caused by mistaking the thermal conduction to the tube for the energy of reabsorbed plasma. Analysis of Figure 3(e) shows that the emissivity of the plasma is quite closely approximate to the performance of the absorption coefficient and spectral output. An empirical description of the voltage–current relationship of the lamp is given by[Reference Emmett, Schawlow and Weinberg12]
 $$\begin{eqnarray}V_{0}=k_{0}i^{0.5},\end{eqnarray}$$
and the total electrical input energy from the relationship is[Reference Emmett, Schawlow and Weinberg12]
 $$\begin{eqnarray}E_{0}={\textstyle \frac{1}{2}}CV_{0}^{2}.\end{eqnarray}$$
In lamps at the same current densities, if the bore diameter decreases, $k_{0}$
and
$k_{0}$
and $V_{0}$
increase. Since the radiant spectrum powers are almost the same, we can meet the output energy requirement through electrical input energy with a smaller bore diameter. Analogous to the bore diameter results, the xenon pressures have a similar effect on the radiation, as shown in Figures 3(f) and 3(g).
$V_{0}$
increase. Since the radiant spectrum powers are almost the same, we can meet the output energy requirement through electrical input energy with a smaller bore diameter. Analogous to the bore diameter results, the xenon pressures have a similar effect on the radiation, as shown in Figures 3(f) and 3(g).
(a) Test system stability; (b) relationship between test distance and emission power.

Xenon lamp radiation model: (a) relative spectral power at different angles; (b) power ratio of $J_{{\it\theta}}/J_{0}$
.
$J_{{\it\theta}}/J_{0}$
.

3. Experimental verification
3.1. Experimental method
The radiated flash lamp energy depends on the depth of the xenon plasma viewed, and therefore not only on the lamp dimensions, but also on its orientation. Figure 4 shows a schematic of the setup used for the absolute spectral-intensity measurements at various angles of view. One flash lamp was vertically fixed and masked by non-reflection material to make a small tube area point, and the photomultiplier was mounted on a turntable with a fixed distance of its detective area from the lamp axis of $L$
. The other lamp was placed in a black box and it was ensured that no light radiated outward. Each angle tests three times and takes an average, and the time interval between the two is at least 15 minutes; otherwise the xenon flash lamp would not cool completely. We can calculate the absorption coefficient of the xenon plasma by comparing the energy data at the viewing angles with the data from the normal.
$L$
. The other lamp was placed in a black box and it was ensured that no light radiated outward. Each angle tests three times and takes an average, and the time interval between the two is at least 15 minutes; otherwise the xenon flash lamp would not cool completely. We can calculate the absorption coefficient of the xenon plasma by comparing the energy data at the viewing angles with the data from the normal.
3.2. Experimental results
For the 2-cm-bore and 127-cm arc length flash lamp, the circuit has a capacitance of 125 ${\rm\mu}$
F and an inductance of 250
${\rm\mu}$
F and an inductance of 250 ${\rm\mu}$
H. A capacitor voltage of 24 kV is used to attain a current pulse amplitude up to 6.2 kA. The theoretical prediction of the pulse shape was seen to be in reasonably good agreement with the measurement data as shown in Figures 5(a) and 5(b).
${\rm\mu}$
H. A capacitor voltage of 24 kV is used to attain a current pulse amplitude up to 6.2 kA. The theoretical prediction of the pulse shape was seen to be in reasonably good agreement with the measurement data as shown in Figures 5(a) and 5(b).
As a check on the reproducibility of test facility, we placed a photomultiplier at a fixed distance from the normal direction of the lamp surface. All test results are nearly identical, which means that the system has good performance stability and there is no visible change in the appearance of facility during the experiment, as shown in Figure 6(a). The exit slit on the surface of the lamp forms a point source to allow light from the lamp to fall directly into the photomultiplier. The solid angle[Reference Elloumi, Zissis, Berthier and Jean22] that the photomultiplier subtends at the point source is
 $$\begin{eqnarray}\text{d}{\it\Omega}=\frac{S}{L^{2}},\end{eqnarray}$$
where $S$
is the photomultiplier’s detection area and
$S$
is the photomultiplier’s detection area and $L$
is the distance between the photomultiplier and the lamp. The time-dependent wavelength intensity in the tube normal direction over the current pulse is obtained by
$L$
is the distance between the photomultiplier and the lamp. The time-dependent wavelength intensity in the tube normal direction over the current pulse is obtained by
 $$\begin{eqnarray}\int I({\it\lambda})\text{d}t=\int _{0}^{t}J_{{\it\theta}=\frac{{\it\pi}}{2}}\text{d}t=\frac{\text{d}e}{\text{d}{\it\Omega}},\end{eqnarray}$$
where $J_{{\it\theta}={\it\pi}/2}$
is the signal detected by the photomultiplier and
$J_{{\it\theta}={\it\pi}/2}$
is the signal detected by the photomultiplier and $\text{d}e/\text{d}{\it\Omega}$
is the wavelength
$\text{d}e/\text{d}{\it\Omega}$
is the wavelength ${\it\lambda}$
power emitted by the lamp in the normal direction per unit solid angle over the current pulse. According to Equation (11), the solid angle falls off with increasing distance
${\it\lambda}$
power emitted by the lamp in the normal direction per unit solid angle over the current pulse. According to Equation (11), the solid angle falls off with increasing distance $L$
. As shown in Figure 6(b), when the distance
$L$
. As shown in Figure 6(b), when the distance $L$
is shorter than 40 cm the power sharply decreases. If the distance is longer than 40 cm, the solid angle is smaller than
$L$
is shorter than 40 cm the power sharply decreases. If the distance is longer than 40 cm, the solid angle is smaller than $9\times 10^{-2}\,^{\circ }\text{C}$
and we can assume that the photomultiplier’s surface area
$9\times 10^{-2}\,^{\circ }\text{C}$
and we can assume that the photomultiplier’s surface area $S$
has no effect on the constant
$S$
has no effect on the constant $\text{d}e$
. The wavelength power at constant wavelength
$\text{d}e$
. The wavelength power at constant wavelength ${\it\lambda}$
and current density is found by integrating Equation (12) will not change, and so do the
${\it\lambda}$
and current density is found by integrating Equation (12) will not change, and so do the $J_{{\it\theta}={\it\pi}/2}$
.
$J_{{\it\theta}={\it\pi}/2}$
.
Test results.
Power of the wavelength (532 nm) dependence of the various angles of view (which occurred at the flash lamp peak current density of 3.5 kA/cm2) is presented in Table 1 for a 1.7-cm-bore lamp at a distance of 40 cm. Figure 7(a) illustrates the wavelength power angular distribution: test results and the power dependence on Lambert’s law are simultaneously displayed. In addition, the test results are observed to decrease as the viewing angle increases from 0 to $90^{\circ }$
. In general, the lamp emission falls off with the angle approximately as
$90^{\circ }$
. In general, the lamp emission falls off with the angle approximately as $k_{0}\cos {\it\theta}$
(Refs. [Reference Gusinow23, Reference Lama, Hammond and Walsh24]):
$k_{0}\cos {\it\theta}$
(Refs. [Reference Gusinow23, Reference Lama, Hammond and Walsh24]):
 $$\begin{eqnarray}I_{{\it\theta}}=K_{0}\ast I_{0}\cos {\it\theta},\end{eqnarray}$$
where the correction factor of $k_{0}$
is determined by the wavelength. For viewing angle
$k_{0}$
is determined by the wavelength. For viewing angle ${\it\theta}=90^{\circ }$
, the power
${\it\theta}=90^{\circ }$
, the power $I_{{\it\theta}}=5.2~\text{mJ}$
is found to radiate directly from the lamp plasma and not from stray reflections[Reference Zainal, Tamuri, Daud and Noriah25]. This means that the lamp radiation model is not a point source.
$I_{{\it\theta}}=5.2~\text{mJ}$
is found to radiate directly from the lamp plasma and not from stray reflections[Reference Zainal, Tamuri, Daud and Noriah25]. This means that the lamp radiation model is not a point source.
The measured variations of flash lamp absorption coefficient ${\it\alpha}({\it\lambda})$
with wavelength 532 nm at constant lamp current density and lamp bore are summarized in Figure 7(b). The
${\it\alpha}({\it\lambda})$
with wavelength 532 nm at constant lamp current density and lamp bore are summarized in Figure 7(b). The $y$
-axis shows the emission power at an angle with respect to the normal versus the radiation power in the normal[Reference Jacobsen26]. For the absorption coefficient
$y$
-axis shows the emission power at an angle with respect to the normal versus the radiation power in the normal[Reference Jacobsen26]. For the absorption coefficient ${\it\alpha}({\it\lambda})\approx \infty$
, the Lambertian source provides emission light from different positions along the lamp shell. For the absorption coefficient
${\it\alpha}({\it\lambda})\approx \infty$
, the Lambertian source provides emission light from different positions along the lamp shell. For the absorption coefficient ${\it\alpha}({\it\lambda})=0$
, there is no absorption in the plasma. The measurement results of flash lamp opacity are in qualitative agreement with the absorption coefficient
${\it\alpha}({\it\lambda})=0$
, there is no absorption in the plasma. The measurement results of flash lamp opacity are in qualitative agreement with the absorption coefficient ${\it\alpha}({\it\lambda})=3~\text{cm}^{-1}$
and the calculated results of absorption coefficient
${\it\alpha}({\it\lambda})=3~\text{cm}^{-1}$
and the calculated results of absorption coefficient ${\it\alpha}({\it\lambda})=2~\text{cm}^{-1}$
. We attribute the measurement error to neglecting the wrapping material thickness. The flash lamp radiation model is shown to be a reasonably accurate predictor of radiant energy at high power.
${\it\alpha}({\it\lambda})=2~\text{cm}^{-1}$
. We attribute the measurement error to neglecting the wrapping material thickness. The flash lamp radiation model is shown to be a reasonably accurate predictor of radiant energy at high power.
4. Conclusion
The measured and calculated flash lamp radiation models are clearly in good agreement for the case where the lamp is treated as a volume source radiating light outward. It is of interest to estimate the effect that various changes in the lamp parameters would have on the absorption coefficient if all other circuit parameters remained constant. Increasing the lamp current density will increase the absorption coefficient. No dependence of the lamp absorption coefficient on the lamp bore and xenon pressure was observed. For the wavelengths ranging from 400 to 800 nm, the lamp plasma absorption coefficient is so small that the lamp radiated in the whole tube. For wavelengths ranging from 800 to 850 nm, the radiation volume is a hollow cylindrical model. For wavelengths ranging from 850 to 1000 nm, the radiation volume is a thin-shell Lambertian.
Acknowledgments
The authors would like to acknowledge Dr. Jianqiang Zhu for modifying and proofreading the manuscript. Grants from the Chinese and Israeli cooperation project on high-power laser technology (2010DFB70490) supported this study.


 Open access