





Introduction
Adolescence is a developmental period characterized by dynamic changes across biological, neural, and social systems, making youth particularly vulnerable to the emergence of clinical symptoms and psychopathology (Dahl, Reference Dahl2004; Paus et al., Reference Paus, Keshavan and Giedd2008). It is also a developmental period in which adolescents are exposed to screens such as the television, cell phones, and other technological devices. Studies find that excessive screen time – spanning activities like television viewing, online video consumption, video games, and social media – is related to various mental health outcomes (Paquin et al., Reference Paquin, Ferrari, Rej, Boivin, Ouellet-Morin, Geoffroy and Shah2024; Song et al., Reference Song, Zhang, Zhou, Fu, Zou, Xu, Wang, Li, Zhao, Potenza, Fang and Zhang2023) although this topic has been much debated. For example, other work shows that moderate screen time has beneficial effects on adolescent behaviors and outcomes such as enhancing social communication and creativity (Granic et al., Reference Granic, Lobel and Engels2014). While research on the relationship between screen time and mental health in youth is advancing, there remains unanswered questions about how these associations develop over time, whether specific patterns of screen time relate to outcomes, and whether adverse life experiences influence these relationships.
The continuum hypothesis (Goldberg, Reference Goldberg2000) suggests that symptoms of psychosis fall on a continuum and psychotic-like experiences (PLEs; unusual and odd perceptions common in both non-clinical and clinical populations such as hearing one’s name being called, or seeing a shadow in the corner of the eye) fall on the lower end of this continuum, reflecting subthreshold psychotic-like symptoms (Linscott & Van Os, Reference Linscott and Van Os2013). Meta-analytic evidence indicates that the median prevalence rates of PLEs is 17% in children and adolescents 9–12 years and 7.5% in adolescents ages 13–18 years (Burton et al., Reference Burton, Tibbo, Ponto and Crocker2024; Kelleher et al., Reference Kelleher, Connor, Clarke, Devlin, Harley and Cannon2012). PLEs predict clinical outcomes including the emergence of schizophrenia-spectrum disorders and more broadly, are considered risk markers for transdiagnostic psychiatric vulnerability (Kelleher et al., Reference Kelleher, Connor, Clarke, Devlin, Harley and Cannon2012). The use of large data sets such as the Adolescent Brain Cognitive Development SM Study (ABCD Study®) (https://nda.nih.gov/study.html?id=2147) (Haist & Jernigan) has advanced the study of PLEs, particularly in identifying patterns across time and clinical predictors. Additionally, growing evidence suggests that it is not merely the frequency of PLEs that predict adverse outcomes, but rather the persistence and distress that are associated with outcomes such as the onset of schizophrenia-spectrum disorders (Karcher et al., Reference Karcher, Loewy, Savill, Avenevoli, Huber, Makowski, Sher and Barch2022). While some PLEs are normative and transient – especially during early adolescence due to factors such as misunderstanding self-report questions, cultural influences, and imagination (Karcher, Reference Karcher2022) – distressing PLEs during childhood and early adolescence can be especially problematic leading to functional decline and impairment (Barnes et al., Reference Barnes, Stewart, Browning, Bracegirdle, Laurens, Gin, Hirsch, Abbott, Onwumere, Banerjea, Kuipers and Jolley2022). While the persistence and distress associated with PLEs are emerging as key clinical predictors, one underexplored area of research is how factors such as screen time and adverse life experiences contribute to these trajectories, potentially shaping risk for more severe psychopathology.
Over the past decade, technological advances – including the rise of social media platforms like Instagram – have led to an increase in screen time among children and adolescents. For instance, adolescents in the United States now spend an average of nearly 7.5 hours per day using screens, including social media (Rideout & Robb, Reference Rideout and Robb2018), and over half of children are given smartphones by age 11 (Rideout & Robb, Reference Rideout and Robb2019). A growing body of research links excessive screen time – including television viewing, online video consumption, video games, and social media use – to a range of adverse mental health outcomes (Paquin et al., Reference Paquin, Ferrari, Rej, Boivin, Ouellet-Morin, Geoffroy and Shah2024; Song et al., Reference Song, Zhang, Zhou, Fu, Zou, Xu, Wang, Li, Zhao, Potenza, Fang and Zhang2023; Zhu et al., Reference Zhu, Griffiths, Xiao, Ribeaud, Eisner, Yang and Murray2023), although findings remain mixed. Some studies report associations between high screen use and outcomes such as internalizing and externalizing behaviors (Eirich et al., Reference Eirich, McArthur, Anhorn, McGuinness, Christakis and Madigan2022), while others suggest that moderate screen time may have benefits for social communication, creativity, and peer connection (Granic et al., Reference Granic, Lobel and Engels2014). The Differential Susceptibility to Media Effects Model (DSMM) offers a useful framework for understanding these inconsistent findings. It posits that media effects are not uniform, but instead depend on dispositional, developmental, and social-contextual factors that influence how individuals engage with and are impacted by media (Valkenburg & Peter, Reference Valkenburg and Peter2013).
One underexplored area is how screen time may interact with adverse life experiences, such as exposure to more proximal, recent negative life events, to shape mental health outcomes in youth – particularly PLEs. Adverse life experiences – including exposure to negative life events – have been consistently linked to PLEs (Karcher et al., Reference Karcher, Niendam and Barch2020; Kraan et al., Reference Kraan, Velthorst, Smit, De Haan and Van Der Gaag2015; Varese et al., Reference Varese, Smeets, Drukker, Lieverse, Lataster, Viechtbauer, Read, Van Os and Bentall2012). Adolescents who report PLEs also tend to experience greater distress and demonstrate less effective coping in response to stressors compared to their peers (Phillips et al., Reference Phillips, Edwards, McMurray and Francey2012). Prior work shows that recent exposure to adverse life experiences can immediately impact adolescent behavior and mental health outcomes (Lecarie et al., Reference Lecarie, Doane, Stroud, Walter, Davis, Grimm and Lemery-Chalfant2022; Lee et al., Reference Lee, Ban, Kim, Kim, Shin, Yoon and Kim2019; Low et al., Reference Low, Dugas, O’Loughlin, Rodriguez, Contreras, Chaiton and O’Loughlin2012; Muñoz-Samons et al., Reference Muñoz-Samons, Tor, Rodríguez-Pascual, Álvarez-Subiela, Sugranyes, de la Serna, Puig, Dolz and Baeza2021). On the other hand, distal or lifetime stressors may accumulate risk more gradually (Jensen et al., Reference Jensen, Dickie, Schwartz, Evans, Dumontheil, Paus and Barker2015; McLaughlin et al., Reference McLaughlin, Greif Green, Gruber, Sampson, Zaslavsky and Kessler2012), findings that align with the cumulative stress models, which propose that accumulated stress across time amplifies risk of PLE across the psychosis spectrum (Anglin et al., Reference Anglin, Espinosa, Barada, Tarazi, Feng, Tayler, Allicock and Pandit2019; Stilo et al., Reference Stilo, Gayer-Anderson, Beards, Hubbard, Onyejiaka, Keraite, Borges, Mondelli, Dazzan, Pariante, Di Forti, Murray and Morgan2017). Together, these bodies of work align with the DSMM’s emphasis on the moderating role of context. For example, screen time patterns and their effects may differ based on the presence of adverse life experiences or even day of the week (e.g., weekday vs. weekend) (Reardon et al., Reference Reardon, Lushington and Agostini2023). Excessive screen time-which may co-occur with recent negative life event exposure-may reflect or promote maladaptive coping (e.g., withdrawal, exposure to cyberbullying), potentially exacerbating distress (Lee et al., Reference Lee, Ban, Kim, Kim, Shin, Yoon and Kim2019). Although screen time can include social or interactive engagement, it may not confer the same protective benefits as in-person social interactions. In these contexts, it is also possible increased screen time could be a buffer against unfavorable outcomes as shown in some studies of the COVID-19 pandemic lockdown (Madigan et al., Reference Madigan, Eirich, Pador, McArthur and Neville2022).
Additionally, though still limited, some research links specific types of screen time with the worsening of PLEs (Paquin et al., Reference Paquin, Ferrari, Rej, Boivin, Ouellet-Morin, Geoffroy and Shah2024). One study examined screen time using the ABCD Study data collected across three years and found that texting and online video usage were most influential in the development of PLEs (Hein et al., Reference Hein, Zarate, Burleigh and Stavropoulos2024). This work highlights that specific types of screen use may be important to consider since some are likely more predictive of PLE progression than others.
We aim to advance understanding of how screen time and exposure to recent negative life events affect the progression of PLE distress levels in adolescents over time. Prior work using the ABCD Study provides an important foundation for the present investigation. Jia et al. (Reference Jia, Wei, Liu, Yu, Zhang, He, Xi, Chen and Zhang2025) identified three trajectories of PLE severity using latent class growth modeling, identifying a low/decreasing PLE trajectory, persistent PLE trajectory, and high/decreasing PLE trajectory. Cooper et al. (Reference Cooper, van Der Ven and Jalbrzikowski2026) applied LGMM to characterize trajectories of PLE severity and distress across four timepoints (up to 3-year follow up), identifying four distinct trajectory classes. They further examined associations between lifestyle factors and PLE trajectories, reporting that youth in a persistently elevated distress trajectory engaged in greater overall screen use, as well as experienced more sleep disturbance and higher caffeine intake. The present study differs from these studies by focusing on (1) PLE-associated distress, (2) specific forms/types of screen use, and (3) investigating the exacerbating influence of recent negative life in the association between screen time and PLE distress levels. Here, our approach allows for a more focused evaluation of how distinct screen-based behaviors and adverse life experiences relate to heterogeneity in PLE-associated distress.
In the current study, we first used a data-driven approach, LGMM, to identify distinct PLE trajectory classes in the ABCD study. Second, we compared mean-level differences in recent negative life events and the average amount of screen time (on weekday and weekends) across trajectory classes, also examining specific types of screen use in an exploratory fashion. Here, we focus on recent negative life events because they occur proximal to the period of heightened screen use in adolescence and may therefore contribute to emerging vulnerability more immediately than distal or lifetime stressors. Third, we examined whether exposure to recent negative life events moderated associations between the amount of screen time on a typical weekday and weekend day at ages 11–12 and PLE distress levels later in adolescence (13–14 years of age). We used moderation models to test our hypothesis that recent negative life events together with heightened screen use may be exacerbating co-occurring vulnerability for PLEs, in line with previous work suggesting that exposure to recent negative life events can exacerbate mental health vulnerability (Lataster et al., Reference Lataster, Myin-Germeys, Lieb, Wittchen and Van Os2012; Lee et al., Reference Lee, Ban, Kim, Kim, Shin, Yoon and Kim2019; Sideli et al., Reference Sideli, Murray, Schimmenti, Corso, La Barbera, Trotta and Fisher2020). Our rationale is that acute, recent stressors are particularly salient triggers for changes in PLE vulnerability and may prompt increased engagement with screens as a coping strategy (Muñoz-Samons et al., Reference Muñoz-Samons, Tor, Rodríguez-Pascual, Álvarez-Subiela, Sugranyes, de la Serna, Puig, Dolz and Baeza2021; Tessner et al., Reference Tessner, Mittal and Walker2011). Additional models were applied to probe at sensitivity, with a focus on cumulative stress.
Given prior work (Karcher et al., Reference Karcher, Loewy, Savill, Avenevoli, Huber, Makowski, Sher and Barch2022), we predicted that we would identify three trajectories: one with low PLE distress, one with persistent/high distress, and one with decreasing/transient distress. We also predicted that youth in the persistent/high PLE distress group would report more negative life events and screen time. Finally, we expected that in the persistent PLE distress trajectory, youth who engaged in greater amounts of screen time and experienced more negative life events would be at the highest risk for persistent PLE distress levels over time.
Method
Participants
The ABCD Study® is a longitudinal population-based cohort study that includes data from 21-sites across the United States of youth starting at ages 9–10 year of age. Recruitment procedures are described elsewhere (Garavan et al., Reference Garavan, Bartsch, Conway, Decastro, Goldstein, Heeringa, Jernigan, Potter, Thompson and Zahs2018). Protocols were Institutional Review Board approved; parents or guardians provided informed consent, while youth provided assent for participation. A total of 11,867 participants from the ABCD Study® with available PLE data with more than 1 timepoint were used in the LGMM analyses. Data release 5.1 was used and here, we use yearly data. It should be noted that the ABCD 5.1 data release included only a subset of 4-year follow-up data (∼40% of the whole sample). Trajectory group distribution differed significantly between those with and without released 4-year data, χ 2 (2) = 18.54, p < .001, with the increasing PLE distress trajectory having a smaller proportion of 4-year data released (30.1%) compared to the no PLE (40.5%) and decreasing PLE (38.7%) trajectories. There were no differences between those with and without released 4-year data in gender (p = .84) or baseline PLE distress (p = .79). However, the subsample showed differences in race and ethnicity distributions (p < .001), with more white participants in the subsample (56.4% compared to 49.1%) and black participants underrepresented in the subsample (10.7% vs. 17.9%). The subsample also had somewhat lower PLE severity across Y1–Y3 (ps < .001–0.015), and lower weekend and weekday screen use (p < .001).
Psychotic-like experiences
The Prodromal Questionnaire-Brief (Loewy et al., Reference Loewy, Bearden, Johnson, Raine and Cannon2005) was used to examine PLEs. Participants were asked whether they experienced PLE such as unusual thoughts and perceptual abnormalities. If they said “yes” to an item, they were further probed to indicate the level of distress on a 1 (not very bothered) to 4 (extremely bothered) scale. We focused on the distress scale given prior recommendations (Karcher et al., Reference Karcher, Loewy, Savill, Avenevoli, Huber, Makowski, Sher and Barch2022).
Youth screen time
The “ABCD Youth Screen Time Survey” (https://abcdstudy.org/scientists/protocols/) self-report measure asks youth to report the amount of time watching TV shows, movies, or videos, playing video games, texting on a cell phone, tablet, or computer, visiting social networking sites like Facebook, and video chatting (e.g., FaceTime) on a typical weekday and weekend. In the ABCD Study, different versions of the measure were used across timepoints (see Bagot et al., Reference Bagot, Tomko, Marshall, Hermann, Cummins, Ksinan, Kakalis, Breslin, Lisdahl, Mason, Redhead, Squeglia, Thompson, Wade, Tapert, Fuemmeler and Baker2022 for more information about changes) (Bagot et al., Reference Bagot, Tomko, Marshall, Hermann, Cummins, Ksinan, Kakalis, Breslin, Lisdahl, Mason, Redhead, Squeglia, Thompson, Wade, Tapert, Fuemmeler and Baker2022). Due to changes in the measure across timepoints, all variables were recoded to align across timepoints to reflect the amount of time spent on screens on a typical weekday and weekend day (e.g., 0 = 0 hours; 0.5 = Less than 1 hour; 1 = 1 hour; 2 = 2 hours; 3 = 3 hours; 4 = 4+ hours). Hours of screen time across screen types were summed across weekdays and weekend days for Year 2 data. We focus on Year 2 variables, when youth were ages ∼ 11–12 given that over half of children are given smartphones by age 11 (Rideout & Robb, Reference Rideout and Robb2019). Final variables represent the total screen time across different screen types – television/video viewing, video game use, texting, social media, and video chat – on a typical weekday and weekend day. See Supplement for more information about collapsing coding across timepoints.
Life events scale
We examined average negative life event exposures averaged across Year 2–Year 4 to capture a more stable index of recent stress exposure. The Life Events Scale (Grant et al., Reference Grant, Compas, Thurm, McMahon and Gipson2004; Tiet et al., Reference Tiet, Bird, Hoven, Moore, Wu, Wicks, Jensen, Goodman and Cohen2001) is a broadly used 25-item questionnaire that assesses stressful life events occurring in the past year. This assessment was administered annually since year 1 follow up. Youth indicated whether the event (e.g., death of a family member, victim of a crime, attended a new school) was experienced (0 = No; 1 = Yes), and then were provided with follow up questions regarding the event. Follow up questions assessed whether the event occurred in the last year, whether the event was a “good” or “bad” experience (1 = Mostly good; 2 = Mostly bad) and the perceived effect (i.e., impact; 0 = Not at All; 1 = A Little; 2 = Some; 3 = A lot). For the present study, we focused on incidents of negative life events (“mostly bad”).
Childhood behavior checklist
The Childhood Behavior Checklist (Achenbach & Rescorla, Reference Achenbach and Rescorla2001) is a general assessment measure to assess behavioral and emotional problems in children. Parents of adolescents completed the 113-item questionnaire, which assesses multiple subscales (e.g., social problems). Responses to questions were reported as 0 (absent), 1 (occurs sometimes), or 2 (occurs often), where higher scores reflect more symptoms and problematic behaviors. Given the inherently social nature of some types of screen time (e.g., social media, texting), we included the Childhood Behavior Checklist social problems subscale as a covariate to control for pre-existing social challenges that could be confounds.
Cumulative stress index
Recent negative life events, the Area Deprivation Index (Kind et al., Reference Kind, Jencks, Brock, Yu, Bartels, Ehlenbach, Greenberg and Smith2014), number of traumatic events reported from the KSADS (both collected at baseline) were standardized and averaged to create a cumulative stress index.
ADI. The ADI (Kind et al., Reference Kind, Jencks, Brock, Yu, Bartels, Ehlenbach, Greenberg and Smith2014) is commonly used with the ABCD Study data set as linked external data. The ADI is a multifaceted measure of neighborhood disadvantage, which conglomerates 17 variables from the 2011–2015 American Community Survey, such home value and median family income, and results in national percentiles, with higher values indicating more deprivation (Cardenas-Iniguez et al., Reference Cardenas-Iniguez, Schachner, Ip, Schertz, Gonzalez, Abad and Herting2024; Fan et al., Reference Fan, Marshall, Smolker, Gonzalez, Tapert, Barch, Sowell, Dowling, Cardenas-Iniguez, Ross, Thompson and Herting2021; Kind et al., Reference Kind, Jencks, Brock, Yu, Bartels, Ehlenbach, Greenberg and Smith2014).
KSADS Traumatic Events (Number of Events). The traumatic events portion of the Kiddie Schedule for Affective Disorders and Schizophrenia (KSADS, Kaufman et al., Reference Kaufman, Birmaher, Brent, Rao, Flynn, Moreci, Williamson and Ryan1997; Townsend et al., Reference Townsend, Kobak, Kearney, Milham, Andreotti, Escalera, Alexander, Gill, Birmaher, Sylvester, Rice, Deep and Kaufman2020) assessed incidents of traumatic events. Parents were asked to indicate whether adolescents experienced 17 distinct traumatic situations, such as natural disasters, accidents, sexual violence, or witness to domestic abuse. Adolescent-reported trauma exposure was not available at the time of data analysis.
Analytic strategy
Analyses were conducted to examine demographic and symptom differences and changes in symptoms and screen time over five years. For aim 1, LGMM was used to identify the optimal PLE distress trajectory class solution in Mplus software v8.8. To account for heterogeneity within and between latent trajectory classes, the intercepts (i.e., initial or baseline levels of PLEs) and slopes (i.e., rate of change in PLEs) were allowed to vary. An appropriate class solution was determined by examining Bayesian, sample-size adjusted Bayesian, and Akaike indices, entropy, Lo-Mendell-Rubin (Lo et al., Reference Lo, Mendell and Rubin2001) likelihood ratio test, and bootstrap likelihood ratio test (Jung & Wickrama, Reference Jung and Wickrama2008; Van De Schoot et al., Reference Van De Schoot, Sijbrandij, Winter, Depaoli and Vermunt2017). The full-information maximum likelihood estimation procedures were applied to handle any missing data. The final class solution was chosen based on a combination of lower criterion index values, higher entropy, significant p-values, and the solution’s overall interpretability.
For aims 2 and 3 assessing negative life events and screen time between trajectory classes and within youth with increasing PLE trajectories, linear mixed-effects models were conducted in R version 4.5.0 using the lmer4 package (Bates et al., Reference Bates, Mächler, Bolker and Walker2015), using complete case analysis and centered values. Models specified random effects with varying intercepts by family and site of data collection. Differences in average negative life events and total screen time on a typical weekday and weekend day were first assessed in separate models between PLE distress trajectories. We then conducted a three-way interaction to examine whether trajectory class membership, screen use (one model with weekdays and one model with weekends), and recent negative life events predicted PLEs at 4-years. We unpacked interaction effects using moderation. We applied moderation analyses to examine whether exposure to negative life events moderated associations between screen time on a typical weekday and weekend day at ages 11–12 and PLE distress levels at ages 13–14 (Year 4). We used moderation models here because this allowed us to test whether the impact of screen time on PLE-associated distress differs depending on the level of recent negative life events, which directly addresses our hypothesis that higher recent adverse life experiences could strengthen associations of screen time and PLEs. We chose to examine PLE distress at 4-year follow up rather than individual slopes because our goal was to identify predictors of clinically meaningful later outcomes. Importantly, longitudinal change in PLEs were already captured at the latent level via trajectory group membership; thus focusing on an endpoint (outcome = PLE distress at year−4) provides a more nuanced, reliable, and interpretable indicator of risk.
All analyses co-varied for age, sex, income, race, and social problem behaviors. If moderation findings were significant, further analyses were conducted to examine whether there were associations with specific types of screens on weekdays and weekends (e.g., video game use, social media). The Johnson-Neyman (JN) procedure (Johnson & Fay, Reference Johnson and Fay1950) was applied to examine associations of weekday and weekend day screen time and later PLE distress levels at low, average, and high levels of exposure to average negative life events across adolescence.
Additionally, to ensure robustness of our findings, we conducted sensitivity analyses examining if cumulative stress index, screen use, and trajectory group membership interacted to predict PLEs at Year 4.
Results
Trajectory classes of psychotic-like experiences
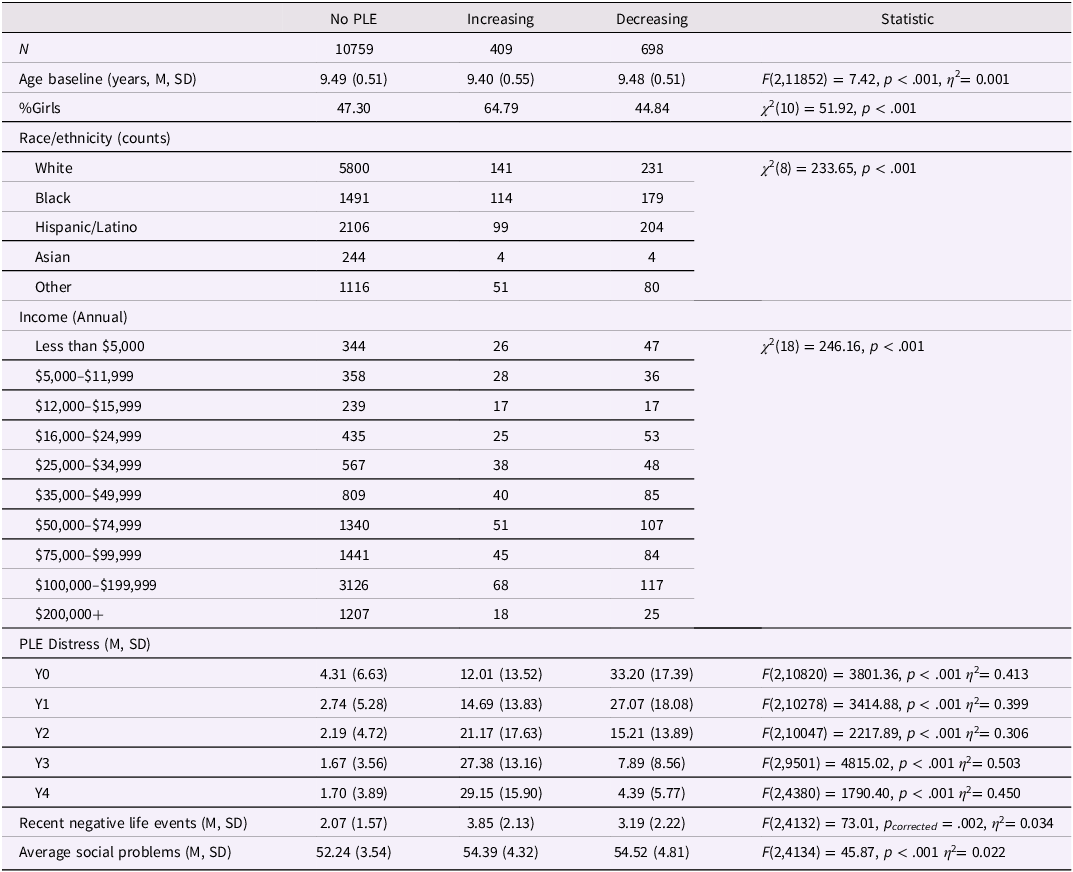
The LGMM analysis revealed three unique trajectories of PLE distress levels: A trajectory that began high and continued to increase in PLE distress (termed increasing PLE trajectory, n = 409), a trajectory that began the highest in PLE distress levels but decreased across time (decreasing PLE trajectory, n = 698), and a no PLE distress group (no PLE trajectory, n = 10,759). See Table 1 for demographic and sample characteristics, Figure 1 for trajectories of PLE distress levels across five-years, Supp Fig 1 for average PLE distress scores across time in the whole sample, and Supp Table 1 for LGMM fit indices.
Trajectories of psychotic-like experiences.
Note. Trajectories of Psychotic-Like Experiences (PLE) distress levels were formed using Latent Growth Mixture Modeling.
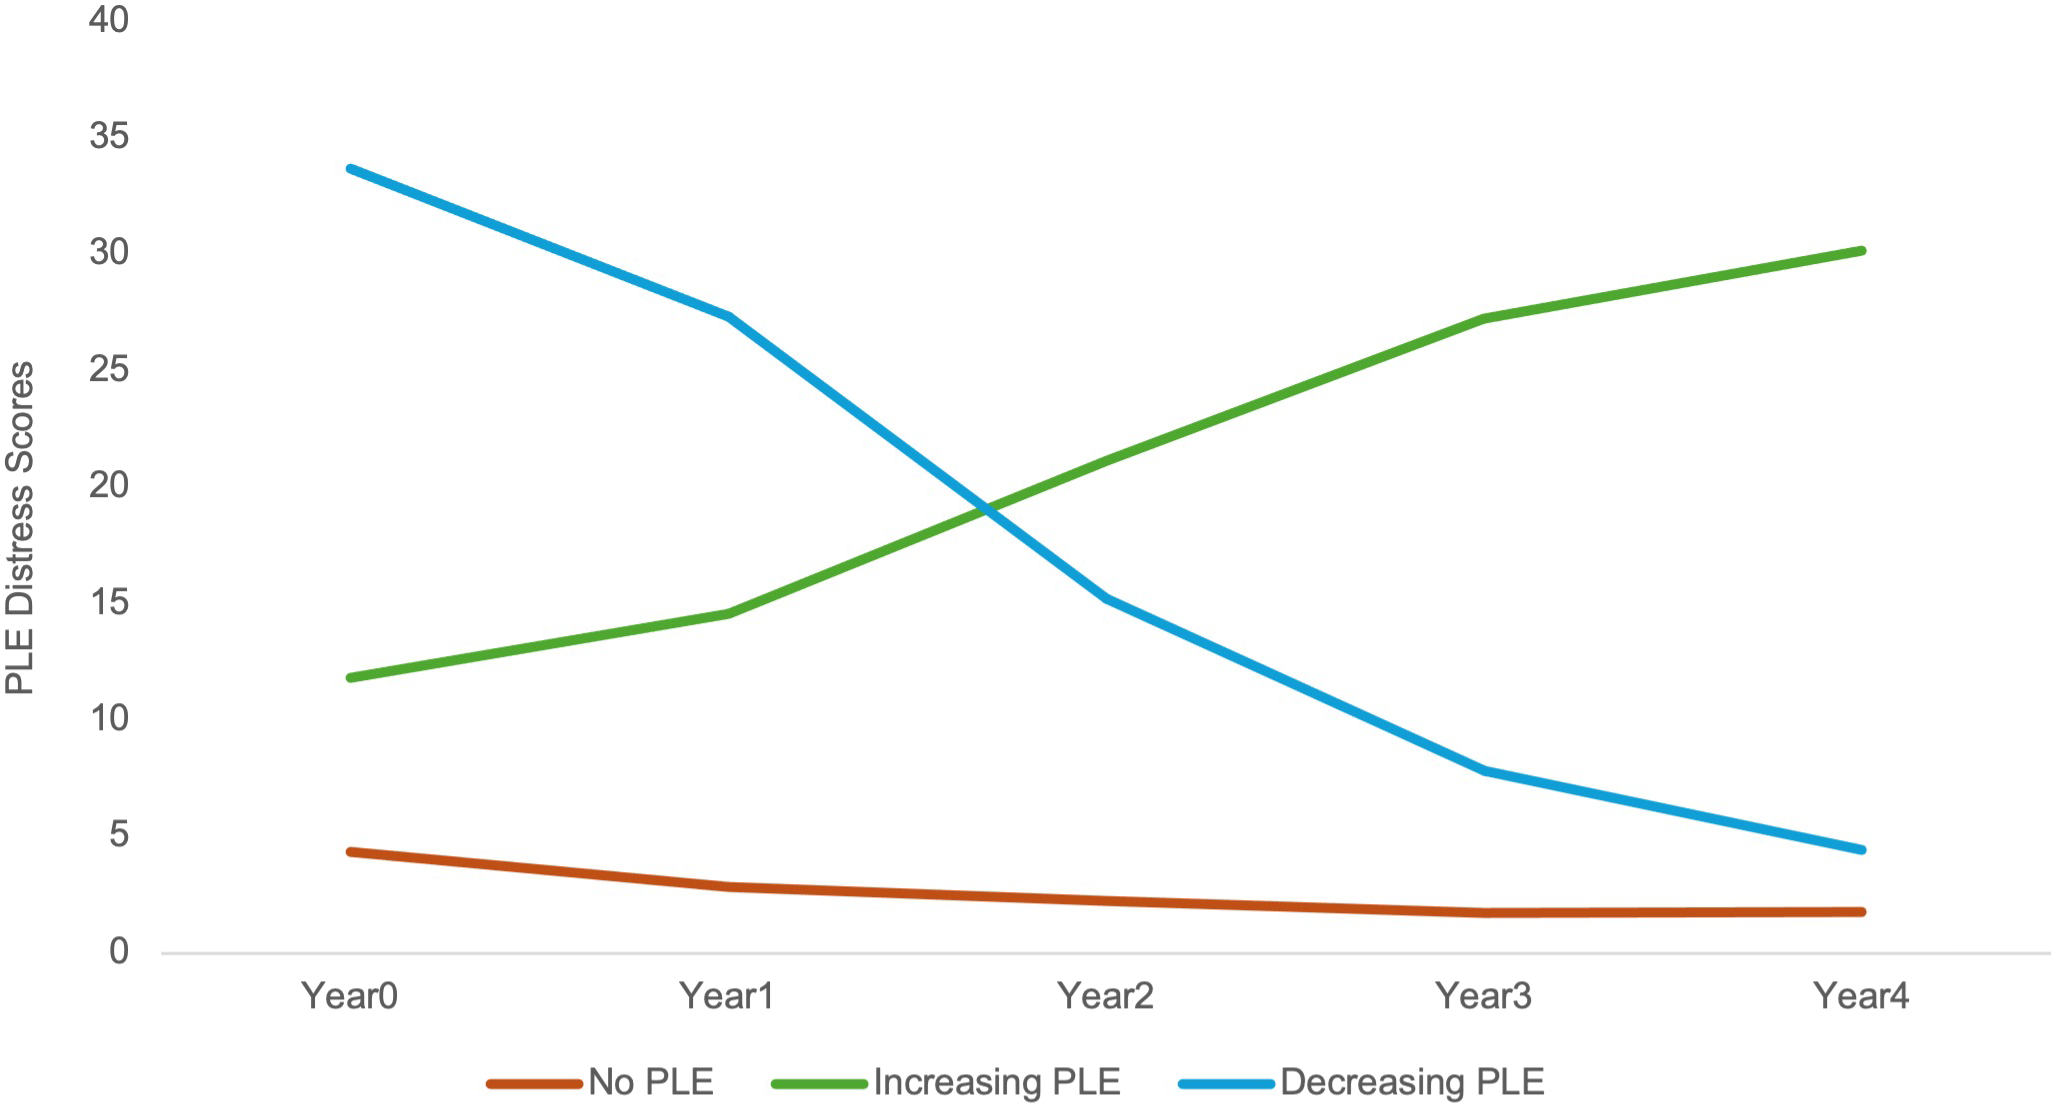
Figure 1. Long description
The line graph illustrates the trajectories of psychotic-like experiences (PLE) distress levels over a span of five years, categorized into three distinct groups: No PLE, Increasing PLE, and Decreasing PLE. The x-axis represents the years from Year 0 to Year 4, while the y-axis indicates the PLE Distress Scores ranging from 0 to 40. The red line represents the No PLE group, which maintains a low and relatively stable distress score around 5 throughout the five years. The green line signifies the Increasing PLE group, starting at a distress score of approximately 10 in Year 0 and gradually rising to around 30 by Year 4. The blue line denotes the Decreasing PLE group, beginning with a high distress score of about 35 in Year 0 and steadily declining to around 10 by Year 4. All values are approximated.
Demographic and symptom characteristics
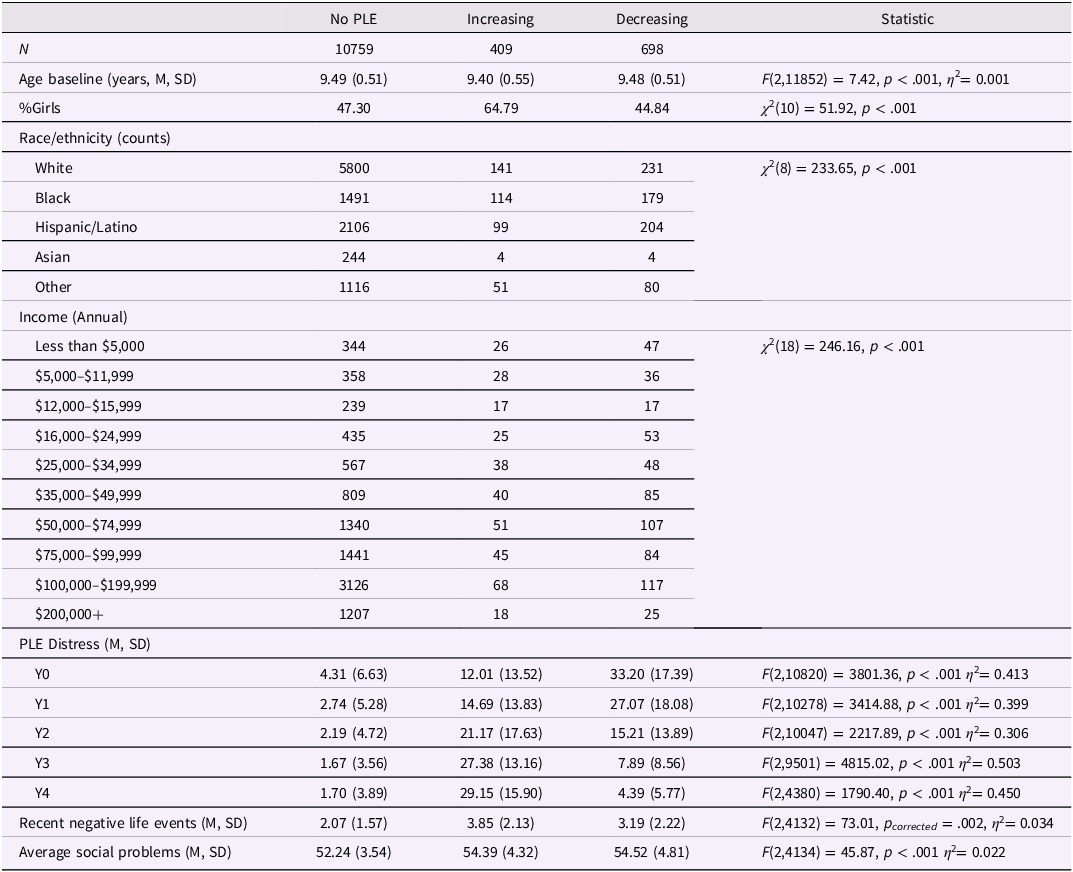
Table 1. Long description
The table presents demographic and symptom characteristics for three groups: No PLE, Increasing PLE, and Decreasing PLE. It includes data on age at baseline, percentage of girls, race/ethnicity, annual income, PLE distress over four years, recent negative life events, and average social problems. The No PLE group has 10,759 individuals, the Increasing PLE group has 409, and the Decreasing PLE group has 698. Age at baseline is similar across groups, around 9.49 years. The percentage of girls varies, with 47.30% in No PLE, 64.79% in Increasing PLE, and 44.84% in Decreasing PLE. Race/ethnicity distribution shows significant differences, with the No PLE group having the highest counts across all categories. Income levels are detailed, with the No PLE group having the highest counts in all income brackets. PLE distress levels show a notable increase in the Increasing PLE group and a decrease in the Decreasing PLE group over four years. Recent negative life events and average social problems are also compared, with the Increasing and Decreasing PLE groups showing higher values than the No PLE group.
Note. Psychotic-Like Experiences (PLE) were assessed using the Prodromal Questionnaire-Brief (PQ-B; Loewy et al., Reference Loewy, Bearden, Johnson, Raine and Cannon2005). Negative Life Events were averaged from Years 2–4 and were assessed using The Life Events Scale (Grant et al., Reference Grant, Compas, Thurm, McMahon and Gipson2004; Hoffman et al., Reference Hoffman, Clark, Orendain, Hudziak, Squeglia and Dowling2019; Tiet et al., Reference Tiet, Bird, Hoven, Moore, Wu, Wicks, Jensen, Goodman and Cohen2001). Average Social Problems were assessed with The Child Behavior Checklist (Achenbach & Edelbrock, Reference Achenbach and Edelbrock1991) and collected Years 0–4. Mean (M), Standard Deviation (SD).
Preliminary analyses
The PLE distress trajectories differed in age, sex assigned at birth, race and ethnicity, and household income (Table 1). Furthermore, the PLE distress trajectories differed in average social behaviors.
Psychotic-like experience distress trajectory differences in incidents of recent negative life events
Adolescents in the increasing PLE trajectory reported significantly more recent negative life events compared to the no PLE trajectory (B = 1.45, SE = 0.16, p < .0001), as did those in the decreasing PLE trajectory (B = 0.88, SE = 0.11, p < .0001). The increasing PLE trajectory also reported more recent negative life events than the decreasing PLE group (B = 0.57, SE = 0.18, p = .0021). Estimated marginal means were 2.08 (no PLE), 2.95 (decreasing PLE), and 3.52 (increasing PLE). See Supp Fig 2 for incidents of recent negative life events across time.
Psychotic-like experience distress trajectory differences in screen time
On a typical weekday, compared to the no PLE distress trajectory, the increasing PLE distress trajectory used significantly more screen time (B = 1.39, SE = 0.30, p < .001) as did the decreasing PLE distress trajectory (B = 1.27, SE = 0.21, p < .001). There were no differences between the increasing and decreasing PLE distress trajectories (B = 0.12, SE = 0.36, p = .75). See Figure 2, Supp Fig 3 for screen time (weekday/weekend) across years between trajectories, and Supp Fig 4 for differences in specific screen types, which showed a similar pattern across specific screen types.
Psychotic-like experience distress trajectory differences in screen time on a typical weekday and weekend day.
Note. Screen time on a typical weekday and weekend day were deduced by summing all screen types used (television/video viewing, video game use, texting, social media, video chat) on a typical day to create a global screen time use on a typical weekday/weekend variable.
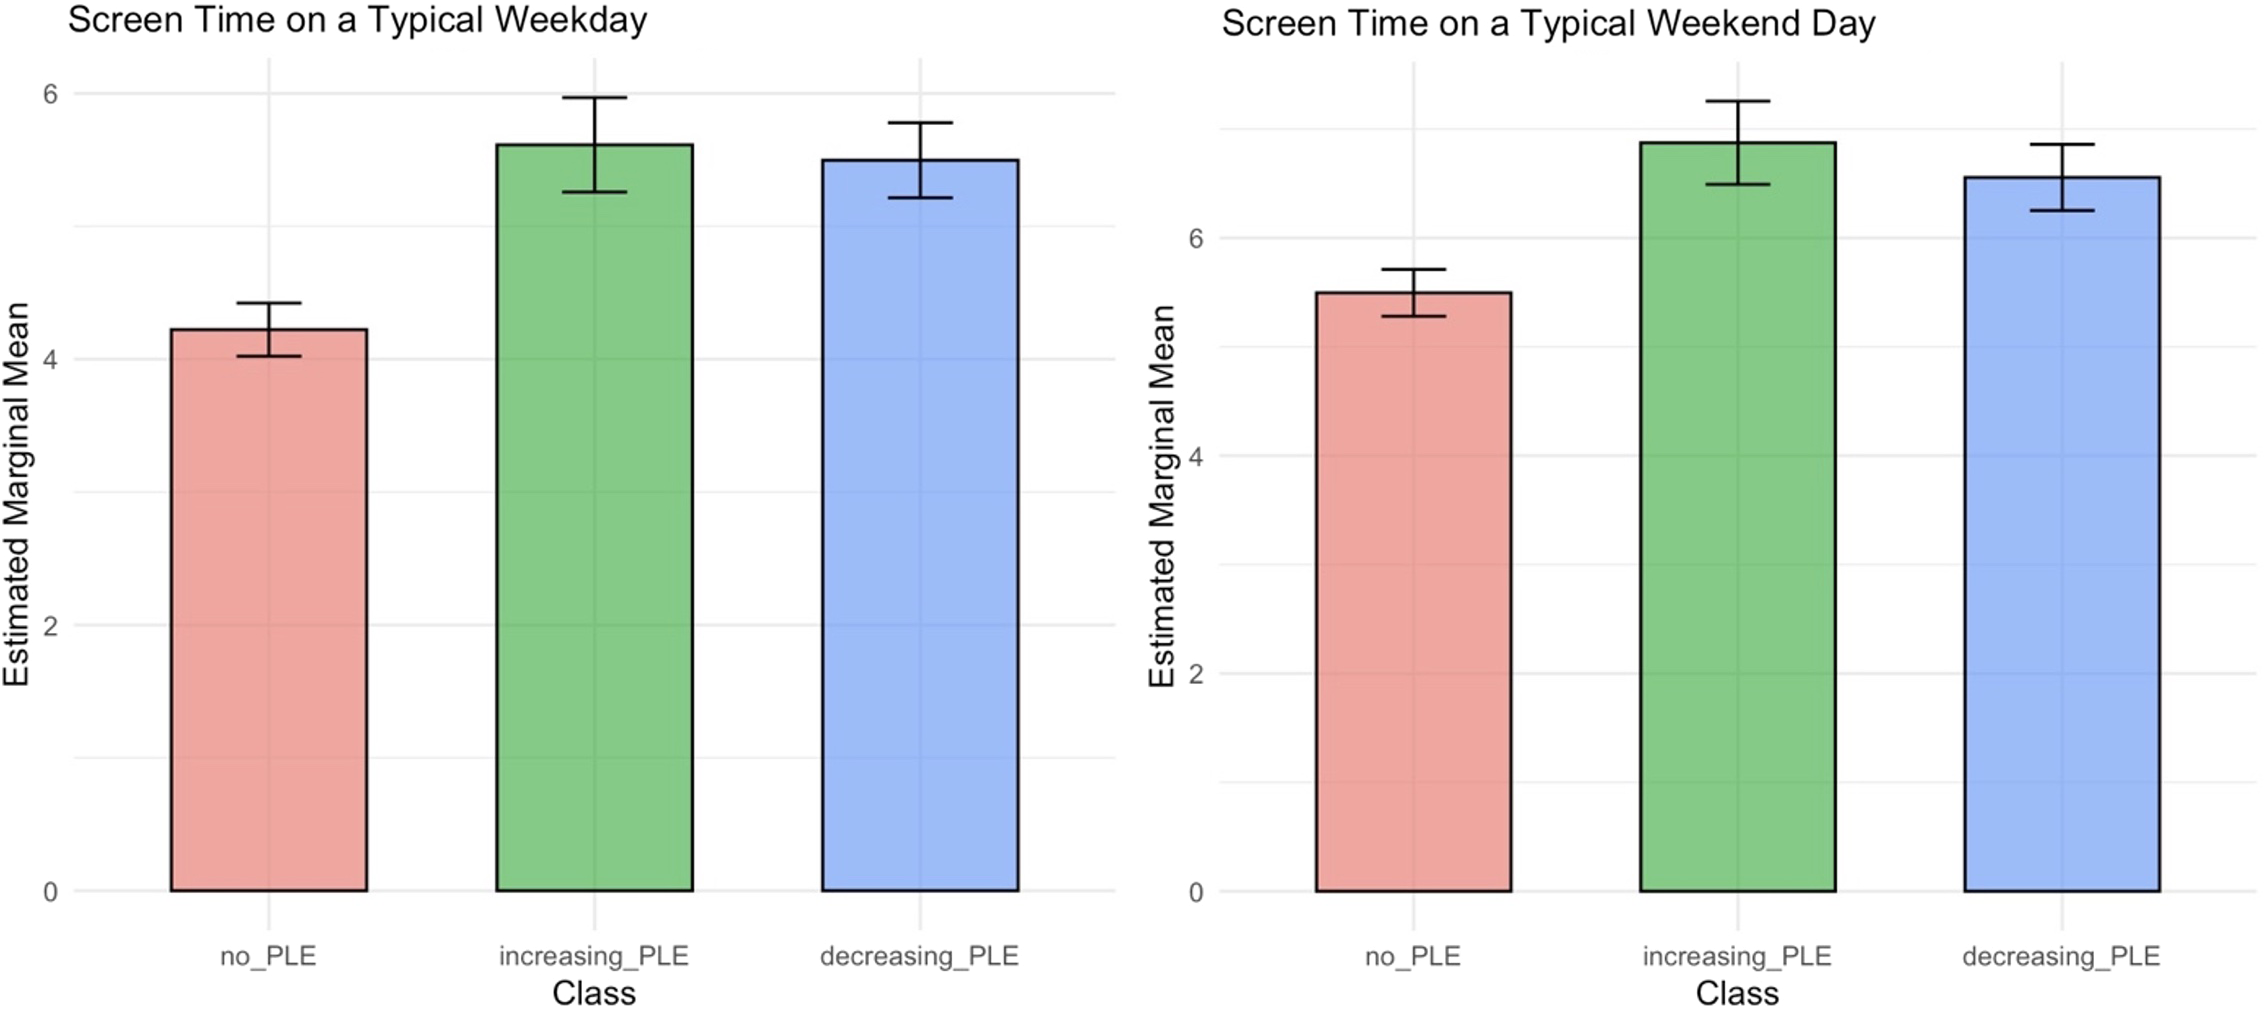
Figure 2. Long description
The bar graph compares screen time on a typical weekday and weekend day across three classes: no PLE, increasing PLE, and decreasing PLE. The x-axis represents the classes, and the y-axis represents the estimated marginal mean screen time. There are two sets of bars, one for weekdays and one for weekend days. Each set includes three vertical bars: a red bar for no PLE, a green bar for increasing PLE, and a blue bar for decreasing PLE. On a typical weekday, the no PLE class has an estimated marginal mean screen time of approximately 4, the increasing PLE class has a screen time of approximately 6, and the decreasing PLE class has a screen time of approximately 5. On a typical weekend day, the no PLE class has an estimated marginal mean screen time of approximately 5, the increasing PLE class has a screen time of approximately 6, and the decreasing PLE class has a screen time of approximately 5. All values are approximated.
Similarly, on weekends, both the increasing PLE distress trajectory (B = 1.38, SE = 0.32, p < .001) and the decreasing PLE distress trajectory (B = 1.06, SE = 0.23, p < .001) reported significantly more screen time than the no PLE distress trajectory. There was no significant difference between the increasing and decreasing PLE distress trajectories (B = 0.32, SE = 0.38, p = .41).
Three-way interaction: Class membership, screen time, and recent negative life events predicting PLE distress levels at year 4
The three-way interaction between PLE trajectory class, weekend screen time, and recent negative life events was significant (b = −0.04, SE = 0.02, t(4102) = −2.22, p = .03) suggesting the combination of these variables differentiated PLEs 4-years later. The three-way interaction between PLE trajectory class, weekday screen time, and recent negative life events was not significant, p = .38
The influence of recent negative life events on screen time and psychotic-like experiences distress levels in the increasing trajectory
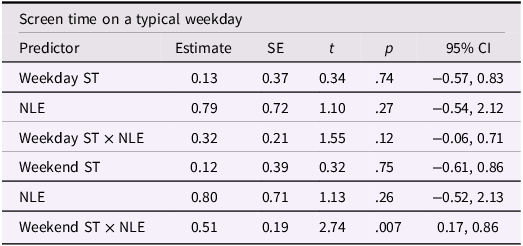
There was a significant interaction between screen time on a typical weekend day and the average number of recent negative life events experienced during adolescence in predicting PLE distress levels later in adolescence (at ages 13–14), in that more weekend screen time and more negative life event exposures predicted higher PLE distress levels (Figure 3, Table 2, Supp Table 2). JN analysis showed that screen time on a typical weekend day was significantly related to PLE distress levels when negative life event exposures were high (above 5.36). There was a positive association at low levels of exposure to negative life events (below 1.02) for a very small portion of the sample. Exploratory analyses examined interactions between screen time on a typical weekend day across specific screen types and exposure to negative life events in predicting increases in PLE distress levels later in adolescence. The association between texting (B = 1.85, SE = 0.66, t[90] = 2.82, p = .006) and social media use (B = 1.20, SE = 0.56, t[90] = 2.13, p = .036) and PLE distress levels later in adolescence was positive and stronger for adolescents with greater exposure to negative life events. There were no significant findings with weekend television/video viewing, video game use, and video chat (ps: 0.06–0.96).
Moderation findings of screen time (at ages 11–12) and the number of negative life events predicting psychotic-like experiences later in adolescence (at ages 13–14). Note for A, C, D. Screen time is in hours. PLE distress scores are sum scores. Negative life events = NLE are average negative life events across Years 1–4. Johnson-Neyman analyses (see B): The X-axis represents negative life events and the y-axis represents the slope of average screen time across screen types on the weekends at ages 11–12 (predictor) on PLE distress levels later in adolescence (ages 13–14) (outcome). In other words, the association between screen time on the weekends early in adolescence and PLE distress levels later in adolescence became more positive at high levels of average negative life event exposures.
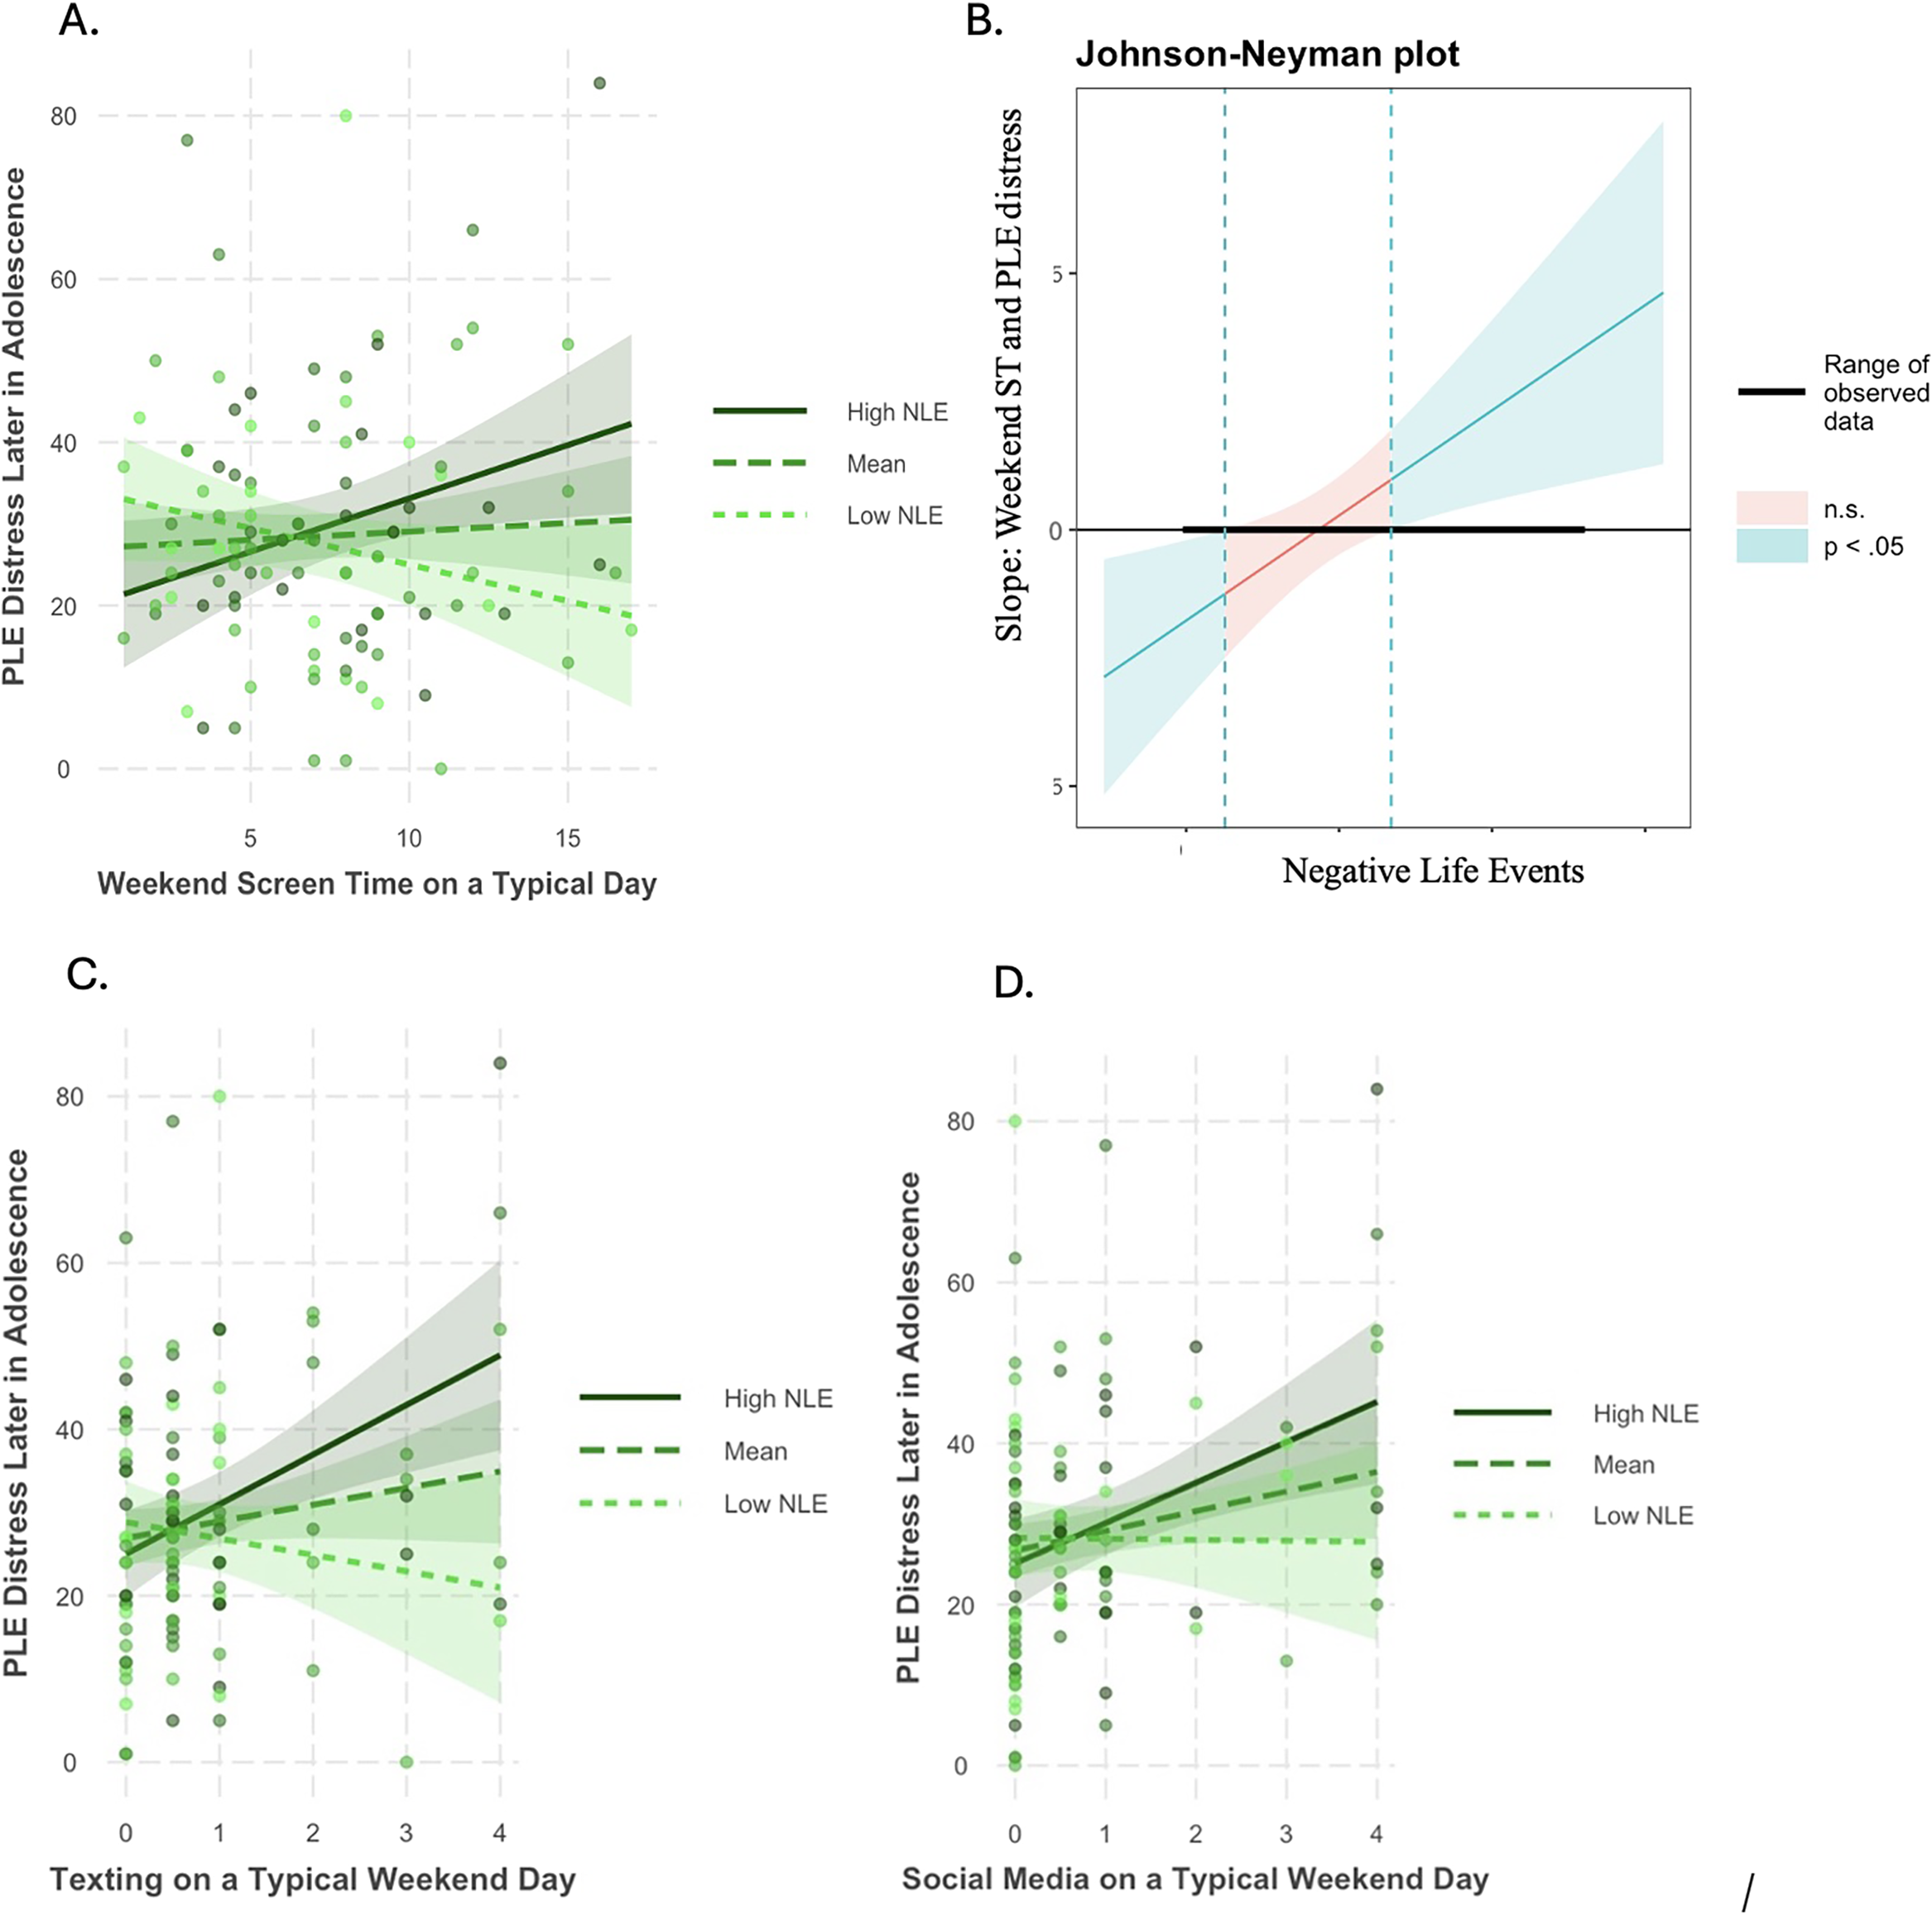
Figure 3. Long description
The image contains four scatter plots labeled A, B, C, and D. Plot A shows the relationship between weekend screen time and psychotic-like experiences (PLE) distress in adolescence, with lines representing high, mean, and low negative life events (NLE). Plot B is a Johnson-Neyman plot illustrating the slope of weekend screen time and PLE distress across different levels of negative life events. Plot C depicts the relationship between texting on a typical weekend day and PLE distress, again with lines for high, mean, and low NLE. Plot D shows the relationship between social media use on a typical weekend day and PLE distress, with similar lines for high, mean, and low NLE. The plots indicate that higher levels of negative life events are associated with a more positive relationship between screen time and PLE distress.
Fixed effects from linear mixed-effects models in increasing PLEs trajectory group assessing interactions of negative life events and screen time in predicting psychotic-like experiences later in adolescence (at ages 13–14, Year 4)
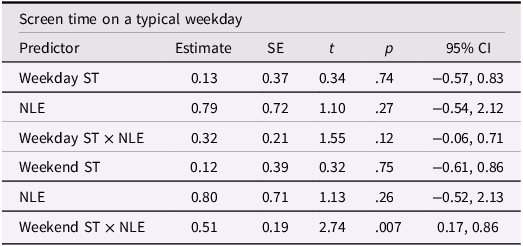
Table 2. Long description
The table presents the fixed effects from linear mixed-effects models, focusing on the interactions between negative life events and screen time in predicting psychotic-like experiences (PLE) later in adolescence. The table includes predictors such as weekday screen time, negative life events (NLE), and their interactions, as well as weekend screen time and its interactions with NLE. It lists estimates, standard errors (SE), t-values, p-values, and 95% confidence intervals (CI) for each predictor. Notable predictors include weekday screen time with an estimate of 0.13, NLE with an estimate of 0.79, and their interaction with an estimate of 0.32. Weekend screen time has an estimate of 0.12, NLE an estimate of 0.80, and their interaction an estimate of 0.51. The table highlights significant interactions, particularly the positive association between weekend screen time, negative life events, and PLE distress levels.
Note. Linear mixed model fit by REML. ST = Year 2 values, NLE (Negative Life Events) are averages across Years. SE = standard error; df = degrees of freedom; CI = confidence intervals. Random effects variance (standard deviation) for the weekday screen time model: family (intercept) = 0.00 (0.00), site (intercept) = 0.00 (0.00), residual = 200.10 (14.14); REML criterion = 818.3; n = 103. For the weekend screen time model: family (intercept) = 0.00 (0.00), site (intercept) = 0.00 (0.00), residual = 189.60 (13.77); REML criterion = 817.1; n = 103. Random intercepts showed negligible variance, indicating minimal clustering by family or site. Main effects are estimated from a model that includes only main effects (i.e., without interaction terms) to allow for interpretation as average effects across levels of other variables. Interaction terms are reported from a separate model that includes the relevant interactions.
There was no significant interaction between screen time on a typical weekday and the number of negative life events in predicting PLE distress levels later in adolescence.
The influence of recent negative life events on screen time and psychotic-like experiences distress levels in the no PLE and decreasing trajectories
In the no PLE distress trajectory and in the decreasing PLE trajectory, recent negative life events did not significantly interact with screen time on the weekday, (no PLE, p = .22; decreasing, p = .42), or weekends, (no PLE, p = .55; decreasing, p = .17), to predict PLEs at year 4.
Sensitivity analyses: cumulative stress
Sensitivity analyses examining interactions between cumulative stress, screen use (weekday, weekend), and trajectory class membership in predicting PLEs at year-4 did not reveal significant interactions (weekend screen use, p = .15, or weekday screen use, p = .38).
Discussion
These findings suggest there is unique heterogeneity in PLE distress levels across adolescence and that patterns of PLE distress over time may be influenced by a combination of incidents of recent negative life events and screen time. While prior work has examined screen time broadly in the context of PLEs using the ABCD Study (e.g., Cooper et al., Reference Cooper, van Der Ven and Jalbrzikowski2026), this is the first study, to our knowledge, to apply the DSMM to trajectories of PLEs and further unpack types of screens and their associations with recent negative life events in predicting PLEs. Our results support the DSMM notion that media effects are not uniform, but instead unfold differentially across youth, depending on the interaction between digital behaviors and perhaps, the timing of adverse life experiences. In this case, exposure to negative life events may represent a dispositional susceptibility, heightening vulnerability to the psychological impact of screen-based activities. Guided by neurodevelopmental diathesis-stress models, we conceptualize psychosis vulnerability as potentially arising from interactions between pre-existing risk and developmentally timed, proximal stressors across late childhood and early adolescence. In adolescence, a period of rapid social reorientation toward peer and screen-based contexts, the extent to which screen time confers risk for PLEs may depend on both recent stress exposure and underlying vulnerability (Vargas & Mittal, Reference Vargas and Mittal2022).
Our findings contribute to research on the development of PLEs in children and adolescents. In this sample, Karcher and colleagues (Karcher et al., Reference Karcher, Loewy, Savill, Avenevoli, Huber, Makowski, Sher and Barch2022) found that adolescents with persistent and distressing levels of PLEs experienced worse clinical outcomes. As shown in Supp Fig 1, youth in this sample, on average, showed decreases in PLE distress levels across time. However, the identification of subgroups using the data-driven approach allowed us to uncover information that may have otherwise been missed. In our approach, we identified a trajectory characterized by high levels of PLE distress that decreased over time, in contrast to our predictions that we would identify a PLE distress trajectory characterized by persistent levels of distress over time. The identification of this trajectory aligns with previous literature suggesting that it is normative for PLEs to decrease as youth transition into adulthood (Karcher, Reference Karcher2022). As evidenced in the literature, PLEs early in life may be normative and not clinically meaningful, potentially reflecting transient experiences, misunderstanding of self-report questions, or cultural experiences that are developmentally appropriate (Karcher, Reference Karcher2022). At the same time, the decreasing PLE distress trajectory reported more screen time and negative life events than those with no PLEs. Future research should better characterize the decreasing PLE distress trajectory to determine whether this is truly a group of adolescents who experience transient, normative experiences that resolve over time and whether the presence of greater negative life events is associated with other mental health outcomes for this group.
Also, in contrast to our predictions expecting a persistent PLE distress trajectory, we identified a trajectory in which PLE distress levels began high in early adolescence and steeply increased over time. This group may be especially vulnerable to the development of psychopathology, as previous studies have shown that elevated PLE distress levels are associated with a wide range of impairments. This is particularly concerning because PLEs can be isolating, which may be related to elevated experiences of loneliness (Lim et al., Reference Lim, Gleeson, Alvarez-Jimenez and Penn2018) and decreased social support (Huang et al., Reference Huang, Hou, Huang, He, Wang, Chen, Wang, Wang and Jia2019) during a period of time where the social context shifts from family to peers.
Our findings indicate three distinct trajectories characterized by increasing distress, decreasing distress, and minimal or absent distress over time which differs somewhat from prior reports of four-class solutions that emphasize persistently elevated versus declining distress trajectories (e.g., Cooper et al., Reference Cooper, van Der Ven and Jalbrzikowski2026). Differences in identified trajectories likely reflect key analytic distinctions in the present study, including the use of full-information maximum likelihood to handle missing data, modeling PLE distress as a continuous outcome, and a focused examination of distress trajectories rather than multiple PLE domains. Critically, Cooper and colleagues (Reference Cooper, van Der Ven and Jalbrzikowski2026) included data collected up to 3-year follow-up whereas we examined data up to 4-year follow-up, which could also explain slight differences in the number of identified trajectories. Together, these choices reflect our analytic goals and highlight a complimentary approach to modeling heterogeneity in PLE-related distress across different timepoints. Our findings are largely consistent with prior work that has identified three trajectories of PLEs (e.g., Jia et al., Reference Jia, Wei, Liu, Yu, Zhang, He, Xi, Chen and Zhang2025), although our study focused on distress trajectories, in particular, given the importance of distress in predicting outcomes later in adolescents.
Examination of incidents of recent negative life events provides insights into additional characterizations of the increasing PLE distress trajectory. From a diathesis-stress model framework of psychosis, exposure to stressful life events is a hallmark factor contributing to the emergence of psychosis (Walker & Diforio, Reference Walker and Diforio1997). Our work provides insights on these associations in a large community sample of adolescents with increasing PLEs, suggesting that progression of PLEs may be influenced by continued exposure to recent negative life events (Lataster et al., Reference Lataster, Myin-Germeys, Lieb, Wittchen and Van Os2012). The timing of life stress in adolescent development may increase stress sensitivity, given that adolescents are already vulnerable to insults during this sensitive developmental period, which involve co-occurring processes such as brain development that are rapidly and dynamically changing (Dahl, Reference Dahl2004).
Our findings could also have important implications for understanding the larger developmental landscape of youth with heightened PLE distress levels. Importantly, our study revealed that recent negative life events moderated the interaction between screen time and PLE trajectory class in predicting PLEs at year 4, whereas less temporally specific cumulative indices of stress did not. This may suggest that more proximal adverse life experiences-which co-occur with adolescent development and increased screen time behaviors – may be particularly meaningful, although additional research is needed before definitive conclusions can be made.
Surprisingly, there were no differences in the average amount of daily screen time between the increasing and decreasing PLE distress trajectories. However, both groups reported generally higher amounts of screen times compared to the no PLE group. This suggests that the association between screen time and PLE distress trajectories is complex and likely influenced by several interacting factors beyond screen time alone. However, our moderation analysis showed that, within the increasing PLE trajectory only, youth who experienced more incidents of negative life events and engaged in greater weekend screen use at ages 11–12 – particularly texting and social media – were more likely to show increases in PLE distress levels at ages 13–14. Prior research has shown that screen time can have both positive and negative effects on youth emotional health (Granic et al., Reference Granic, Lobel and Engels2014; Paquin et al., Reference Paquin, Ferrari, Rej, Boivin, Ouellet-Morin, Geoffroy and Shah2024; Przybylski & Weinstein, Reference Przybylski and Weinstein2017; Song et al., Reference Song, Zhang, Zhou, Fu, Zou, Xu, Wang, Li, Zhao, Potenza, Fang and Zhang2023) and that the amount of screen use is related to persistent elevations in PLEs (Cooper et al., Reference Cooper, van Der Ven and Jalbrzikowski2026). Prior research shows moderate levels of screen use may be advantageous for youth who are embedded in a largely digitally connected environment (Przybylski & Weinstein, Reference Przybylski and Weinstein2017). However, it could be that adolescents with a history of negative life events may be especially vulnerable to the harmful aspects of the digital social environment. From a diathesis-stress model perspective, adolescents may be more sensitive to negative online content and interactions (e.g., social comparison, rejection, cyberbullying, distressing news), which may increase the progression of distress from PLEs. Relatedly, recent work highlights neural sensitivity to social evaluation may moderate the impact of social media on youth mental health, particularly among those already emotionally vulnerable (Silk et al., Reference Silk, Sequeira, James, Kilic, Grad-Freilich, Choukas-Bradley and Ladouceur2024). Recognizing vulnerabilities as such can help clarify why some adolescents are more adversely impacted by digital environments than others. Additionally, adolescents with PLEs tend to report more rumination (Fazio et al., Reference Fazio, Raio, Banaschewski, Bokde, Desrivières, Flor, Garavan, Gowland, Grigis, Heinz, Martinot, Paillère Martinot, Artiges, Nees, Papadopoulos Orfanos, Paus, Poustka, Smolka and Hohmann2024), potentially leading to other concerning outcomes. Rumination in response to negative digital experiences might heighten distress and contribute to worse clinical outcomes (Kilic et al., Reference Kilic, McKone, Stout, Grad-Freilich, Ladouceur, Choukas-Bradley and Silk2024). It is also possible that youth with increasing PLEs are more likely to engage in maladaptive coping strategies (Phillips et al., Reference Phillips, Edwards, McMurray and Francey2012), such as excessive use of social media or text messaging, as a way to distract or escape from their distress from stressful life events (Lee et al., Reference Lee, Ban, Kim, Kim, Shin, Yoon and Kim2019).
Further, prior work links PLEs to impaired in-person social functioning (Mittal et al., Reference Mittal, Tessner and Walker2007) and low social support (Huang et al., Reference Huang, Hou, Huang, He, Wang, Chen, Wang, Wang and Jia2019). It could be that youth with increasing PLE distress levels are relying on texting and social media to connect with others due to fewer in-person social interactions. It is also possible that the nature and quality of social interactions that are occurring via social media and texting for some youth--which are likely more superficial than in-person interactions-are not providing the buffer to protect against the progression of PLEs in the context of environmental stressors. Positive social interactions are suggested to buffer against not only stress (Cohen & Wills, Reference Cohen and Wills1985), but also PLE progression, as social isolation presents fewer opportunities for reality-testing and positive experiences from normative social contact (Lim et al., Reference Lim, Gleeson, Alvarez-Jimenez and Penn2018; Mittal et al., Reference Mittal, Tessner and Walker2007). It is critical for future work to examine the nature and quality of digital social interactions to better tease apart these differences to understand these dynamics and clarify their role in the progress of PLE distress levels.
Additionally, our moderation findings were specific to texting and social media on the weekends, which raises the question as to how adolescents are spending their time during this portion of the week. One plausible explanation is that youth using more screen time on the weekends may have less robust in-person social networks and fewer opportunities for socializing. Another possibility is that youth are seeking texting and social media to avoid difficult family situations such as conflict, familial stress, or responding to lack of supervision. This is particularly plausible since, as mentioned, the increasing PLE distress trajectory reported more negative life events, which include questions about family dynamics (e.g., family conflict, divorce, mental health of family members). Previous work has shown that adolescents who experience poor family functioning also report higher rates of PLEs (Wu et al., Reference Wu, Zou, Wang, Xiang, Zhu, Long, Tao, Palaniyappan and Liu2021). While we did not examine the role of family conflict and environment in these associations, this direction could be fruitful for better understanding the function of screen time for youth with PLEs.
While this study has several strengths including the use of robust modeling strategies in a large data set, community sample of adolescents, and assessment of multiple screen types, there are important limitations to discuss as well. As mentioned, we did not have the ability to examine the content or locations of screen time, or to delve more extensively into subtypes of social media platforms. This information could help explore our hypothesis that youth are using social-related screens in order to seek social support but may be experiencing diminished quality of screen-related interactions. Furthermore, understanding whether screen time is occurring at home, school, or in another location might provide insights into whether youth are participating in fewer in-person interactions, as we suspect. It is important to note that the data used in this study was collected during a period that spanned the COVID-19 pandemic (data collection was mid 2018-mid 2021 for Year 2 and lockdown occurred starting March 2020). While most of the data in this window were collected prior to the pandemic, the timing of the lockdown is important to consider when interpreting our findings. The ABCD 5.1 release included 4-year follow-up data for 40.1% of the full cohort, with the increasing PLE trajectory group having proportionally less 4-year data released. Future work using subsequent ABCD releases with complete 4-year data will be important for replicating and extending these findings. There are also important insights to be gained from examining the amount of time spent actively engaging in different types of screen time (responding to texts, commenting on posts) vs passively participating (reviewing previous texts, passively scrolling). Additionally, we did not examine whether screen time types were being used in tandem, which would be a useful future direction.
Supplementary material
The supplementary material for this article can be found at https://doi.org/10.1017/S0954579426101588.
Data availability statement
Data are publicly available through the ABCD Study Data Repository (https://nda.nih.gov/abcd). Analysis code is available from the corresponding author upon request. Analysis code was not formally archived in a public repository.
Acknowledgments
Data used in the preparation of this article were obtained from the Adolescent Brain Cognitive DevelopmentSM (ABCD) Study (https://abcdstudy.org), held in the NIMH Data Archive (NDA). This is a multisite, longitudinal study designed to recruit more than 10,000 children age 9-10 and follow them over 10 years into early adulthood. The ABCD Study® is supported by the National Institutes of Health and additional federal partners under award numbers U01DA041048, U01DA050989, U01DA051016, U01DA041022, U01DA051018, U01DA051037, U01DA050987, U01DA041174, U01DA041106, U01DA041117, U01DA041028, U01DA041134, U01DA050988, U01DA051039, U01DA041156, U01DA041025, U01DA041120, U01DA051038, U01DA041148, U01DA041093, U01DA041089, U24DA041123, U24DA041147. A full list of supporters is available at https://abcdstudy.org/federal-partners.html. A listing of participating sites and a complete listing of the study investigators can be found at https://abcdstudy.org/consortium_members/. ABCD consortium investigators designed and implemented the study and/or provided data but did not necessarily participate in the analysis or writing of this report. This manuscript reflects the views of the authors and may not reflect the opinions or views of the NIH or ABCD consortium investigators. The ABCD data repository grows and changes over time. The ABCD data used in this report came from NIMH Data Archive Release 5.1 (https://doi.org/10.15154/z563-zd24).
Funding statement
The ABCD Study® is supported by the National Institutes of Health and additional federal partners under award numbers: U01DA041048, U01DA050989, U01DA051016, U01DA041022, U01DA051018, U01DA051037, U01DA050987, U01DA041174, U01DA041106, U01DA041117, U01DA041028, U01DA041134, U01DA050988, U01DA051039, U01DA041156, U01DA041025, U01DA041120, U01DA051038, U01DA041148, U01DA041093, U01DA041089, U24DA041123, U24DA041147. A full list of supporters is available at Federal Partners – ABCD Study.
Competing interests
None.
Pre-registration statement
Analyses were not pre-registered. This study represents a secondary analysis of an existing data set (ABCD Study) with hypotheses derived from prior literature.





 Open access

