


Introduction
Second language (L2) pronunciation research has examined a range of constructs that manifest in learners’ speaking performance, such as accentedness, comprehensibility, and intelligibility (Munro & Derwing, Reference Munro and Derwing2015). These studies have provided collective evidence of the interrelationships among different constructs, suggesting that, for example, accented speech is not necessarily incomprehensible (Chau & Huensch, Reference Chau and Huensch2025) and thereby that achieving nativelikeness should not be the ultimate goal for many L2 learners (Levis, Reference Levis2005). In response to this paradigm shift, comprehensibility—defined as “perceived degree of difficulty experienced by the listener in understanding speech” (Munro & Derwing, Reference Munro and Derwing2015, p. 14)—has emerged as one of the key constructs in L2 pronunciation research. Comprehensibility has often been measured by asking listeners to assess L2 learners’ speaking performance with rating scales, such as 9-point (e.g., Saito et al., Reference Saito, Trofimovich and Isaacs2016; Suzuki & Kormos, Reference Suzuki and Kormos2020; Thorpe et al., Reference Thorpe, Baker-Smemoe, Hartshorn, McMurry and Wilcox2025), 100-point (e.g., Huensch & Nagle, Reference Huensch and Nagle2021; Nagle et al., Reference Nagle, Trofimovich, O’brien and Kennedy2022; Trofimovich et al., Reference Trofimovich, Nagle, O’Brien, Kennedy, Taylor Reid and Strachan2020), and 1,000-point scalesFootnote 1 (e.g., Bergeron & Trofimovich, Reference Bergeron and Trofimovich2017; Crowther et al., Reference Crowther, Trofimovich, Isaacs and Saito2015; Saito et al., Reference Saito, Trofimovich and Isaacs2017). For example, Saito et al. (Reference Saito, Macmillan, Mai, Suzukida, Sun, Magne and Murakami2020) asked listeners to choose a score categoryFootnote 2 on a 9-point scale ranging from a score of 1 that represented very difficult to understand to a score of 9 that represented very easy to understand, while Huensch and Nagle (Reference Huensch and Nagle2023) used a 100-point scale where very difficult to understand and very easy to understand represented incomprehensible speech and comprehensible speech, respectively.
Validity evidence for these rating scales has been collected primarily by examining Cronbach’s alpha and intraclass correlation that indicate interrater consistency among listeners (Kostromitina et al., Reference Kostromitina, Sudina and Baghlaf2025) and by examining the relationship between linguistic features and comprehensibility ratings (e.g., Isaacs & Trofimovich, Reference Isaacs and Trofimovich2012; Saito et al., Reference Saito, Trofimovich and Isaacs2016; Suzuki & Kormos, Reference Suzuki and Kormos2020; Tsunemoto & Trofimovich, Reference Tsunemoto and Trofimovich2024). Meanwhile, other studies have challenged the use of these rating scales because such scales present a substantially large number of score categories, which sometimes do not come with numerical values, and consequently cause raters’ inconsistent scale use and suboptimal scale functioning (Isaacs & Thomson, Reference Isaacs and Thomson2013; Isbell, Reference Isbell, Kang and Ginther2018; Kermad, Reference Kermad2024). Additionally, the presence of many score categories does not guarantee that scores can be treated as continuous variables because obtained scores are in principle ordinal unless equal intervals among adjacent scores are empirically observed (Isbell, Reference Isbell, Kang and Ginther2018). Given that previous studies have provided both positive and negative evidence regarding long rating scales, it is reasonable to claim that further validation studies are still needed, rather than accepting these rating scales as validated instruments.
However, many L2 pronunciation studies still use rating scales with many score categories, justifying their scale length simply because previous studies used the same scale length without referring to validity evidence (e.g., Ali, Reference Ali2023; Bergeron & Trofimovich, Reference Bergeron and Trofimovich2017; Crowther et al., Reference Crowther, Trofimovich, Isaacs and Saito2015; Thorpe et al., Reference Thorpe, Baker-Smemoe, Hartshorn, McMurry and Wilcox2025). This methodological convention can be concerning because researchers’ arbitrary choice of scale length may influence their research findings. For example, Chau and Huensch (Reference Chau and Huensch2025) reported that correlations among global constructs, such as comprehensibility and accentedness, tended to be higher for longer scales (e.g., 100- and 1,000-point scales) than for shorter scales (e.g., 5-, 7-, and 9-point scales). Therefore, empirical pursuit of a better rating scale has great potential to minimize the inconsistent research findings, potentially boosting replicability among primary studies.
Against this backdrop, the present study aims to provide further empirical evidence regarding potential limitations of long rating scales—defined here as scales containing nine or more score categories—used in L2 pronunciation research. The study first reviews previous studies in view of a validation framework, identifying the aspects of long rating scales for which more validity evidence is warranted. Then, the study reports on the reanalysis of the 9-point scale in Saito et al. (Reference Saito, Macmillan, Mai, Suzukida, Sun, Magne and Murakami2020) and the 100-point scale in Huensch and Nagle (Reference Huensch and Nagle2023) as these two studies present dense, well-controlled rating data. Using these two datasets as a point of illustration, the present study further proposes post hoc score category collapsing as a countermeasure against suboptimal scale functioning in research contexts. Overall, in response to Saito and Plonsky’s (Reference Saito and Plonsky2019) call, the study contributes to the empirical refinement of rating scales in L2 pronunciation research while also aiming to enhance researchers’ measurement practices more broadly.
Literature review
Assessment of comprehensibility in L2 pronunciation research
L2 pronunciation research has measured L2 learners’ comprehensibility using rating scales with varying granularity, such as 9-point, 100-point, and 1,000-point scales (Chau & Huensch, Reference Chau and Huensch2025; Kostromitina et al., Reference Kostromitina, Sudina and Baghlaf2025). According to Kostromitina et al.’s (Reference Kostromitina, Sudina and Baghlaf2025) methodological review of perception-based L2 pronunciation studies, among the rating scales whose reliability was examined via Cronbach’s alpha, the 9-point scale was the most frequently used (n = 64, 48%), followed by 1,000-point (n = 34, 26%), 7-point (n = 20, 15%), and 5-point scales (n = 11, 8%). A major reason for the widespread adoption of the 9-point scale can be the seminal paper by Munro and Derwing (Reference Munro and Derwing1995), where they asked 18 L1 speakers of English to rate the comprehensibility of 10 L1 Mandarin speakers and two L2 speakers of English with a 9-point scale. In their study, a score of 1 was labeled as extremely easy to understand, while a score of 9 was labeled as impossible to understand. The rest of the score categories (i.e., 2 through 8) were visually presented but came with no performance descriptors. Adapting this 9-point scale in different ways, many studies defined a score of 9 as a representation of comprehensible speech and a score of 1 as incomprehensible speech. For example, Saito et al. (Reference Saito, Macmillan, Mai, Suzukida, Sun, Magne and Murakami2020) labeled a score of 1 as very difficult to understand and a score of 9 as very easy to understand, and Isaacs and Trofimovich (Reference Isaacs and Trofimovich2012) labeled a score of 1 as hard to understand and a score of 9 as easy to understand. This endpoint labeling has been applied to 100-point and 1,000-point scales. Huensch and Nagle (Reference Huensch and Nagle2023) labeled a score of 0 on their 100-point scale as very difficult to understand and a score of 100 as very easy to understand. Saito et al. (Reference Saito, Trofimovich and Isaacs2017) labeled a score of 0 on their 1,000-point scale as difficult to understand and a score of 1,000 as easy to understand. Unlike the 9-point scale, where all possible scores from 1 through 9 are visually presented to raters, 100-point and 1,000-point scales often omit numerical markers, including those for the endpoints. Accordingly, raters were often asked to adjust the location of a slider bar to express their intuitive evaluation of comprehensibility, instead of choosing a discrete, prelabeled score (e.g., Crowther et al., Reference Crowther, Trofimovich, Isaacs and Saito2015; Huensch & Nagle, Reference Huensch and Nagle2021, Reference Huensch and Nagle2023; Saito et al., Reference Saito, Trofimovich and Isaacs2017). These unlabeled scales require raters to construct their own benchmarks and constantly think about what it means to be a score of 5 out of 9 and a score of 50 out of 100, for example, while simultaneously being influenced by their teaching experience and accent familiarity (Saito et al., Reference Saito, Tran, Suzukida, Sun, Magne and Ilkan2019; Tsunemoto et al., Reference Tsunemoto, Trofimovich and Kennedy2023; Winke et al., Reference Winke, Gass and Myford2013), among other individual difference factors.
Validity evidence for these rating scales has been pursued primarily in two ways. First, many researchers examine interrater reliability among raters (e.g., Ali, Reference Ali2023; Bergeron & Trofimovich, Reference Bergeron and Trofimovich2017; Crowther et al., Reference Crowther, Trofimovich, Isaacs and Saito2015; Galante & Thomson, Reference Galante and Thomson2017; Saito et al., Reference Saito, Trofimovich and Isaacs2017; Suzuki & Kormos, Reference Suzuki and Kormos2020; Tergujeff, Reference Tergujeff2021), attempting to validate generalization inference that scores assigned by a rater are generalizable to other raters (Knoch & Chapelle, Reference Knoch and Chapelle2018). Although their methodological review focused on assessment instruments intended for accentedness, comprehensibility, and intelligibility, Kostromitina et al. (Reference Kostromitina, Sudina and Baghlaf2025) found that approximately 48% of the reviewed instruments in L2 pronunciation research reported Cronbach’s alpha and 32% reported intraclass correlation coefficients. Those Cronbach’s alpha values were largely sufficient, ranging from .85 (5-point scale) to .94 (9-point scale). Similarly, intraclass correlation coefficients also ranged from .91 (1,000-point scale) to .97 (100-point scale). This evidence supports the claim that scores obtained from one rater are generalizable to other raters.
Secondly, another line of research examined the relationship between comprehensibility ratings and linguistic correlates in L2 speakers’ performance (Bergeron & Trofimovich, Reference Bergeron and Trofimovich2017; Isaacs & Trofimovich, Reference Isaacs and Trofimovich2012; Saito et al., Reference Saito, Trofimovich and Isaacs2016, Reference Saito, Trofimovich and Isaacs2017; Suzuki & Kormos, Reference Suzuki and Kormos2020; Tsunemoto & Trofimovich, Reference Tsunemoto and Trofimovich2024), validating the explanation inference that scores accurately represent the construct being measured (Knoch & Chapelle, Reference Knoch and Chapelle2018). Isaacs and Trofimovich’s (Reference Isaacs and Trofimovich2012) pioneering study asked 60 L1 speakers of English to assess the comprehensibility of picture description performances elicited from 40 L1 French learners of English. They also analyzed L2 learners’ performance in terms of 19 linguistic features, reporting that comprehensibility ratings were strongly related to both phonological and lexico-grammatical features, such as unique words and word stress errors. This line of research provides evidence that scores reflect differences in the language use observed in speech samples.
However, L2 pronunciation research has provided limited evidence regarding the functioning of a scale. Commonly used reliability indices, such as Cronbach’s alpha and intraclass correlation, do not provide direct evidence because those indices are no more than indicators of rater agreement (Isbell, Reference Isbell, Kang and Ginther2018). When Cronbach’s alpha is used to assess raters’ agreement, different raters are considered to be fixed test items; thus, Cronbach’s alpha indicates the extent to which different raters measure the same construct (i.e., unidimensionality). Regarding intraclass correlation, pronunciation researchers often use two-way consistency, average-measure intraclass correlation known as ICC(2, k) (e.g., Ali, Reference Ali2023; Huensch & Nagle, Reference Huensch and Nagle2023; Isbell, Reference Isbell, Kang and Ginther2018; Nagle & Rehman, Reference Nagle and Rehman2021). This type of intraclass correlation assumes that raters are randomly drawn from a pool of raters and is appropriate when raters’ averaged scores are of interest (Shrout & Fleiss, Reference Shrout and Fleiss1979). ICC(2, k) partitions variance attributable to examinees and variance attributable to raters, better reflecting raters’ consistency than Cronbach’s alpha (Isbell, Reference Isbell, Kang and Ginther2018). While commonly used among L2 pronunciation researchers, both Cronbach’s alpha and intraclass correlation deal with obtained ratings that are decontextualized from the scale design. Suppose that one rater assigns scores of 1, 3, and 9 and another rater assigns scores of 2, 4, and 6 for the same three examinees. Cronbach’s alpha is .86, and ICC(2, k) is .90. However, these ratings can be obtained either with a 9-point scale or with a 100-point scale. When a 9-point scale is used, raters appear to make use of diverse score categories (i.e., functional scale), but they use a narrow range of score categories on a 100-point scale (i.e., dysfunctional scale). As this example illustrates, while Cronbach’s alpha and intraclass correlation inform us about rater agreement, the functionality of a rating scale remains unknown unless ratings are interpreted in relation to the scale design.
Examining scale functioning pertains to evaluation inference that “Observations are evaluated using procedures that provide observed scores with intended characteristics” (Knoch & Chapelle, Reference Knoch and Chapelle2018, p. 483). Validating evaluation inference requires evidence that raters use the given rating scale as intended and that the rating scale functions as intended. For example, when raters are asked to use a 9-point scale, a score of 8 needs to represent more comprehensible speech than that represented by scores up to 7. Isaacs and Thomson’s (Reference Isaacs and Thomson2013) pioneering study tested this assumption by asking 40 novice and experienced raters to use 5-point and 9-point scales to assess comprehensibility of narrative speeches performed by 38 L2 speakers of English. They found that the 9-point scale did not reliably distinguish L2 speakers who were assigned different scores, especially due to raters’ confusion caused by the large number of score categories. Consequently, L2 speakers who were assigned middle score categories were particularly muddled, and speakers who were assigned a score of 2 were also likely to receive a score of 5 on the 9-point scale. Similarly, Isbell (Reference Isbell, Kang and Ginther2018) asked 10 L1 speakers of Korean to use a 9-point scale to assess picture description and read-aloud performances elicited from 36 L2 learners of Korean, finding that the middle scores, such as 4 and 6, were essentially interchangeable with adjacent score categories. More recently, Kermad (Reference Kermad2024) compared 30 untrained raters and 30 trained raters in their use of a 5-point scale while rating prompted speeches performed by 20 L2 learners of English. The study found that untrained raters did not use score categories appropriately, observing that the scores of 3 and 4 were essentially interchangeable. Trained raters, in contrast, used the rating scale as intended, assigning different scores to speakers who displayed speaking performance that differed in comprehensibility. These findings collectively suggest that long rating scales may be overly segmented and thereby impose greater cognitive load on raters, especially due to the presence of potentially redundant mid-points.
Despite potential confusion among raters caused by long rating scales, such scales continue to be used in L2 pronunciation research (Kostromitina et al., Reference Kostromitina, Sudina and Baghlaf2025). Indeed, some studies did not explicitly justify their scale length (e.g., Galante & Thomson, Reference Galante and Thomson2017; Isaacs & Trofimovich, Reference Isaacs and Trofimovich2012; Saito et al., Reference Saito, Tran, Suzukida, Sun, Magne and Ilkan2019), and others justified their scale length on the grounds that previous studies had used the same length (e.g., Ali, Reference Ali2023; Bergeron & Trofimovich, Reference Bergeron and Trofimovich2017; Crowther et al., Reference Crowther, Trofimovich, Isaacs and Saito2015; Suzuki & Kormos, Reference Suzuki and Kormos2020; Thorpe et al., Reference Thorpe, Baker-Smemoe, Hartshorn, McMurry and Wilcox2025; Uchihara et al., Reference Uchihara, Webb, Saito and Trofimovich2023). A few studies provided more concrete justifications, stating that long rating scales were expected to provide raters with sufficient response options (Tergujeff, Reference Tergujeff2021) and to enable scores to be treated as continuous variables (Huensch & Nagle, Reference Huensch and Nagle2021), for example. It is noteworthy that Nagle and Rehman (Reference Nagle and Rehman2021) is one of the few studies that explicitly drew on the rebuttal evidence from Isaacs and Thomson (Reference Isaacs and Thomson2013) and opted for a 7-point scale as an eclectic solution to address the drawbacks of 5-point and 9-point scales. While potentially reflecting the needs of their own research context on one hand, researchers’ arbitrary choice of scale on the other hand makes it difficult to draw solid conclusions due to variations in scale design.
As Isbell (Reference Isbell, Kang and Ginther2018) rightly pointed out, perhaps long rating scales have been tacitly justified because many studies primarily aimed to examine laypeople’s intuitive, impressionistic assessment of comprehensibility. Yet, this persistent methodological convention may also be ascribed to a lack of communication between second language acquisition (SLA) researchers and language testing researchers (Isaacs & Thomson, Reference Isaacs and Thomson2013). In fact, language testing researchers emphasize that rating scales need to undergo a sequence of validation processes that go far beyond calculating interrater reliability (Knoch & Chapelle, Reference Knoch and Chapelle2018). In addition, language testing researchers often use Rasch models that allow closer examination of rater behavior and scale functioning (McNamara et al., Reference McNamara, Knoch and Fan2019), but such an approach has rarely been used in L2 pronunciation research (Kostromitina et al., Reference Kostromitina, Sudina and Baghlaf2025). Although a few studies employed Rasch models, these studies mainly focused on speaker ability and listener severity without fully examining scale functioning (Nagle & Rehman, Reference Nagle and Rehman2021; Shintani et al., Reference Shintani, Saito and Koizumi2019). Clearly, more validity evidence is needed to justify researchers’ use of long rating scales.
Ordered thresholds and threshold distances as psychometric qualities of a rating scale
Two critical assumptions for a functional rating scale are “scale steps are adequate to distinguish among the levels that appear in the scale” and “raters are able to identify differences in performances across score levels” (Knoch & Chapelle, Reference Knoch and Chapelle2018, p. 483). These assumptions have been commonly examined via a Rasch measurement approach (Linacre, Reference Linacre2002), which allows the investigation of two key psychometric properties—ordered thresholds and threshold distances. First, the Rasch-Andrich threshold, or “the location corresponding to the equal probability of observing adjacent categories k-1 and k” (Linacre, Reference Linacre2002, p. 88), needs to increase for higher score categories (Linacre, Reference Linacre1999). Thresholds, also referred to as step calibrations, are estimated by polytomous Rasch models, such as the partial credit model (Masters, Reference Masters1982) and the rating scale model (Andrich, Reference Andrich1978). They indicate the relative probability of receiving a score versus a score one point lower. Negative threshold measures suggest that the higher score category is more likely to be observed than the lower score category, whereas positive threshold measures indicate that the lower score category is more likely to be observed. When threshold measures for higher score categories exceed those for lower score categories across any pairs of two adjacent score categories on a rating scale, such evidence supports the claim that different scores meaningfully reflect differences in L2 speakers’ ability level. Conversely, when threshold measures for lower score categories exceed those for higher score categories, the rating scale is said to exhibit threshold disordering. Threshold disordering indicates that a score category captures an overly limited range of the latent trait or represents a concept that is not well defined in respondents’ minds (Linacre, Reference Linacre2002). In practice, threshold disordering often occurs when a scale has too many categories relative to the ability distribution, or when raters struggle to link certain score categories to specific performance levels.
Another essential condition for a functional rating scale is that obtaining a certain score is sufficiently more difficult than obtaining the score one point lower. When two adjacent categories are equally likely to be chosen for the same examinee, it indicates that the same examinee’s ability can be represented by two score categories that are potentially interchangeable. Threshold distances can be calculated by the difference in logits between the Rasch-Andrich threshold of a score and that of the score one point lower. According to Linacre (Reference Linacre2002), the optimal threshold distance falls within 1.4 to 5.0 logits. Ordered thresholds and threshold distances can also be visually examined in probability curves, which depict the changing likelihood of each score category across examinees’ ability levels. Score categories are said to function properly when each score category displays a distinct peak in its probability curve.
There are two good reasons to assume threshold disordering and narrow threshold distances in the long rating scales used for speech comprehensibility. First, because it is usually difficult for a study to recruit learners with a wide range of proficiency, the sampled learners may display relatively homogeneous comprehensibility that cannot be meaningfully categorized into nine or more score categories. Indeed, Isaacs and Thomson (Reference Isaacs and Thomson2013) reported that raters perceived redundancy of some score categories of their 9-point scale (see also Isbell, Reference Isbell, Kang and Ginther2018; Kermad, Reference Kermad2024). Such redundancy potentially forces raters to choose a score category that does not precisely match the ability level constructed in the raters’ minds (Linacre, Reference Linacre2002). Secondly, for 100-point and 1,000-point scales, raters are asked to assign a score without knowing the exact score they are assigning because numerical values are often hidden on the scale (Bergeron & Trofimovich, Reference Bergeron and Trofimovich2017; Crowther et al., Reference Crowther, Trofimovich, Isaacs and Saito2015; Huensch & Nagle, Reference Huensch and Nagle2021; Nagle et al., Reference Nagle, Trofimovich, O’brien and Kennedy2022; Saito et al., Reference Saito, Trofimovich and Isaacs2017; Trofimovich et al., Reference Trofimovich, Nagle, O’Brien, Kennedy, Taylor Reid and Strachan2020). For example, in Crowther et al.’s (Reference Crowther, Trofimovich, Isaacs and Saito2015) 1,000-point scale, no numerical values were presented except for brief descriptions at the endpoints (i.e., 1 = hard to understand, 1,000 = easy to understand). As such, the relative difficulty of score categories may rest upon not only raters’ intuitive assessment of comprehensibility but also their operation of the slide bar. For example, raters may accidentally place the slide bar at a score of 60 for a speech performance that they think is better than another speech performance they assigned a score of 61 as these two score categories are placed extremely close on the continuum. Indeed, though they used a 1,000-point scale for audio-based measures, such as segmental errors and word stress errors, Saito et al. (Reference Saito, Trofimovich and Isaacs2016) reminded raters that even a slight adjustment of the slider could cause a substantial change in the rating, implying the critical role played by raters’ delicate operation of the slide bar. When threshold disordering and narrow threshold distances are observed, interpreting scores becomes difficult as higher scores do not necessarily represent higher ability levels.
Score category collapsing as a potential solution
One way to address disordered thresholds and narrow threshold distances is score category collapsing, whereby two or more score categories on a rating scale are merged into a single score category (Linacre, Reference Linacre2002). For example, when Rasch models suggest that scores of 2 and 3 are disordered on a 9-point scale (i.e., 123456789), those two score categories can be merged into a single score category, resulting in a new 8-point scale (i.e., 122345678). When scores of 2 and 3 and scores of 7 and 8 are disordered, both pairs can be merged, creating a new 7-point scale (i.e., 122345677). Score category collapsing allows collapsed score categories to represent more distinct ability levels by aggregating minimally different ability levels represented by original score categories. As score categories are collapsed after data collection, L2 pronunciation researchers can still use conventional long rating scales when they design their study, assuring the compatibility of their study with previous studies. Furthermore, while score category collapsing usually requires one to redefine performance descriptors for newly created score categories, comprehensibility rating scales usually come only with the endpoint labeling (e.g., 1 = hard to understand, 9 = easy to understand) and omit descriptors for other score categories. Accordingly, researchers can still interpret obtained scores as listeners’ intuitively perceived comprehensibility of heard speech samples.
Score category collapsing is not a completely new idea in L2 pronunciation research. Isaacs and Trofimovich (Reference Isaacs and Thomson2013) mentioned the possibility of combining the score categories of 3, 4, 5, and 6 in a 9-point scale for comprehensibility, and Isbell (Reference Isbell, Kang and Ginther2018) mentioned the possibility of combining the score category of 7 with adjacent score categories in a 9-point scale for accentedness. However, very few studies have empirically tested its impact on measurement quality, and to my knowledge, Kermad and Bogorevich (Reference Kermad and Bogorevich2022) is the only study. They asked 56 raters, including L1 and L2 speakers of English, to assess speech performances elicited by four tasks—read-aloud, spontaneous speech, elicitation, picture description—which were performed by 15 L2 learners of English. Raters used a 9-point scale (i.e., 123456789) to assess comprehensibility and accentedness. The study collapsed score categories based on statistical information derived from the many-facet Rasch measurement analysis. Specifically, they combined the score categories of 3 and 4 and the score categories of 6 and 7, creating a 7-point scale (i.e., 123345567). They also combined the score categories of 1 and 2, 3 and 4, 6 and 7, and 8 and 9, creating a 5-point scale (i.e., 112234455). The results suggested that the score categories in the 5-point scale represented different ability levels more clearly than those in the 7-point and 9-point scales. Meanwhile, the midpoint of the 5-point scale still did not function well, being muddled with adjacent score categories. While Kermad and Bogorevich’s (Reference Kermad and Bogorevich2022) study demonstrated score category collapsing as a potential solution, they tested only two collapsing patterns, leaving other collapsing patterns to be further explored. In addition, other popular rating scales, such as 100-point and 1,000-point scales, have yet to be examined, though these substantially long rating scales are arguably more likely to confuse raters than a 9-point scale. Expanding Kermad and Bogorevich’s (Reference Kermad and Bogorevich2022) pioneering study, the present study aims to illustrate the impact of score category collapsing on psychometric quality, using 9-point and 100-point scales as illustrative cases.
Research questions
The literature review suggests that many L2 pronunciation studies have conventionally used long rating scales, despite rebuttal evidence such as that presented by Isaacs and Trofimovich’s (Reference Isaacs and Thomson2013) pioneering study. The present study thus aims to raise researchers’ awareness of the potential drawbacks of long rating scales by examining key psychometric properties—ordered thresholds and threshold distances. I chose 9-point and 100-point scales because Saito et al. (Reference Saito, Macmillan, Mai, Suzukida, Sun, Magne and Murakami2020) and Huensch and Nagle (Reference Huensch and Nagle2023) provide well-controlled, rich datasets collected with these two scales (see Methods for more details). I have no intention to exclusively problematize these two scales nor to generalize the present findings to other scales in L2 pronunciation research. Rather, my purpose is to provide empirical evidence that demonstrates the potential limitations of long scales by using 9-point and 100-point scales as illustrative cases. The present study also aims to showcase post hoc score category collapsing as a potential countermeasure against suboptimal scale functioning. With these overarching goals, the present study addresses the following research questions:
RQ1: To what extent do 9-point and 100-point scales function effectively when used to assess comprehensibility in terms of scale functioning indices (i.e., threshold ordering, threshold distances, and probability curves)?
RQ2: To what extent does score category collapsing improve the functioning of 9-point and 100-point scales in terms of scale functioning indices (i.e., threshold ordering, threshold distances, and probability curves)?
RQ3: To what extent are collapsed scales compatible with the original 9-point and 100-point scales?
Method
Datasets in Saito et al. (Reference Saito, Macmillan, Mai, Suzukida, Sun, Magne and Murakami2020) and Huensch and Nagle (Reference Huensch and Nagle2023)
The present study reanalyzed the dataset in Saito et al. (Reference Saito, Macmillan, Mai, Suzukida, Sun, Magne and Murakami2020) and the dataset in Huensch and Nagle (Reference Huensch and Nagle2023). Saito et al. (Reference Saito, Macmillan, Mai, Suzukida, Sun, Magne and Murakami2020) used a 9-point scale, and Huensch and Nagle (Reference Huensch and Nagle2023) used a 100-point scale. These studies were chosen for three major reasons. First, both datasets contain relatively large samples of L2 speakers and first language (L1) listeners. Saito et al. (Reference Saito, Macmillan, Mai, Suzukida, Sun, Magne and Murakami2020) recruited 110 L2 English speakers and 10 L1 English raters, while Huensch and Nagle (Reference Huensch and Nagle2023) recruited 42 L2 Spanish speakers and 80 L1 Spanish raters. These large samples provide rich rating data, which is essential for Rasch analysis. Second, both 9-point and 100-point scales are widely used among L2 pronunciation studies (Chau & Huensch, Reference Chau and Huensch2025; Kostromitina et al., Reference Kostromitina, Sudina and Baghlaf2025), and thus the present findings were expected to be relevant to many previous studies. Third, Saito et al. (Reference Saito, Macmillan, Mai, Suzukida, Sun, Magne and Murakami2020) and Huensch and Nagle (Reference Huensch and Nagle2023) differed in several important respects, including their targeted L2 (i.e., English vs. Spanish), speaking task (i.e., picture description vs. prompted speech),Footnote 3 and data collection method (i.e., in-person vs. Amazon Mechanical Turk). This methodological variation allowed the present study to demonstrate the effectiveness of score category collapsing for different research contexts.
It should be noted that the present methodological showcase would not have been possible without these researchers’ pioneering commitment to open science. Also, I have no intention to challenge any research claims made in these studies; rather, my purpose is to propose a methodological approach that allows us to examine long rating scales from new perspectives and to spark constructive discussions among L2 pronunciation researchers.
Analysis of Saito et al.’s (Reference Saito, Macmillan, Mai, Suzukida, Sun, Magne and Murakami2020) dataset derived from 9-point scale
In Saito et al. (Reference Saito, Macmillan, Mai, Suzukida, Sun, Magne and Murakami2020), 110 L2 learners of English performed a picture description task, and their comprehensibility was rated by 10 L1 speakers of English based in the UK. L2 speakers represented diverse L1 backgrounds (e.g., Italian, German, and Bengali), ranging in age from 20 to 59. Some had little to no experience of practicing English in classroom contexts, whereas others reported up to 23 years of study. In the picture description task, L2 speakers were given five seconds to prepare and then asked to describe seven pictures while using three key words pertaining to each picture. The first four pictures were used for L2 speakers to practice, and their performance on the last three pictures was used as the final data. The first 10 seconds trimmed from each of the three comprised one single audio file, which was subsequently rated by 10 L1 English speakers. The rating scale contained nine score categories from 1 (very difficult to understand) to 9 (very easy to understand) (i.e., 123456789). Raters first familiarized themselves with the picture description prompt and practiced rating with sample audio files. Afterward, they were asked to rate 110 audio files, listening to each file once. This rating design yielded a total of 1,100 ratings (i.e., 110 L2 speakers times 10 L1 raters).
To answer the first research question (i.e., threshold ordering, threshold distance, probability curves of the original 9-point scale), the present study conducted the many-facet Rasch measurement (MFRM) analysis, specifying speaker and rater as two facets. The speaker facet was centered (i.e., average speaker ability was set at 0.0 logit), and the rater facet was not centered. This configuration of facets is essential to find unique estimates and ensure identifiability, and it is customary that the one focal facet is noncentered while the other facets are centered (see Linacre, Reference Linacre2025, pp. 161–162 for more details). For the second research question (i.e., the impact of score category collapsing on threshold ordering, threshold distances, probability curves of the original 9-point scale), the present study explored the four collapsing schemes in Figure 1 (i.e., 111222333, 112234455, 112223344, 112233344). The schemes of 111222333 and 112234455 were explored because they retain the mid-point option in the original 9-point scale (Tsai et al., Reference Tsai, Wind and Estrada2025). The scales of 112223344 and 112233344 were tested because previous studies reported muddled score categories around the mid-point on a 9-point scale (Isaacs & Trofimovich, Reference Isaacs and Thomson2013; Isbell, Reference Isbell, Kang and Ginther2018). Aggregating three score categories around the mid-point, especially scores of 3, 4, and 5 and scores of 5, 6, and 7, was thus expected to optimize the functioning of score categories. To answer the third research question (i.e., the compatibility between the original 9-point scale and collapsed scales), the present study compared the original 9-point scale and collapsed scales across different aspects, such as speaker statistics and rater statistics, to provide direct evidence regarding their compatibility.
Collapsing schemes tested for the 9-point scale in Saito et al. (Reference Saito, Macmillan, Mai, Suzukida, Sun, Magne and Murakami2020).

Analysis of Huensch and Nagle’s (Reference Huensch and Nagle2023) dataset derived from 100-point scale
Huensch and Nagle (Reference Huensch and Nagle2023) recruited 42 L2 learners of Spanish who were enrolled in Spanish courses at two universities in the United States. These L2 learners were all L1 speakers of English. Their speech performance was elicited by a prompted task, where learners were asked to speak for about one minute on a given topic after planning. From each learner, two utterances were extracted and submitted to the rating session. Unlike Saito et al. (Reference Saito, Macmillan, Mai, Suzukida, Sun, Magne and Murakami2020), Huensch and Nagle (Reference Huensch and Nagle2023) conducted a rating session via Amazon Mechanical Turk, through which they recruited 80 L1 speakers of Spanish based in Spain, Venezuela, Mexico, Colombia, and Argentina. These raters first underwent practice rating items and then assessed speech samples. They were allowed to listen to each audio file one time and given 45 seconds to transcribe the utterance and assess its comprehensibility and accentedness. The rating scale for comprehensibility contained 101 score categories, ranging from 0 to 100 in increments of one point. The left endpoint was labeled as very difficult to understand, and the right endpoint was labeled as very easy to understand. The rating scale did not present numerical values to raters, but their placements of the slider were converted to scores from 0 to 100.
To answer the first research question (i.e., threshold ordering, threshold distance, probability curves of the original 100-point scale), the present study conducted the MFRM analysis that specified speaker (centered) and rater (noncentered) as two facets. To answer the second research question (i.e., the impact of score category collapsing on threshold ordering, threshold distance, probability curves of the original 100-point scale), the present study employed Rasch-based score category collapsing (Kermad, Reference Kermad2024; Linacre, Reference Linacre2002) because, unlike a 9-point scale, it was impractical to explore many possible collapsing patterns for the 100-point scale.Footnote 4 The present study screened score categories based on three criteria: (1) whether Rasch-Andrich threshold measures monotonically increased as score categories increased, (2) whether threshold distances between adjacent score categories were positive and within the recommended range (i.e., from 1.4 to 5.0 logits), and (3) whether each score category displayed a clear peak in its probability curve (Linacre, Reference Linacre2002). Score categories that failed to meet these criteria were combined, and the MFRM analysis was rerun iteratively until adequate scale functioning was achieved. Through these iterations, the present study tested 10-point, 5-point, and 4-point collapsed scales as presented in Figure 2.
Collapsing schemes for the 100-point scale in Huensch and Nagle (Reference Huensch and Nagle2023).

To answer the third research question (i.e., the compatibility between the original 100-point scale and the collapsed scale), the present study compared the original 100-point scale and a collapsed scale across several dimensions (e.g., variable map, speaker statistics, rater statistics). It should be noted that Huensch and Nagle (Reference Huensch and Nagle2023) extracted two audio files from each speaker’s performance, but the present study randomly sampled one of the two files from each speaker and submitted it to the analysis to ensure independent observations in the final dataset.Footnote 5 As such, the final dataset contained a total of 3,360 ratings (i.e., 42 speakers times 80 raters). The MFRM analysis was performed in the FACETS program 4.3.3. (Linacre, Reference Linacre2025), and all the output files are available in the OSF platform (https://osf.io/8jh3u/overview?view_only=01e99a1d7f09445c9e07a657f5a26a0c).
Results of Saito et al.’s (Reference Saito, Macmillan, Mai, Suzukida, Sun, Magne and Murakami2020) 9-point scale
Functioning of the original 9-point scale (RQ1)
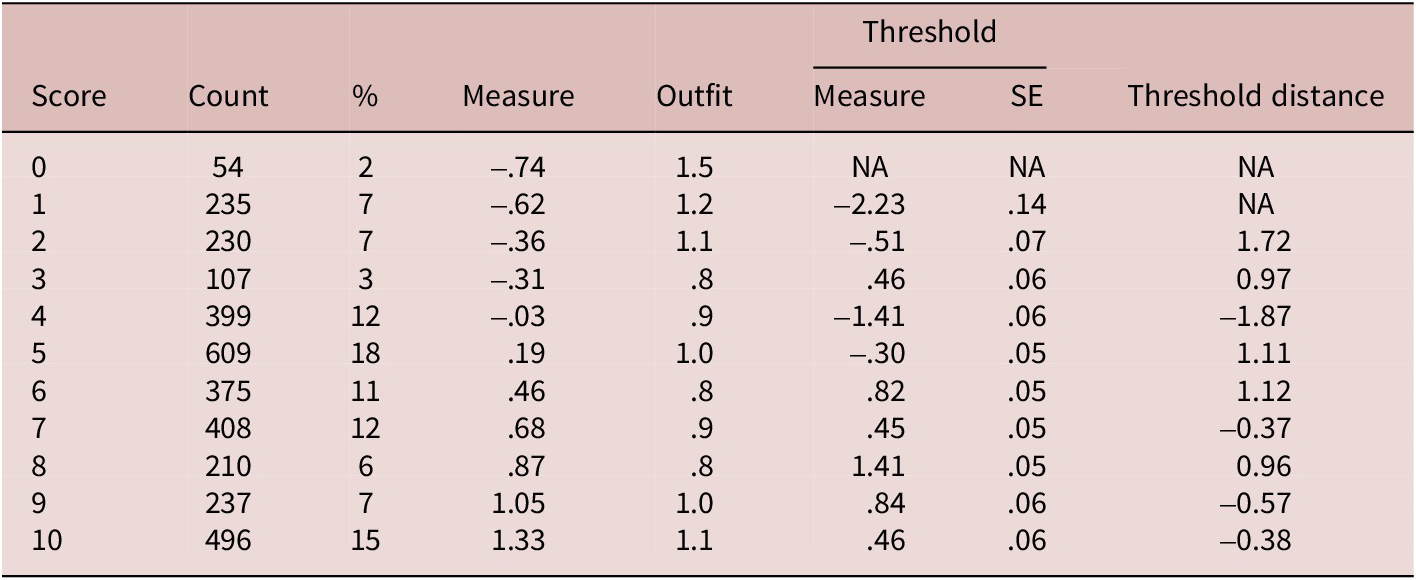
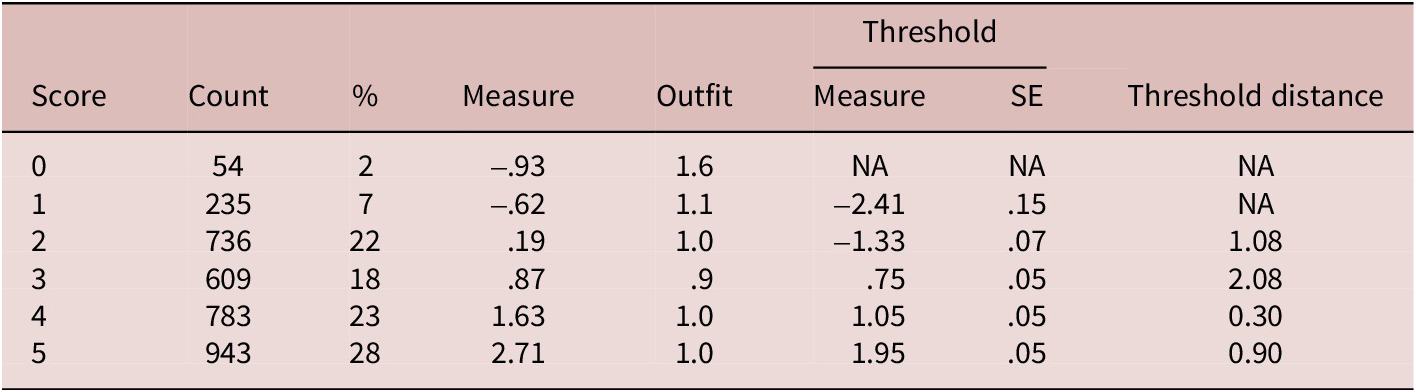
Table 1 summarizes the statistics regarding the functioning of the nine score categories in Saito et al. (Reference Saito, Macmillan, Mai, Suzukida, Sun, Magne and Murakami2020). The number of times a score category being chosen monotonically increases from 1 (19 times, 2%) to 7 (204 times, 19%) with a slight drop at the scores of 8 (196 times, 18%) and 9 (160 times, 15%). Measure indicates the difficulty of test takers obtaining the score category, suggesting that the difficulty linearly increases as raw scores increase from 1 (–.80 logits) to 9 (2.35 logits). Outfit suggests the extent to which the score category conforms to the specified Rasch model, and values below 2.0 are generally considered acceptable (Linacre, Reference Linacre2002). The nine score categories all meet this criterion. Threshold measures—points at which the likelihood of test takers obtaining two adjacent score categories is equal—monotonically increase as raw scores increase from 2 (–1.54 logits) to 9 (2.07 logits). All distances between adjacent Rasch-Andrich thresholds were positive, suggesting that obtaining higher scores required higher ability levels. However, threshold distances were relatively narrow for score categories from 3 to 7, ranging from .23 to .61 logits. In contrast, threshold distances for 8 and 9 were relatively large, being .82 and .88 logits, though falling short of the recommended lower bound of 1.4 (Linacre, Reference Linacre2002).
Score category statistics of the original 9-point scale

Note. Count = the number of times the score category being chosen, Measure = difficulty of test takers obtaining the score, outfit = fit to observed data, Threshold measure = test taker ability at which obtaining two adjacent score categories is equally likely, Threshold SE = standard error of threshold measure, Threshold distance = the difference between two adjacent thresholds.
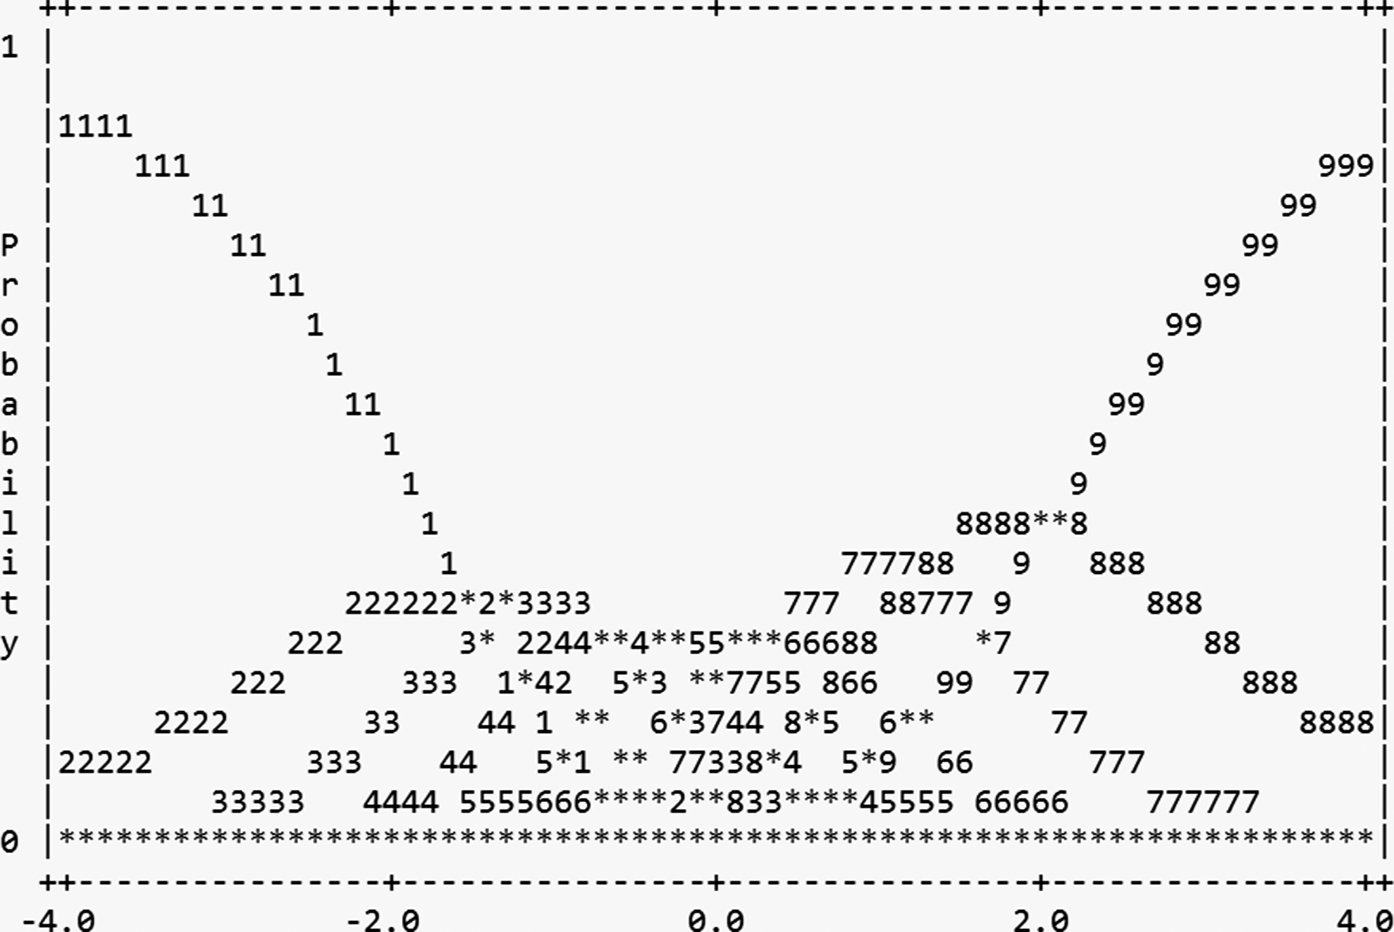
This suboptimal scale functioning is also evident in the probability curves (Figure 3), where the probability of receiving each score (y-axis; 0.0 to 1.0) is plotted as a function of speakers’ ability (x-axis; –4.0 to 4.0 logits). For example, speakers associated with 1.5 logits on the x-axis likely receive a score of 7. However, many score categories from 2 to 7 fail to display clear peaks. As shown in the curves, speakers around 0 logits are equally likely to receive scores of 3, 4, 5, 6, and 7, which suggests that raters assigned different scores to speakers who did not substantially differ in comprehensibility.
Probability curves of the original 9-point scale visualizing the probabilities of score categories (y-axis) as a function of examinee ability (x-axis).

Functioning of rating scales derived from score category collapsing (RQ2)
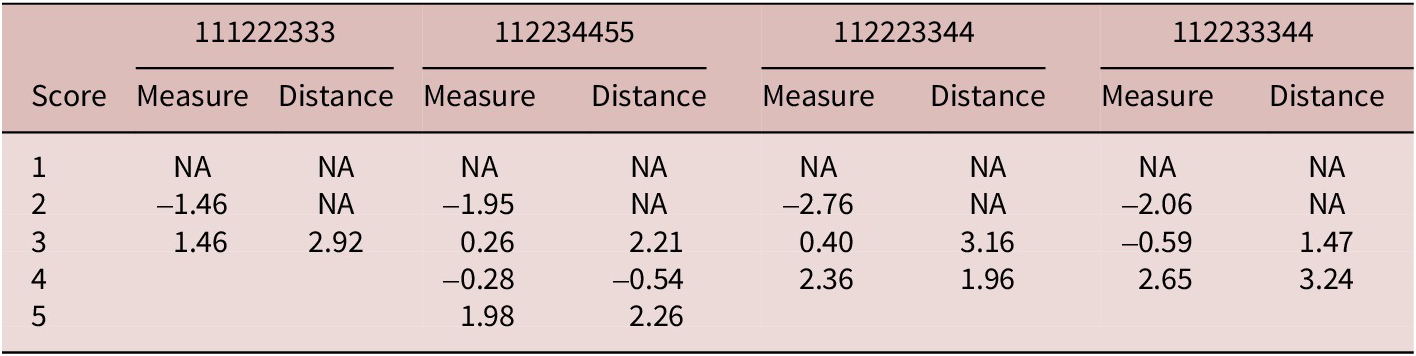
Table 2 presents Rasch-Andrich thresholds and threshold distances for the four rating scales derived from score category collapsing. Threshold measures monotonically increased from low to high score categories for the 3-point and 4-point scales (i.e., ordered thresholds). Meanwhile, in the 5-point scale, the threshold measure for the score category of 3 (.26 logits) was higher than that for the score category of 4 (–.28 logits), indicating disordering between these two score categories (see the Measure column of 112234455 in Table 2). Threshold distances in the 3-point and 4-point scales all fell within the recommended range from 1.4 to 5.0 (Linacre, Reference Linacre2002), suggesting that each score category reflected a distinct difficulty level. In contrast, the 5-point scale contained one negative distance between the score categories of 3 and 4 (–.54 logits), further confirming their disordering.
Score category statistics of the four collapsed scales

Note. Measure = test taker’s ability at which obtaining two adjacent score categories is equally likely, Distance = the difference between two adjacent thresholds.
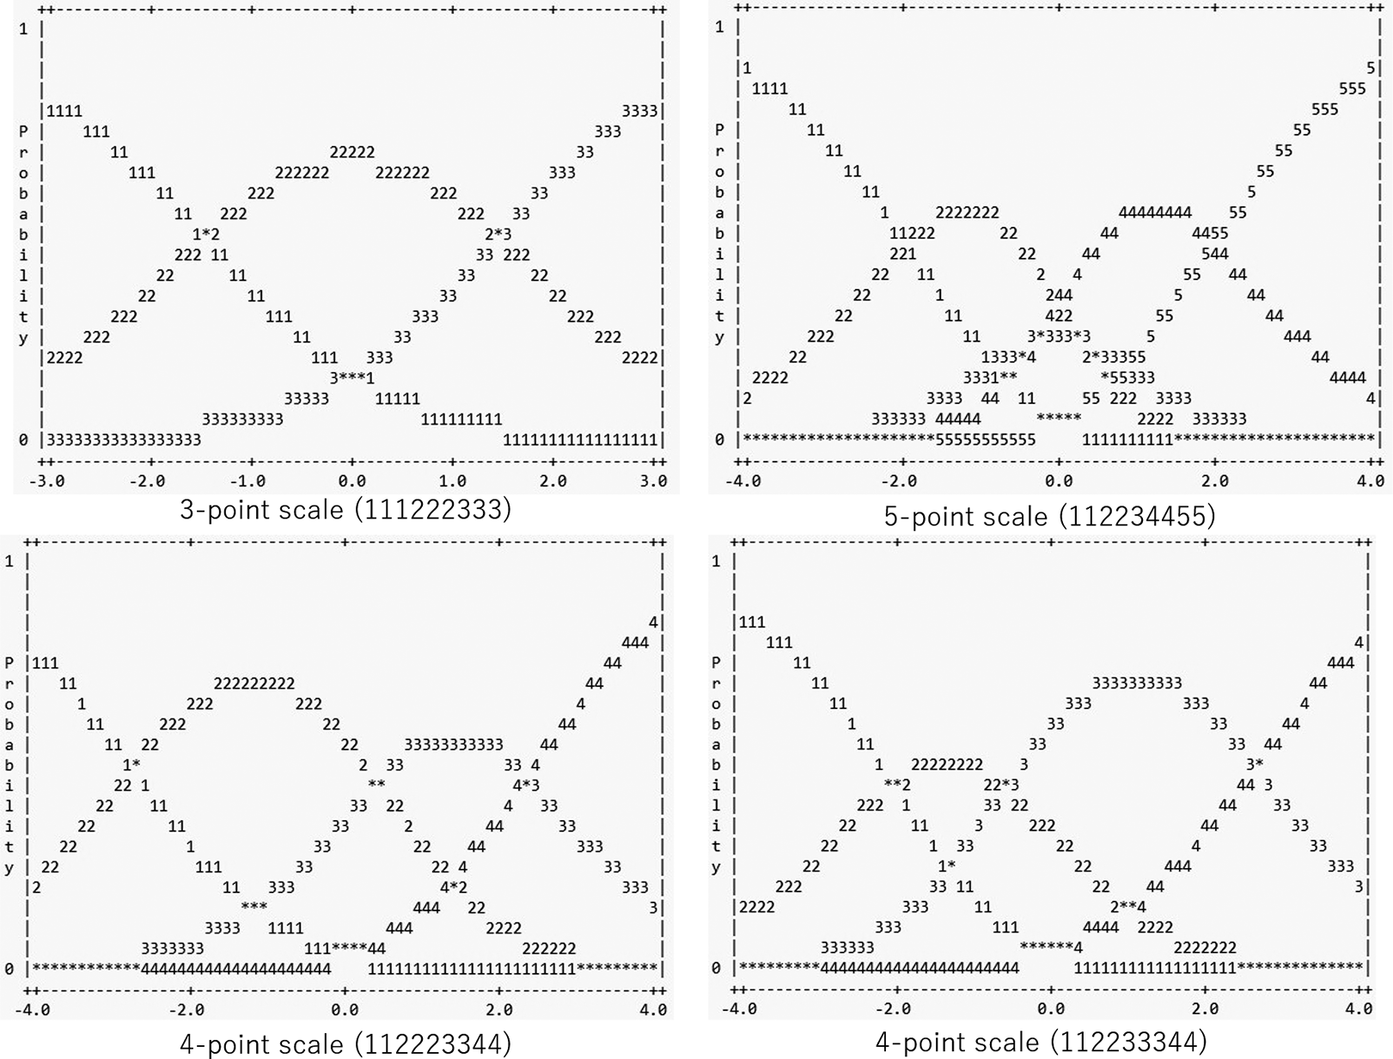
Figure 4 presents the probability curves for the four rating scales derived from score category collapsing. Most score categories display distinct peaks, suggesting that those score categories represent distinct ability levels. Meanwhile, the score category of 3 in the 5-point scale remained muddled with adjacent score categories, which suggests that L2 speakers assigned a score of 3 are also likely to receive a score of 2 or 4.
Probability curves for the 3-point (111222333, top left), 5-point (112234455, top right), 4-point (112223344, bottom left), and 4-point scales (112233344, bottom right).

Comparing the original 9-point scale with the collapsed scales (RQ3)
Figure 5 presents the variable maps for the original 9-point scale and the three collapsed ratings scales that met the criteria for thresholds and probability curves. The leftmost column denotes the common logit scale that applies to the speaker, rater, and scale. The second column presents the distribution of speakers’ ability, where higher values toward the top of the column represent more able speakers. The third column visualizes the distribution of rater severity, where higher values toward the top of the column represent more severe raters. The rightmost column shows each score category and its coverage of measures.
Variable maps for the original 9-point scale and the collapsed 3-point, 4-point (112223344), and 4-point (112233344) scales.

According to these variable maps, it seems that speakers’ abilities became more distinct for the collapsed rating scales. For example, speakers are clustered closely together on the 9-point scale—particularly those with logits between –0.5 and 2.0—whereas the 3-point scale seems to cluster speakers associated with logits of 6.0, 4.5, 3.5, 3.0, and so on. The ranking of rater severity does not seem to differ across the scales. Rater 10 was distinctively severe, while Raters 4 and 5 were lenient. The rest of the raters largely fell within a range from –1.0 to 1.0 logits. As the scale collapsed, each score category covered a wider range of speakers’ ability levels. On the 9-point scale, the score categories from 3 to 6 each covered approximately 0.5 logits at most, whereas the score categories of 7, 8, and 9 each represented a wider range of ability levels. In contrast, the 4-point scale of 112233344 (the rightmost figure) allowed each score category to cover at least 2.0 logits of the speaker’s ability. In short, echoing the observations from their probability curves, these variable maps indicate that the collapsed scales pool minimally different ability levels into one score category and thereby link each score category with a distinctly different ability level.
Table 3 compares the original 9-point scale and the three collapsed rating scales that met the criteria for thresholds and probability curves. It seems that these scales are not substantially different in terms of Cronbach’s alpha and intraclass correlation, as their 95% confidence intervals largely overlap, mostly falling within the range from .80 to .90. As for the model fit, the original 9-point scale and the collapsed 4-point scale of 112223344 explained approximately 60% of the variance, whereas approximately 50% of the variance was explained by the 3-point scale and the other 4-point scale of 112233344. Rasch residuals over |2.0| were minimal across the scales. These explained variances and minimal residuals suggest that the Rasch model adequately fits the observed data across the four scales.
Comparison among the original 9-point, 3-point (111222333), 4-point (112223344), and 4-point (112233344) scales

Regarding speaker ability, all the scales were associated with speaker strata of approximately 3, indicating there were three statistically distinguishable ability levels. Separation reliability for person, which can be interpreted as Cronbach’s alpha in classical test theory (Linacre, Reference Linacren.d.), was sufficient, ranging from .80 to .91. As for rater severity, the original 9-point scale and the collapsed 3-point scale found eight rater severity levels, but the 4-point scales found 11 rater severity levels. Separation reliability for rater was high for all four scales, being above .95. These statistics suggest that while the four scales reliably identified three distinct ability levels among speakers, the 4-point scales distinguished rater severity more clearly than the 9-point and 3-point scales.
Person measures or estimated speakers’ ability derived from the collapsed scales were highly correlated with those from the original scale. Pearson’s product-moment correlations were .97 (95% CI[.95, .98]) for the 3-point scale, .99 (95% CI[.98, .99]) for the 4-point scale of 112223344, and .99 (95% CI[.98, .99]) for the 4-point scale of 112233344. These results suggest that ability estimates derived from the collapsed scales were highly compatible with those derived from the original scale. In short, score category collapsing helped score categories to represent more distinct ability levels than those originally represented by the nine score categories, without compromising the psychometric properties of the original 9-point scale.
Results of Huensch and Nagle’s (Reference Huensch and Nagle2023) 100-point scale
Functioning of the original 100-point scale (RQ1)
Out of 99 possible threshold distances, 46 distances were positive (i.e., ordered thresholds), and 53 distances were negative (i.e., disordered thresholds). Table 4 presents the 10 score categories that were associated with the highest threshold distances on the 100-point scaleFootnote 7. Interestingly, nine of the 10 highest threshold distances were found at score categories that denote one point above multiples of 5 (i.e., 11, 21, 26, 41, 61, 71, 81, 86, 91). This may suggest that raters distinguished scores that are up to exact multiples of 5 (e.g., 20, 60, 70) and scores that denote one point above multiples of 5.
Score category statistics of the 10 score categories associated with the highest threshold distances on the 100-point scale

Note. Count = the number of times the score category being chosen, Measure = difficulty of test takers obtaining the score, outfit = fit to observed data, Threshold measure = test taker’s ability at which obtaining two adjacent score categories is equally likely, Threshold SE = standard error of threshold measure, Threshold distance = the difference between two adjacent thresholds.
Score category collapsing for rectifying threshold disordering and distances (RQ2)
Given that approximately half of the score categories were disordered, score categories were collapsed based on threshold distances under the assumption that large threshold distances suggest the anchoring function of those score categories. Specifically, scores in the ranges 1–10, 11–20, 21–25, 26–40, 41–60, 61–70, 71–80, 81–85, 86–90, and 91–100 were each collapsed into a single score category. This collapsing scheme resulted in a 10-point scale that contains 11 score categories from 0 to 10, with 0 retained as a separate category (see Figure 2). Table 5 summarizes the score category statistics from the MFRM analysis. The threshold measures suggest several disordered categories, such as scores of 3 (.46 logits) and 4 (–1.41 logits) and scores of 8 (1.41 logits) and 9 (.84 logits). Those score categories were also associated with negative threshold distances, including a score of 4 (–1.87 logits) and a score of 9 (–.57 logits).
Score category statistics of the 10-point scale

Note. Count = the number of times a score category being chosen, Measure = difficulty of test takers obtaining the score, outfit = fit to observed data, Threshold measure = test taker ability in logit at which obtaining two adjacent score categories is equally likely, Threshold SE = standard error of threshold measure, Threshold distance = the difference between two adjacent thresholds.
To further refine this 10-point scale, another rating scale was created. Specifically, Rasch-Andrich threshold measures and threshold distances were screened in two ways. First, threshold measures and threshold distances were compared for two adjacent score categories from the lowest score category—whether measures and distances associated with higher score categories were higher. Secondly, threshold measures and threshold distances were compared for two adjacent score categories from the highest score category—whether measures and distances associated with lower score categories were lower.
These two screening methods resulted in the slightly different, yet consistent, identification of disordered categories. Neither screening method flagged scores of 1 and 5, which were thus maintained. Scores from 2 to 4 were found to be disordered and were collapsed into a single category. The screening flagged scores from 6 to 10. While collapsing these five score categories into one score category was possible, their associated measures seemed notably different. Specifically, scores of 6 and 7 were associated with notably lower measures (.82 and .45 logits, respectively) than the score of 8, which was associated with a threshold measure of 1.41 logits. While scores of 9 and 10 were similar to scores of 6 and 7 in threshold measures (.84 and .46 logits, respectively), it was thought that the score of 8 denoted an ability level that was somewhat different from ability levels represented by scores of 6 and 7. Accordingly, scores of 6 and 7 were collapsed into one score category, and scores of 8, 9, and 10 were collapsed into another score category. This collapsing transformed the 10-point scale of 012345678910 to a 5-point scale of 01222344555 (see Figure 2).
The 5-point scale did not show any disordered categories, and higher score categories were associated with higher threshold measures (Table 6). However, threshold distances were relatively narrow between score categories of 3 and 4 (.30 logits), compared with the other threshold distances of 1.08 (scores from 1 to 2), 2.08 (scores from 2 to 3), and .90 (scores from 4 to 5) logits.
Score category statistics of the 5-point scale

Due to their narrow threshold distance between scores of 3 and 4 in this 5-point scale (.30 logits), these two score categories were collapsed into one score category. This collapsing transformed the 5-point scale of 012345 into a 4-point scale of 012334 (see Figure 2), which maintained the score categories appropriately ordered while also displaying adequately large threshold distances across the score categories (Table 7).
Score category statistics of the 4-point scale

Figure 6 presents the probability curves for the original 100-point scale and the three collapsed scales. The probability curves of the 100-point scale show no clear peaks, suggesting that many different scores represented essentially equivalent ability levels and that the same score represented different ability levels. Combining score categories helped the 10-point scale to display a clear peak of the collapsed score category of 1, which represented ability levels around –2.0 logits. Further merging score categories helped the 5-point scale to display a clear peak for the collapsed score category of 2, which distinctly represented ability levels around 0.0 logits. Finally, the 4-point scale boosted the functioning of the collapsed score category of 3, which uniquely represented ability levels around 2.0 logits. Although these collapsing schemes were implemented based on the statistical information derived from the MFRM analysis, each collapsing scheme happened to target a unique range of ability levels from low-ability speakers (10-point scale), middle-ability speakers (5-point scale), to high-ability speakers (4-point scale).
Probability curves of the 100-point (top left), 10-point (top right), 5-point (bottom left), and 4-point (bottom right) scales.Footnote 8

Comparing the original 100-point scale and the collapsed 4-point scale (RQ3)
Figure 7 presents the variable maps of the original 100-point scale and the collapsed 4-point scale. In the original 100-point scale, many speakers and raters are located at 0.0 logits, and many score categories cluster in this same region. In contrast, in the 4-point scale, the score categories of 1, 2, 3, and 4 largely corresponded to speaker abilities below –1.0, around 0.0, around 2.0, and above 3.0 logits, respectively.
Variable maps of the original 100-point scale (left) and the collapsed 4-point scale (right).

Table 8 summarizes the comparison between the original 100-point scale and the collapsed 4-point scale. Cronbach’s alpha and intraclass correlation were not substantially different between the two scales. As for the model fit, while the original scale explained more variance than the 4-point scale, there were slightly more unexpected responses for the original scale than for the 4-point scale. The 100-point scale reliably distinguished 10 ability levels, whereas the 4-point scale distinguished nine. The original scale detected eight rater severity levels, whereas the 4-point scale found seven severity levels. Person measures derived from the two scales were highly correlated, with Pearson’s product-moment correlation of .99 (95% CI[.99, 1.00]). Taken together, these findings suggest that the reduction of scale granularity aggregated minimally different ability levels and revealed meaningfully distinct ability levels among speakers without a substantial loss of the information that was originally obtained with the 100-point scale.
Comparison between the original 100-point scale and the collapsed 4-point scale

Discussion
The present study aimed to reexamine the functioning of the 9-point and 100-point scales used to assess comprehensibility in Saito et al. (Reference Saito, Macmillan, Mai, Suzukida, Sun, Magne and Murakami2020) and Huensch and Nagle (Reference Huensch and Nagle2023) and to demonstrate the usefulness of score category collapsing as a potential countermeasure against suboptimal rating scale functioning. For the 9-point scale, while the difficulty of obtaining higher scores monotonically increased, score categories from 2 to 7 were muddled as suggested by their narrow threshold distances and unclear peaks in the probability curves. Regarding the 100-point scale, approximately half of the score categories were disordered, but large threshold distances were observed among score categories that denote one point above multiples of 5. The 9-point scale was effectively collapsed into 3-point and 4-point scales, whereas the 100-point scale was effectively collapsed into a 4-point scale. These results are discussed in relation to previous studies below.
Addressing the first research question (i.e., threshold ordering, threshold distances, probability curves), the study reanalyzed Saito et al.’s (Reference Saito, Macmillan, Mai, Suzukida, Sun, Magne and Murakami2020) 9-point scale. The results suggested that while Rasch–Andrich thresholds increased monotonically with higher score categories, all threshold distances fell below the recommended minimum of 1.4. Such narrow threshold distances suggest that the difficulty of obtaining a score was not substantially different from the difficulty of obtaining a score higher. Indeed, the probability curves suggested that speakers with 0.0 logits were equally likely to receive scores of 4, 5, 6, or 7. These findings align well with previous studies (Isaacs & Trofimovich, Reference Isaacs and Thomson2013; Isbell, Reference Isbell, Kang and Ginther2018; Kermad & Bogorevich, Reference Kermad and Bogorevich2022), which have reported that raters often struggled to associate specific differences in speaking performance with numerical values on the scale, particularly near the midpoint.
Regarding the second research question (i.e., the impact of score category collapsing on the functioning of the 9-point scale), the present study tested four collapsing patterns. As a result, the 3-point scale and the two 4-point scales demonstrated monotonically increasing threshold measures and threshold distances above 1.4. Their probability curves also displayed clear peaks for collapsed score categories. Kermad and Bogorevich (Reference Kermad and Bogorevich2022) similarly collapsed a 9-point scale (123456789) for comprehensibility into 7-point (123345567) and 5-point (112234455) scales. They found that while this collapsing improved the probability curves to some extent, the midpoint of the 7-point and 5-point scales still failed to display a clear peak, possibly because the original midpoint remained intact in these collapsed scales. Indeed, the present study also showed that the collapsed 5-point scale, where the midpoint of 3 stayed intact, did not show a clear peak for this midpoint. Perhaps, when the ability levels are muddled around the midpoint—as is commonly seen among comprehensibility ratings (Isaacs & Trofimovich, Reference Isaacs and Thomson2013; Isbell, Reference Isbell, Kang and Ginther2018)—the scale functioning of a 9-point scale may be effectively enhanced by combining the midpoint score category with adjacent categories.
For the third research question (i.e., the compatibility between the original 9-point scale and collapsed scales), the original scale and the newly created scales were not substantially different in terms of widely used reliability indices, such as Cronbach’s alpha and intraclass correlation. The original scale and the new 3-point scale identified eight levels of rater severity, whereas the two 4-point scales identified 11 rater severity levels. In principle, fewer severity strata are preferable, as scores from different raters can be interpreted in a similar way. From this viewpoint, the original 9-point scale and the 3-point scale may seem advantageous. However, the 9-point scale does not allow each score category to represent a distinct ability level, and the 3-point scale may risk oversimplifying ability differences in a sample of learners. Given these trade-offs, the two 4-point scales could be an eclectic solution. Although these two scales may accentuate severity levels among raters, the increase from eight severity levels in the 9-point scale to 11 severity levels in these 4-point scales may be inconsequential compared with the interchangeability of score categories on the 9-point scale. It should be noted that in Saito et al. (Reference Saito, Macmillan, Mai, Suzukida, Sun, Magne and Murakami2020), raters did use a 9-point scale and thus post hoc score category collapsing does not necessarily simulate how raters would behave with shorter scales derived from the 9-point scale. Nevertheless, while I have no intention to prescribe a single optimal scale, these observations highlight how researchers can weigh the trade-offs of scale length when justifying their methodological choices.
To answer the first research question (i.e., threshold ordering, threshold distances, probability curves), the present study also reanalyzed Huensch and Nagle’s (Reference Huensch and Nagle2023) 100-point scale, finding that approximately half of the score categories were disordered, likely due to the large number of score categories that potentially caused raters’ confusion. Threshold distances tended to be relatively large and positive for score categories that denote one point above multiples of 5 (e.g., 21, 61, 71). This finding is interesting, especially because the numerical values were hidden in the 100-point scale. One possibility is that raters attempted to distinguish different ability levels by placing the slide bar noticeably farther apart. In fact, score categories that denote multiples of 5 were chosen relatively frequently, compared with score categories around them. By collapsing infrequently endorsed score categories, the threshold-based score category collapsing successfully tailored the rating scale to the raters’ scale use. Although their study focused on a Likert-scale survey that was intended to measure self-efficacy of mathematics, Toland and Usher (Reference Toland and Usher2016) also found that respondents tended to choose multiples of 5 on a 100-point scale, where only 0, 50, and 100 were labeled (e.g., not at all confident, somewhat confident). While speculative, it is possible that when unsure about the meaning of 100 score categories, respondents might consciously or unconsciously segment the 100-point scale into 10 to 20 small blocks and thereby lessen their cognitive load on their own.
Addressing the second (i.e., the impact of score category collapsing on threshold ordering, threshold distances, probability curves of the original 100-point scale) and third research questions (i.e., the compatibility between the original 100-point scale and collapsed scale), the present study collapsed the 100-point scale based on the MFRM analysis and compared the original 100-point scale and the collapsed 4-point scale. While approximately half of the score categories were originally disordered in the 100-point scale, the finalized 4-point scale had all the score categories appropriately ordered with adequate threshold distances and clear peaks in the probability curves. Although generalizing this finding to other contexts requires great caution, the present finding seems to align with Toland and Usher (Reference Toland and Usher2016), who also used the Rasch measurement approach and found a 4-point scale as the best scale derived from a 100-point scale intended to measure mathematics self-efficacy. Notably, in the present study, scores as far apart as 41 and 80 on the original 100-point scale were merged into the same category in the 4-point scale, indicating that comprehensibility originally represented by these scores was similar. Similarly, the score of 11 on the original 100-point scale was relabeled as 2, and the score of 80 was relabeled as 3 on the 4-point scale. That is, this difference of 1 on the collapsed 4-point scale was originally presented as a difference of 69 points on the 100-point scale. These observations critically highlight that interpretations of raw scores can run the risk of overly accentuating differences among L2 speakers. It should also be noted that the original 100-point and the collapsed 4-point scales were similar in terms of many psychometric qualities, such as speaker and rater statistics. In sum, while these two scales seem to substantially differ at first glance, their psychometric properties are largely comparable; however, the collapsed 4-point scale affords more interpretable and substantively meaningful score categories.
Conclusion
The present study reexamined Saito et al.’s (Reference Saito, Macmillan, Mai, Suzukida, Sun, Magne and Murakami2020) 9-point scale and Huensch and Nagle’s (Reference Huensch and Nagle2023) 100-point scale, focusing on their rating scale functioning. The findings suggested that some score categories were disordered and associated with narrow threshold distances. This suboptimal scale functioning was successfully addressed by score category collapsing, and newly created scales allowed each score category to represent a distinct ability level while largely preserving the psychometric qualities of the original long scale.
However, these findings should be interpreted with three major limitations in mind. First, the study only examined Saito et al.’s (Reference Saito, Macmillan, Mai, Suzukida, Sun, Magne and Murakami2020) 9-point scale and Huensch and Nagle’s (Reference Huensch and Nagle2023) 100-point scale that were used to measure comprehensibility in L2 learners’ speaking performance. While some evidence of the suboptimal rating scale functioning was obtained, it does not mean that all 9-point and 100-point scales fail to function well, and generalizations cannot be extended to other 9-point and 100-point scales. Especially, scale functioning is closely related to an array of factors, such as rater characteristics and expertise, performance descriptors, the clarity of the construct being assessed, and linguistic variability in examinees’ performance samples to be rated. For example, the present study analyzed only monologic tasks, and thus generalizability to other tasks, such as interactive speech, should be made with great caution. Similarly, raters with different backgrounds, such as accent familiarity and teaching experience, may use the same scale differently. Accordingly, the scale functioning reported in the present study may not be found when other rater samples are recruited. Secondly, the present study as a methodological showcase explored only a small set of collapsing patterns using real datasets, leaving other collapsing strategies untested. Future studies thus could explore other collapsing strategies by, for example, simulating artificial data and testing the impact of different collapsing patterns in different rating situations (Tsai et al., Reference Tsai, Wind and Estrada2025). Third, it should be borne in mind that while the present study suggested that 3-point and 4-point scales may function better than 9-point and 100-point scales, the shorter versions examined in the present study were derived from collapsing score categories based on the data obtained with long rating scales. Therefore, the study provides no direct evidence on how raters would use standalone 3-point or 4-point scales, leaving this as an avenue for future investigation.
Despite those limitations, the present study offers implications for L2 pronunciation researchers. First of all, they may want to consider using shorter rating scales, such as those that contain five score categories, whose psychometric qualities have been empirically supported by previous research (Isaacs & Trofimovich, Reference Isaacs and Thomson2013; Kermad, Reference Kermad2024). Indeed, the present study found that 9-point and 100-point scales could be collapsed into more functional scales that contain four to five score categories, regardless of substantial contextual differences between Saito et al. (Reference Saito, Macmillan, Mai, Suzukida, Sun, Magne and Murakami2020) and Huensch and Nagle (Reference Huensch and Nagle2023). Second, if future studies want to stick to long rating scales, they may want to provide more robust rater training in order to lessen raters’ cognitive burden and facilitate their consistent use of the scale (Kermad, Reference Kermad2024; Tsunemoto et al., Reference Tsunemoto, Trofimovich, Blanchet, Bertrand and Kennedy2022). Perhaps, researchers can present speech samples that represent scores of 10, 30, 60, and 90, helping evaluators to link concrete speech performance to scores on a 100-point scale, for example. Third, if providing such a robust rater training session is not ideal given their research purpose, they can implement post hoc score category collapsing and tailor the scale design to the obtained data (Kermad & Bogorevich, Reference Kermad and Bogorevich2022). Post hoc score category collapsing allows researchers to use conventionally used rating scales, ensuring the compatibility between their study and previous studies. Alternatively, researchers can analyze their data from a Rasch measurement approach and use the obtained logit measures, which they can treat as an interval variable, for further statistical analysis (see Isbell & Lee, Reference Isbell and Lee2022). While rarely used in L2 pronunciation research, the Rasch measurement approach has great potential to provide evidence regarding scale functioning, unlike Cronbach’s alpha and intraclass correlation. Last but not least, if none of these countermeasures is feasible, future studies are encouraged to provide context-specific, evidence-based justifications for their choice of scale length, rather than adopting conventional practices uncritically.
As a final note, while long rating scales may be easy to use for untrained raters and easy to develop for researchers, such convenience comes at the cost of accuracy. The use of long rating scales may not only render it difficult to make sound score interpretations but also contribute to the uncritical reproduction of long rating scales in future studies, if not intended by previous studies. While the present study is indeed exploratory and no more than a proof of concept, it is my humble hope that the present study will guard against SLA researchers’ uncritical development and use of long rating scales in future L2 pronunciation research and beyond, contributing to more meaningful and easy-to-interpret research findings.
Data availability statement
The experiment in this article earned Open Materials badge for transparent practices. The materials are available at https://osf.io/8jh3u/overview?view_only=01e99a1d7f09445c9e07a657f5a26a0c.
Acknowledgments
I’m grateful for the reviewers’ constructive comments on the previous versions of this manuscript. I used ChatGPT (GPT-5.2) to improve the clarity of my writing but not to generate ideas. The author bears sole responsibility for any errors in this manuscript.
Taichi Yamashita is an Assistant Professor of Applied Linguistics at the Faculty of Foreign Language Studies, Kansai University, Japan. He earned a Ph.D. in Applied Linguistics and Technology from Iowa State University. His research interests include computer-assisted language learning, language assessment, second language writing, and research methods. He has published articles in peer-reviewed journals, such as Applied Linguistics, Language Learning & Technology, and Language Testing.


 Open access