


Introduction
Menarche, a critical milestone in female pubertal development, is regulated by a combination of genetic and environmental factors [Reference Di, Ning, Yunfei, Jiajia, Panliang and Shan1, Reference Treloar and Martin2]. In recent decades, a global trend toward earlier age at menarche (AAM) has been observed [Reference Leone and Brown3–Reference Lee, Kim, Oh, Lee and Park6]. In low- and middle-income countries, the mean AAM declined rapidly from 14.66 years for cohorts born in the 1930s to 12.86 years for those born in the 2000s, representing a decrease of approximately 1.8 years over seven decades [Reference Leone and Brown3]. Similar downward trajectories have been documented in specific regional studies. In Portugal, the AAM decreased by roughly 1.5 years over a 50-year period [Reference Rodrigues, Martins and de Sousa4]. In China, the median AAM dropped from 13.37 years in 1985 to 12.00 years in 2019, an advancement of 1.37 years [Reference Shi, Dang, Zhong, Liu and Cai5].
Concurrently, mental health problems have risen to become a leading cause of global disease burden. According to the Global Burden of Disease Study 2019, mental disorders accounted for 125.3 million disability-adjusted life-years worldwide, with depressive and anxiety disorders contributing most significantly [7]. This burden is further amplified in specific populations: in America, rates of major depressive episodes surged by 52% among adolescents (2005–2017) and 63% among young adults (2009–2017), alongside sharp increases in suicidal behaviors [Reference Twenge, Cooper, Joiner, Duffy and Binau8].
Observational studies have demonstrated significant associations between earlier AAM and increased risks of mental health problems. A longitudinal study revealed that earlier menarche exhibited more depressive symptoms and higher rates of antisocial behavior during early to middle adulthood [Reference Mendle, Ryan and McKone9]. Similarly, a cohort study indicated that earlier AAM was associated with elevated internalizing and externalizing problems [Reference Kowalski, Addo, Kramer, Martorell, Norris and Waford10]. However, the genetic mechanisms underlying these observed associations remain to be fully elucidated.
Genome-wide association studies (GWAS) have identified numerous loci associated with AAM [Reference Day, Thompson, Helgason, Chasman, Finucane and Sulem11, Reference He, Kraft, Chen, Buring, Paré and Hankinson12] and various psychiatric disorders [Reference Howard, Adams, Clarke, Hafferty, Gibson and Shirali13, Reference Otowa, Hek, Lee, Byrne, Mirza and Nivard14], yet direct evidence for their genetic overlap remains scarce. To date, only a limited number of studies have applied genetic methodologies to this relationship. For instance, a two-sample Mendelian randomization (MR) study reported a causal association between earlier AAM and higher depression risk [Reference Hirtz, Hars, Naaresh, Laabs, Antel and Grasemann15]. Another MR research reported a causality between earlier AAM and increased depressive symptoms [Reference Askelund, Wootton, Torvik, Lawn, Ask and Corfield16]. Nevertheless, existing studies exhibit notable limitations, including reliance on single methodologies (e.g., MR), narrow phenotypic coverage, and insufficient exploration of shared genetic architectures between AAM and mental health phenotypes. Furthermore, an important limitation is that current analyses predominantly utilize GWAS data for mental health outcomes derived from non-sex-stratified populations (i.e., combined analyses of males and females), where the inclusion of male participants may introduce sex-related heterogeneity. Notably, Ohi et al. utilized sex-stratified data to analyze the genetic correlations between reproductive behaviors, including AAM, and anxiety-related disorders, finding a negative genetic correlation between AAM and anxiety disorders [Reference Ohi, Kuramitsu, Fujikane, Takai, Sugiyama and Shioiri17].
To address these limitations, we conducted an exploratory study incorporating female-specific GWAS datasets for mental health-related phenotypes. Beyond applying two-sample MR to assess causal associations between AAM and mental health-related phenotypes, we systematically (1) quantified genetic correlations using linkage disequilibrium (LD) score regression (LDSC), (2) identified pleiotropic single nucleotide polymorphisms (SNPs) via pleiotropic analysis under the composite null hypothesis (PLACO), (3) aggregated these variants to gene-level associations using Multi-marker Analysis of GenoMic Annotation (MAGMA), and (4) performed functional enrichment analyses to delineate biological pathways of pleiotropic genes. This integrative approach aimed to unravel the shared genetic architecture between AAM and mental health-related phenotypes.
Methods
GWAS data source
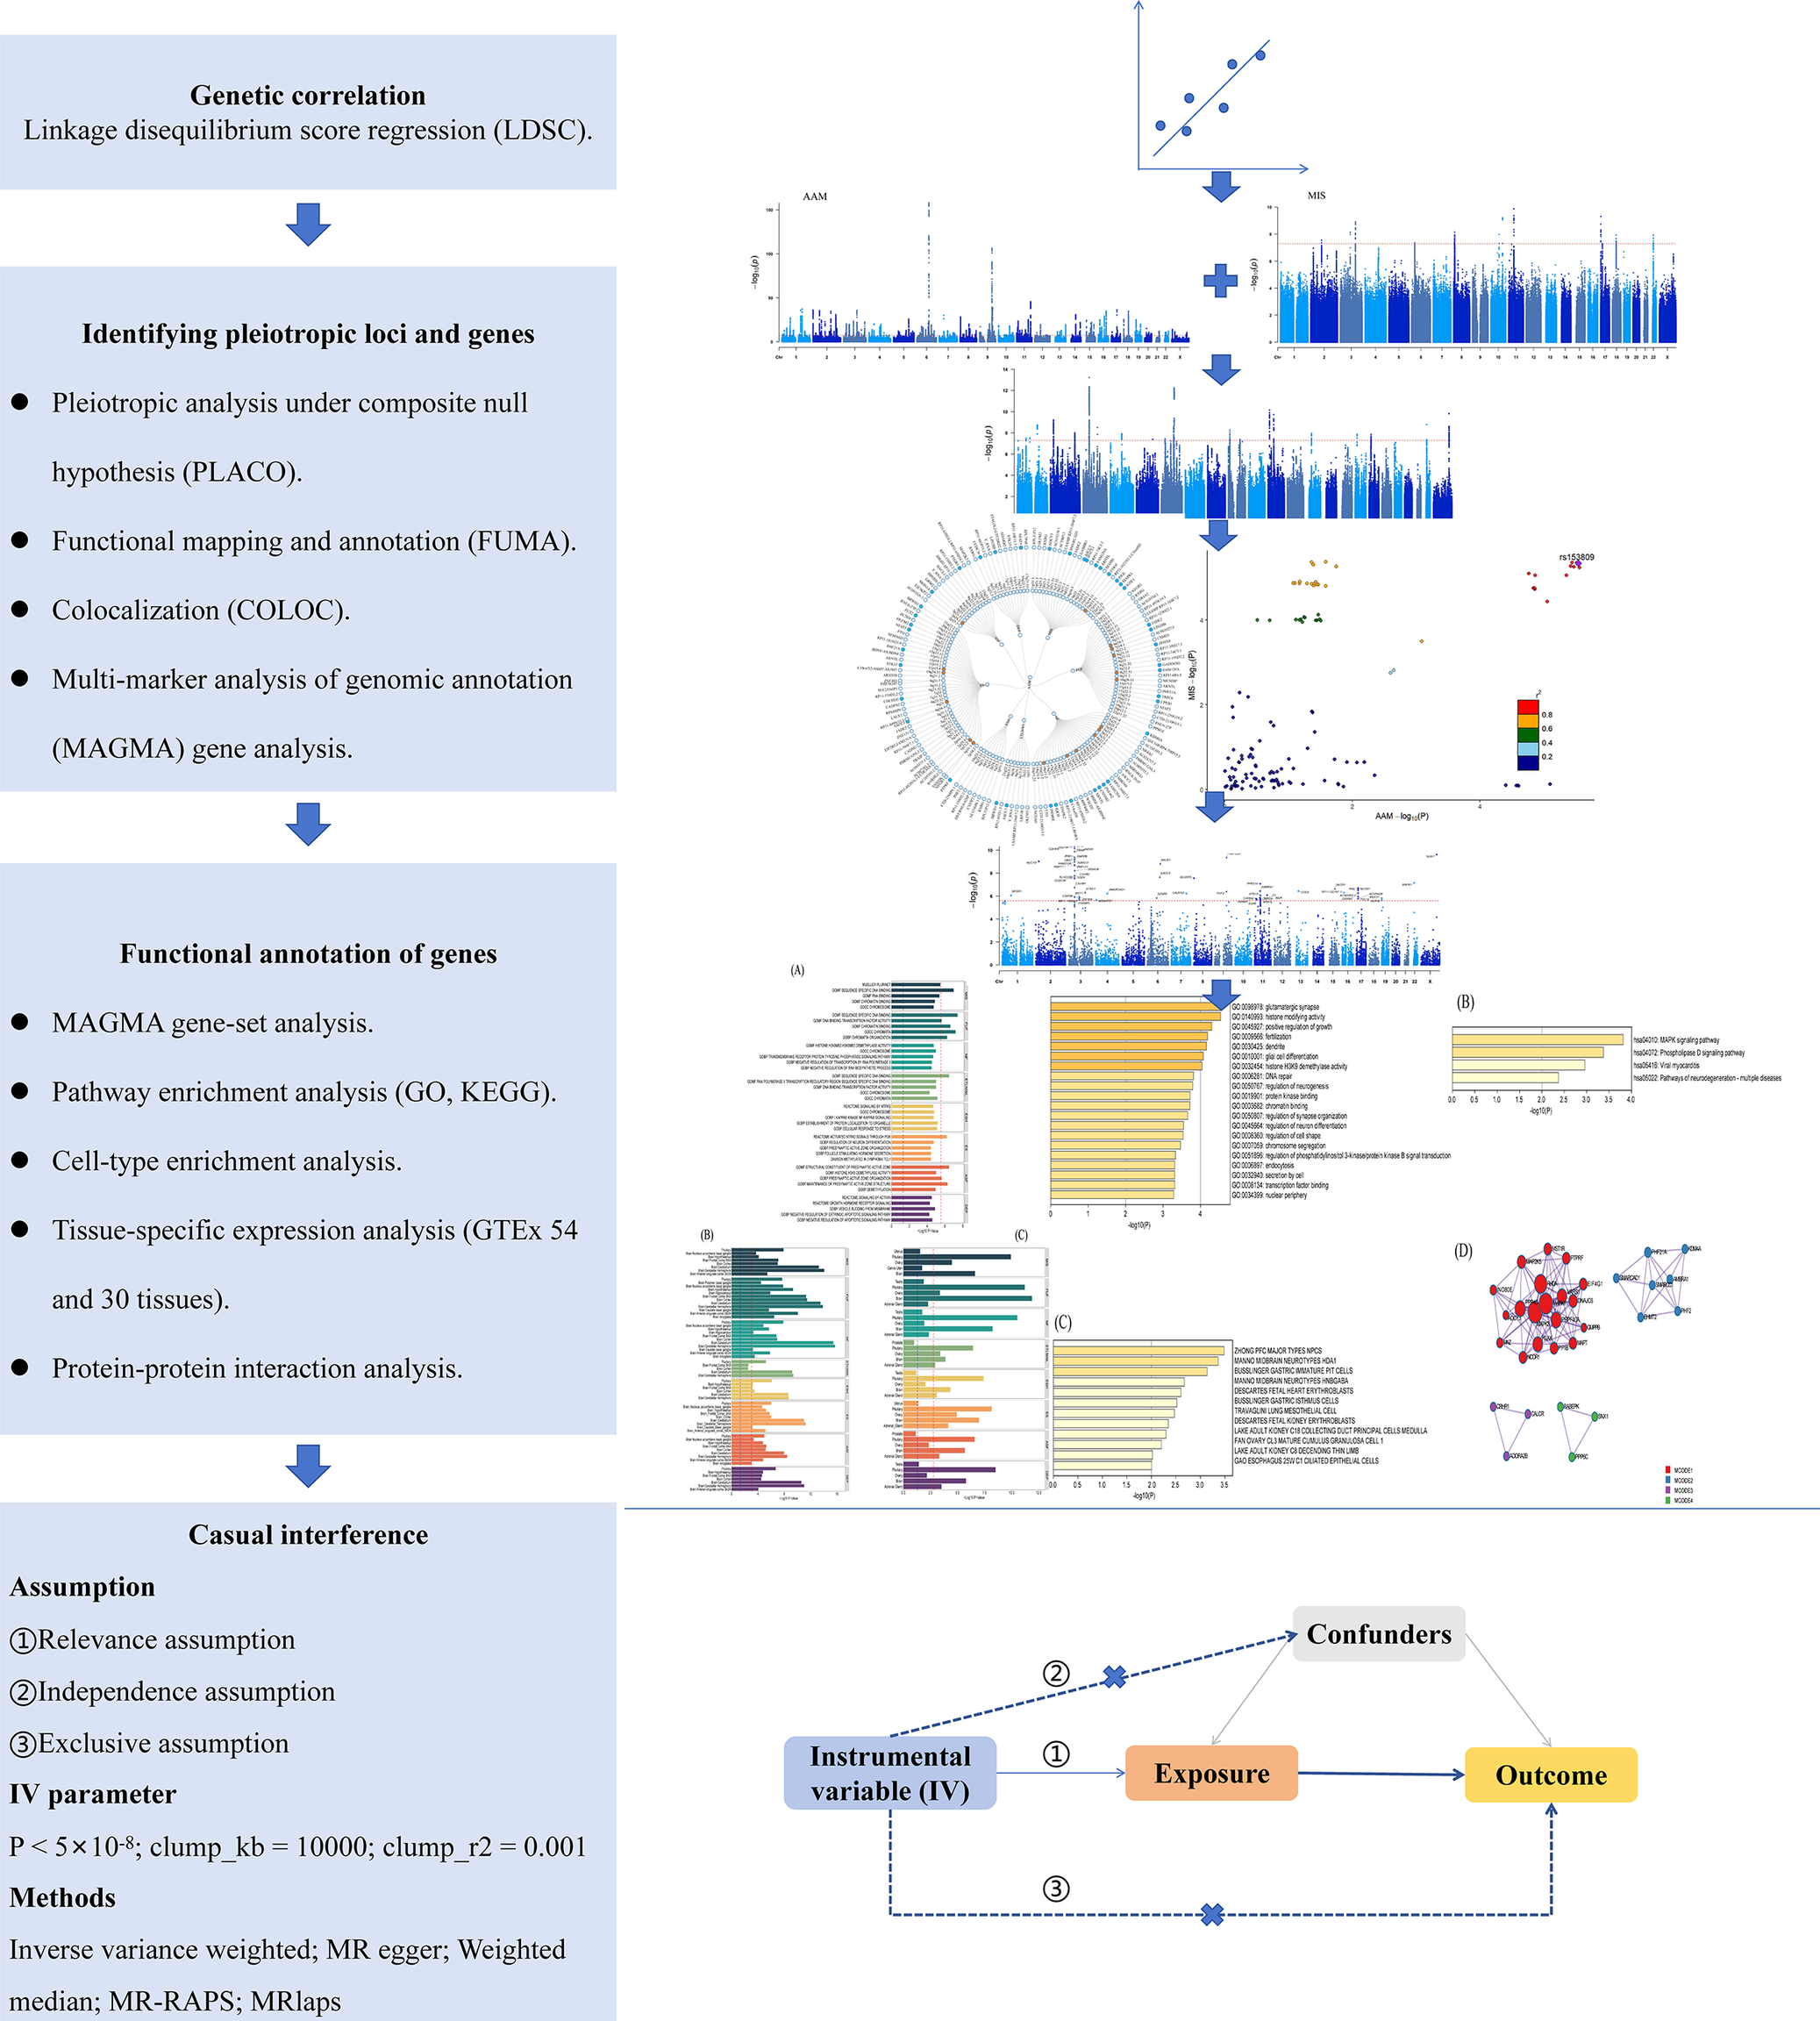
The flowchart of our research is shown in Figure 1. The GWAS summary data for AAM were obtained from the meta-analysis conducted by Day et al., with the 23andMe portion excluded due to access restrictions [Reference Day, Thompson, Helgason, Chasman, Finucane and Sulem11].
Study flowchart.

Figure 1 Long description
Starting at the top, the first blue box is labeled Genetic correlation with Linkage disequilibrium score regression (L D S C). An arrow points down to Identifying pleiotropic loci and genes, listing Pleiotropic analysis under composite null hypothesis (P L A C O), Functional mapping and annotation (F U M A), Colocalization (C O L O C), and Multi-marker analysis of genomic annotation (M A G M A) gene analysis. To the right, two Manhattan plots and a scatter plot are shown, with a circular plot below. The next blue box is Functional annotation of genes, listing M A G M A gene-set analysis, Pathway enrichment analysis (G O, K E G G), Cell-type enrichment analysis, Tissue-specific expression analysis (G T E X 54 and 30 tissues), and Protein-protein interaction analysis. To the right are bar graphs, a circular plot, and a network diagram. The final blue box is Casual interference, listing assumptions (Relevance, Independence, Exclusive), I V parameter (P less than 5 times 10 to the minus 8, clump_k b equals 10000, clump r squared equals 0.001), and methods (Inverse variance weighted, M R egger, Weighted median, M R-R A P S, M Rlaps). To the right is a directed acyclic graph with Instrumental variable (I V) pointing to Exposure, which points to Outcome, with Confounders influencing both Exposure and Outcome. All steps are connected by downward arrows, showing the sequential workflow.
The female-specific GWAS data for mental health-related phenotypes were all sourced from the UK Biobank. In the initial phenotype screening phase, our study preliminarily retrieved candidate phenotypes covering mental health and related behavioral domains from the UK Biobank and implemented a uniform filtering procedure. First, LDSC was used to perform pre-analysis on summary statistics, excluding phenotypes with weak genetic signals that led to non-convergent models, invalid parameter estimates, or heritability below 1%. On this basis, for psychiatric disorder phenotypes, our study excluded those based solely on participant self-report without clear diagnostic confirmation (e.g., self-reported diagnoses outside specialized interviews). Ultimately, 15 phenotypes passed screening criteria, including mood swings (MS), nervous feelings (NF), miserableness (MIS), fed-up feelings (FUF), ever self-harmed (ESH), ever thought that life is not worth living (ETLNWL), ever attempted suicide (EAS), ever smoker (ES), age started smoking in former smokers (ASF), age started smoking in current smokers (ASC), social anxiety (SA), depression (DEP), anxiety (ANX), panic attacks (PA), and obsessive-compulsive disorder (OCD). All participants in the GWAS data were of European ancestry. Detailed information on the phenotype screening process and specific phenotypic information can be found in Supplementary Tables S1 and S2, respectively. Notably, as some studies have included smoking-related phenotypes as part of externalizing problems, we also incorporated three smoking-related phenotypes into our analysis [Reference Karlsson Linnér, Mallard, Barr, Sanchez-Roige, Madole and Driver18, Reference Baselmans, Hammerschlag, Noordijk, Ip, van der Zee and de Geus19]. These 15 phenotypes were further categorized into internalizing symptoms (MS, NF, MIS, FUF, ESH, ETLNWL, and EAS), externalizing behaviors (ES, ASF, and ASC), and psychiatric disorders (SA, DEP, ANX, PA, and OCD).
Genetic correlation analysis
To estimate the genetic correlations between AAM and mental health-related phenotypes, we applied LDSC, a widely used method that leverages GWAS summary statistics to quantify the shared genetic architecture between complex traits [Reference Bulik-Sullivan, Finucane, Anttila, Gusev, Day and Loh20] LDSC operates by regressing the χ 2 statistics from two GWAS studies on the LD scores, which are derived from reference populations and reflect the extent of genetic variation tagged by each SNP. This approach is robust to sample overlap and provides unbiased estimates of genetic correlations even when the traits are measured in different cohorts. LD scores were calculated using the 1000 Genomes Project European ancestry data [Reference Auton, Brooks, Durbin, Garrison, Kang and Korbel21].
Identification of pleiotropic loci
PLACO was performed to test the pleiotropic association of AAM and mental health-related phenotypes at the SNP level [Reference Ray and Chatterjee22, Reference Ray, Venkataraghavan, Zhang, Leslie, Hetmanski and Weinberg23]. Effect alleles were harmonized across studies, and all variants were scored based on squared Z-scores, with SNPs exhibiting Z-squared values >80 being excluded. SNPs surpassing the genome-wide significance threshold (P < 5 × 10⁻⁸) were considered statistically significant pleiotropic variants.
Subsequently, Functional Mapping and Annotation (FUMA) of GWAS was utilized to identify potential pleiotropic loci [Reference Watanabe, Taskesen, van Bochoven and Posthuma24]. Bayesian colocalization analysis was further conducted to determine whether each pleiotropic locus shared causal variants [Reference Wallace25]. A posterior probability for the H4 hypothesis (PP.H4) greater than 0.7 was used as the threshold to define significant colocalization. Detailed methodological descriptions can be found in the Supplementary Methods.
Identification and functional analysis of pleiotropic genes
Based on the PLACO results, MAGMA was used to map the identified pleiotropic SNPs to genes for further investigation of their biological functions [Reference de Leeuw, Mooij, Heskes and Posthuma26]. SNPs were mapped to genes using MAGMA gene annotation with a 10 kb window extension upstream and downstream of genes. Subsequently, significant genes were identified using MAGMA gene-based analysis based on the 1000 Genomes European reference data, with a significance threshold of P < 2.528 × 10⁻⁶ (0.05/19,782). For gene-set analysis, curated biological pathways (C2: Curated and C5: Ontology) from the Molecular Signatures Database (MSigDB) [Reference Subramanian, Tamayo, Mootha, Mukherjee, Ebert and Gillette27] were interrogated to explore the biofunction of relevant genes, using a Bonferroni-adjusted threshold with P < 2.939 × 10⁻⁶ (0.05/17,012). Detailed methodological descriptions of MAGMA can be found in the Supplementary Methods.
In addition, Metascape tool was used to perform pathway enrichment analysis (Gene Ontology, GO; Kyoto Encyclopedia of Genes and Genomes, KEGG), cellular component, and protein–protein interaction (PPI) enrichment analysis on all unique significant genes to further explore their biological functions [Reference Zhou, Zhou, Pache, Chang, Khodabakhshi and Tanaseichuk28]. Additionally, tissue-specific and differential gene expression (DEG) analysis were conducted based on data from Genotype-Tissue Expression (GTEx, v8) 54 tissues and GTEx 30 tissues [Reference Carithers, Ardlie, Barcus, Branton, Britton and Buia29].
Mendelian randomization
Bidirectional two-sample MR was implemented to explore the potential causal relationship between AAM and mental health-related phenotypes. Genome-wide significant SNPs (P < 5 × 10⁻⁸) were chosen as instrumental variables (IVs). Furthermore, SNPs were pruned for LD based on the 1000 Genomes Project European reference panel, with a clumping window of 10,000 kb and r 2 > 0.001 [Reference Auton, Brooks, Durbin, Garrison, Kang and Korbel21]. The strength of the IVs was assessed by F statistics (F > 10) [Reference Burgess and Thompson30]. The inverse variance weighted (IVW) method was employed as the primary analytical approach. Alternative methods, including the weighted median, MR Egger, and MR robust adjusted profile score (MR-RAPS) methods to rigorously evaluate the robustness of causal estimates under varying assumptions. Heterogeneity across IV estimates was evaluated using Cochran’s Q statistic and I 2. Horizontal pleiotropy was examined through MR-Egger intercept tests. Other sensitivity analyses consisted of MR pleiotropy residual sum and outlier (MR-PRESSO) and MRlap. MRlap was used to deal with possible sample overlap bias, which was only applied to significant associations due to its tendency to overestimate causal effects [Reference Mounier and Kutalik31]. Causal directionality was further assessed using the MR Steiger directionality test to confirm the validity of the exposure-to-outcome hypothesis [Reference Hemani, Tilling and Davey Smith32]. Detailed methodological descriptions of MR can be found in the Supplementary Methods.
Software and packages
The main statistical analysis was conducted using R (version 4.4.2). LDSC was performed with LDSC software (v1.0.1) [Reference Bulik-Sullivan, Loh, Finucane, Ripke, Yang and Patterson33]. PLACO was performed with the PLACO package (v0.1.1) [Reference Ray and Chatterjee22]. The FUMA web tool was used for functional mapping and annotation of GWAS results (https://fuma.ctglab.nl/). Bayesian colocalization analysis was conducted using coloc package (v5.2.3) [Reference Wallace25]. MAGMA gene-based analysis and gene-set analysis were performed with MAGMA software (v1.10) [Reference de Leeuw, Mooij, Heskes and Posthuma26]. Enrichment analysis was performed with the Metascape web tool (https://metascape.org/). MR was conducted using TwoSampleMR (v0.6.4), mr.raps (v0.2) [Reference Qingyuan, Jingshu, Gibran, Jack and Dylan34], MRPRESSO (v1.0) [Reference Verbanck, Chen, Neale and Do35] and MRlap (v0.0.3) packages [Reference Mounier and Kutalik31].
Results
Genetic correlation between AAM and mental health-related phenotypes
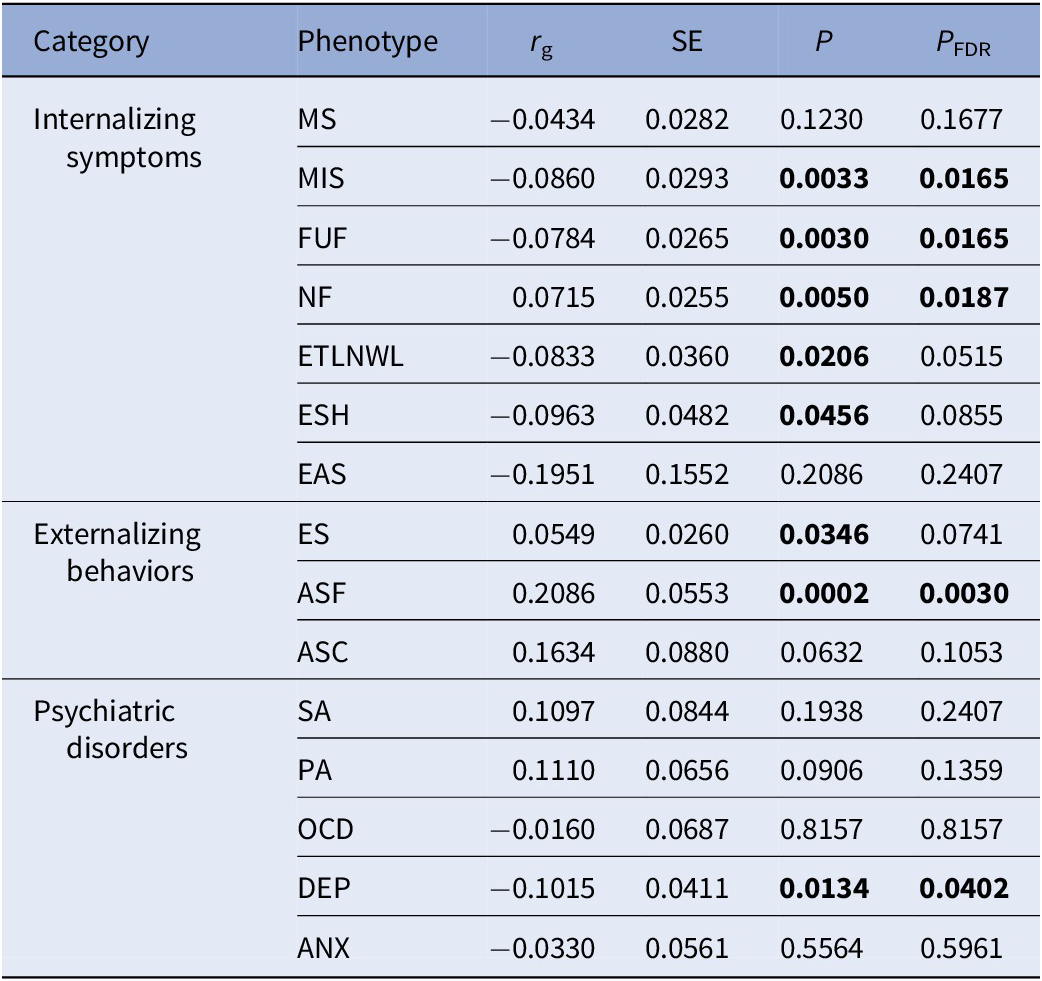
We initially estimated the heritability of AAM and mental health-related phenotypes, as well as their genetic correlations (Table 1 and Supplementary Table S3). Significant genetic correlations (P < 0.05) were identified between AAM and several mental health-related phenotypes (negative correlation: MIS, r g = −0.0860, P = 0.0033; FUF, r g = −0.0784, P = 0.0030; ETLNWL, r g = −0.0833, P = 0.0206; ESH, r g = −0.0963, P = 0.0456; DEP, r g = −0.1015, P = 0.0134. Positive correlation: NF, r g = 0.0715, P = 0.0050; ES, r g = 0.0549, P = 0.0346; ASF, r g = 0.2086, P = 0.0002. After applying FDR correction (PFDR < 0.05), five trait pairs (MIS, FUF, NF, ASF, and DEP) remained statistically significant, while the remaining three nominally significant pairs (ETLNWL, ESH, and ES) showed marginally significant P FDR values (0.0515, 0.0855, and 0.0741, respectively).
Genetic correlation between age at menarche and mental health-related phenotypes
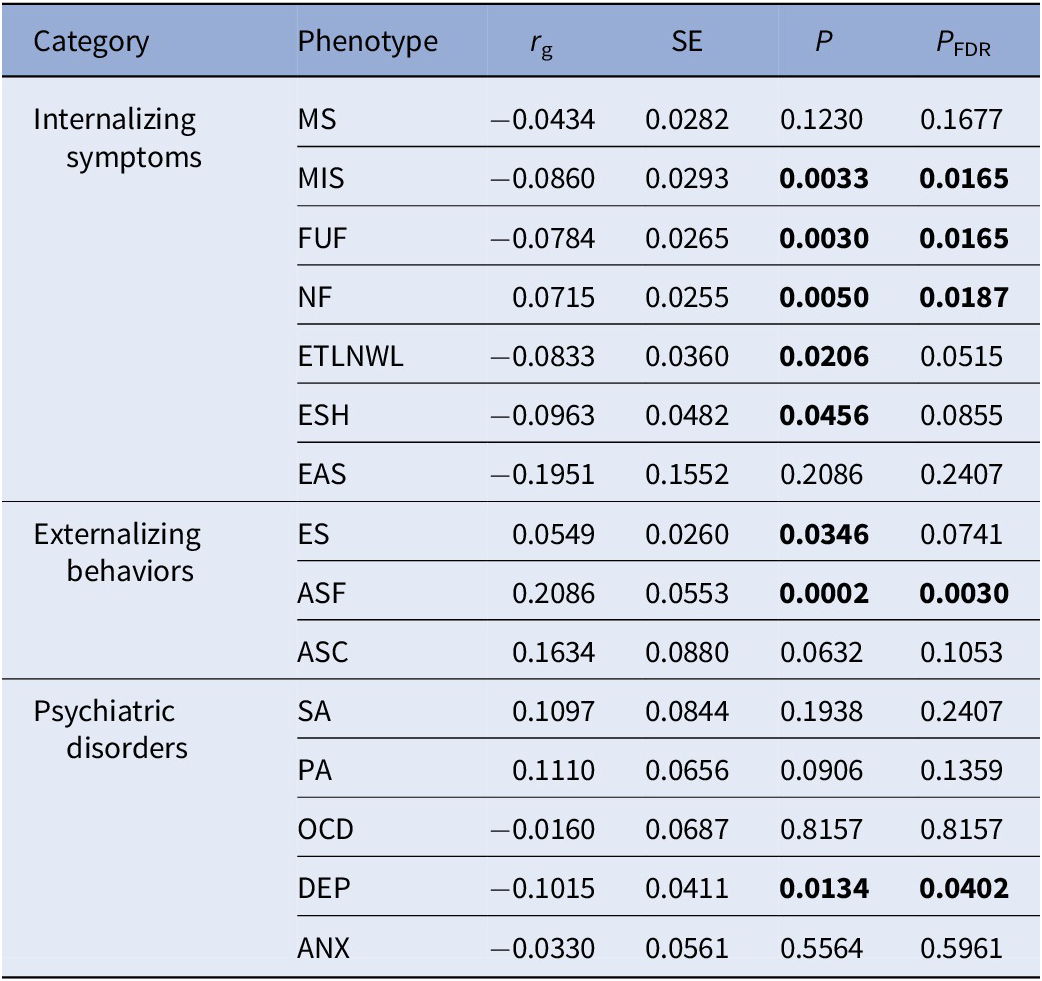
Table 1 Long description
The table consists of six columns: Category, Phenotype, r sub g, S E, P, and P sub F D R. Categories are Internalizing symptoms, Externalizing behaviors, and Psychiatric disorders. For Internalizing symptoms, phenotypes include M S, M I S, F U F, N F, E T L N W L, E S H, and E A S. M I S, F U F, N F, E T L N W L, and E S H have significant P values (all less than 0.05), with r sub g values ranging from negative 0.0860 to 0.0715. For Externalizing behaviors, E S, A S F, and A S C are listed; A S F shows the strongest positive correlation (r sub g 0.2086, P 0.0002, P sub F D R 0.0030). For Psychiatric disorders, S A, P A, O C D, D E P, and A N X are listed; D E P shows a significant negative correlation (r sub g negative 0.1015, P 0.0134, P sub F D R 0.0402). All abbreviations are defined in the table footnote. Bolded P and P sub F D R values indicate statistical significance.
Note: rg represents genetic correlation coefficients. SE represents standard error. P FDR represents the false discovery rate adjusted P-value, bold values indicate statistical significance with P<0.05.
Abbreviations: MS, mood swing; MIS, miserableness; FUF, fed-up feelings; NF, nervous feelings; ETLNWL, ever thought that life not worth living; ESH, ever self-harmed; EAS, ever attempted suicide; ES, ever smoker; ASF, age started smoking in former smokers; ASC, age started smoking in current smokers; SA, social anxiety; PA, panic attacks; OCD, obsessive compulsive disorder; DEP, depression; ANX, anxiety.
Shared loci for AAM and mental health-related phenotypes
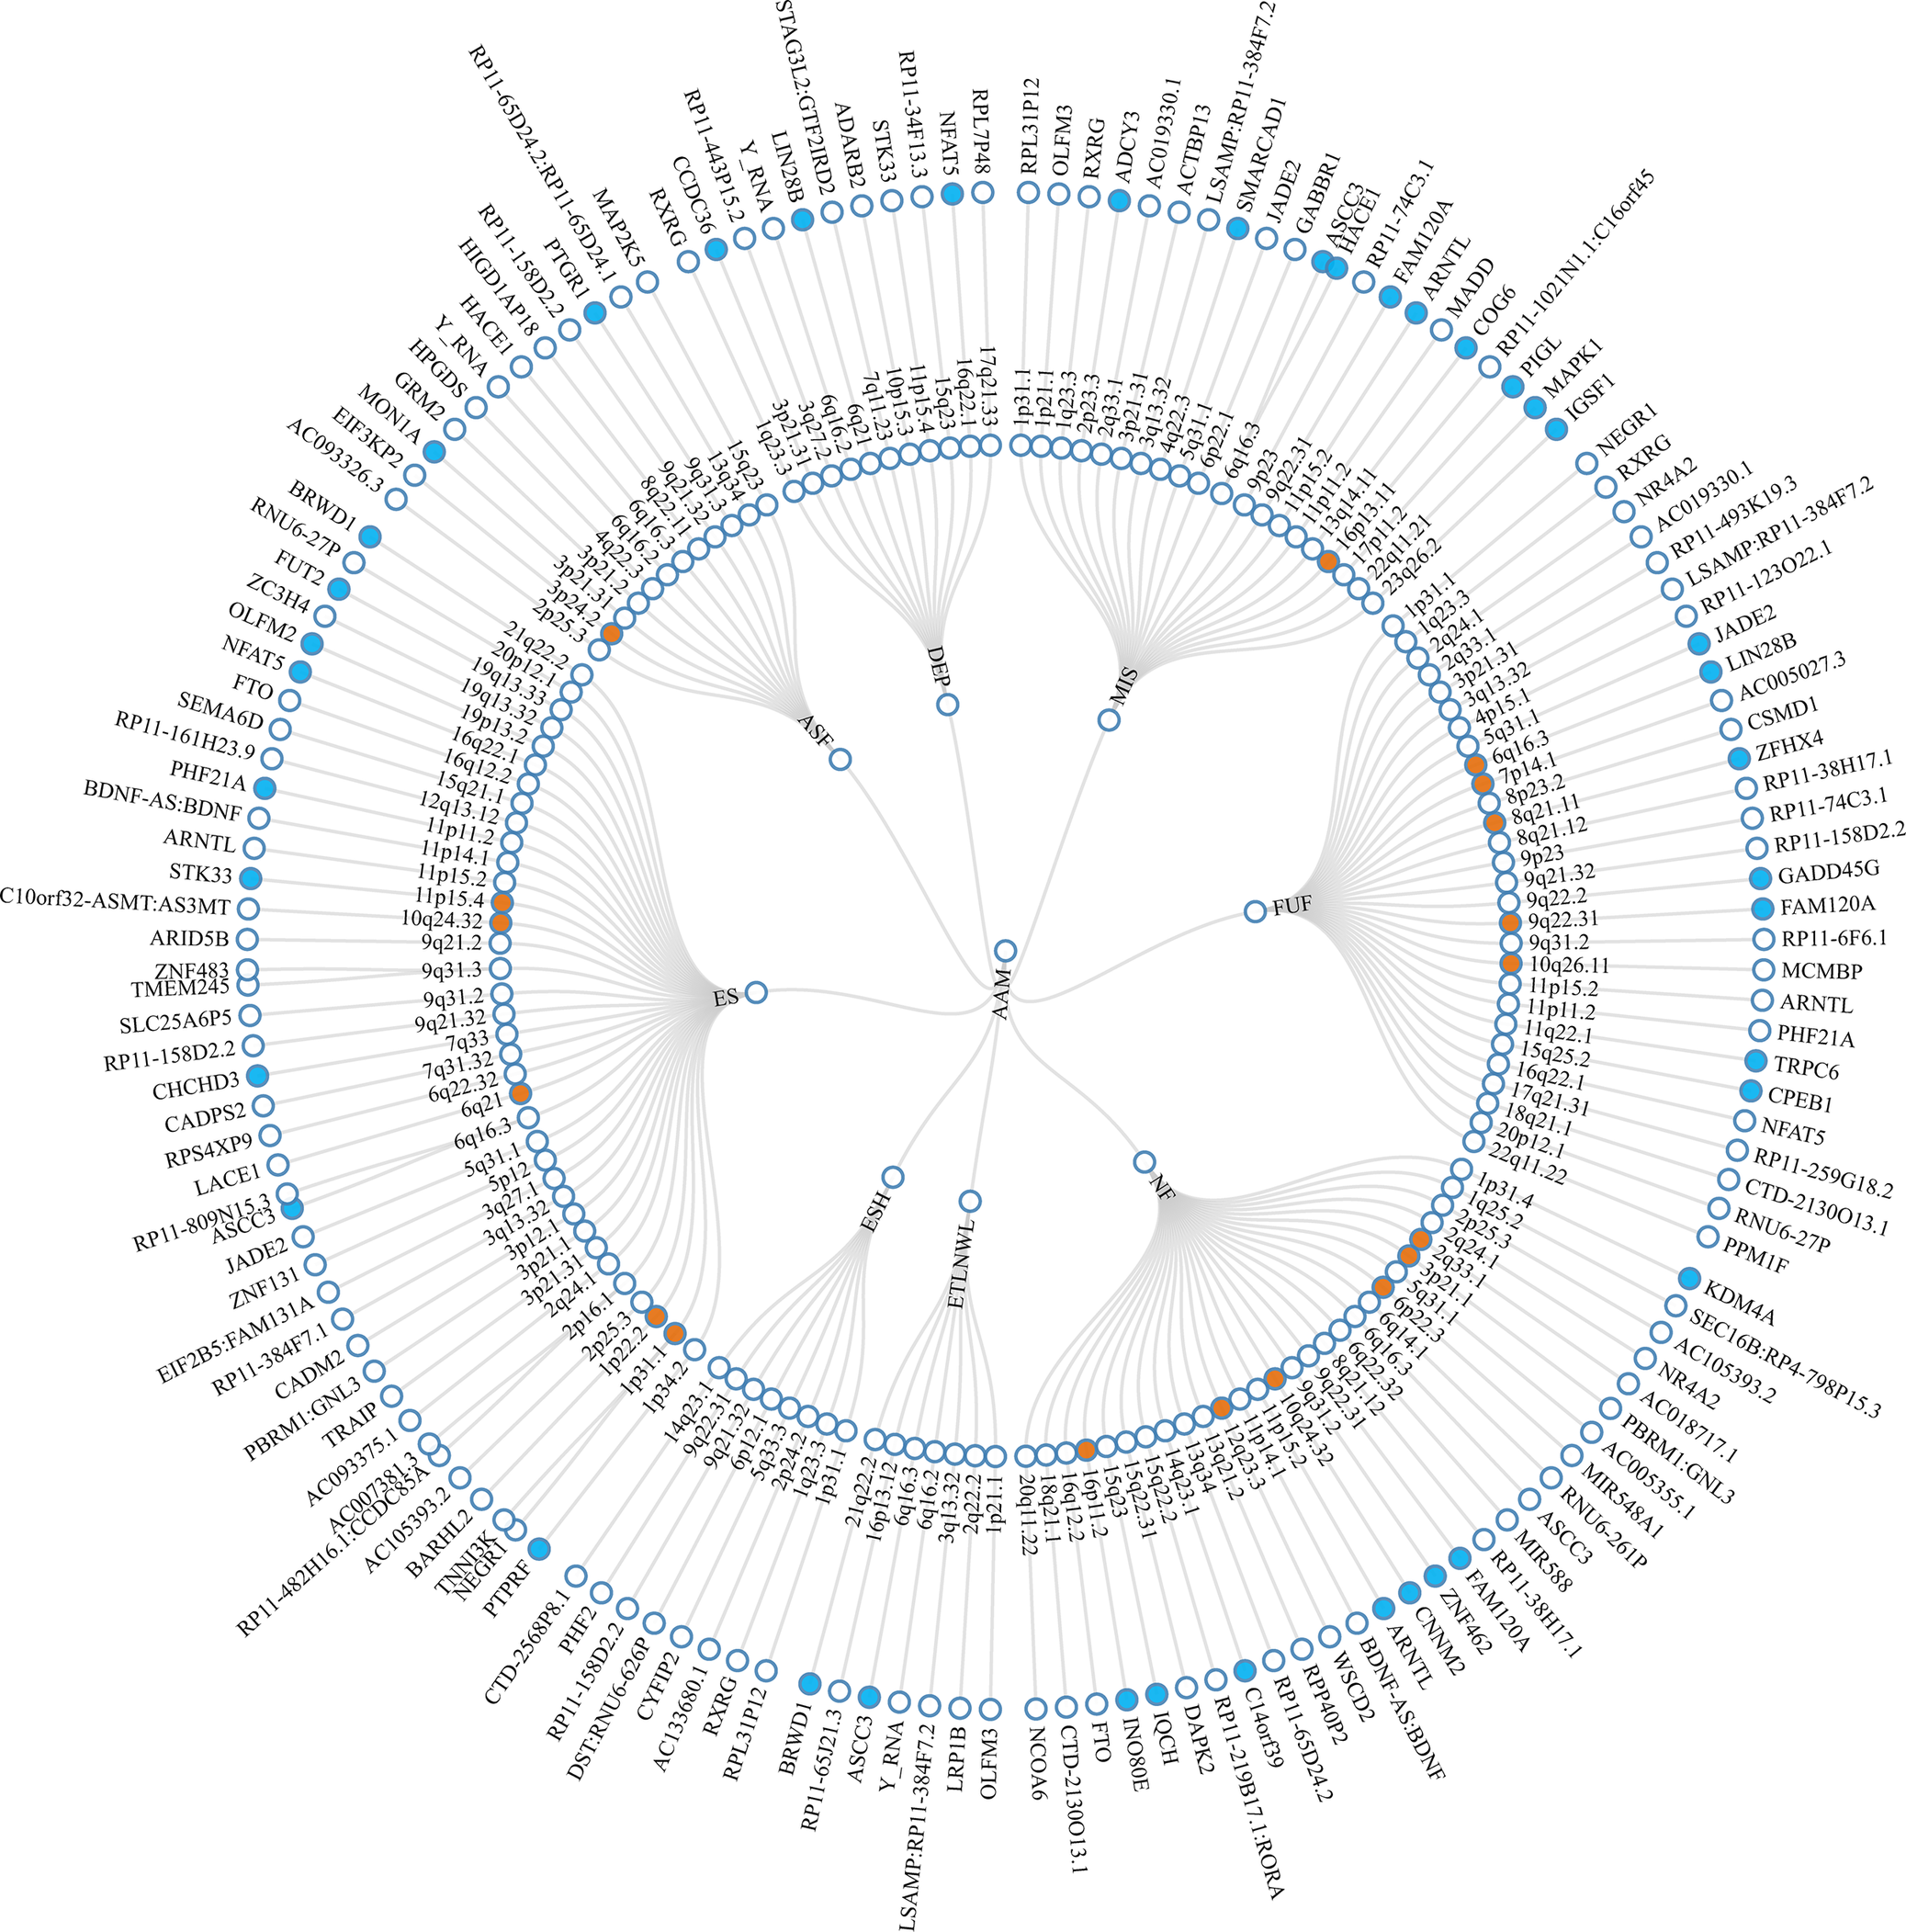
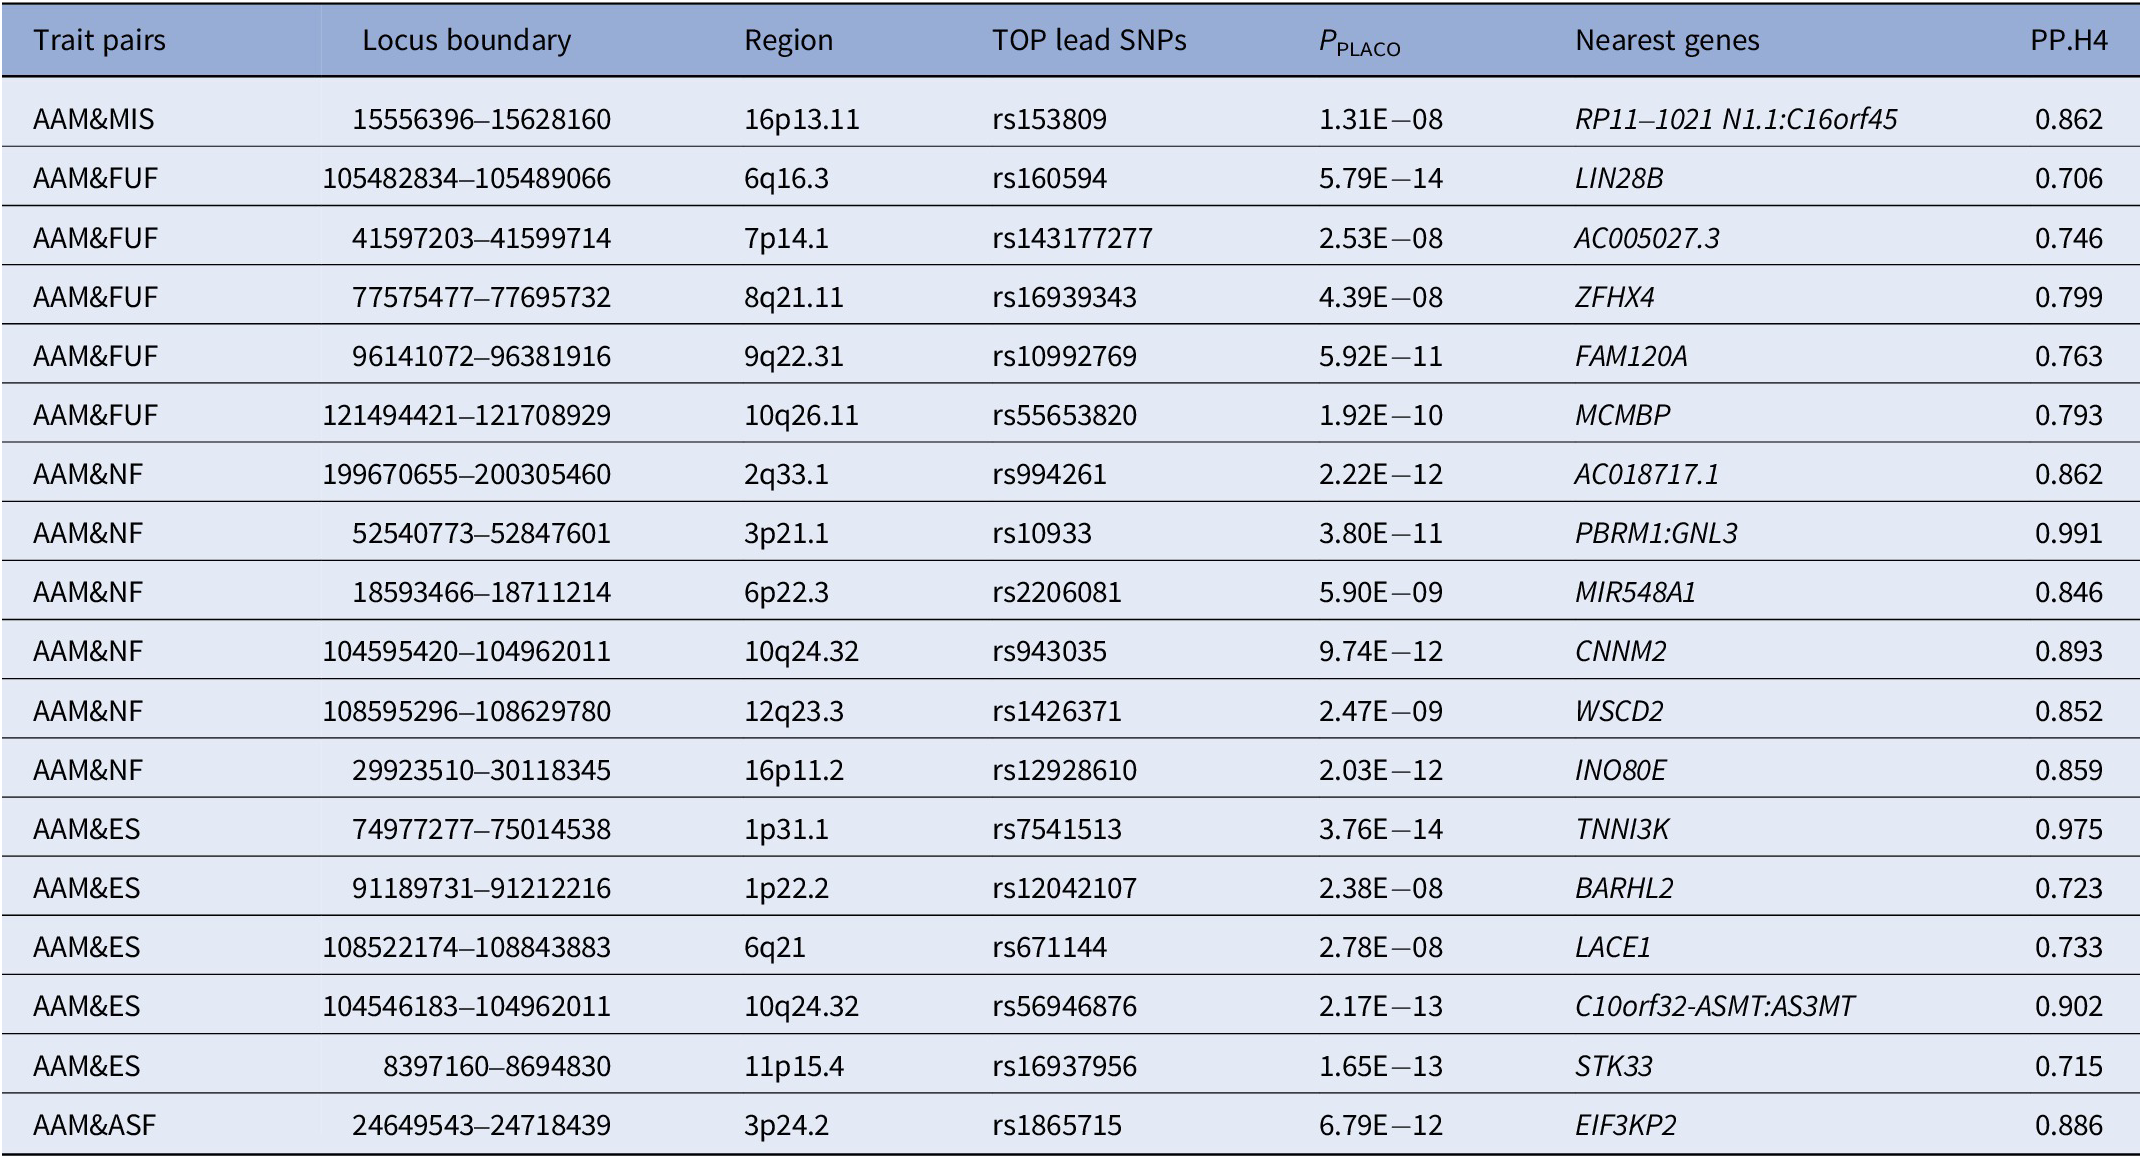
Based on the results from LDSC, PLACO was employed to assess pleiotropic loci between trait pairs showing significant genetic correlations (Supplementary Figures S1 and S2). Based on PLACO results (P < 5 × 10⁻⁸), we identified 155 pleiotropic loci between AAM and mental health traits using FUMA, which were distributed across multiple chromosomal regions (e.g., 6q16.3, 1p31.1, 3p21.31) (Figure 2 and Supplementary Table S4). Colocalization analysis ultimately confirmed 18 colocalized loci with PP.H4 > 0.7 (e.g., 6q16.3, 8q21.11) (Table 2). To further validate whether these colocalized loci represent known psychiatric risk loci, we queried the GWAS Catalog using their nearest genes. As summarized in Supplementary Table S5, several genes (e.g., LIN28B, ZFHX4, FAM120A, CNNM2, WSCD2, TNNI3K, BARHL2, and STK33) have been previously associated with a range of psychiatric traits, including schizophrenia, major depressive disorder, insomnia, and substance use disorders. Notably, some of them (e.g., LIN28B, ZFHX4, WSCD2, TNNI3K, and STK33) also show associations with pubertal development (e.g., AAM, voice breaking). LocusZoom and LocusCompare plots for each trait pair are presented in Supplementary Figures S3–S7.
Circular diagram of pleiotropic loci and genes identified across eight trait pairs. Note: The middle ring represents the chromosomal regions where the pleiotropic loci are located, while the outermost ring indicates the nearest genes to these loci. Pleiotropic loci identified by colocalization analysis are highlighted in orange and pleiotropic genes identified by MAGMA are marked in blue. AAM, age at menarche; MIS, miserableness; FUF, fed-up feelings; NF, nervous feelings; ETLNWL, ever thought that life is not worth living; ESH, ever self-harmed; ES, ever smoker; ASF, age started smoking in former smokers; DEP, depression.
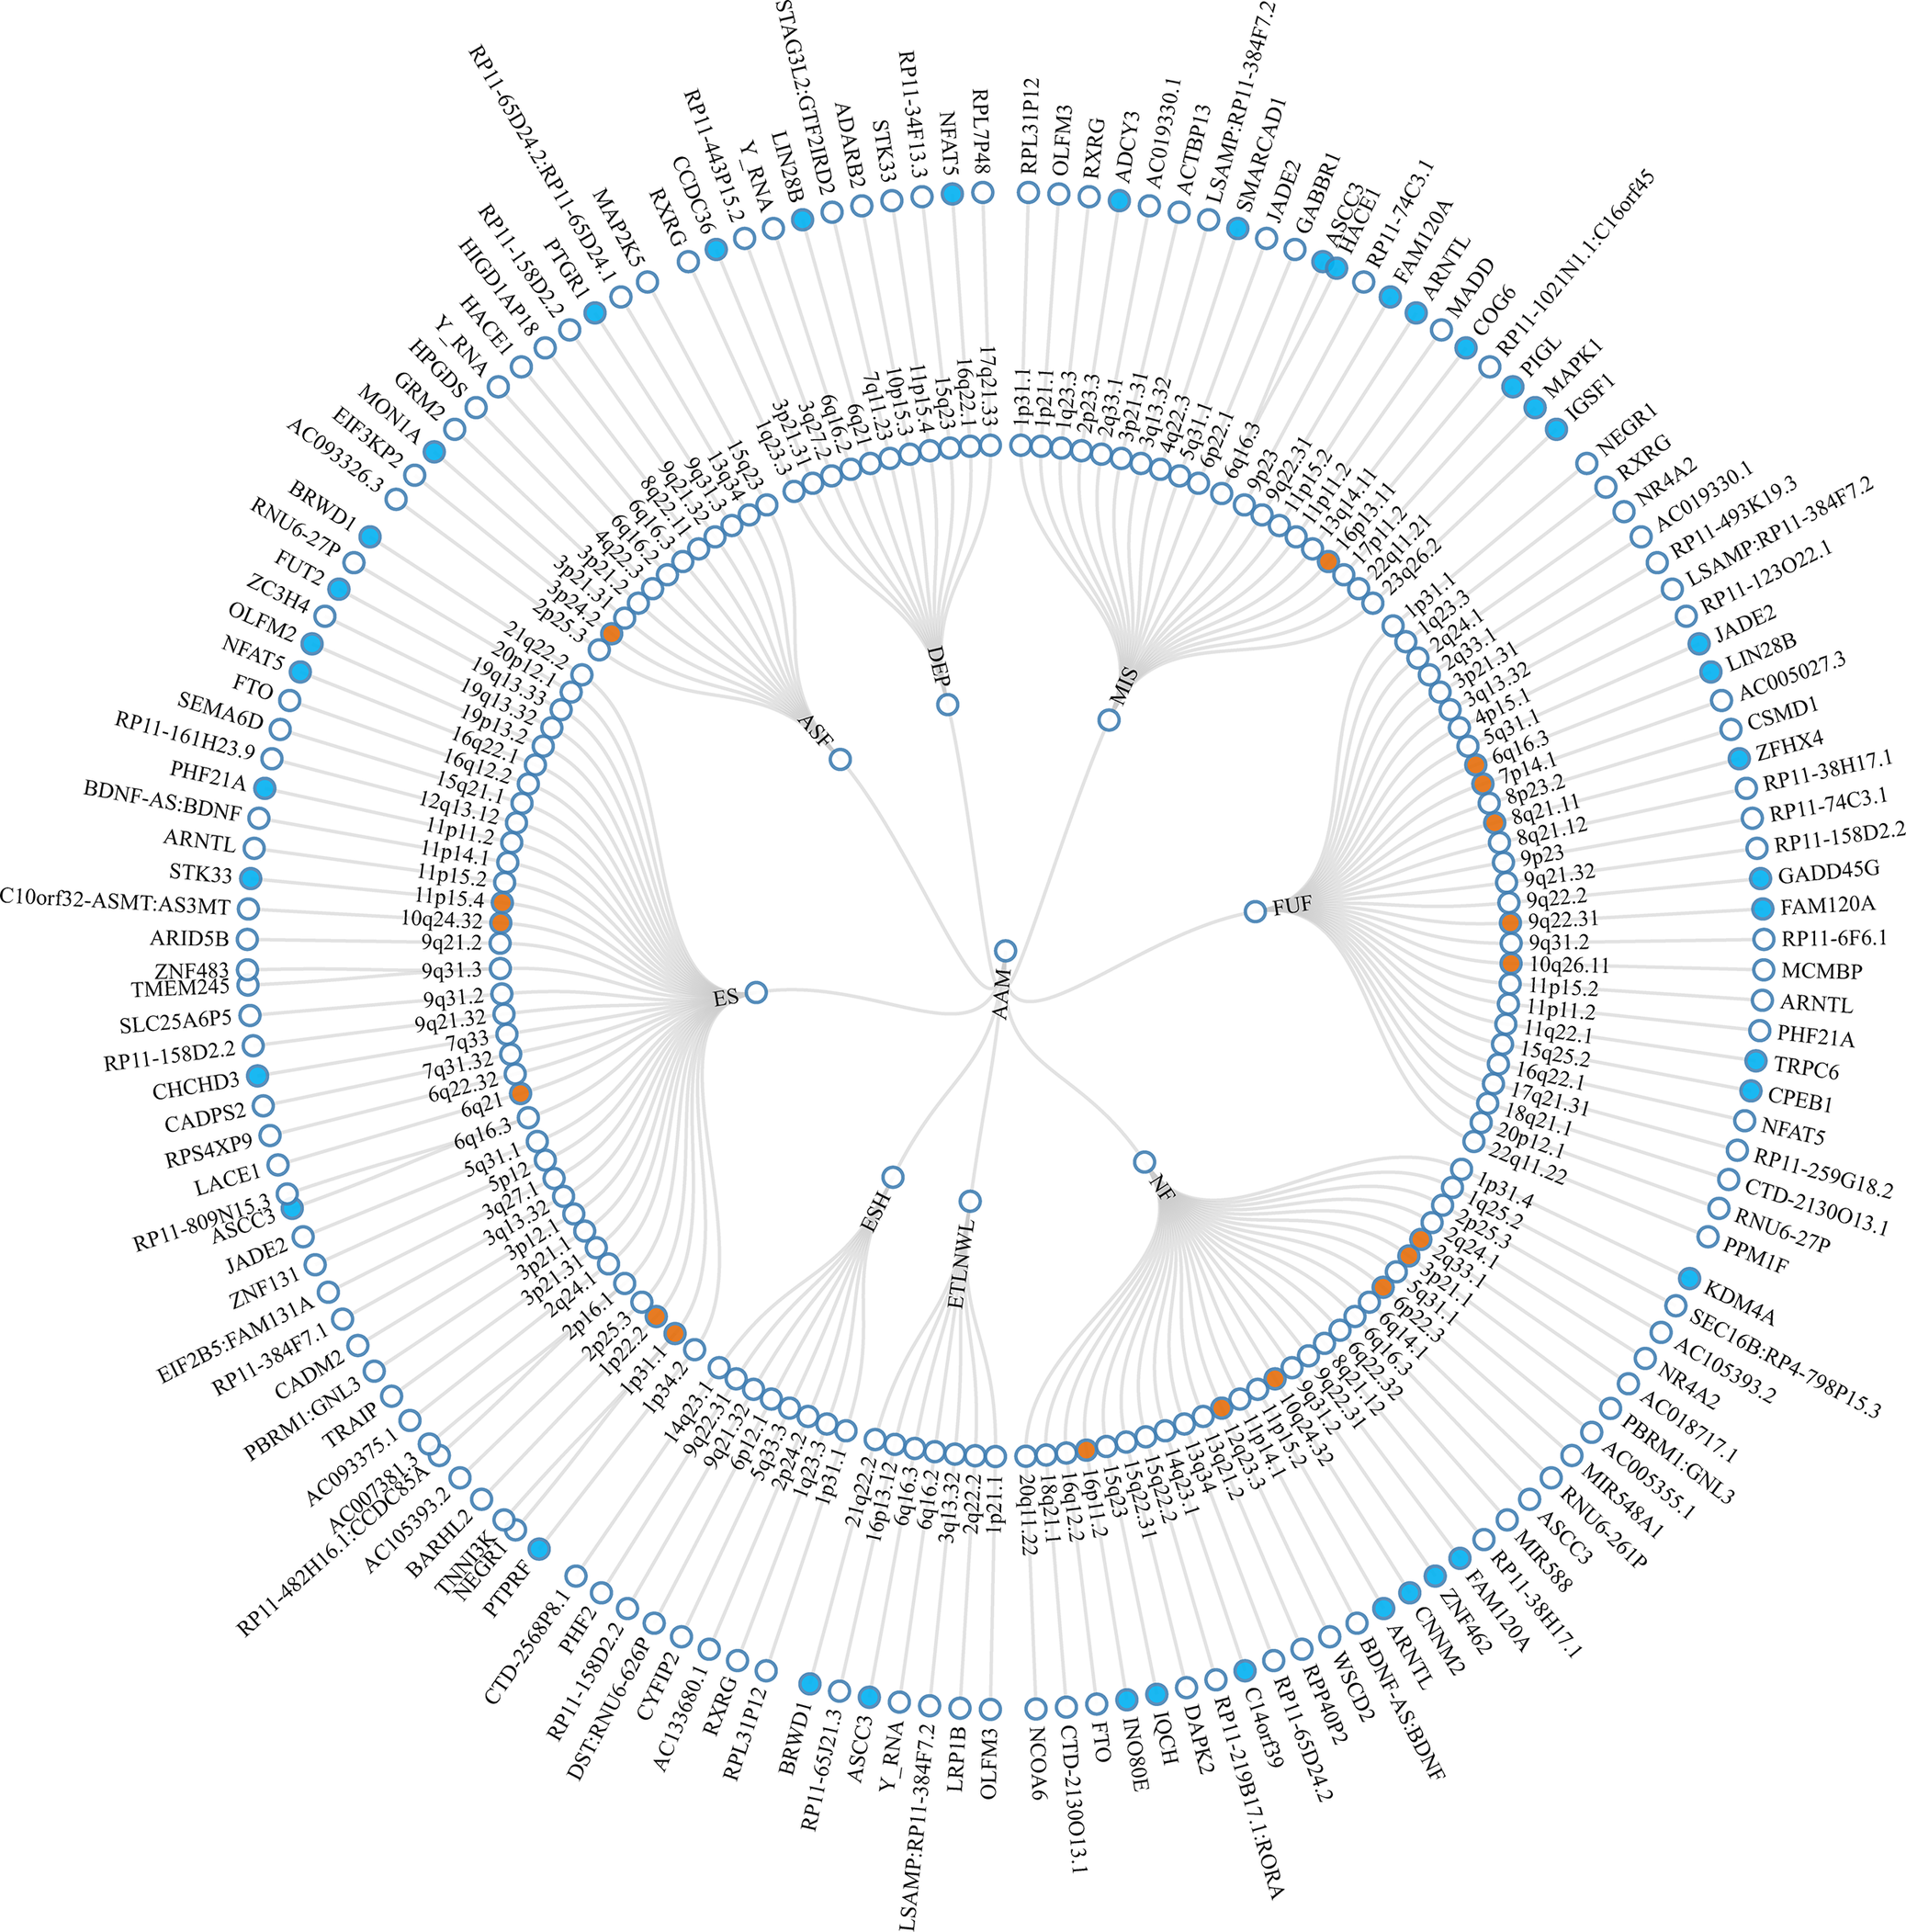
Figure 2 Long description
At the center are eight trait initialisms: A A M, MIS, F U F, N F, E T L N W L, E S H, E S, and A S F. The next layer outward is a ring of chromosomal loci, each labeled with cytogenetic band notation such as 1p36.12, 2q33.1, 3q27.2, and so on. Loci identified by colocalization analysis are highlighted in orange. Radiating lines connect each trait to its associated loci. The outermost ring lists the nearest gene to each locus, including F T O, S E M A D 6, P H F 2, B D N F, A R N T L, S T K 3, T M E M 4 3, S L C 2 5 A 6 2 P S, and many others. Genes identified by M A G M A are marked in blue. Each locus and gene is connected by a line, showing the structural relationship between trait, locus, and gene. All labels are oriented radially outward from the center, and the diagram is fully annotated with the trait and gene names as described.
Shared genetic colocalized loci identified by PLACO (PP.H4 > 0.7)
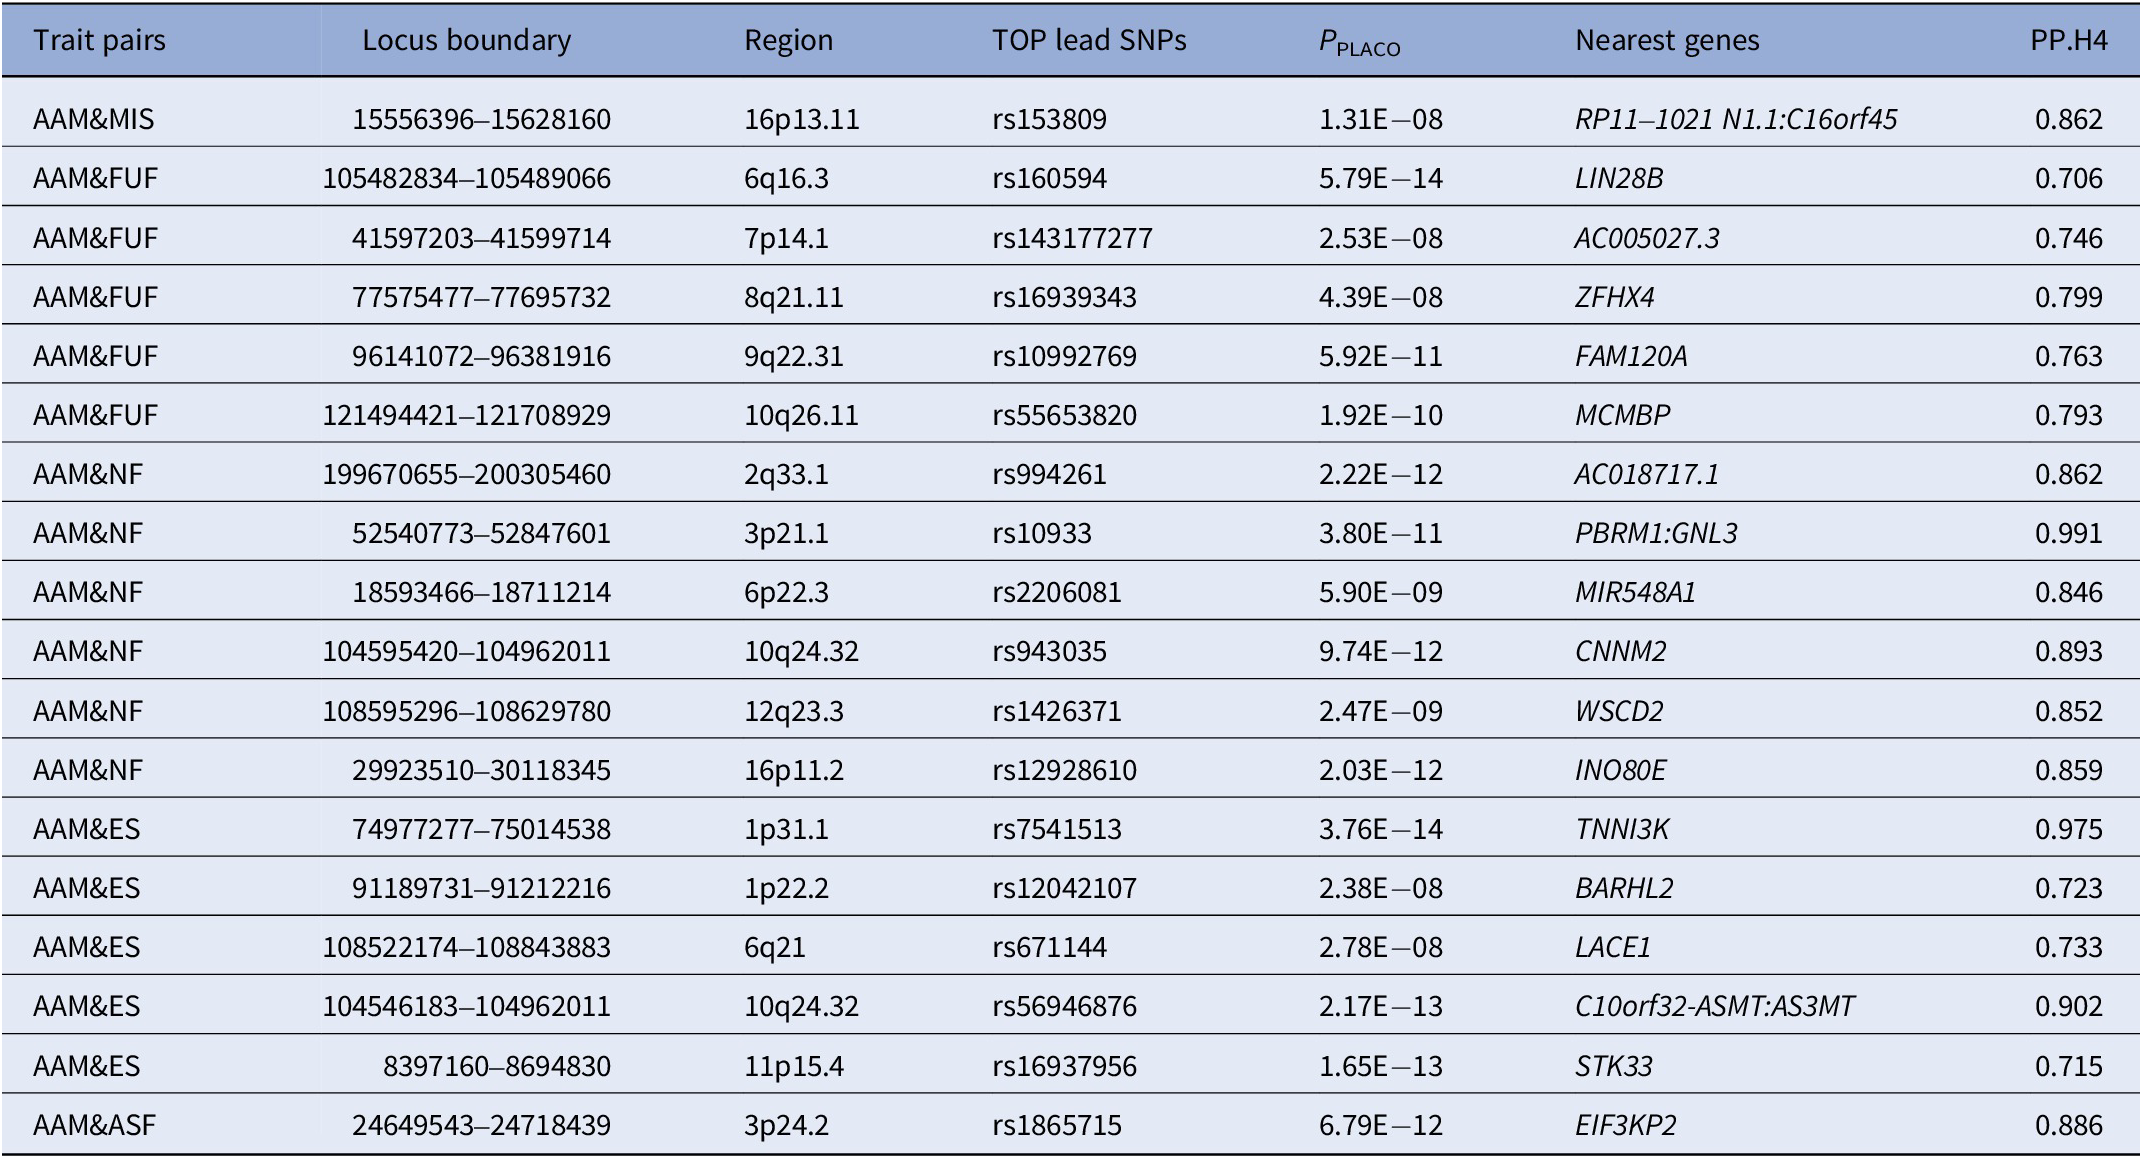
Table 2 Long description
The table contains 17 rows, each with seven columns. Columns are: Trait pairs, Locus boundary, Region, TOP lead S N Ps, P sub PLACO, Nearest genes, and P P dot H4. Row 1: A A M and MIS, 15556396 to 15628160, 16p13.11, rs153809, 1.31 E minus 08, R P 11 dash 1021 N 1.1 colon C 16 o r f 45, 0.862. Row 2: A A M and F U F, 105482834 to 105489066, 6q16.3, rs160594, 5.79 E minus 14, L I N 28 B, 0.706. Row 3: A A M and F U F, 41597203 to 41599714, 7p14.1, rs143177277, 2.53 E minus 08, A C 005027.3, 0.746. Row 4: A A M and F U F, 77575477 to 77695732, 8q21.11, rs16939343, 4.39 E minus 08, Z F H X 4, 0.799. Row 5: A A M and F U F, 96141072 to 96381916, 9q22.31, rs10992769, 5.92 E minus 11, F A M 120 A, 0.763. Row 6: A A M and F U F, 121494421 to 121708929, 10q26.11, rs55653820, 1.92 E minus 10, M C M B P, 0.793. Row 7: A A M and N F, 199670655 to 200305460, 2q33.1, rs994261, 2.22 E minus 12, A C 018717.1, 0.862. Row 8: A A M and N F, 52540773 to 52847601, 3p21.1, rs10933, 3.80 E minus 11, P B R M 1 colon G N L 3, 0.991. Row 9: A A M and N F, 18593466 to 18711214, 6p22.3, rs2206081, 5.90 E minus 09, M I R 548 A 1, 0.846. Row 10: A A M and N F, 104595420 to 104962011, 10q24.32, rs943035, 9.74 E minus 12, C N N M 2, 0.893. Row 11: A A M and N F, 108595296 to 108629780, 12q23.3, rs1426371, 2.47 E minus 09, W S C D 2, 0.852. Row 12: A A M and N F, 29923510 to 30118345, 16p11.2, rs12928610, 2.03 E minus 12, I N O 80 E, 0.859. Row 13: A A M and E S, 74977277 to 75014538, 1p31.1, rs7541513, 3.76 E minus 14, T N N I 3 K, 0.975. Row 14: A A M and E S, 91189731 to 91212216, 1p22.2, rs12042107, 2.38 E minus 08, B A R H L 2, 0.723. Row 15: A A M and E S, 108522174 to 108843883, 6q21, rs671144, 2.78 E minus 08, L A C E 1, 0.733. Row 16: A A M and E S, 104546183 to 104962011, 10q24.32, rs56946876, 2.17 E minus 13, C 10 o r f 32 dash A S M T colon A S 3 M T, 0.902. Row 17: A A M and E S, 8397160 to 8694830, 11p15.4, rs16937956, 1.65 E minus 13, S T K 33, 0.715. Row 18: A A M and A S F, 24649543 to 24718439, 3p24.2, rs1865715, 6.79 E minus 12, E I F 3 K P 2, 0.886. All P P dot H4 values are above 0.7, indicating high colocalization probability. Abbreviations: P P dot H4 is posterior probability for the H4 hypothesis, A A M is age at menarche, M S is mood swing, M I S is miserableness, F U F is fed-up feelings, N F is nervous feelings, E S is ever smoker, A S F is age started smoking in former smokers.
Abbreviations: PP.H4, posterior probability for the H4 hypothesis; AAM, age at menarche; MS, mood swing; MIS, miserableness; FUF, fed-up feelings; NF, nervous feelings; ES, ever smoker; ASF, age started smoking in former smokers.
Pleiotropic gene and enrichment analysis
Through MAGMA gene-based analysis, we identified a total of 311 significantly associated genes (203 unique genes) (Supplementary Tables S6–S7, Supplementary Figure S8). TRPC6 was detected across six trait pairs, while FAM120A, RHOA, and TCTA were observed in five trait pairs, with AMT and ASCC3 appearing in four trait pairs. Pathway enrichment analysis using MAGMA gene-set analysis revealed biological pathways associated with eight trait pairs (Supplementary Table S8, Supplementary Figure S9A). Tissue-specific expression profiling (Supplementary Table S9–S10, Supplementary Figure S9B–9C) demonstrated significant expression of these genes in multiple tissues, including the pituitary gland, hypothalamus, and brain subregions such as cerebral cortex. Further investigation through tissue-specific enrichment analysis and DEG analysis on the 203 unique genes yielded detailed molecular insights, with comprehensive results documented in Supplementary Tables S11–S14 and Supplementary Figures S10–S13.
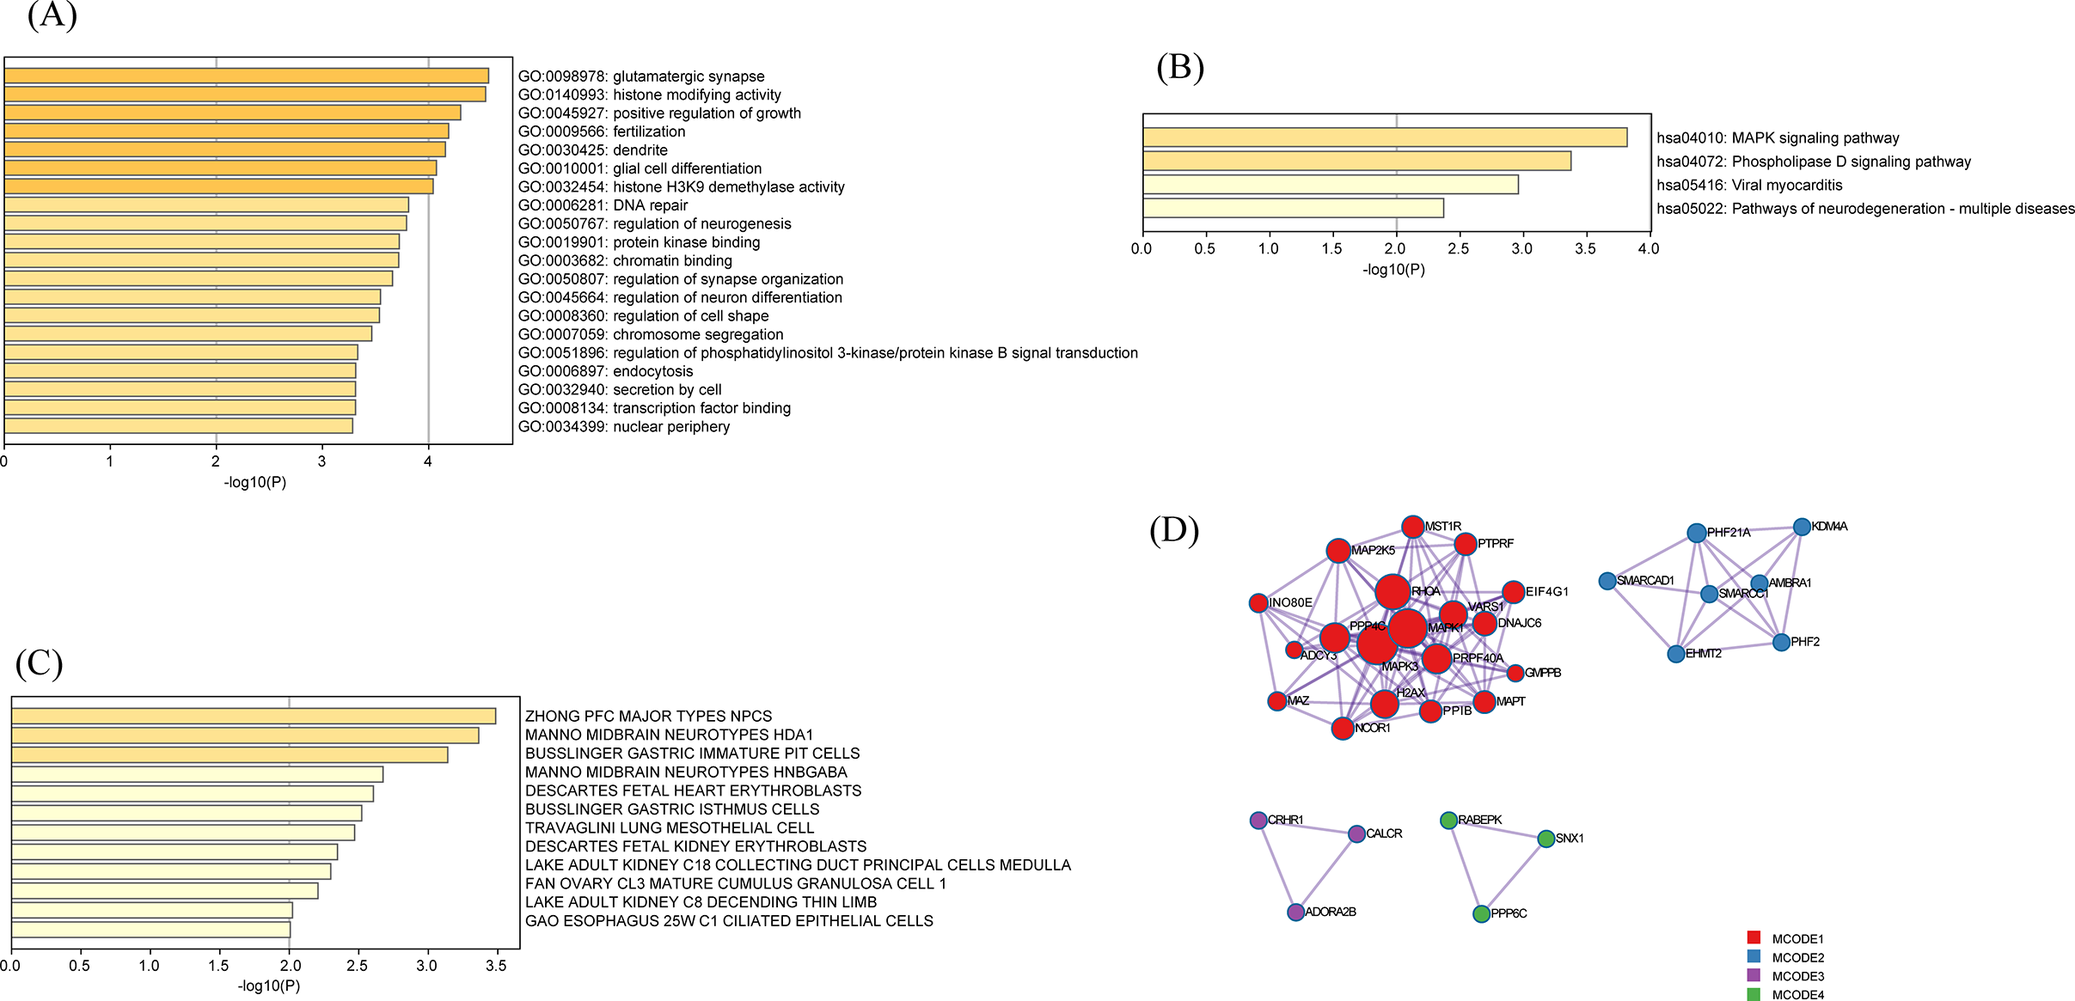
Further enrichment analysis of GO and KEGG terms associated with unique genes revealed their involvement in diverse biological processes, including glutamatergic synapse, histone modifying activity, glial cell differentiation, and receptor signaling pathways such as the mitogen-activated protein kinase (MAPK) signaling pathway (Figure 3A,B). Cell type enrichment analysis demonstrated significant enrichment of these genes in neural cell populations, particularly within the “ZHONG PFC MAJOR TYPES NPCs” (Figure 3C). The PPI analysis identified 32 hub proteins (including MAPK and Lysine Specific Demethylase 4A, KDM4A) that functionally converge on multiple core biological mechanisms, such as stress-responsive signaling through oxytocin/insulin-like growth factor pathways and neuroendocrine regulation mediated by G protein-coupled receptors (Figure 3D, Supplementary Table S15).
Functional enrichment and protein–protein interaction analysis of pleiotropic genes. (A) GO pathway enrichment analysis (B) KEGG pathway enrichment analysis. (C) Cell type enrichment analysis. (D) Protein–protein interaction (PPI) network.
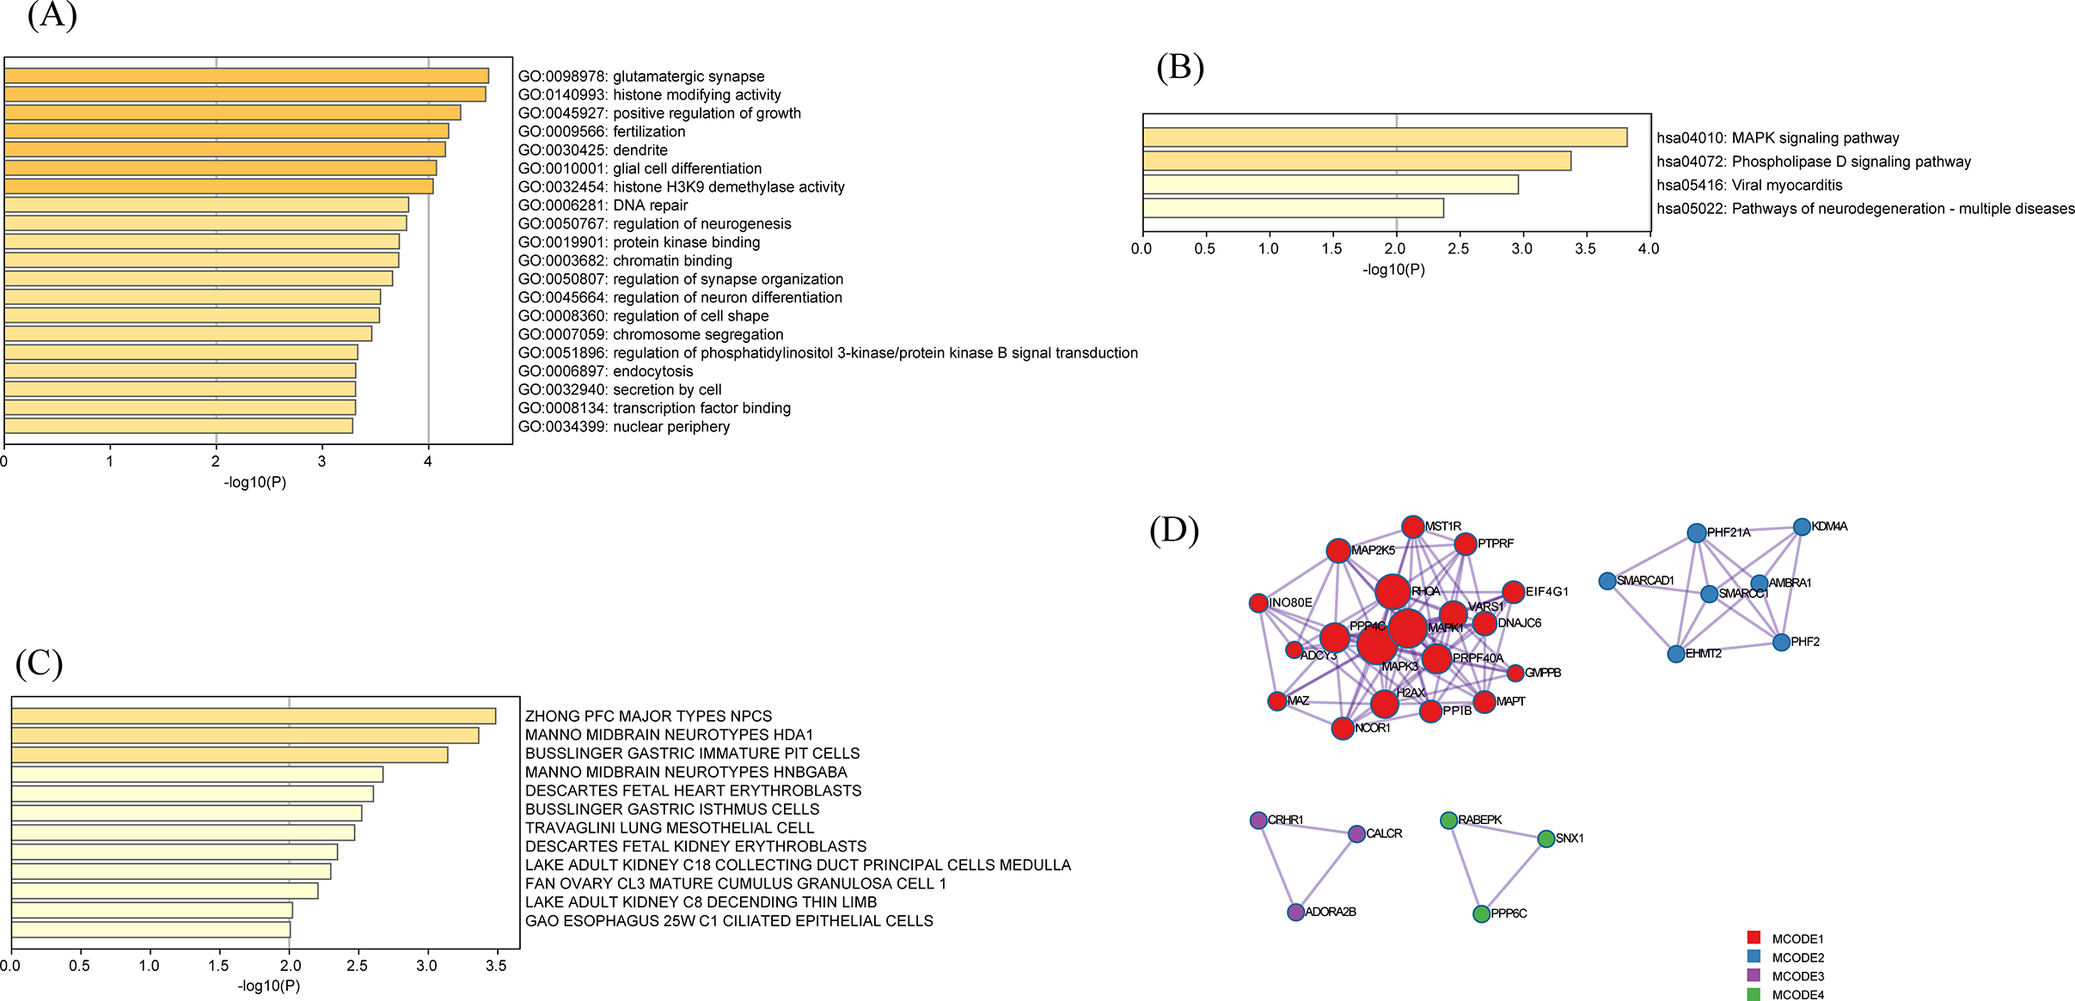
Figure 3 Long description
Panel A, top left, is a horizontal bar chart with x-axis labeled negative log 10 of P and y-axis listing G O terms. The top bars are glutamatergic synapse, histone modifying activity, positive regulation of growth, fertilization, and dentate gyrus development, with values ranging from about 1.5 to 4. Panel B, top right, is a horizontal bar chart with x-axis labeled negative log 10 of P and y-axis listing K E G G pathways. The top bars are M A P K signaling pathway, phospholipase D signaling pathway, viral myocarditis, and pathways of neurodegeneration, with values up to about 3.5. Panel C, bottom left, is a horizontal bar chart with x-axis labeled negative log 10 of P and y-axis listing cell types, including Z H O N G P F C major types N P C S, Manno midbrain neurotypes H D A1, and others, with values up to about 3.5. Panel D, bottom right, is a protein-protein interaction network with nodes colored by M C O D E cluster. The largest cluster, M C O D E 1, is red and centrally located, with dense connections among nodes labeled N O D 2, M A P 2 K 5, P R K F, and others. Smaller clusters in purple, green, and blue are positioned around the main cluster, each with fewer nodes and sparser connections.
Causal relationship between AAM and mental health problems
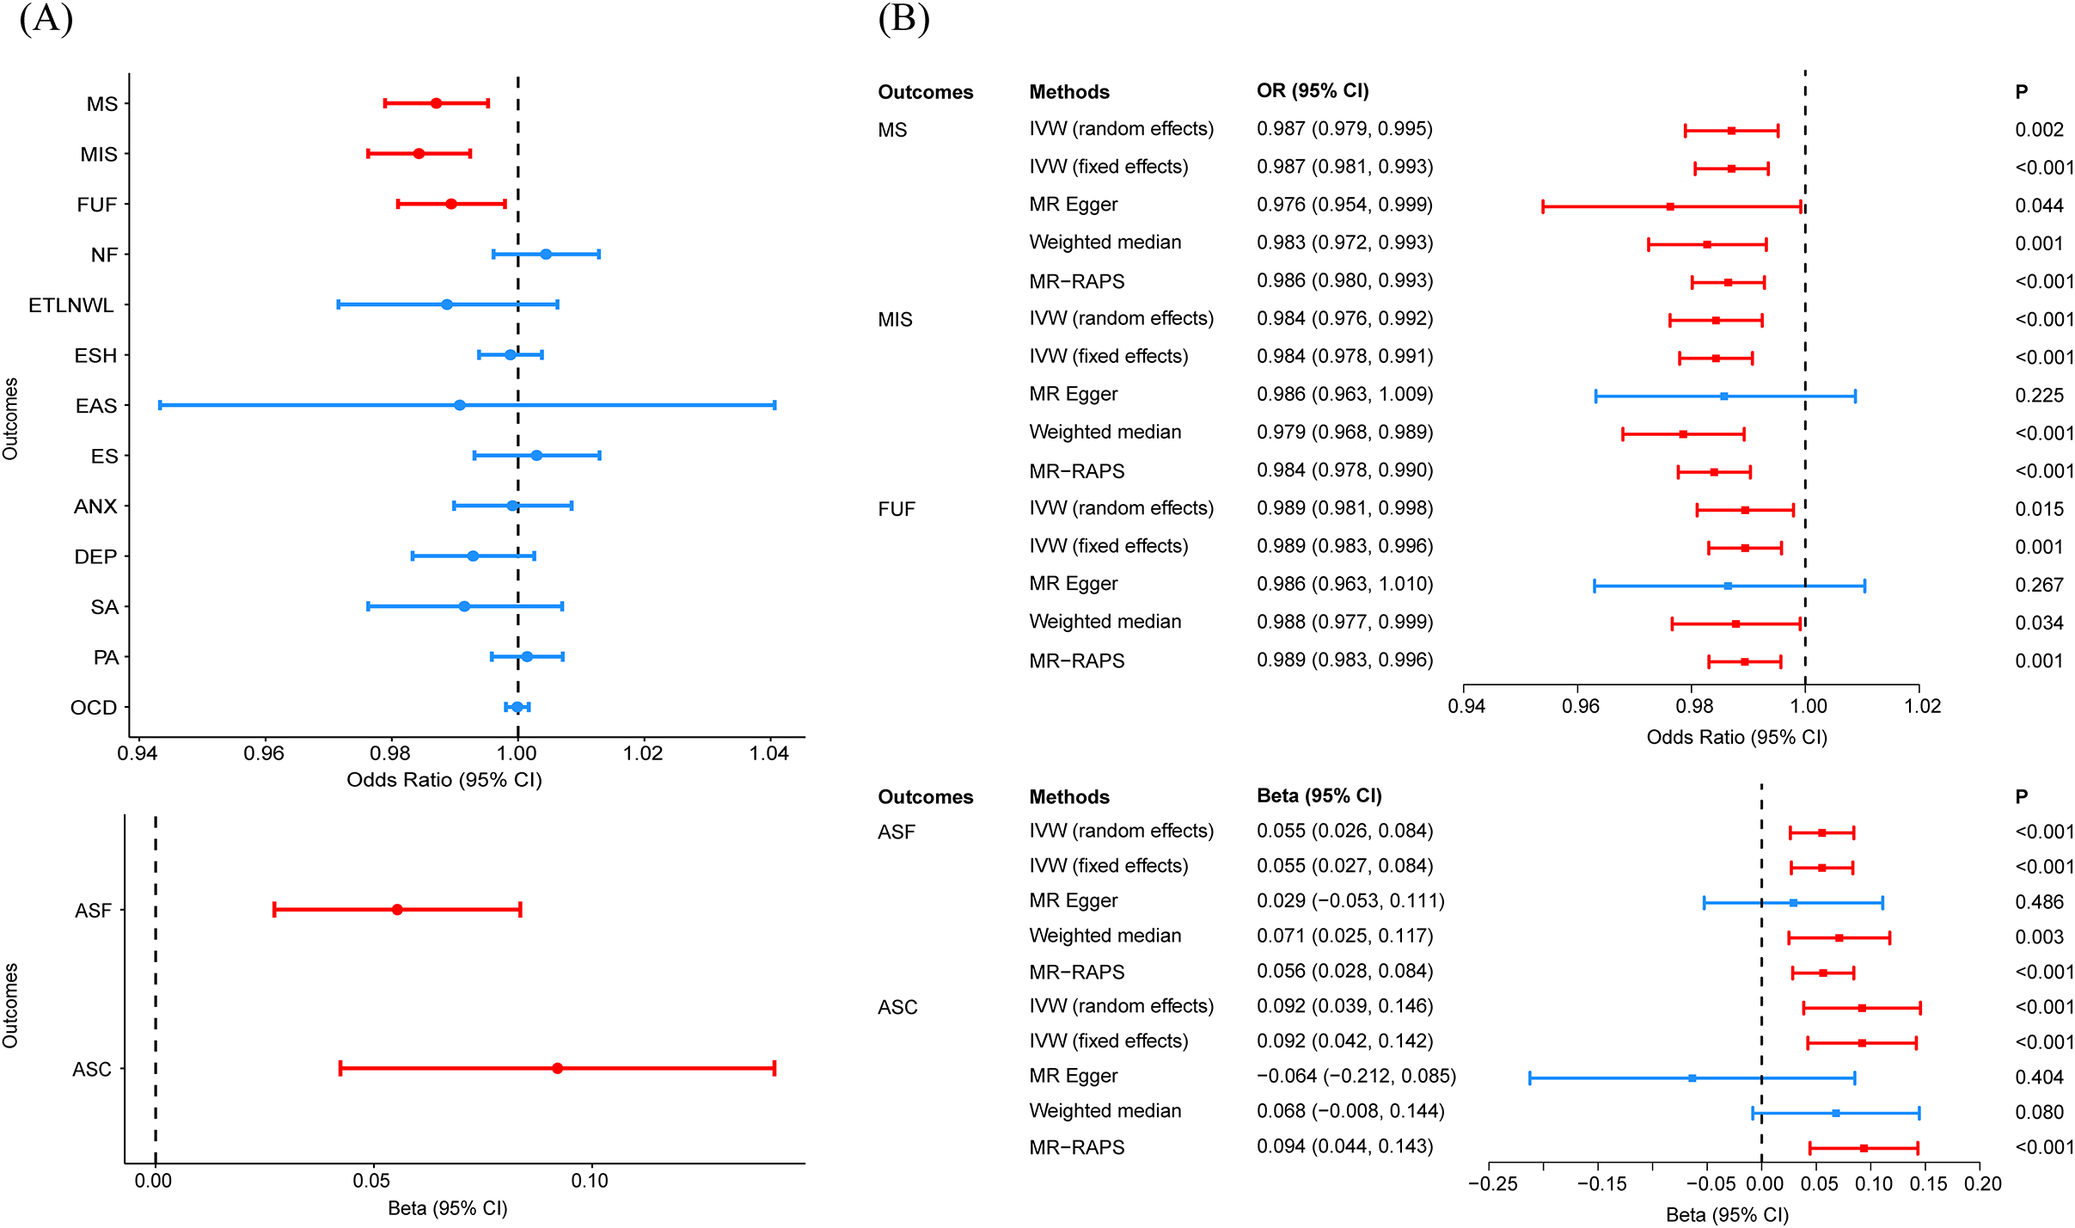
For the forward MR analysis, a total of 198 SNPs were selected as instrumental variables for AAM after LD clumping, with F statistics exceeding 10. Two-sample MR using the IVW method demonstrated that higher AAM was causally associated with decreased risks of MS (OR = 0.987, P = 1.97 × 10⁻³), MIS (OR = 0.984, P = 1.58 × 10⁻⁴), and FUF (OR = 0.989, P = 1.47 × 10⁻²), along with later smoking initiation (ASF: β = 0.055, P = 1.17 × 10⁻⁴; ASC: β = 0.092, P = 2.84 × 10⁻⁴) (Figure 4A). In other words, earlier AAM is associated with higher risks of internalizing symptoms (MS, MIS, and FUF) and externalizing symptoms (ASF and ASC). After FDR correction, all five associations remained statistically significant (PFDR < 0.05). MR-RAPS and weighted median robustly supported these causal estimates (Figure 4B, Supplementary Table S16). MR-PRESSO testing confirmed the absence of influential outliers and robustly validated all significant causal relationships identified in our primary analysis (Supplementary Tables S17–S19). The MRlap analysis accounting for sample overlap consistently supported all significant causal associations identified in our primary analysis (Supplementary Table S20). Leave-one-out analysis demonstrated that no single SNP disproportionately influenced the overall associations (Supplementary Figure S14–S18). Scatter plot and funnel plot were shown in Supplementary Figures S19, S20. All forward MR analyses passed the MR Steiger directionality test (P < 0.05, Supplementary Table S21), supporting the hypothesized causal direction from AAM to mental health outcomes. While reverse MR analyses examining potential effects of mental health traits on AAM revealed no statistically significant associations (Supplementary Tables S22–S25). For these reverse MR analyses, the number of instrumental variables for each mental health phenotype ranged from 6 to 17.
Forest plots of MR results. (A) IVW estimates the causal effects of AAM on 15 mental health-related phenotypes. (B) Multi-method MR estimates the significant trait pairs identified by the IVW method. Note: MR, Mendelian randomization. IVW, inverse variance weighted. MR-RAPS, MR robust adjusted profile score. AAM, age at menarche; MIS, miserableness; FUF, fed-up feelings; NF, nervous feelings; ETLNWL, ever thought that life is not worth living; ESH, ever self-harmed; ES, ever smoker; ASF, age started smoking in former smokers; DEP, depression.
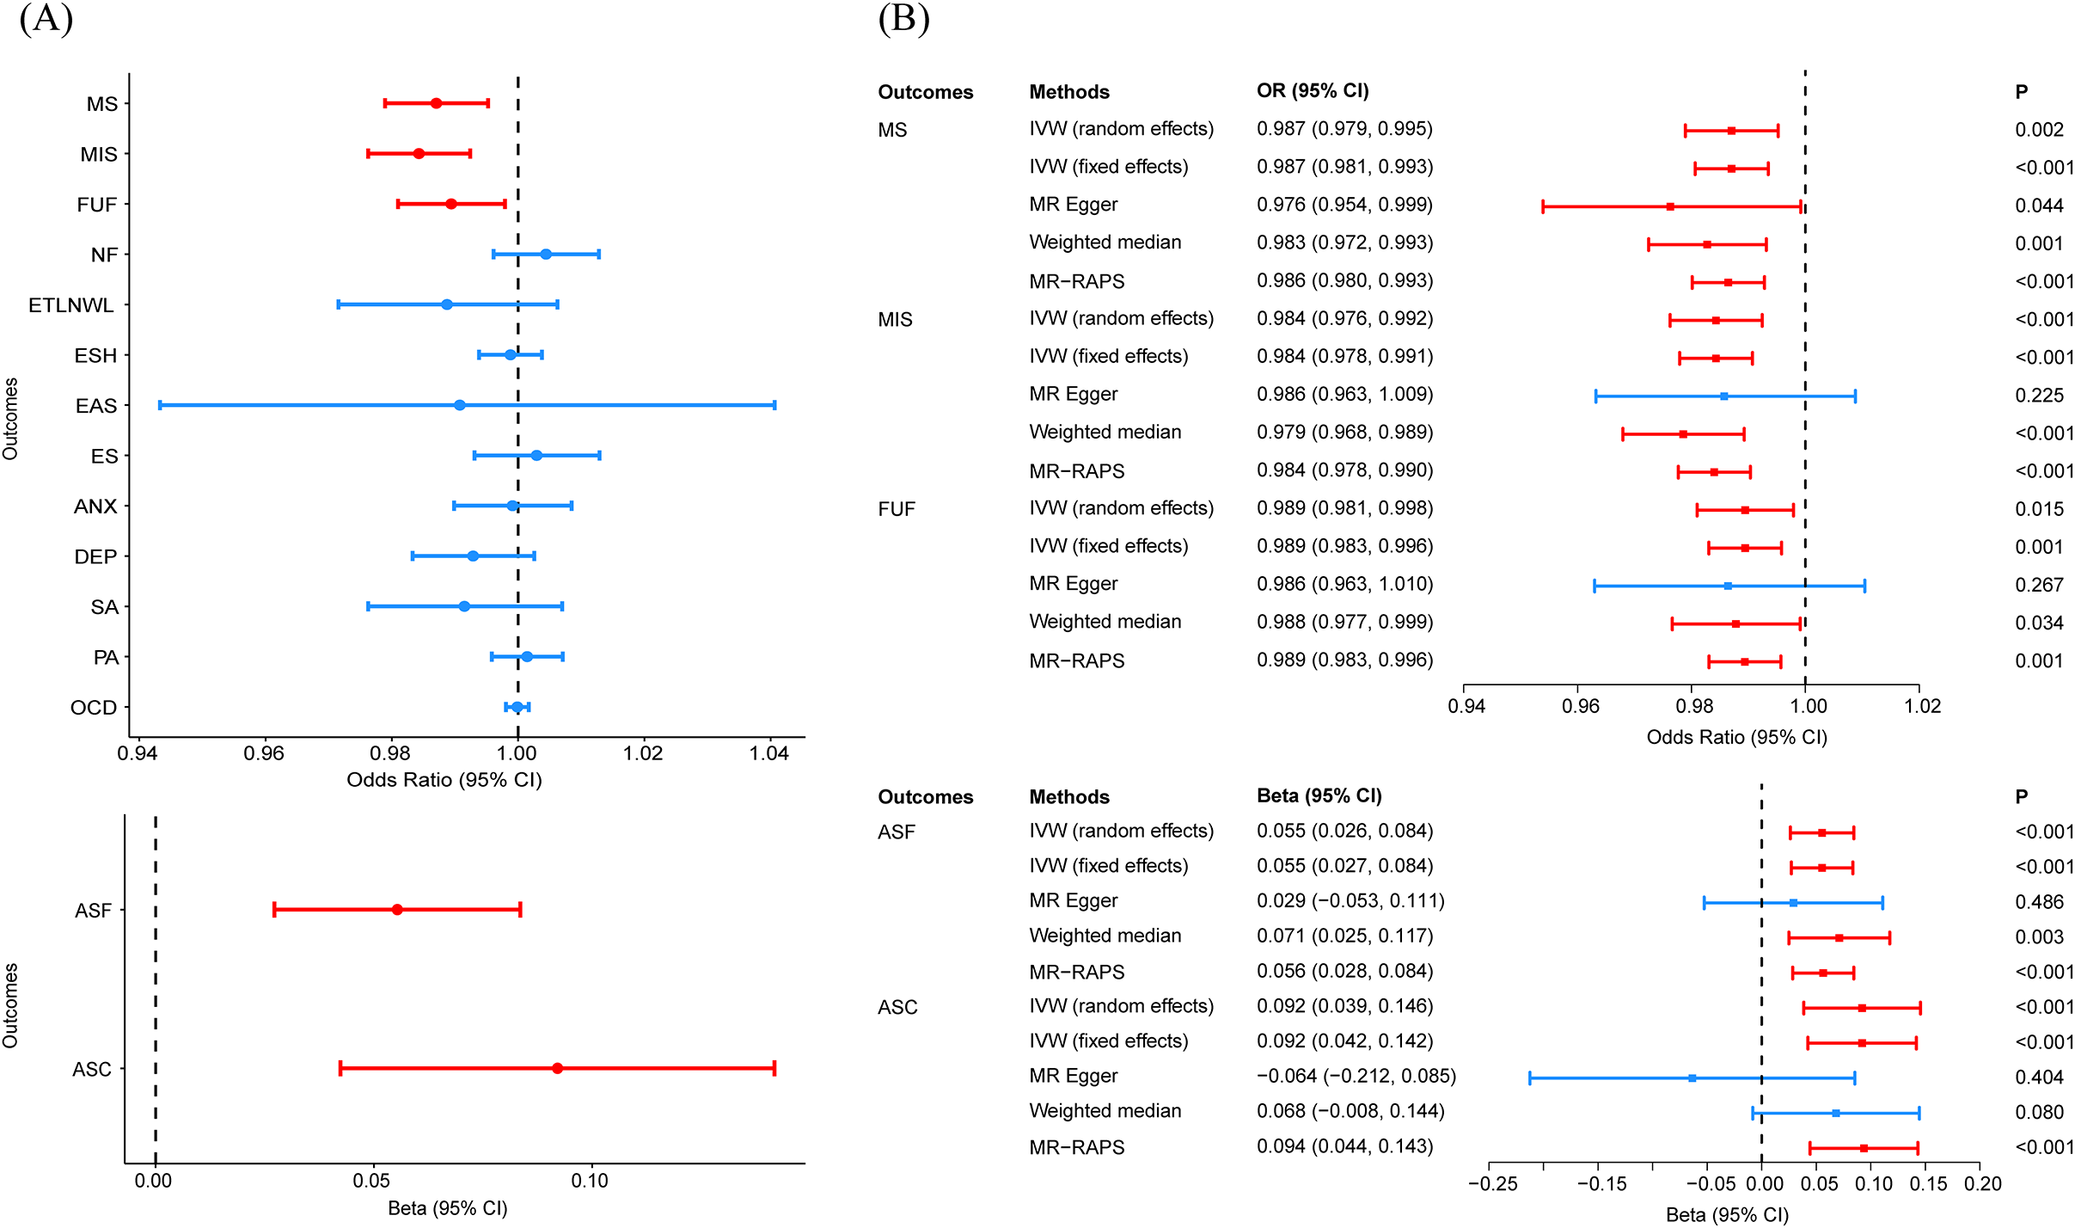
Figure 4 Long description
Panel A on the left presents two forest plots. The upper plot shows odds ratios with 95 percent confidence intervals for outcomes M S, M I S, F U F, N F, E T L N W L, E S H, E A S, E S, A N X, D E P, S A, P A, and O C D, plotted on the y-axis. The x-axis ranges from 0.94 to 1.04 for odds ratios. Red points with error bars indicate significant associations for M S, M I S, and F U F, all left of the reference line at 1.00. Blue points represent non-significant associations. The lower plot in Panel A shows beta values for A S F and A S C, with the x-axis ranging from 0.00 to 0.10. Both outcomes are plotted as red points with error bars, indicating significant associations. Panel B on the right is divided into two sections. The upper section lists outcomes M S, M I S, and F U F on the y-axis, with multiple Mendelian randomization methods (I V W random effects, I V W fixed effects, M R Egger, Weighted median, M R-R A P S) for each. Odds ratios with 95 percent confidence intervals are plotted horizontally, with significant results in red and non-significant in blue. The x-axis ranges from 0.94 to 1.02. The lower section lists outcomes A S F and A S C, with the same methods, and plots beta values with 95 percent confidence intervals. The x-axis ranges from -0.25 to 0.15. Significant associations are shown in red, non-significant in blue. P-values are displayed in the rightmost column for each method and outcome.
Discussion
In this study, comprehensive genetic methodologies were employed to systematically examine the genetic association between AAM and 15 mental health-related phenotypes, utilizing female-specific summary-level GWAS data. Our study revealed extensive genetic correlations between AAM and mental health-related phenotypes. We identified 155 shared genetic loci, 18 colocalized loci and 203 pleiotropic genes, predominantly expressed in brain regions including the hypothalamus and cerebral cortex, and functionally implicated in diverse biological processes (e.g., synaptic plasticity) and signaling pathways (e.g., MAPK). MR analysis demonstrated the causal association of earlier AAM on increased risks of specific mental health-related phenotypes.
Through LDSC analysis, we identified widespread genetic correlations between AAM and multiple mental health-related phenotypes, including MIS, FUF, NF, ETLNWL, ESH, ES, ASF, and DEP. This is the first systematic evidence at the genome-wide level demonstrating shared genetic architecture between AAM and this broad spectrum of mental health-related phenotypes, suggesting that their association may be partially driven by common pleiotropic mechanisms. The strength of LDSC lies in its ability to efficiently estimate overall genetic correlations between traits using summary statistics while effectively controlling for confounding factors such as sample overlap. However, a limitation of LDSC is its inability to pinpoint specific loci. Therefore, to further identify potential variants, we employed the PLACO method to screen at the SNP level and combined it with the FUMA platform for functional annotation.
We identified 155 risk loci with AAM and mental health-related phenotypes. Using colocalization analysis, we further pinpointed 18 loci with a posterior probability of colocalization greater than 0.7, which may simultaneously influence both AAM and mental health-related phenotypes. To explore potential biological mechanisms, we queried the nearest genes of these loci in the GWAS Catalog and identified four genes (LIN28B, ZFHX4, WSCD2, and TNNI3K) that were previously associated with both AAM and mental health problems. The LIN28B gene encodes an RNA-binding protein that regulates the expression of the microRNA let-7 family [Reference Piskounova, Polytarchou, Thornton, LaPierre, Pothoulakis and Hagan36]. Some studies have shown that polymorphisms in LIN28B are associated with AAM and pubertal timing, although the specific underlying mechanisms remain unclear [Reference Ong, Elks, Li, Zhao, Luan and Andersen37–Reference Abreu and Kaiser39]. The let-7 family is a crucial group of microRNAs that are abundantly expressed in the brain and play roles in neurogenesis and synaptic plasticity [Reference Maffioletti, Cattaneo, Rosso, Maina, Maj and Gennarelli40, Reference Chandrasekar and Dreyer41]. Additionally, the let-7 family is implicated in emotional regulation and psychiatric disorders, with its dysregulation potentially linked to mood dysregulation or the development of mental illnesses [Reference Maffioletti, Cattaneo, Rosso, Maina, Maj and Gennarelli40, Reference Bahi and Dreyer42]. Therefore, LIN28B may influence both AAM and the onset of psychiatric disorders by modulating the expression of the let-7 family, thereby establishing a potential biological link between reproductive development and mental health. While other loci may collectively influence female menarche and mental health through diverse molecular pathways, their exact regulatory mechanisms remain incompletely elucidated.
Further enrichment analysis revealed that the 203 identified pleiotropic genes are abundantly expressed in brain regions such as the cerebral cortex, frontal cortex, hypothalamus, and pituitary gland. These regions play pivotal roles in regulating both AAM and emotional processing, suggesting that these genes may exert their effects by modulating biological functions within these critical areas. The biological functions and signaling pathways enriched among these genes provide mechanistic insights into their potential roles. For example, glutamatergic synapses are important excitatory synapses in the nervous system, participating in learning, memory, and synaptic plasticity, and their functional abnormalities are associated with mood disorders/psychiatric diseases [Reference Collingridge and Bliss43–Reference Maeng and Zarate45]. Notably, within the hypothalamus, glutamatergic synapses participate in regulating GnRH expression, a master regulator of pubertal initiation and menarche timing [Reference Naulé, Maione and Kaiser46]. This implies that these pleiotropic genes may influence both menarche age and emotional states through glutamatergic synaptic modulation. Pathway analysis further highlighted significant enrichment in the MAPK signaling pathway. The MAPK pathway is integral to hypothalamic–pituitary-gonadal (HPG) axis function; for example, ERK, a MAPK subfamily member, mediates GnRH-induced signaling in the pituitary, promoting LH and FSH synthesis and secretion [Reference Bliss, Navratil, Xie and Roberson47, Reference Gur, Bonfil, Safarian, Naor and Yaron48]. Concurrently, MAPK pathway activation has been implicated in stress responses and depressive symptoms [Reference Bruchas, Schindler, Shankar, Messinger, Miyatake and Land49], suggesting its dual role in linking reproductive timing and mental health. However, the regulatory mechanisms of menarche age and mental health are complex, involving multiple genes, pathways, and neuroendocrine systems. Future studies should explore tissue-specific gene functions and their interactions to better understand these traits.
Our two-sample MR analysis revealed that genetically predicted earlier AAM is associated with a higher risk of both internalizing symptoms (MS, MIS, FUF) and externalizing symptoms (ASF, ASC), this finding is consistent with previous observational studies [Reference Kowalski, Addo, Kramer, Martorell, Norris and Waford10, Reference Carter, Jaccard, Silverman and Pina50, Reference Mendle, Ryan and McKone51]. Additionally, prior MR study did not identify a causal relationship between AAM and anxiety or obsessive-compulsive disorder, which aligns with our results [Reference Yu, Hou, Wu, Yu, Liu and Wu52]. Notably, several studies have reported that earlier AAM is associated with an increased risk of depression [Reference Hirtz, Hars, Naaresh, Laabs, Antel and Grasemann15, Reference Yu, Hou, Wu, Yu, Liu and Wu52]; however, such an association was not observed in our analysis. This discrepancy may be attributed to the fact that our study exclusively utilized outcome data from female participants, thereby eliminating potential confounding effects from male populations. Future research should be conducted in a larger female sample to validate these findings and further explore the underlying mechanisms.
To the best of our knowledge, this is the first study to systematically evaluate the genetic associations between AAM and various mental health-related phenotypes using a combination of methods. Furthermore, this study utilized female-specific GWAS data for mental health-related phenotypes, effectively avoiding potential biases that could arise from the inclusion of male participants. Our study also has some limitations. First, the summary-level data used in this study are predominantly representative of European populations, which limits the generalizability of the findings to other ethnic groups. Second, certain GWAS datasets included in our analysis were characterized by limited sample sizes, potentially constraining the statistical power and precision of our findings. Third, for certain phenotypes with low heritability estimates, the observed genetic associations may explain only a modest proportion of phenotypic variance, as our analysis focused primarily on genetic factors without accounting for potential environmental influences or gene–environment interactions. Fourth, while MAGMA accounts for LD structure through its SNP-gene annotation framework, it may still annotate multiple genes to a single risk locus, particularly in gene-dense regions. This could introduce some noise into the candidate gene list. However, our gene set selection was based on PLACO results, which inherently focus on regions with cross-trait association signals. Moreover, the subsequent enrichment analyses were conducted at the pathway and tissue levels, where the inclusion of a limited number of non-causal genes is less likely to drive overall results. Fifth, while two-sample MR analysis can mitigate confounding bias, it remains susceptible to horizontal pleiotropy, where genetic variants may influence the outcome through pathways independent of the exposure. To address this, we employed multiple analyses, including MR-Egger, MR-RAPS, and MR-PRESSO. Nevertheless, it is plausible that the neuroendocrine and brain changes accompanying pubertal development may serve as the true causal mediators linking AAM to mental health outcomes. Consequently, AAM may function as an important early marker rather than a direct causal risk factor. MR findings should be interpreted with caution. Further research with larger-scale datasets is needed to validate and enhance the robustness of the results.
Conclusions
Our study revealed extensive genetic associations between AAM and mental health-related phenotypes, and further explored the potential causal relationships between them. These findings provide novel insights into the shared genetic mechanisms linking AAM and mental health-related phenotypes, while establishing a framework for future investigations into the neuroendocrine pathways mediating these associations.
Supplementary material
The supplementary material for this article can be found at http://doi.org/10.1192/j.eurpsy.2026.12214.
Data availability statement
The GWAS summary-level data used in this study are available in the UK Biobank (http://www.nealelab.is/uk-biobank/) and the IEU Open GWAS (https://gwas.mrcieu.ac.uk/).
Acknowledgments
We acknowledge all participants and researchers who contributed to or processed the GWAS data.
Author contribution
Y.C. performed study design, data acquisition, data analysis, and draft the manuscript. Z.L., S.H., X.L., W.J., W.G. contributed to data acquisition, data analysis and editing the manuscript. P.X., H.M., S.L. reviewed and edited the manuscript.
Financial support
This study received financial support from the National Natural Science Foundation of China (82173534) and the Startup Fund of Shanghai Municipal Hospital of Traditional Chinese Medicine [2025-YJRC-002].
Competing interest
The authors declare none.


 Open access


Comments
No Comments have been published for this article.